

Involuntary psychiatric hospital admissions generally occur when an individual with mental illness is admitted to hospital against their will owing to a perceived imminent danger to the individual or others and unwillingness to remain in hospital voluntarily. These admissions are not desirable, because they can be disruptive to the patient–provider relationship and have a negative impact on the patient's perception of their care at the time of the admission and afterwards.Reference Newton-Howes 1 – Reference Priebe, Katsakou, Glöckner, Dembinskas, Fiorillo and Karastergiou 3 Although there is variability across jurisdictions, involuntary admissions are common and increasing in high-income countries, including several European countries such as the UK,Reference Keown, Mercer and Scott 4 , Reference Priebe, Badesconyi, Fioritti, Hansson, Kilian and Torres-Gonzales 5 The NetherlandsReference Priebe, Badesconyi, Fioritti, Hansson, Kilian and Torres-Gonzales 5 , Reference CL, Uitenbroek, Broer, Lendemeijer, van Veldhuizen and van Tilburg 6 and Germany.Reference Priebe, Badesconyi, Fioritti, Hansson, Kilian and Torres-Gonzales 5 There are few studies investigating trends in involuntary admissions over time in other jurisdictions.
Involuntary admission to hospital may, to some extent, be an avoidable event if care provided in community settings mitigates psychiatric crises that precipitate involuntary admissions. Studies mostly from Europe have shown that, in addition to these service-related factors, risk factors for involuntary admissions include patient sociodemographic characteristics such as being an immigrant or ethnic minority, and clinical severity variables such as a diagnosis of a psychotic disorder.Reference Morgan, Mallett, Hutchinson, Bagalkote, Morgan and Fearon 7 – Reference Davies, Thornicroft, Leese, Higgingbotham and Phelan 11 Studies from other jurisdictions are largely from the USA and emphasise the importance of available mental health resources.Reference Segal, Laurie and Segal 12 , Reference McGarvey, Leon-Verdin, Wanchek and Bonnie 13 In Canada, the most recent country-wide prevalence estimate of involuntary admissions (25%) was in the late 1970s.Reference Riley and Richman 14 One recent study among 200 patients with first-episode psychosis at four sites in Ontario had a prevalence of involuntary admissions of 68.6%,Reference Archie, Akhtar-Danesh, Norman, Malla, Roy and Zipursky 15 suggesting a large increase in prevalence. However, no recent population-based Canadian study has examined prevalence of involuntary admissions among all patients.Reference Bagby 16 , Reference Bagby, Silverman, Ryan and Dickens 17 Furthermore, existing Canadian studies have examined only a very limited set of characteristics of involuntarily admitted patients.Reference Malla, Norman and Helmes 18 – Reference Tremblay, King and Baines 21 This is consistent with many international studies, which are often small in size, based on one or a few sites, and examine only a limited number of risk factors. The aims of this study were to determine the trends in prevalence of involuntary admissions in a large population-based North American sample covering the whole Province of Ontario, Canada (population ~14 million), and to examine the independent risk factors that predict involuntary admission status in this jurisdiction.
Methods
Study design, setting, and participants
We examined the prevalence and risk factors of involuntary admissions among all patients admitted to mental health and addictions (MHA) beds in Ontario, Canada. Annual prevalence was examined from fiscal year (April 1 to March 31) 2009 to 2013, and risk factors for involuntary admission were examined for all years pooled. The index date was defined as the admission date, and risk factors were measured at or up to 5 years prior to index.
We included adults aged 16–105 years at index admission date who were Ontario residents with valid health card numbers, owing to the requirement to link across databases. We excluded any informal (decision to admit was made by a substitute decision maker) and forensic admissions, as these patients are ineligible for voluntary or involuntary admissions. We excluded any patients without a linked emergency department record immediately preceding the admission date, given that elective admissions are a different population and a number of previous studies have taken place in the psychiatric emergency department. For individuals with more than one admission to hospital during the study period, we included one random admission. We also excluded individuals without healthcare eligibility at 1 year prior to index, given that a number of risk factors were measured in the year prior to admission.
Data sources
We used the Ontario Mental Health Reporting System (OMHRS) to identify our study population of patients who had been admitted to a mental health bed. The OMHRS database uses the Resident Assessment Instrument – Mental Health (RAI-MH), a standardised assessment instrument that captures a number of sociodemographic characteristics, diagnoses according to the DSM-IV and clinical assessments.
To ascertain sociodemographic information and other patient-level factors and service use, we linked the OMHRS database to other administrative health databases at the Institute for Clinical Evaluative Sciences, including the Canadian Institute for Health Information (CIHI) hospital Discharge Abstract Database (DAD), the Ontario Health Insurance Program (OHIP) physician claims database, the National Ambulatory Care Reporting System (NACRS) emergency department database, the Registered Persons Database (RPDB) and the Immigration Refugees and Citizenship Canada Permanent Resident (IRCC-PR) database.
Involuntary admissions
Involuntary admissions are defined within OMHRS as a patient status of either Form 1 or Form 3 at admission. Involuntary admissions in Ontario in most cases begin in the emergency department, where a physician will complete an Application for Psychiatric Assessment (‘Form 1’); this is an involuntary hold that allows the patient to be detained and examined for up to 72 h in a psychiatric hospital. 22 In some cases, a Form 3 is subsequently completed to involuntarily admit the patient for up to 2 weeks. The Form 3 is completed by a psychiatrist, who must be a different physician than the physician who completed the Form 1.
Predictors of involuntary admissions
Sociodemographic variables
Patient sociodemographic characteristics included age (16–24, 25–44, 45–64, 65+), gender, area-level income quintiles identified with the use of the RPDB, housing status (homeless/private/non-private) identified within OMHRS, and immigration status identified within the IRCC-PR and categorised as immigrant or long-term resident (including non-immigrants or immigrants migrating prior to 1985).
Prior mental health service use
Past service use included whether they had had a mental health admission, mental health emergency department visit, psychiatrist visit, or a mental healthReference Steele, Glazier, Lin and Evans 23 or non-mental health family physician visit within the past year (definitions are listed in supplementary Table 1; available at https://doi.org/10.1192/bjo.2017.4). In addition, we examined whether they had any involuntary records within the past 5 years, including admissions or physician billings for involuntary assessments.
Pathway to care variables
The pathway to care was defined as care received or contacts acquired during the week prior to and including the day of the emergency department visit. This included contact with police, out-patient visits to a psychiatrist, and mental health and non-mental health out-patient visits to family physicians. Physician visits were identified in the OHIP database, and mental health visits to family physicians was identified with a validated algorithm.Reference Steele, Glazier, Lin and Evans 23 We also examined whether the patient arrived at the emergency department via ambulance or had a transfer from a medical bed prior to admission to the mental health bed.
Clinical variables
We included several clinical measures of patient severity. We assessed the primary diagnoses, which included schizophrenia or psychosis, mood disorders, anxiety disorders, dementia and all other psychiatric diagnoses. We examined whether they had any indication of a substance misuse disorder or a personality disorder. We identified emergency department visits that had indication of self-harm. Specific codes for each diagnosis are listed in supplementary Table 1. Triage status was measured on a five-point scale and combined into low (suicidal/depressed or other milder psychiatric complaints and not agitated), medium (acute psychosis and/or suicidal) and high triage (patients experiencing acute psychosis/extreme agitation).Reference Atzema, Schull, Kurdyak, Menezes, Wilton and Vermuelen 24 We also included whether they had any comorbidities included in the Charlson comorbidity index as assessed in the year prior to admission.
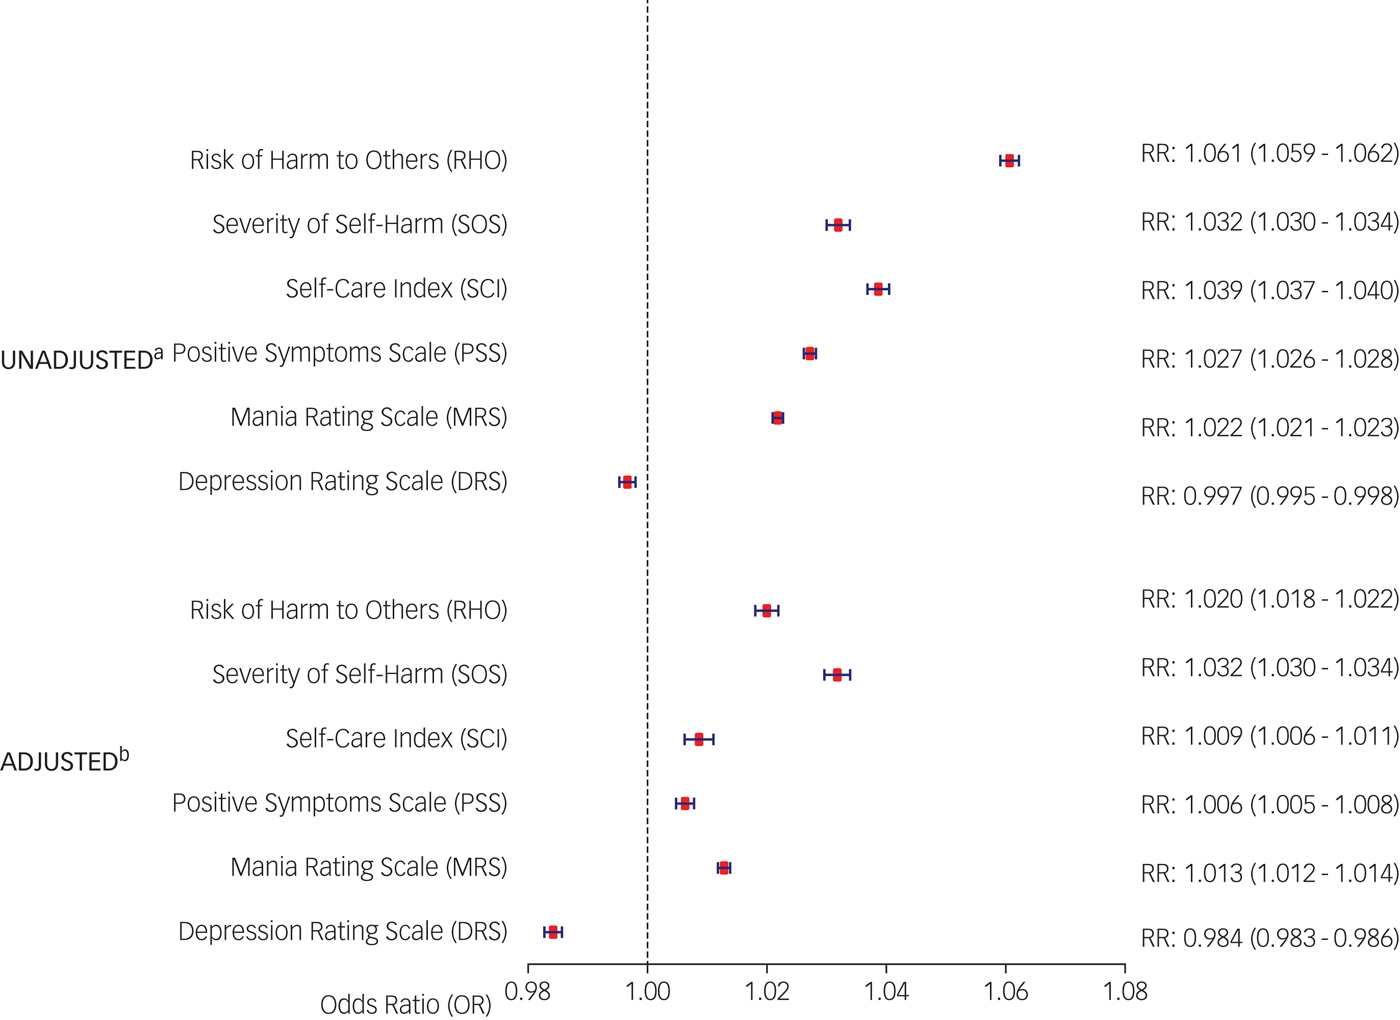
We also examined a number of InterRAI rating scales at admission, including the Severity of Self-Harm (SOS), Risk of Harm to Others (RHO) and Self-Care Index (SCI), which are all directly related to the criteria for involuntary admissions and included three symptom scales, the Positive Symptoms Scale (PSS), Mania Rating Scale (MRS) and Depression Rating Scale (DRS). 25 The SOS, RHO and SCI are each based on predictive risk algorithms with combinations of inputs based on individual symptoms, past behaviour, or other symptom scales. 25 Each of the PSS, MRS and DRS were based on items assessing the frequency of symptoms in the past 3 days as: 0 (not exhibited in past 3 days), 1 (not exhibited in the past 3 days but reported to be present), 2 (exhibited on 1–2 of the past 3 days), or 3 (exhibited daily). Each scale aggregated items to different numbers of points based on the number of symptoms and the points assigned to each frequency of occurrence. The range and list of symptoms included in the calculation of each scale is shown in supplementary Table 2.
Statistical methods
We examined the prevalence of involuntary admissions overall and by year. We assessed the trend over time by fitting a linear time trend across the 5-year study period using a modified Poisson regression.
We estimated the prevalence of each risk factor for both voluntary and involuntary patients. We used a modified Poisson regression to determine the unadjusted and multivariable adjusted association between each risk factor and involuntary admissions. All variables were included in the multivariable model regardless of significance. Patients with missing data were excluded from analyses, except for individuals with missing income. All analyses were conducted in SAS Enterprise Guide 6.1.
Ethics committee approval
Ethics approval for this study was obtained from the Research Ethics Board at Sunnybrook Health Sciences Centre in Toronto, Ontario.
Results
A total of 250 773 admissions were identified between fiscal years 2009–2013 among adults living in Ontario with valid health card numbers. We excluded informal or forensic admissions (n = 7214), individuals who had voluntary admissions that subsequently were coded as involuntary (N = 676), individuals without eligibility for healthcare a year prior to index (N = 2831), and individuals who lacked linked emergency department records (n = 39 589). Of the remaining 200 463 admissions, we kept one random admission per individual (N = 84 948 admissions excluded), which resulted in a final sample size of 115 515 patients admitted to hospital.
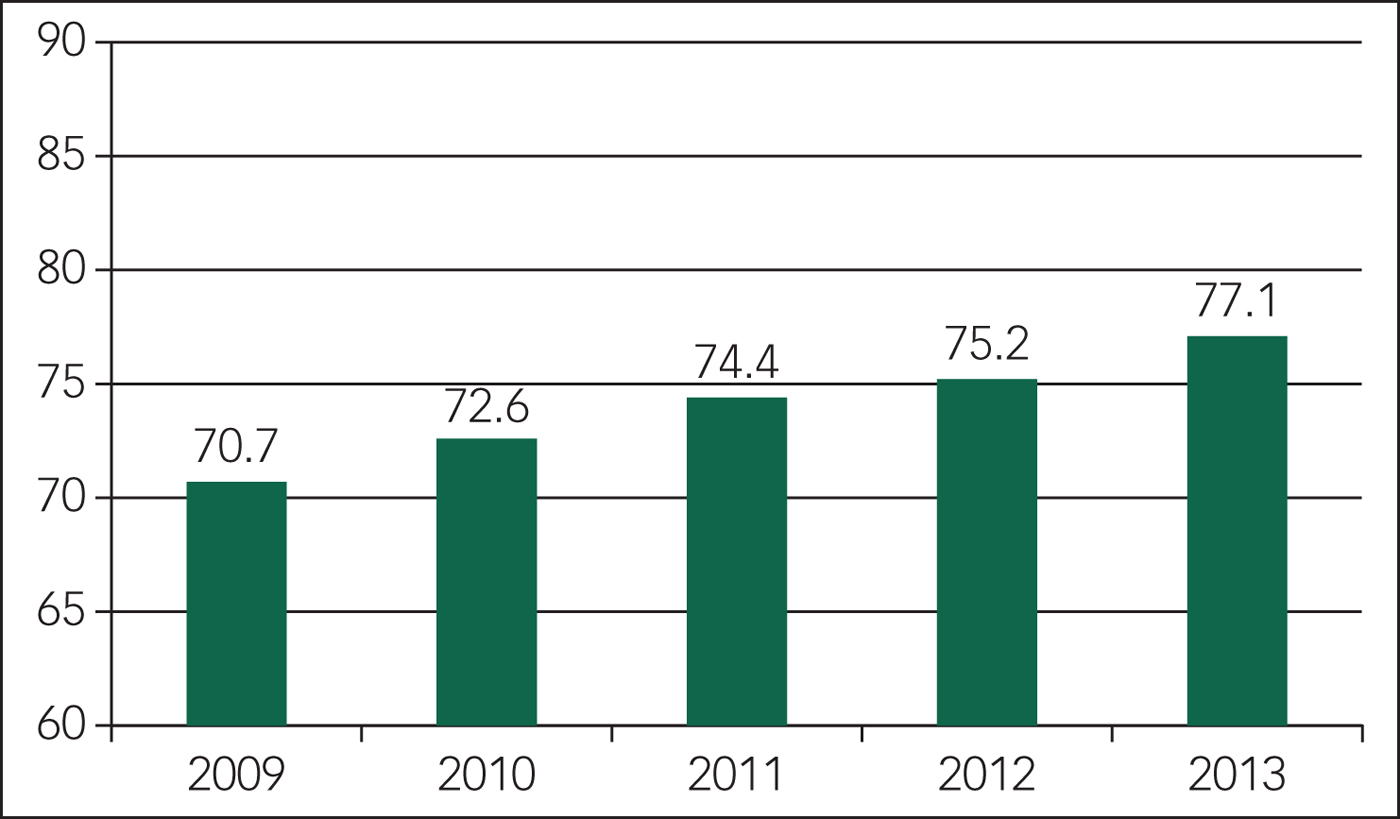
Among the 115 515 individuals who met inclusion criteria, 85 607 (74.1%) were involuntarily admitted. The prevalence of involuntary admissions significantly increased from 70.7% in 2009 to 77.1% in 2013 (RR = 1.021 per year, 95% CI 1.019–1.023; P < 0.0001) (Fig. 1). 28 726 (33.6%) of individuals who were involuntarily admitted were released within 72 h of admission. Additional descriptive characteristics for patients by involuntary status are shown in Table 1.
Trends over time in the prevalence of involuntary admissions within Ontario, Canada.
Descriptive characteristics for patients who are involuntary or voluntary at admission
LOS, Length of Stay.
Sociodemographic, utilisation, pathway to care and severity characteristics are summarised by involuntary status in Table 2, along with unadjusted and adjusted associations from modified Poisson regression. Most variables were complete, except for 645 individuals missing triage status, 764 individuals with missing income and 8458 individuals missing SOS and SCI.
Breakdown of patient characteristics by involuntary status, and unadjusted and multivariable logistic regression of association between each characteristics and involuntary status
RR, risk ratio; MHA, Mental Health and Addictions; ED, Emergency Department.
a. InterRAI scales are presented as means.
b. Multivariable model includes InterRAI clinical rating scales, but results are shown in Fig. 2.
Almost all variables were associated with involuntary admission to hospital in unadjusted analyses (Table 2). The strongest factors associated with increased likelihood for involuntary admission were past week police contact (RR = 1.36, 95% CI 1.36–1.37) and severity variables including high-acuity triage status (RR = 1.55, 95% CI 1.51–1.58) and medium triage status (RR = 1.30, 95% CI 1.27–1.33) v. low acuity, self-harm identified in the emergency department contact preceding the admission (RR = 1.17, 95% CI 1.16–1.18). Not having a psychotic disorder (RR = 0.83–0.93, depending on the diagnosis) and having a mental health visit in the week preceding admission with either a family physician (RR = 0.89, 95% CI 0.88–0.89) or a psychiatrist (RR = 0.94, 95% CI 0.93–0.95) were protective. These relationships were all maintained, although slightly attenuated, in the adjusted models (Table 2). Several other variables were also significantly associated with involuntary admission in the adjusted models. Notably, younger age (16–24) (RR = 1.10, 95 CI 1.08–1.12), immigrant status (RR = 1.07, 95% CI 1.06–1.08) and previous involuntary assessments/admissions (RR = 1.09, 95% CI 1.08–1.10) all increased the likelihood of involuntary admission. Meanwhile, past year mental health visits to psychiatrists (RR = 0.94, 95% CI 0.93–0.95) were associated with a reduced likelihood of involuntary admissions. After adjusting for other variables, there was no association between any level of income and likelihood of involuntary admission, and a minimal increased likelihood among males (RR = 1.02, 95% CI 1.01–1.02).
The unadjusted and adjusted associations between six clinical rating scales are shown in Fig. 2. Higher scores on all scales were associated with an increased risk of involuntary admission, except for the DRS, where higher scores were associated with a decreased risk of involuntary admission.
Forest plot of unadjusted and fully adjusted associations between clinical rating scales and involuntary admissions (all included continuously).
Discussion
In this large population-based study, we found a very high prevalence of involuntary psychiatric admissions – almost three-quarters of all hospital admissions. The prevalence has increased steadily over the years between 2009 and 2013, from 70.7 to 77.1%. There were also significant risk factors for involuntary admission to hospital among sociodemographic, past service utilisation, pathway to care, and clinical severity characteristics. The sociodemographic factors included immigration status and young age, both of which increased involuntary admissions. Mental health service utilisation in the prior year was also a strong predictor, with physician contact reducing the likelihood of involuntary admission. Police contacts in the week prior to admission, a pathway to care variable, and a number of severity variables including triage status, self-harm and psychosis were also risk factors increasing the likelihood of involuntary admissions.
Given previous Ontario estimates of 11–12% in the late 1970sReference Riley and Richman 14 , Reference Martin and Cheung 26 and 19.3% in 1983,Reference Bagby 16 , Reference Bagby, Silverman, Ryan and Dickens 17 our results show that there has been a dramatic four-fold increase in the prevalence of involuntary admissions, such that three out of four psychiatric admissions to hospital start as involuntary. Although the prevalence of involuntary admissions has increased, current patients likely spend much less time being detained involuntarily relative to patients who were involuntarily admitted prior to 1978. Prior to 1978, patients were admitted involuntarily for up to 1 month, while fewer than half of current patients with involuntary status spend more than 3 days with involuntary status, with 33.6% being released and 17.1% transferred to voluntary status by day 3. Therefore, these results suggest that there is a much greater prevalence of exposure to involuntary conditions, but for shorter periods of time. Although involuntary admissions may help prevent suicide and homicide among those at high risk, they represent a significant reduction in patient autonomy and are often considered unjustified by patients.Reference Priebe, Katsakou, Glöckner, Dembinskas, Fiorillo and Karastergiou 3 Further research is needed on the impacts of short-term involuntary admissions.
Three factors in Ontario have likely contributed to the rising involuntary admission prevalence that we have observed over time. First, involuntary admissions became a two-step process in 1978: an initial assessment period lasting up to 120 h (a ‘Form 1’) and a subsequent involuntary hospital stay lasting, initially, for up to 2 weeks.Reference Czukar and O'Brien 27 The 120 h period was further shortened to 72 h in 1986, and the wide application of the brief, 72-h assessment period likely explains the high prevalence of relatively short duration involuntary admissions we have observed. Indeed, if we remove the approximately 50% of involuntarily admitted individuals who are either released or made voluntary after 72 h, the prevalence of prolonged involuntary hospital stays is closer to the reported prevalence in the 1970s. Therefore, the revision of legislation permitting an involuntary assessment for up to 72 h appears to have had a very significant impact on the process of admission to hospitals. Second, there has been a dramatic reduction in the number of psychiatric hospital beds per capita in Ontario. Psychiatric beds in Ontario dropped from 219 to 81 per 100 000 population from 1965 to 1980,Reference Hartford, Schrecker, Wiktorowicz, Hoch and Sharp 28 and further dropped to 34.2 per 100 000 population in 2015, 29 a decline of 84.4% over the 50-year period. The reduction in the number of hospital beds may have resulted in the remaining beds being preferentially deployed for the most severely ill presentations, which would be highly correlated with the need for involuntary admission. Bed reductions have been associated with increasing risk of involuntary admissions in England.Reference Keown, Weich, Bhui and Scott 30
Lastly, a consequence of deinstitutionalisation has been the rapid rise in interactions between people with severe mental illness and the police across the developed world.Reference Lamb, Weinberger and DeCuir 31 From 1997 to 2013, there was a 17-fold increase in the number of police Mental Health Act apprehensions in Toronto, Ontario's largest urban centre, from 520 to 8441. 32 Police Mental Health Act apprehensions also rose across the province, with a 35% increase between 2003/4 and 2007. 33 Given that one of the strongest risk factors was police contact in the week prior to admissions, these striking increases in police Mental Health Act apprehensions are likely responsible in part for the high prevalence of involuntary admissions found in this study. Amsterdam has seen similar trends, with large increases in police referrals to psychiatric emergency services accompanied by large increases in the proportion of admissions that are involuntary.Reference van der Post, Dekker, Jonkers, Beekman, Mulder and de Haan 34
Strengths and limitations
This study represents one of the largest and most comprehensive examinations of involuntary admissions to date. The OMHRS database collects a large number of different sociodemographic and clinical characteristics through the use of a standardised assessment tool (RAI-MH). Many of these clinical characteristics were taken into consideration by the six clinical rating scales included in the study (supplementary Table 2). Furthermore, the ability to link with other administrative databases enabled an extensive examination of risk factors for involuntary admissions, including utilisation of different types of healthcare and immigration status. Lastly, the generalisability of the findings is enhanced by the use of a population-based sample that collected data across all Ontario psychiatric beds from over 60 hospitals.
This study is not without limitations. First, although the OMHRS database collects data for all admissions to MHA beds, approximately 20% of MHA admissions are to non-MHA beds captured in the DAD and were not included, as the RAI-MH is not implemented in medical beds and most variables would be missing. Second, the exact pathway to care is not known; we used care received or contacts within the week prior to admission as proxies. Third, the symptom scales were recorded on the third day of the admission, reflecting the first 3 days, which may have attenuated their associations with involuntary admissions. However, symptoms likely only changed minimally over the course of 3 days, and having the rating scales completed 3 days after admission assures that the assessment of symptoms was not completed by the same individual who made the admission decision.
International comparison of prevalence
Reviews of mostly European countries, covering the period 1971–2000, found that the prevalence ranged from a low of 1.0% in Spain to a high of 93% in some hospitals in Switzerland, with all other estimates less than 50%.Reference Riecher-Rossler and Rossler 35 , Reference Salize and Dressing 36 Therefore, the prevalence found in our study is among the highest reported prevalences for a Western country. This considerable variation in prevalence across countries likely reflects variation in data collection and definitions,Reference Salize and Dressing 36 laws,Reference Salize and Dressing 36 psychiatric resources,Reference Priebe, Badesconyi, Fioritti, Hansson, Kilian and Torres-Gonzales 5 , Reference Mundt, Frančišković, Gurovich, Heinz, Ignatyev and Ismayilov 37 cultures,Reference Bola, Park and Kim 38 , Reference Zhou, Xiang, Zhu, Liang, Li and Yi 39 and societal and physician attitudes towards involuntary admissions.Reference Steinert, Lepping, Baranyai, Hoffmann and Leherr 40 A key contributing factor to the high prevalence in Ontario may be the low supply of psychiatric beds compared with both WesternReference Priebe, Badesconyi, Fioritti, Hansson, Kilian and Torres-Gonzales 5 and Eastern European countries.Reference Mundt, Frančišković, Gurovich, Heinz, Ignatyev and Ismayilov 37
Studies from East Asian countries have found even higher prevalence of involuntary admissions than found in Ontario, with one study in Korea finding a prevalence of 91%.Reference Bola, Park and Kim 38 In China, the prevalence is similarly high, with one study reporting that 42% of admissions to hospital were involuntary and 30% were partly voluntary.Reference Zhou, Xiang, Zhu, Liang, Li and Yi 39 In both countries, this is potentially due to a more collectivist culture in which a family member is the deciding authority on the involuntary admission instead of the patient.Reference Zhou, Xiang, Zhu, Liang, Li and Yi 39 However, this is not uniform across the Asian continent, with one of the lowest reported prevalences of 4.0% found in Taiwan.Reference Wang, Chiu, Yang, Liu, Wu and Chou 41 This is likely due to the strict criteria for involuntary admissions that only allow involuntary admissions of patients with psychosis and also requires non-compliance with treatment and dangerousness, and, although families are often involved, the patient still has to provide consent themselves.Reference Wang, Chiu, Yang, Liu, Wu and Chou 41
International comparison of risk factors and implications
We examined risk factors among an admitted cohort of patients, which allowed us to isolate which factors are specifically associated with involuntary status and not incorporated into the association factors that are associated with the decision to admit the patient or the decision to visit an emergency department. We found that youth aged 16–24 years were at a higher likelihood of involuntary admissions, regardless of control for other risk factors. This is not surprising, given the higher onset and burden of mental health conditions in this age group, and consistent access issues with long wait lists to receive care during a time of transition from youth to adult mental health services.Reference Gandy 42 Previous research on the role of age is conflicting, with studies showing increased likelihood with younger ageReference Davies, Thornicroft, Leese, Higgingbotham and Phelan 11 and older age,Reference Hustoft, Larsen, Auestad, Joa, Johannessen and Ruud 43 and others finding no associations with age.Reference Morgan, Mallett, Hutchinson, Bagalkote, Morgan and Fearon 7 – Reference van der Post, Mulder, Bernardt, Schoevers, Beekman and Dekker 9 , Reference Crisanti and Love 20 The elevated likelihood of involuntary admissions among immigrants is a consistent finding in the UK and in other European countries, especially for immigrants or ethnic minorities from Caribbean,Reference Morgan, Mallett, Hutchinson, Bagalkote, Morgan and Fearon 7 , Reference Davies, Thornicroft, Leese, Higgingbotham and Phelan 11 AfricanReference Morgan, Mallett, Hutchinson, Bagalkote, Morgan and Fearon 7 , Reference Davies, Thornicroft, Leese, Higgingbotham and Phelan 11 or non-WesternReference Mulder, Koopmans and Selten 8 countries or ethnicities. Although some studies show that controlling for observable characteristics, including greater levels of psychosis and more adversarial pathways to care involving the justice system, explain these findings,Reference Mulder, Koopmans and Selten 8 , Reference van der Post, Visch, Mulder, Schoevers, Dekker and Beekman 10 our study is not the only study to find that these factors did not explain the excess likelihood of involuntary admissions.Reference Morgan, Mallett, Hutchinson, Bagalkote, Morgan and Fearon 7 Patients with any diagnosis other than schizophrenia or psychosis were at lower likelihood of involuntary admissions, which is a common finding with these conditions.Reference Crisanti and Love 20 , Reference Zhou, Xiang, Zhu, Liang, Li and Yi 39 , Reference Preti, Rucci, Santone, Picardi, Miglio and Bracco 44 Psychosis is elevated among younger individuals and among immigrants, which together suggests that individuals with psychosis may be a key target group for future intervention studies which may help disparities among key demographic groups. Further research is required to understand which groups of immigrants are at excess likelihood of involuntary admission and explore possible explanations and potential interventions to address this disparity.
Our findings of increased likelihood with adversarial routes such as police contactsReference van der Post, Visch, Mulder, Schoevers, Dekker and Beekman 10 , Reference Wang, Chiu, Yang, Liu, Wu and Chou 41 , Reference Preti, Rucci, Santone, Picardi, Miglio and Bracco 44 and decreased likelihood with physician contactReference Morgan, Mallett, Hutchinson, Bagalkote, Morgan and Fearon 7 are consistent with the international literature. We also found independent associations between past year mental health visits and visits on the pathway to care, both with decreased likelihood of involuntary admissions. This suggests that potential interventions to reduce the likelihood of involuntary admission may involve increasing access to out-patient resources for patients with severe mental illness.
A wide variety of severity measures were independently associated with an increased likelihood of involuntary admissions beyond a primary diagnosis of psychosis, including self-harm on the emergency department record and all clinical rating scales except the DRS. Measures of dangerousness towards others were the strongest predictors among symptom measures.Reference Morgan, Mallett, Hutchinson, Bagalkote, Morgan and Fearon 7 , Reference Mulder, Koopmans and Selten 8 , Reference Wang, Chiu, Yang, Liu, Wu and Chou 41 In contrast to our findings, studies in other jurisdictions have found no significant increase inReference Mulder, Koopmans and Selten 8 , Reference van der Post, Mulder, Bernardt, Schoevers, Beekman and Dekker 9 , Reference Wang, Chiu, Yang, Liu, Wu and Chou 41 or lower likelihoodReference Morgan, Mallett, Hutchinson, Bagalkote, Morgan and Fearon 7 of involuntary admission associated with suicide risk/self-harm, measured in this study with the SOS scale, potentially reflecting a greater focus of involuntary admissions on suicide prevention in Ontario, with dangerousness to self included as an indication. The only exception to higher likelihood of involuntary admissions with greater severity was the lower likelihood of involuntary admission with higher ratings of depression measured by the DRS, which has been found in other studies and has been suggested to reflect greater levels of insight.Reference Preti, Rucci, Santone, Picardi, Miglio and Bracco 44 The set of factors included in this study is more diverse and extensive than that used in most previous studies,Reference Morgan, Mallett, Hutchinson, Bagalkote, Morgan and Fearon 7 , Reference Mulder, Koopmans and Selten 8 , Reference van der Post, Visch, Mulder, Schoevers, Dekker and Beekman 10 , Reference Segal, Laurie and Segal 12 , Reference Wang, Chiu, Yang, Liu, Wu and Chou 41 , Reference Preti, Rucci, Santone, Picardi, Miglio and Bracco 44 but the general finding of greater likelihood of involuntary admissions with greater severity is a consistent finding among studies.
Although we observed differences in risk factors compared with other systems, given differences in the legislation governing involuntary admissions and differences in mental healthcare systems, it is difficult to explain why risk factors may differ across systems.
Conclusions
In conclusion, we found a very high prevalence of involuntary admissions among Ontario residents that represents a substantial four-fold increase from the early 1980s. Although our data are limited in explaining the cause of the high prevalence of involuntary admissions, it is likely to be a consequence of the introduction of short involuntary holds and a dramatic reduction in the supply of psychiatric hospital beds. We found a significantly increased likelihood of involuntary admissions for individuals with police contact in the prior week, and a lower likelihood with psychiatric care, which is concerning given the rise in police Mental Health Act apprehensions and inadequate access to psychiatrists among those with severe mental illness. We also found increased likelihood among immigrants, even after controlling for other factors, which points to a potential disparity that requires further research to investigate. In any jurisdiction, the rights of freedom for individuals need to be balanced with the right to safety. Future research should further examine explanations for the high prevalence of involuntary admissions and determine what system-level changes may be able to mitigate this undesirable trend.
Contributors
P.K. was the Principal Investigator and with M.L. conceived the study. M.L. conducted the statistical analysis and prepared the first draft of the manuscript. All authors interpreted the data, critically revised the manuscript for important intellectual content, and approved the final version of the manuscript. M.L. had full access to all the data in the study and takes responsibility for the integrity of the data and the accuracy of the data analysis.
Data sharing
The data set from this study is held securely in coded form at the Institute for Clinical Evaluative Sciences (ICES). While data sharing agreements prohibit ICES from making the data set publicly available, access may be granted to those who meet pre-specified criteria for confidential access, available at www.ices.on.ca/DAS. The full data set creation plan and underlying analytic code are available from the authors upon request, understanding that the programs may rely upon coding templates or macros that are unique to ICES.
Acknowledgements
All data-sets used in the study were held securely and analysed at ICES. Parts of this material are based on data and information compiled and provided by CIHI. However, the analyses, conclusions, opinions and statements expressed herein are those of the authors, and not necessarily those of CIHI. The authors wish to thank Immigration, Refugee and Citizenship Canada for providing data to the ICES, where the analyses were conducted. We thank Laura Holder for assistance with the analysis.
Supplementary material
Supplementary material is available online at https://doi.org/10.1192/bjo.2017.4


 Open access
eLetters
No eLetters have been published for this article.