

INTRODUCTION
Marine ecological monitoring programmes have become an important tool for environmental management worldwide (Borja et al., Reference Borja, Bricker, Dauer, Demetriades, Ferreira, Forbes, Hutchings, Jia, Kenchington, Marques and Zhu2008; Borja & Elliott, Reference Borja and Elliott2013). The programmes provide managers and decision-makers with an essential source of relevant, reliable and timely science-based information that can be used to support the decision-making process (Elliott, Reference Elliott2011). The North Sea is a region with a wide range of industrial activities (OSPAR, 2010; Andersen et al., Reference Andersen, Stock, Heinänen, Mannerla and Vinther2013) and it is home for several protected marine mammal species (Kinze, Reference Kinze2001; Reid et al., Reference Reid, Evans and Northridge2003; Hammond et al., Reference Hammond, Macleod, Berggren, Borchers, Burt, Cañadas, Desportes, Donovan, Gilles, Gillespie, Gordon, Hiby, Kuklik, Leaper, Lehnert, Leopold, Lovell, Øien, Paxton, Ridoux, Rogan, Samarra, Scheidat, Sequeira, Siebert, Skov, Swift, Tasker, Teilmann, Van Canneyt and Vázquez2013). Acquisition of data on the distribution of highly migratory animals, such as marine mammals, over a wide geographic area, is challenging logistically and economically and often it requires large collaborative international efforts (Hammond et al., Reference Hammond, Macleod, Berggren, Borchers, Burt, Cañadas, Desportes, Donovan, Gilles, Gillespie, Gordon, Hiby, Kuklik, Leaper, Lehnert, Leopold, Lovell, Øien, Paxton, Ridoux, Rogan, Samarra, Scheidat, Sequeira, Siebert, Skov, Swift, Tasker, Teilmann, Van Canneyt and Vázquez2013; Koblitz et al., Reference Koblitz, Amundin, Carlström, Thomas, Carlén, Teilmann, Tregenza, Wennerberg, Kyhn, Svegaard, Koza, Kosecka, Pawliczka, Tiberi Ljungqvist, Brundiers, Wright, Mikkelsen, Tougaard, Loisa, Galatius, Jüssi and Benke2014). Alternative methods based on incidental sightings by sea-users (e.g. recreational sailors, fishermen, ferry goers) may be a cost-effective means to provide complementary valuable information to large regional surveys (Evans et al., Reference Evans, Anderwald and Baines2003; Kinze et al., Reference Kinze, Jensen and Skov2003; Loos et al., Reference Loos, Cooke, Deimer, Fietz, Henning and Schütte2009; Palacios et al., Reference Palacios, Herrera, Gerrodette, Garcia, Soler, Avila, Bessudo, Hernandez, Trujillo and Flórez-González2012).
In recent years, participation of the public community in collection of ecological survey data has greatly intensified under the concept of ‘citizen science’ (Devictor et al., Reference Devictor, Whittaker and Beltrame2010; Conrad & Hilchey, Reference Conrad and Hilchey2011). Adequately trained citizen scientists are a cost effective means to acquire valuable long-term data over a wide geographic area or access important scientific background information in new areas (Robinson et al., Reference Robinson, Jaidah, Jabado, Lee-Brooks, Nour El-Din, Malki, Elmeer, McCormick, Henderson, Pierce and Ormond2013; Embling et al., Reference Embling, Walters and Dolman2015). For example, marine mammal observations by shore-based citizen scientists have been collected for more than 40 years in the UK and the data have proven to be beneficial for coastal environmental management (Evans et al., Reference Evans, Anderwald and Baines2003, Reference Evans, Pierce, Veneruso, Weir, Gibas, Anderwald and Santos2015; Reid et al., Reference Reid, Evans and Northridge2003). Elsewhere, offshore incidental sightings have also contributed to the discovery of a major aggregation site for whale sharks in proximity to an offshore installation in the Al Shaheen area in the Arabian Gulf, 90 km off the coast of Qatar (Robinson et al., Reference Robinson, Jaidah, Jabado, Lee-Brooks, Nour El-Din, Malki, Elmeer, McCormick, Henderson, Pierce and Ormond2013).
Incidental sightings of seals, dolphins and whales around oil and gas (O&G) installations in the North Sea have also been reported by offshore staff for several decades (Evans, Reference Evans1976; Evans et al., Reference Evans, Anderwald and Baines2003), but rarely has there been sustained systematic effort (Todd et al., Reference Todd, Warley and Todd2016). To increase our knowledge on the relationship between marine mammals and the presence of O&G installations in the central Danish North Sea, an offshore marine mammal sighting reporting programme (MMSR) was initiated in May 2013. The programme was used as an incentive for staff working on and around offshore O&G installations in Denmark to report more systematically their incidental marine mammal sightings. Our objectives were (1) to collect local information on marine mammal occurrence and biodiversity around offshore O&G installations in the central Danish North Sea, and (2) to obtain a general picture of the regional distribution of marine mammals across an O&G activity region. Here, we present incidental sightings data collected during the first 3 years of the MMSR programme.
METHODS
Study site
Currently, there are about 25 fixed oil and gas installations in the Danish part of the central North Sea (Figure 1). Some of these installations are manned continuously by crew, while ‘satellite’ installations are visited occasionally by a small crew for a few hours. All installations are located around 200 km from the west coast of Denmark. In the north, installations are more recent with smaller submerged structures, and smaller permanent crew compared with the southern installations. Northern installations operate at depths ranging between 55 and 66 m, whereas southern installations operate at shallower depths ranging from 33 to 46 m (Table 1). Supply-, survey- and standby-boats, accommodation and drilling rigs are often placed or operate close to installations (within 750 m from the installations) increasing the size of crew associated with a specific installation for a period, which may range from hours to several weeks.
Study area. Filled symbols show continuously manned installations and open symbols show satellite installations which are occasionally visited. Installation group names are indicated in Table 1.
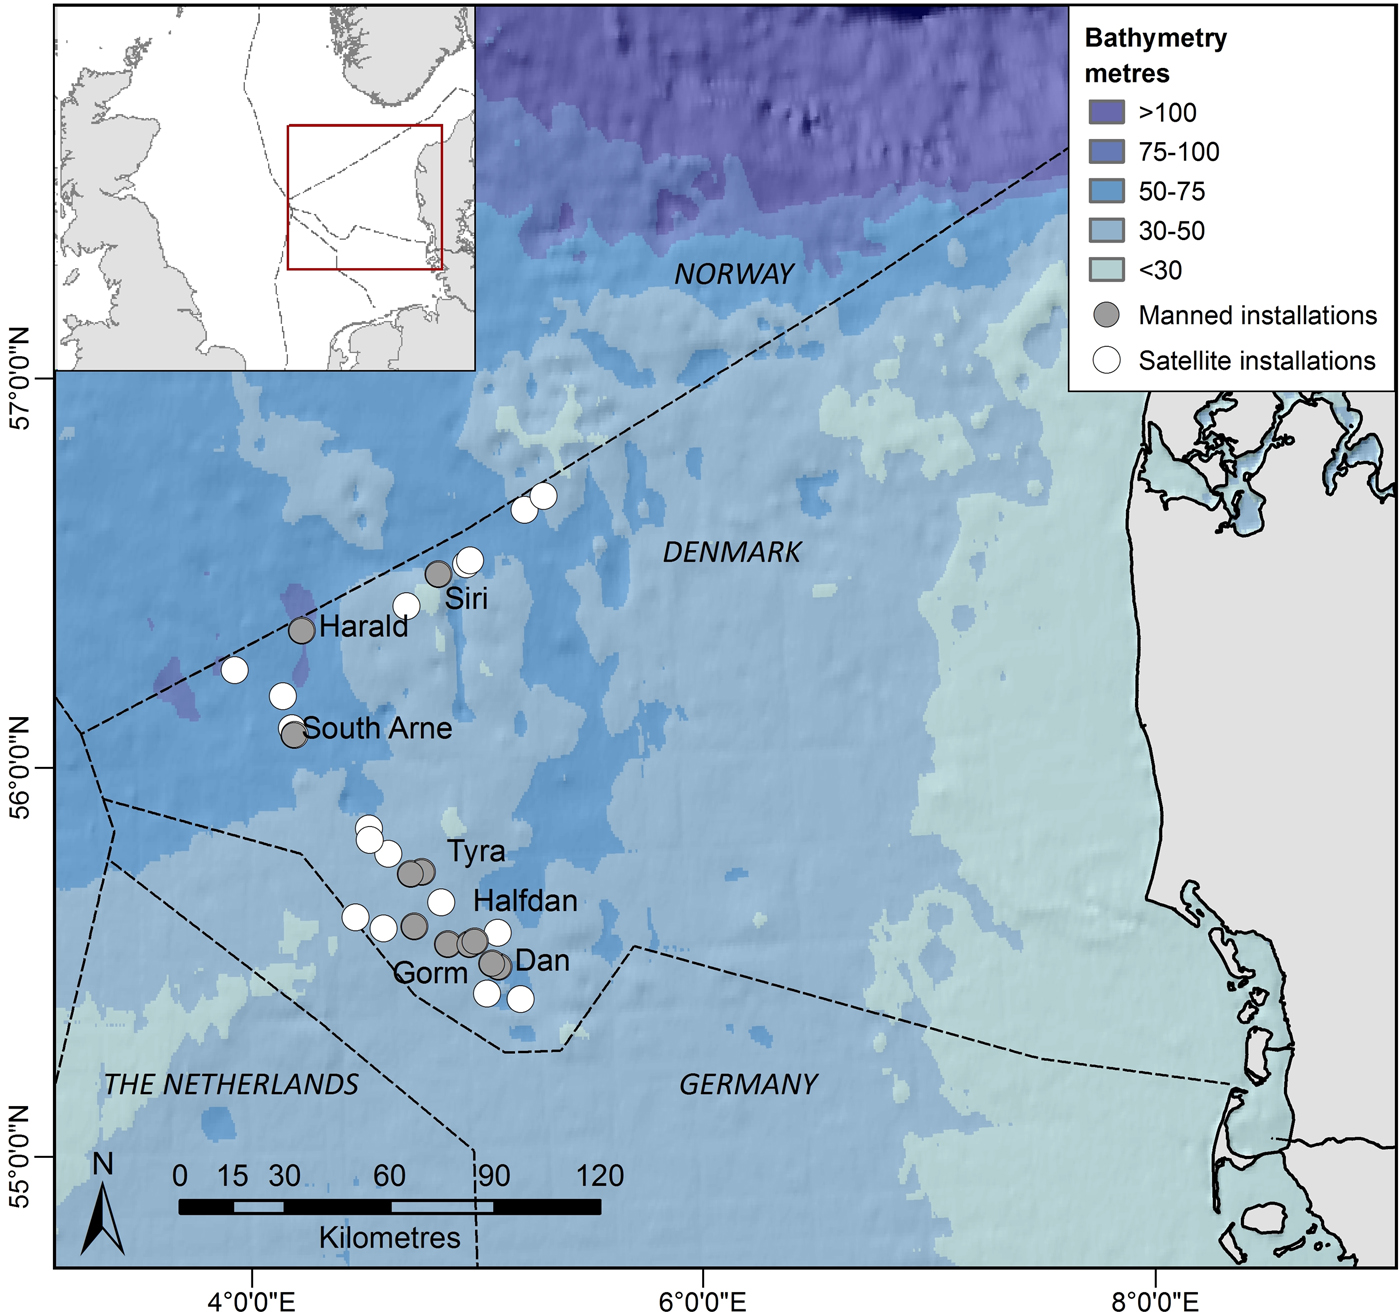
Danish installations overview in 2016. Construction date refers to construction of the first element of an installation which may have been expanded incrementally over the years. Areal footprint corresponds to cumulative area covered by the platform's legs at the seafloor and was estimated based on high resolution schematic drawing of the installations.
Regional marine mammal surveys indicate that the most common cetaceans in the Danish central North Sea are harbour porpoise (Phocoena phocoena; 0.293 individuals km−2), white-beaked dolphin (Lagenorhynchus albirostris 0.047 individuals km−2), and minke whale (Balaenoptera acutorostrata; 0.028 individuals km−2; Hammond et al., Reference Hammond, Macleod, Berggren, Borchers, Burt, Cañadas, Desportes, Donovan, Gilles, Gillespie, Gordon, Hiby, Kuklik, Leaper, Lehnert, Leopold, Lovell, Øien, Paxton, Ridoux, Rogan, Samarra, Scheidat, Sequeira, Siebert, Skov, Swift, Tasker, Teilmann, Van Canneyt and Vázquez2013). Other marine mammal species are also known to occur in the area in lesser numbers: grey and harbour seals (Halichoerus grypus; Phoca vitulina), sperm whale (Physeter macrocephalus), fin whale (Balaenoptera physalus) and several species of dolphins including killer whale (Orcinus orca) and pilot whales (Globicephala spp.), as well as Atlantic white-sided (Lagenorhynchus acutus), bottlenose (Tursiops truncatus), common (Delphinus delphis) and striped dolphins (Stenella coeruleoalba) (Kinze, Reference Kinze2001; Evans et al., Reference Evans, Anderwald and Baines2003; Reid et al., Reference Reid, Evans and Northridge2003; Hammond et al., Reference Hammond, Macleod, Berggren, Borchers, Burt, Cañadas, Desportes, Donovan, Gilles, Gillespie, Gordon, Hiby, Kuklik, Leaper, Lehnert, Leopold, Lovell, Øien, Paxton, Ridoux, Rogan, Samarra, Scheidat, Sequeira, Siebert, Skov, Swift, Tasker, Teilmann, Van Canneyt and Vázquez2013).
Reporting system
Commencement of the Danish offshore marine mammal sighting reporting programme (MMSR) was communicated to offshore platform workers and contractors through different media: presentations, emails, information meetings, intranet, an internally distributed magazine, and posters displayed offshore. Status updates and reminders about the MMSR were sent monthly the first year and quarterly thereafter, via the same channels, to maintain as high a level of involvement of the volunteers as possible (Loos et al., Reference Loos, Cooke, Deimer, Fietz, Henning and Schütte2009). Charts and identification keys to assist recognition of the most common species expected in the central North Sea were prepared by marine mammal biologists (modified from Jefferson et al., Reference Jefferson, Webber and Pitman2011 and http://www.hvaler.dk). The material was posted offshore on crew information boards and also made available in electronic format at the commencement of MMSR on 1 May 2013 and at each of the status updates and reminders.
Observations were made with the naked eye at an elevation of 25–70 m above sea level when stationed on installations or rigs and a maximum elevation of 15 m above sea level when stationed on boats. Volunteers reporting their incidental sightings were requested to report as a minimum: location, date and time of sighting, number of individuals (adult/calf) and behaviour. Individuals were identified to species level, though this was not always possible for dolphins (e.g. Lagenorhynchus albirostris or L. acutus) or seals, as differentiation can be difficult under typical offshore sighting conditions (Jefferson et al., Reference Jefferson, Webber and Pitman2011). Some reports included a visual estimate of distance from installation to the marine mammal, an estimate of size of the animal and description of its colouration pattern. When several sightings of the same species were made by different reporters at the same time, day and from the same installation, only the sighting with the greatest number of individuals was used for further data analysis. Reports were usually provided by email within 24 h of sighting. Photographs and videos were provided when available, and marine mammal biologists made a posteriori identification of documented reports.
Weather conditions
Sightability of marine mammals generally depends on sea state and weather conditions (Clarke, Reference Clarke1982). For example harbour porpoises, the smallest and most common species expected in the area, can only be observed reliably at Beaufort sea states ≤2 (Teilmann, Reference Teilmann2003). As reports were not provided with a sea state description, wind data collected on the platform were converted to the Beaufort scale. Empirical wind speed measurements were taken by wind gauges installed on the different installations. The measurements were not always available at some locations and the wind dataset collected at Tyra West was selected as a proxy for the wind conditions at all installations over the duration of the programme. This dataset was the most complete and correlated best with wind measurements collected at other installations (r = 0.78–0.93; P < 0.001). Average wind data were recorded as a 10-min window every hour. The measurements were taken in metres per second (m s−1) at 30 m above sea level and back-calculated to a 10 m elevation using the formula: v (m s−1; @10 m) = 0.876 v (m s−1 @ 30 m). Wind data were converted to the Beaufort scale by the formula B = 1.20 v2/3, where v is the wind speed in m s−1 at a 10 m elevation and B is rounded to obtain the Beaufort scale number (Beer, Reference Beer1996). As sightings are not possible at night, only median wind speeds for daylight hours were used. Daylight start, end and duration were estimated using civilian day for the central North Sea (Todd et al., Reference Todd, Pearse, Tregenza, Lepper and Todd2009).
Data analysis
The data included in the analyses are from sightings made during the three first years of MMSR, corresponding to the period from 1 May 2013 to 1 May 2016.
The total number of sightings for the different seasons was compared by a Kruskal–Wallis test (ANOVA by rank). Seasons were defined as winter (January–March), spring (April–June), summer (July–September) and autumn (October–December). Spearman's rank order correlations were estimated between total number of sightings and wind speed, as well as between total number of sightings and number of daylight hours at Beaufort ≤2.
Furthermore, Spearman's rank order correlations were estimated between species-specific numbers of sightings and environmental parameters (depth, longitude and latitude ED50, UTM zone 31) or installation characteristics (construction year and aerial footprint; Table 1). Due to low numbers of sightings for some of the individual installations, sighting data were aggregated based on their proximity, in three installation groups (HARALD, SIRI, S. ARNE) in the northern area and four groups (DAN, GORM, HALFDAN and TYRA) in the southern area (Table 1 and Figure 1). Group of installations with larger crew have a higher number of potential volunteer reporters i.e. a proxy for observation effort; thus the Spearman correlations parameters (r- and ρ-values) were estimated on the sighting data that were corrected by calculating the ratio between raw sighting numbers and installation group crew size. Some species had a limited number of observations, preventing reliable specific data analysis. In such cases, sightings data analyses were done based on higher taxonomic level sighting data e.g. Delphinidae (dolphins) or Phocidae (seals).
Kruskal–Wallis's and Spearman's statistical parameter for each of the tests were estimated using STATISTICA v.12.
RESULTS
General results
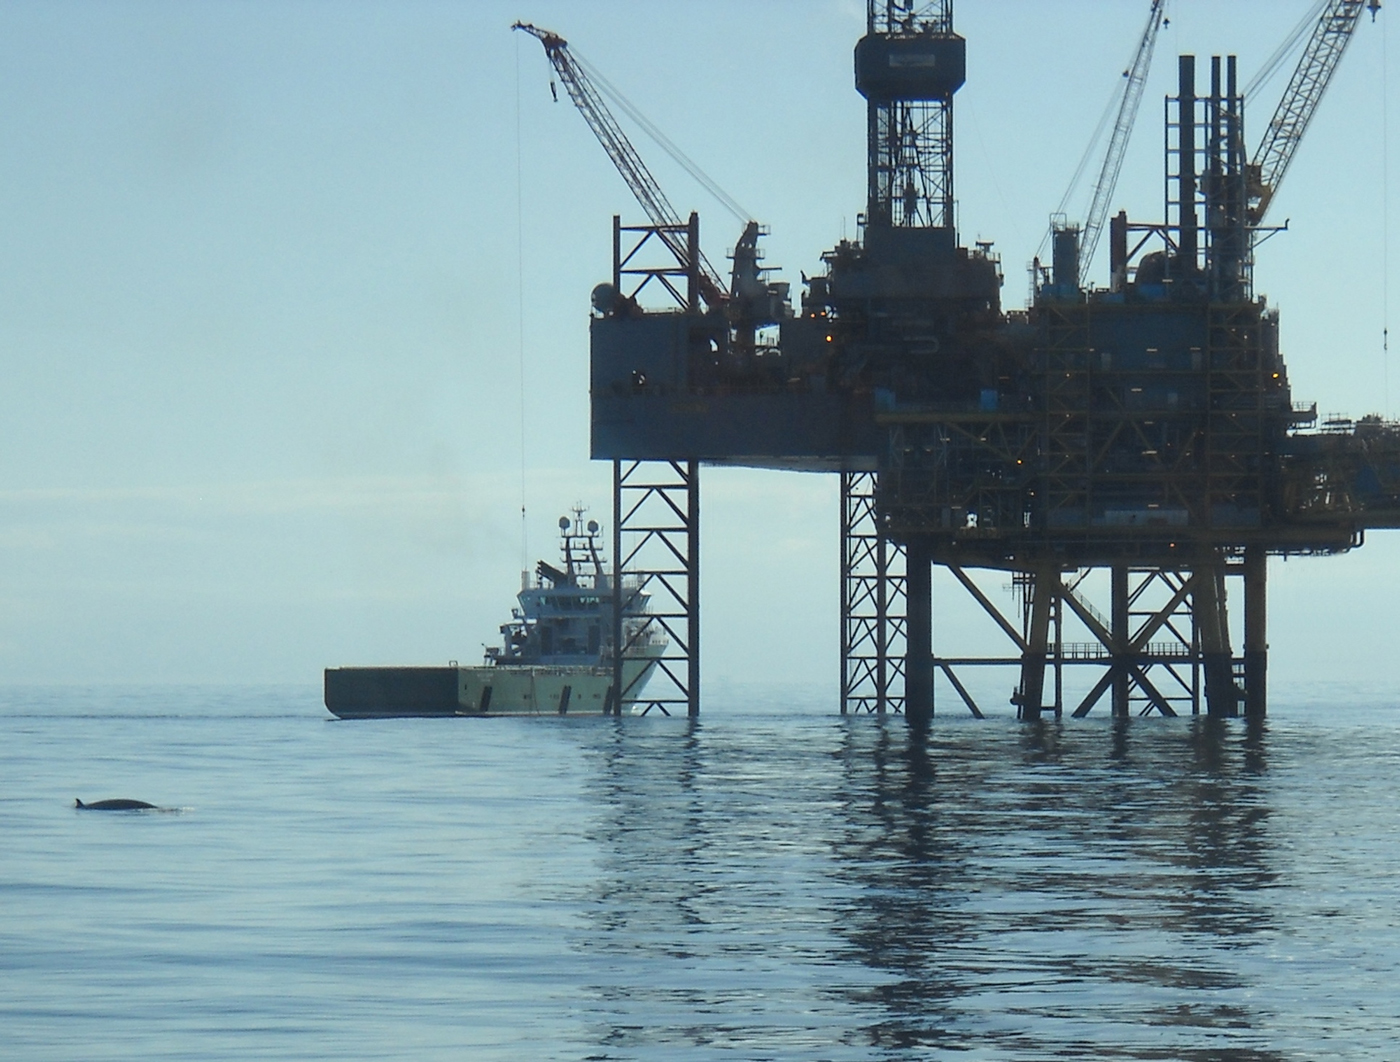
A total of 131 marine mammal incidental sightings corresponding to about 288 individuals were reported during the three years of the marine mammal sighting reporting programme (MMSR; 1 May 2013 to 1 May 2016; Table 2). The most sighted species around the Danish oil and gas installations were harbour porpoise (41%) and minke whale (31%). Other marine mammals sighted included at least three species of dolphins (11%) – killer whale, pilot whale and white-beaked dolphin, and two species of seals (15%) – harbour and grey seals. Harbour porpoise calves were observed in 50% of the porpoise sightings from May to September, and dolphin calves were observed twice in July. About 20% of reports were documented either by photographs or videos (Figure 2; online Supplementary file), and marine mammal biologists confirmed that species identification in 26 out of the 28 documented reports was reported correctly by offshore staff.
Minke whale photographed at Halfdan A in June 2014. Note the presence of a drilling rig and a supply boat. Credit: Henrik Ærenlund Olsen (Esvagt Promotor).
Summary of reported sightings from the Danish oil and gas activity area from 1 May 2013 to 1 May 2016. The summary is based on species/taxa and group size.
Marine mammals were most frequently observed solitarily or in groups of two individuals (Table 2). Sightings of pods of more than five individuals were relatively rare (3%) and only reported for minke whales and dolphin species. Marine mammal sightings were most often reported from offshore fixed installations (65%) and nearby standby boats (31%). Animals were observed swimming under installation legs out to a distance of several hundred metres. On several occasions, seals were observed resting intermittently on the lower structures of the installations for several days, and in one instance, pictures showed a young grey seal on the deck of the smallest standby-boat.
Interestingly, sightings of some fish species were also reported as part of the MMSR. A 0.5 m wide sunfish (Mola mola) was seen at Valdemar in June 2014, and another was photographed at Halfdan B in July 2015. An ~10 m long basking shark (Cetorhinus maximus) was reported and video recorded feeding around the Tyra East installation in October 2015 (https://youtu.be/H93WTZp4xv8).
Temporal and spatial variability
There were significant seasonal differences between the numbers of marine mammal sightings (Kruskal–Wallis; N = 12; P = 0.053). The majority of reported sightings were made during spring (40%) and summer (48%), whereas only three sightings (2%) were made during autumn. The highest number of sightings was made in July with a total of 37 (Figure 3). Daylight hours available ranged from a monthly average of 286 h for autumn and winter to 467 h for spring and summer. Additionally, Beaufort wind force ≤2 corresponded to an estimated 11% of the daytime in spring, 17% in summer, 5% in autumn and 8% in winter. July had the highest number of daytime hours with about 545 h and an estimated 39% of the daytime with Beaufort wind force ≤2. The overall number of monthly sightings decreased with increasing wind speed (Spearman ρ < 0.001; r 2 = 0.79) and with decreasing daytime hours with Beaufort wind force ≤2 (Spearman ρ < 0.001; r 2 = 0.73). The total number of daytime hours with Beaufort wind force ≤2 was 667 in the first year (1 May 2013 to 1 May 2014), 461 h in the second year and 460 h in the third year. The number of reported marine mammal sightings was 33 during the first monitoring year, 58 during the second year, and 40 during the third year.
Monthly marine mammal sighting counts (top) and corresponding wind speed and daylight hours (bottom). Box plots indicate civilian daylight hours median wind speed (line), 25 and 75% (lower and upper box sides) and 5 and 95% over the duration of the reporting programme (lower and upper whiskers) limits (N = 693–1698).
Ninety-three per cent of sightings were made around southern installations, particularly at HALFDAN (40%; Figure 4). Sightings from southern installations were mostly of harbour porpoise (50%) and minke whale (33%), but dolphins (13%) and seals (5%) were also observed. At northern installations, sightings were mostly of minke whale (75%) and one single report of four harbour porpoises. There were significant taxon specific correlations between sighting numbers and some of the environmental characteristics (latitude and depth) and installations characteristics (aerial installation footprint; Table 3). This relationship was particularly strong for harbour porpoise, with an increase in the number of sightings from north to south (Spearman ρ = 0.003; r 2 = 0.85). There was also an increase in number of harbour porpoise sightings with aerial installation footprint (Spearman ρ = 0.033; r 2 = 0.62). The number of sightings increased with increasing depth for seals (Spearman ρ = 0.023; r 2 = 0.67) and dolphins (Spearman ρ = 0.007; r 2 = 0.79).
Marine mammal sightings counts at northern and southern installations from 1 May 2013 to 1 May 2016.
Summary statistics of the Spearman correlation between number of sightings corrected for installations crew size, environmental parameters and installations characteristics (N = 7).
Significant correlations are highlighted in bold and marked with *P ≤ 0.05, **P ≤ 0.01 and ***P ≤ 0.005.
DISCUSSION
This study adds to the existing knowledge that marine mammals are relatively frequently present around offshore oil and gas (O&G) structures (Todd et al., Reference Todd, Pearse, Tregenza, Lepper and Todd2009, Reference Todd, Warley and Todd2016; Triossi et al., Reference Triossi, Willis and Pace2013; Balle et al., Reference Balle, Clausen, Mikkelsen, Wisniewska and Teilmann2014; Arnould et al., Reference Arnould, Monk, Ierodiaconou, Hindell, Semmens, Hoskins, Costa, Abernathy and Marshall2015). A total of at least seven marine mammal species have been identified during the first three years of the Danish offshore marine mammal sighting reporting programme (MMSR), namely five cetacean species – harbour porpoise, minke whale, killer whale, white-beaked dolphin and pilot whale, and two pinniped species – harbour and grey seals. Sighted cetaceans and their relative number of observations generally reflected expected marine mammal abundance and diversity in the central North Sea (Reid et al., Reference Reid, Evans and Northridge2003; Hammond et al., Reference Hammond, Macleod, Berggren, Borchers, Burt, Cañadas, Desportes, Donovan, Gilles, Gillespie, Gordon, Hiby, Kuklik, Leaper, Lehnert, Leopold, Lovell, Øien, Paxton, Ridoux, Rogan, Samarra, Scheidat, Sequeira, Siebert, Skov, Swift, Tasker, Teilmann, Van Canneyt and Vázquez2013). Sightings of other cetacean species such as Atlantic white-sided dolphin (Lagenorhynchus acutus) and common dolphin (Delphinus delphis) close to stationary O&G installations have been reported previously in the UK (Todd et al., Reference Todd, Warley and Todd2016) and in Denmark (Steffen Sanvig Bach, personal communication).
Anthropogenic marine structures can act as artificial reefs that locally increase fish biodiversity and biomass (Pickering & Whitmarsh, Reference Pickering and Whitmarsh1997; Langhamer, Reference Langhamer2012). This has proven to be the case also for O&G installations operating at <100 m depth in the North Sea, where installations attract and concentrate a wide range of fish species (Soldal et al., Reference Soldal, Svellingen, Jørgensen and Løkkeborg2002; Fujii, Reference Fujii2015, Reference Fujii2016). These include, for example, cod (Gadus morhua), haddock (Melanogrammus aeglefinus), saithe (Pollachius virens), sand eel (Ammodytes spp.), mackerel (Scomber scombrus), sprat (Sprattus sprattus), herring (Clupea harengus) and several species of flat fish (Pleuronectid spp.), which are all known prey species for the marine mammal species observed during this reporting programme (Thompson et al., Reference Thompson, McConnell, Tollit, Mackay, Hunter and Racey1996; Abend & Smith, Reference Abend and Smith1997; Pauly et al., Reference Pauly, Trites, Capuli and Christensen1998; Olsen & Holst, Reference Olsen and Holst2001; Sveegaard et al., Reference Sveegaard, Andreasen, Mouritsen, Jeppesen, Teilmann and Kinze2012). Similarly, increased availability of prey items are associated with presence of top predators around a wide range of marine structures such as a reconstructed stony reef (Mikkelsen et al., Reference Mikkelsen, Mouritsen, Dahl, Teilmann and Tougaard2013), a large bridge (Brandt et al., Reference Brandt, Hansen, Diederichs and Nehls2014), O&G facilities (Todd et al., Reference Todd, Pearse, Tregenza, Lepper and Todd2009, Reference Todd, Warley and Todd2016; Arnould et al., Reference Arnould, Monk, Ierodiaconou, Hindell, Semmens, Hoskins, Costa, Abernathy and Marshall2015), and wind farms (Russell et al., Reference Russell, Brasseur, Thompson, Hastie, Janik, Aarts, McClintock, Matthiopoulos, Moss and McConnell2014).
Occurrence of harbour seals around southern installations at about 200 km from the closest shore is notable, as they are known typically to forage in coastal waters (Thompson et al., Reference Thompson, McConnell, Tollit, Mackay, Hunter and Racey1996; Tollit et al., Reference Tollit, Black, Thompson, Mackay, Corpe, Wilson, Parijs, Grellier and Parlane1998; Tougaard et al., Reference Tougaard, Teilmann and Tougaard2008). Observed utilization of structures or boats as a temporary haul-out location, combined with potential increased foraging success, are likely to motivate some individual seals to these longer distance offshore visits (McConnell et al., Reference McConnell, Fedak, Lovell and Hammond1999; Russell et al., Reference Russell, Brasseur, Thompson, Hastie, Janik, Aarts, McClintock, Matthiopoulos, Moss and McConnell2014; Arnould et al., Reference Arnould, Monk, Ierodiaconou, Hindell, Semmens, Hoskins, Costa, Abernathy and Marshall2015). Some seals were shown to forage actively and selectively around submerged pipelines and wind turbine structures within less than a year of their installation (Russell et al., Reference Russell, Brasseur, Thompson, Hastie, Janik, Aarts, McClintock, Matthiopoulos, Moss and McConnell2014; Arnould et al., Reference Arnould, Monk, Ierodiaconou, Hindell, Semmens, Hoskins, Costa, Abernathy and Marshall2015). This suggests the ability of marine mammals to rapidly identify and utilize these artificial habitats for foraging. Since the offshore O&G industry has been present in the North Sea for more than four decades, utilization of offshore installations as a foraging opportunity by marine mammals is therefore likely to be well-established (e.g. through social learning; Whitehead, Reference Whitehead2010).
As data presented here are based on incidental sightings, the absence of standardized design does not allow an evaluation of the absolute abundance of species (Loos et al., Reference Loos, Cooke, Deimer, Fietz, Henning and Schütte2009; Robinson et al., Reference Robinson, Jaidah, Jabado, Lee-Brooks, Nour El-Din, Malki, Elmeer, McCormick, Henderson, Pierce and Ormond2013). Nevertheless, the data could be correlated with several environmental parameters and installation related characteristics. The increasing number of harbour porpoise sightings towards the south may be related to proximity of the southern installation with areas where this species is known to occur in numbers (Gilles et al., Reference Gilles, Scheidat and Siebert2009, Reference Gilles, Viquerat, Becker, Forney, Geelhoed, Haelters, Nabe-Nielsen, Scheidat, Sveegaard, van Beest, van Bemmelen and Aarts2016; Hammond et al., Reference Hammond, Macleod, Berggren, Borchers, Burt, Cañadas, Desportes, Donovan, Gilles, Gillespie, Gordon, Hiby, Kuklik, Leaper, Lehnert, Leopold, Lovell, Øien, Paxton, Ridoux, Rogan, Samarra, Scheidat, Sequeira, Siebert, Skov, Swift, Tasker, Teilmann, Van Canneyt and Vázquez2013). Other taxonomic relationships with depth and installation aerial footprint could be explained by differences in prey availability (Pickering & Whitmarsh, Reference Pickering and Whitmarsh1997; Fujii, Reference Fujii2015). More data would be required to make these correlations species specific, and confirm their validity while accounting for possible confounding effects of other environmental factors or installation characteristics.
Most sightings reported under the MMSR were made during spring and summer. Distribution data collected from vessel and aerial surveys in the central part of the North Sea show similar temporal variations (Evans et al., Reference Evans, Anderwald and Baines2003; Gilles et al., Reference Gilles, Scheidat and Siebert2009; De Boer, Reference De Boer2010). In particular, it is suggested that a relatively higher abundance of harbour porpoise in spring and summer can be expected in the central North sea, due to seasonal porpoise population movement from coastal areas to offshore areas (Gilles et al., Reference Gilles, Scheidat and Siebert2009, Reference Gilles, Viquerat, Becker, Forney, Geelhoed, Haelters, Nabe-Nielsen, Scheidat, Sveegaard, van Beest, van Bemmelen and Aarts2016). Such seasonality in occurrence of marine mammals close to O&G platforms could be natural, and reflect a change in prey availability (De Boer, Reference De Boer2010; Sveegaard et al., Reference Sveegaard, Andreasen, Mouritsen, Jeppesen, Teilmann and Kinze2012; Fujii, Reference Fujii2015; Gilles et al., Reference Gilles, Viquerat, Becker, Forney, Geelhoed, Haelters, Nabe-Nielsen, Scheidat, Sveegaard, van Beest, van Bemmelen and Aarts2016). On the other hand, the combined effect of shorter days and harsher weather conditions significantly reduces the likelihood of detecting marine mammals based on visual surveys (Clarke, Reference Clarke1982; Teilmann, Reference Teilmann2003). Such an effect was also observed in other surveys based on incidental sightings data (Kinze et al., Reference Kinze, Jensen and Skov2003; Loos et al., Reference Loos, Cooke, Deimer, Fietz, Henning and Schütte2009). The estimation of weather corrected data would require a standardized reporting format including significantly more information (Teilmann, Reference Teilmann2003). Alternatively, long-term continuous acoustic monitoring studies (unaffected by weather and daylight hours) could help fill some of the gaps in our knowledge of seasonal distribution of marine mammals in the vicinity of anthropogenic structures.
The MMSR has proven to be a useful incentive for reporting offshore sightings. It provides us with relatively long-term marine mammal occurrence and biodiversity data in offshore O&G activity areas. The caveats associated with incidental sighting data are acceptable, as long as data analyses and inferences based on these analyses are made accordingly. Implementation of a more standardized reporting programme to gain additional knowledge on seasonality or species abundance estimates is possible (Evans & Hammond, Reference Evans and Hammond2004; Todd, Reference Todd2016). However, we predict that the additional reporting requirements would inevitably lead to a significant reduction in the number of reports from offshore working volunteers staff and a loss of valuable scientific information (Borja & Elliott, Reference Borja and Elliott2013).
SUPPLEMENTARY MATERIAL
The supplementary material for this article can be found at https://doi.org/10.1017/S0025315417000406.
ACKNOWLEDGEMENTS
We thank all offshore personnel from Maersk Oil, Hess Denmark APS and DONG Oil & Gas for their participation in the marine mammal sighting reporting programme. We also thank participating contractors: staff from Ensco 71, Energy Enhancer, Maersk Resolute as well as crew members of Esvagt Echo, Esvagt Preserver, Esvagt Preventer, Esvagt Promotor, Esvagt Server, Skandi Olympia, M/V Cecilie (FOGA APS) and M/V Anette Christina (FOGA APS) Finally, we thank G. Kaastrup, K. Povidisa, S. Taylor, V. Todd, P.G.H Evans and several anonymous reviewers for their constructive comments that improved earlier versions of this manuscript.
FINANCIAL SUPPORT
This research received no specific grant from any funding agency, commercial or not-for-profit sectors.


 Open access