





1. Introduction
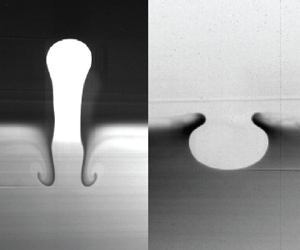
Vortex rings are a key feature of underwater biological propulsion, particularly within the moderate-Reynolds-number regime. Jellyfish, for example, have consistently been observed to create vortices in their wakes during forward swimming, leading to so-called biogenic transport (Katija & Dabiri Reference Katija and Dabiri2008, Reference Katija and Dabiri2009; Breitburg et al. Reference Breitburg, Crump, Dabiri and Gallegos2010; Costello et al. Reference Costello, Colin, Dabiri, Gemmell, Lucas and Sutherland2021). While this process has been widely studied in the context of homogeneous fluids, less focus has been given to the more realistic case of vortex propagation in stratified fluids. Even though the stratification in the upper ocean is weak, changes in density are non-negligible for many species of mesozooplankton (Kirillin et al. Reference Kirillin, Grossart and Tang2012; Cullen Reference Cullen2015; Briseño-Avena et al. Reference Briseño-Avena, Prairie, Franks and Jaffe2020; Chen et al. Reference Chen, Zhou, Zhong, Waniek, Shan and Zhang2022). Here, we study the fundamental problem of vortex propagation across the interface between two miscible fluids and highlight the role of baroclinic vorticity, which originates from the misalignment of density and pressure surfaces, in impeding the penetration of vortices, depending on the direction of the ring, with important consequences for feeding and transport in ocean ecosystems.
In the fluid mechanics literature, the motion of vortex rings in density stratified fluids has been widely explored. The classical study by Linden (Reference Linden1973) experimentally analyses the interaction of a vortex ring impinging normally on a density interface between two liquids, where a vortex ring of light fluid crosses the interface into a heavy fluid. Linden reported that the maximum penetration depth of the vortex ring was a function of the Froude number,  $Fr = \rho _j U^2_j/[(\rho _0-\rho _j)gD]$, where $\rho _j$ and $U_j$ are the jet density and velocity, respectively; $\rho _0$ is the ambient fluid density and $D$ is the nozzle diameter of the vortex ring generator. Similarly, Dahm, Scheil & Tryggvason (Reference Dahm, Scheil and Tryggvason1989) performed experiments with a vortex ring crossing the interface of a stable two-layer system. Experiments were conducted varying the density across the interface and producing vortex rings with different circulation values. The authors found that in the Boussinesque limit the generation of baroclinic vorticity and the subsequent evolution of the vortex ring was governed only by the product of two dimensionless parameters, $A\gamma$, where $A$ measures the density difference across the interface, and $\gamma$ measures the strength of the vortex ring. This dimensionless parameter $A\gamma$ was observed to be linearly related to the square of the Froude number, $A\gamma \sim Fr^2$. For large $A\gamma$ values, the vortex ring can barely penetrate the interface, which then acts like a solid wall. The authors also observed an inverse flow after the vortex ring crossed the interface.
From a theoretical standpoint, Saffman (Reference Saffman1992) studied the vertical translation of a vortex ring moving against buoyancy. Consider the fluid inside the vortex core to be  $\rho _1$ and the ambient fluid to be $\rho _0$, where $\rho _0 \neq \rho _1$. If the circulation around the ring is $\kappa$, then one would expect ${\rm D}\kappa /{\rm D}t=0$ according to Kelvin's circulation theorem. The hydrodynamic impulse of the vortex ring would then be given by
 \begin{equation} I=\rho_1\kappa R^2, \end{equation}
where  $R$ is the vortex ring radius. The buoyant force on the ring would be
 \begin{equation} F_b=(\rho_0-\rho_1)2{\rm \pi} g Ra^2, \end{equation}
where  $a$ is the vortex core radius and g is the gravity constant. If $a\ll R$, it can be considered that the entrainment is negligible, so $\rho _1= {\rm const}$. As the momentum of the vortex ring decreases due to the buoyant force, the time rate of change of momentum of the vortex ring is always negative and is balanced by the buoyant force, which should also be negative, therefore, we have
 \begin{equation} \frac{{\rm d}I}{{\rm d}t}= \rho_1 \kappa 2R \frac{{\rm d}R}{{\rm d}t} ={-}|\rho_0-\rho_1|2{\rm \pi} g Ra^2. \end{equation}
As a result, the evolution of the vortex ring radius from its initial size R0 after time t is given as
 \begin{equation} R=R_0 - \frac{|\rho_0-\rho_1|}{\rho_1}\frac{{\rm \pi} g}{\kappa}a^2 t. \end{equation}
The second term on the right-hand side of (1.4) remains negative as long as there exists a density difference. While this model captures how the diameter of the vortex ring decreases as it moves through a fluid with different density, it assumes no fluid entrainment into the vortex ring. Nevertheless, the analysis can be used to lead a qualitative discussion regarding the evolution of the vortex ring size.
Marugán-Cruz, Rodríguez-Rodríguez & Martínez-Bazán (Reference Marugán-Cruz, Rodríguez-Rodríguez and Martínez-Bazán2009, Reference Marugán-Cruz, Rodríguez-Rodríguez and Martínez-Bazán2013) studied the formation of vortex rings in a negatively buoyant environment as a function of Froude number. Specifically, a fluid was injected into a denser one using a vortex ring generator at the top of a tank. The authors found that there exists a critical Froude number below which the leading vortex ring is pushed back by the buoyant force before it develops and detaches from the injection orifice. In addition, the authors observed a thin layer of baroclinic vorticity of opposite sign to the vorticity around the vortex ring. This thin layer of vorticity was observed to move against the travel direction of the ring due to buoyancy. Camassa et al. (Reference Camassa, Khatri, McLaughlin, Mertens, Nenon, Smith and Viotti2013) experimentally and numerically studied a vortex ring settling in a two-layer configuration of miscible fluids and found that, depending on the initial conditions (e.g. vortex size, speed and the initial distance to the interface), the vortex ring can either be trapped in one density layer or penetrate the interface. More recently, Olsthoorn & Dalziel (Reference Olsthoorn and Dalziel2015, Reference Olsthoorn and Dalziel2017) experimentally investigated the mixing efficiency and stability effects of a vortex ring impinging a density interface by reconstructing full three-dimensional velocity field measurements. The authors also reported a time scale for the evolution of baroclinic vorticity production when a vortex ring crosses the density interface. It should be noted that Scase & Dalziel (Reference Scase and Dalziel2006) analysed a vortex ring crossing a density interface at an oblique angle. In this case, a three-dimensional vortex ring collapses into a nearly two-dimensional flow as a result of the stable fluid stratification.
While most literature focuses on the important cases of turbulent mixing of stratified fluids (e.g. Caulfield Reference Caulfield2021; Smith, Caulfield & Taylor Reference Smith, Caulfield and Taylor2021) and the evolution of vortex rings crossing a density interface (e.g. Camassa et al. Reference Camassa, Harris, Holz, McLaughlin, Mertens, Passaggia and Viotti2016), the question remains of whether the motion of a vortex ring is symmetrical as it travels along or against a stable density gradient. Given the hundred-metre-long migrations that mesozooplankton undergo in the ocean (Bianchi et al. Reference Bianchi, Galbraith, Carozza, Mislan and Stock2013a,Reference Bianchi, Stock, Galbraith and Sarmientob), accurate assessment of biogenic induced transport is essential to better understand the sustainability of marine ecosystems. In this study, we examine the process of a vortex ring crossing a density interface between two miscible fluids in two different directions, along and against the density gradient. The penetration distance of the vortex ring is tracked and compared between the two cases in § 3.1. The associated baroclinic vorticity generated at the interface is examined in § 3.2 and then used in further discussions on the source of asymmetry in § 4.
2. Experimental set-up and methods
The experimental set-up consists of a transparent acrylic tank ( $25.4\ {\rm cm}\times 25.4\ {\rm cm}\times 50.8\ {\rm cm}$) and two identical piston-cylinder arrangements (one on top and one at the bottom) positioned at the centre of the tank as shown in figure 1(a). In each vortex generation system, the inner diameter of the cylinder, $D$, is 2.54 cm. The piston, which has a cylindrical cross-section and is 25.4 cm in length, moves freely within the cylinder. The motion of the piston is controlled by a hydraulic circuit, which displaces a prescribed fluid column at a given speed and distance, $L$, using a larger piston and a step motor controlled by an Arduino board.
(a) Sketch of the experimental set-up consisting of an acrylic tank and two vortex generators. The tank was filled with two uniform fluid layers such that a stable stratification was achieved, i.e.  $\rho _1>\rho _2$. Vortex rings that are generated from the bottom (top) of the tank propagate upward (downward) and cross the density interface. The camera field of view (boxed region) is centred at the density interface. (b) Sketch of the density variation across the depth of the tank to illustrate the density interface in (a). (c) Representative raw image of an upward propagating vortex ring crossing the density interface. The small bright dots are the tracer particles used for PIV measurements. The blue arrows indicate the recirculating direction of the flow in the vortex ring.

For all experiments, a stable two-layer density stratification was produced by slowly filling the tank midway with homogeneous fluid and subsequently adding another fluid layer with greater density. In all cases, the interface between the two fluids remained nearly stagnant during the filling process. Nonetheless, the tank was left undisturbed for approximately half an hour before performing experiments. To generate vortex rings, one of the pistons was set into motion with a constant speed of  $U_{p} = 7.54 \pm 0.18\ {\rm cm}\ {\rm s}^{-1}$. The corresponding Reynolds number was $Re=U_{p} D \rho /\mu = 1915$, where $\mu$ is the dynamic viscosity, considering the properties of fresh water. To restrict our tests to the case of individual vortex rings without a wake (Gharib, Rambod & Shariff Reference Gharib, Rambod and Shariff1998), the stroke ratio, $L/D$, for all cases presented here was 2.55.
The properties of the fluid solutions tested in this study are presented in table 1. In all cases, tap water was used as the baseline, and table salt (NaCl) was added to increase the density of the solution. This property was measured with a floating hydrometer with a resolution of  $0.5\ {\rm kg}\ {\rm m}^{-3}$. The density difference encountered by the vortex ring as it crosses the interface is characterized by a normalized density contrast: $\Delta \rho ^*_{21}=(\rho _2-\rho _1)/{\rho _2}$ and $\Delta \rho ^*_{12}= (\rho _1-\rho _2)/\rho _1$, where $\rho _1$ and $\rho _2$ are the densities of bottom (dense) and the top (the baseline, light) fluids, respectively. As discussed in §§ 3 and 4, the value and sign of $\varDelta \rho ^*$ plays an important role in the motion of vortex rings (table 1). The maximum change of viscosity between the two fluids does not surpass 3.5 % according to the data in the literature (Qasem et al. Reference Qasem, Generous, Qureshi and Zubair2021). This viscosity effect is, therefore, assumed to be negligible (Sharqawy, Lienhard & Zubair Reference Sharqawy, Lienhard and Zubair2010).
Properties of the liquids used in the experiments. The first column lists the density of the solutions (pure water is the top layer fluid and the baseline solution,  $\rho _2$), followed by the corresponding salinity in the second column. The third and fourth columns indicate the normalized density contrasts, where $\Delta \rho ^*_{12}= (\rho _1-\rho _2)/\rho _1$ and $\Delta \rho ^*_{21}=(\rho _2-\rho _1)/{\rho _2}$.

2.1. Measurement techniques
Two experimental techniques were implemented in this study. Planar laser-induced fluorescence (PLIF) was used to track the location of the vortex and the density gradient, while two-dimensional particle image velocimetry (PIV) was used to measure the velocity field in the mid-plane of the experimental tank. The first technique was performed by adding a small amount of fluorescent dye (Rhodamine 6G, Sigma-Aldrich) to one of the fluid layers (20 ppm). Note that since the amount of mixing during the initial instants of the interaction of the vortex ring with the interface is very small, the location of the interface was used as a proxy for the sharpest density gradient,  $\boldsymbol {\nabla } \rho$.
Velocity fields were obtained via two-dimensional PIV (figure 1c). A continuous laser sheet was created using a plano concave cylindrical lens ( $-$3.9 mm focal length) and a laser light beam (1 W, 532 nm, continuous, Laser Glow). Both fluid layers were seeded with $13\ \mathrm {\mu } {\rm m}$ silver-coated hollow glass spheres (Potters Industries Inc). A high-speed camera (Photron Ultima APX-RS) was used at 125 frames per second. The velocity fields were computed using the software Dynamic Studio (Dantec Dynamics) with the single-frame scheme and applying standard validation and filtering algorithms (Willert & Gharib Reference Willert and Gharib1991). A representative instantaneous raw PIV image showing a vortex ring penetrating the density interface from the top is presented in figure 2(a). Note that the change in contrast is due to the fluorescent dye used to track the interface between the two layers. In this case, the induced velocity and vorticity fields result in the deformation of the interface between the two homogeneous layers (see figure 2(b), where the dashed line indicates the position of the density interface defined as the mean pixel value between the top and bottom regions in the raw image).
(a) Representative PIV image of a vortex ring penetrating the density interface of a stable two-layer system. (b) Velocity field computed by processing the PIV image in (a); the colour indicates the dimensionless vorticity field,  $\boldsymbol {\omega } U_p/D$, where $\boldsymbol{\omega}$ is the vorticity; the size and direction of the arrows indicate the magnitude and the direction of the velocity field, respectively; the dashed line shows the instantaneous position of the interface between the two fluid layers. Panel (c) shows half of the vortex ring and induced flow in (b). From the vorticity field, the circulation of the main vortex and the baroclinic vorticity are retrieved by numerically integrating within the dotted line region (main vortex) and the black dashed line region (baroclinic vorticity), where the red dashed line indicates the density gradient.
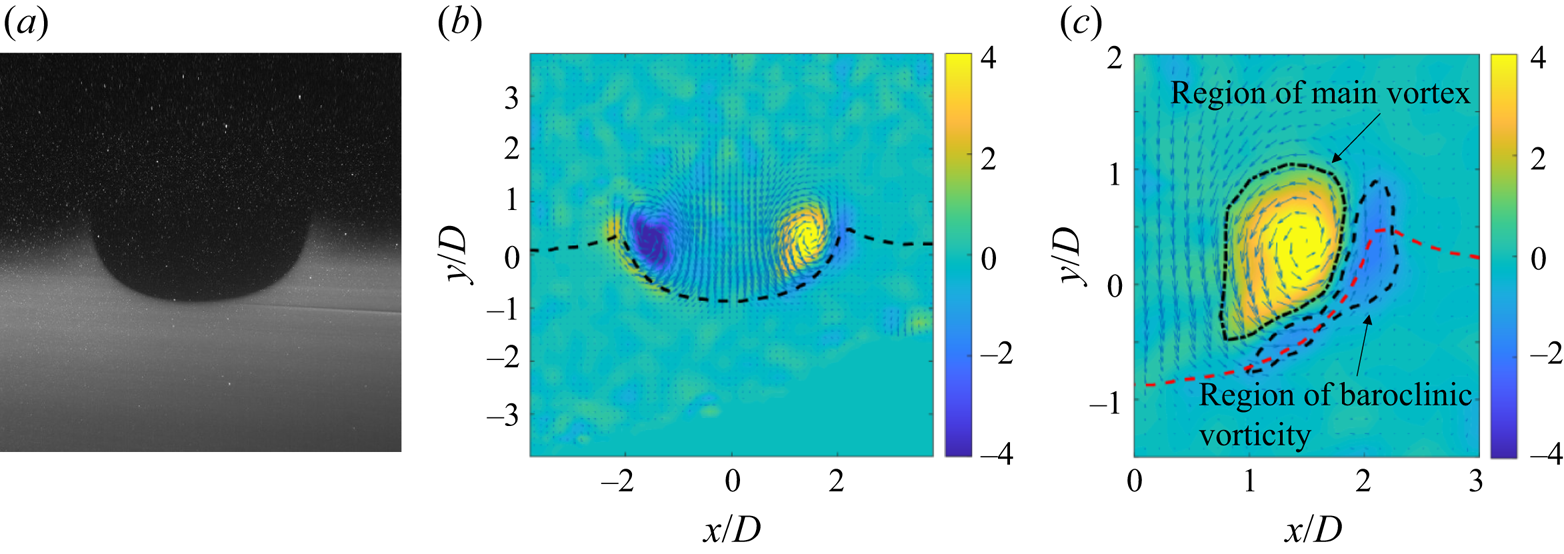
As the vortex ring crosses the interface, the generation of baroclinic vorticity is evident at the density interface (figure 2b,c) In principle, the production of baroclinic vorticity can be measured experimentally using the density and pressure gradients acquired from the PLIF and the PIV velocity field measurements, respectively. However, the uncertainty associated with this method was too large to ensure accuracy (details can be found in supplementary materials available at https://doi.org/10.1017/jfm.2023.165). Instead, the circulation of the baroclinic vorticity was calculated by locating the vorticity strand in the vicinity of the sharp density gradient (figure 2c). It is important to note that the vortex rings in this study are compact, i.e. the vortex structure has only one separatrix in the cross-sectional area, and there is no additional baroclinic vorticity generation at the inner side of the separatrix (figure 2b,c). According to Norbury (Reference Norbury1973) and Palacios-Morales & Zenit (Reference Palacios-Morales and Zenit2013), one can classify vortices depending on the value of  $\alpha$, which is defined as $\alpha ^2 = A / ({\rm \pi} R_v^2)$, where $A$ is the area of the vortex core and $R_v$ is the vortex mean radius. The value of $\alpha$ ranges from 0 to $\sqrt {2}$, where 0 corresponds to a skinny vortex and $\sqrt {2}$ corresponds to a spherical vortex. In this study, $\alpha$ is approximately 0.55, suggesting that the vortex ring is compact but not close to Hill's spherical vortex.
3. Results
3.1. Vortex ring crossing a density interface
Experiments were conducted using the upper and lower piston-cylinder arrangements in the water tank to produce isolated vortex rings propagating both upwards and downwards or against and along the density gradient (e.g. figures 3(a) and 3(b), respectively). In both cases, backflow was observed after the vortex ring crossed the interface, in which case some fluid inside the vortex ring was observed to flow back close to its original position (e.g. the last images of figure 3a,b). This observation is consistent with the experimental and numerical results from Dahm et al. (Reference Dahm, Scheil and Tryggvason1989) and Olsthoorn & Dalziel (Reference Olsthoorn and Dalziel2017). In this study, the authors observed that whenever a vortex ring crossed a fluid interface, the baroclinic production of vorticity peeled off the outer fluid layer of the vortex. Then, due to gravitational effects, this peeled-off layer was transported backward or opposite to the vortex travel direction, thereby creating a backflow once the vortex ring had fully crossed the interface. Also, as the backflow induces an instability of the Kelvin–Helmholtz type, a wavy or rolled-up structure is generated, as seen in figures 3(a) and 3(b). However, the backflow is much weaker in figure 3(b) than in figure 3(a), presumably due to differences in the direction of travel of each vortex.
Vortex ring crossing a density interface ( $Fr = 0.18, \Delta \rho ^*=0.004$). Representative case of a vortex ring moving towards a solution with lower (a) and higher (b) densities. Note that in (b), the images are flipped upside down and the pixel intensities are inverted for clarity. To compare the cases, the corresponding images in (a,b) share the same non-dimensional formation time, and $\Delta t U/D=2.5$. (c) Time evolution of the position and diameter of the vortex rings while crossing the interface. (d) Normalized maximum penetration depth, $y_m$, as a function of Froude number, $Fr$. Results are compared with relevant studies in the literature. The solid line fits the trend of the data in Linden (Reference Linden1973) with a slope of 1.
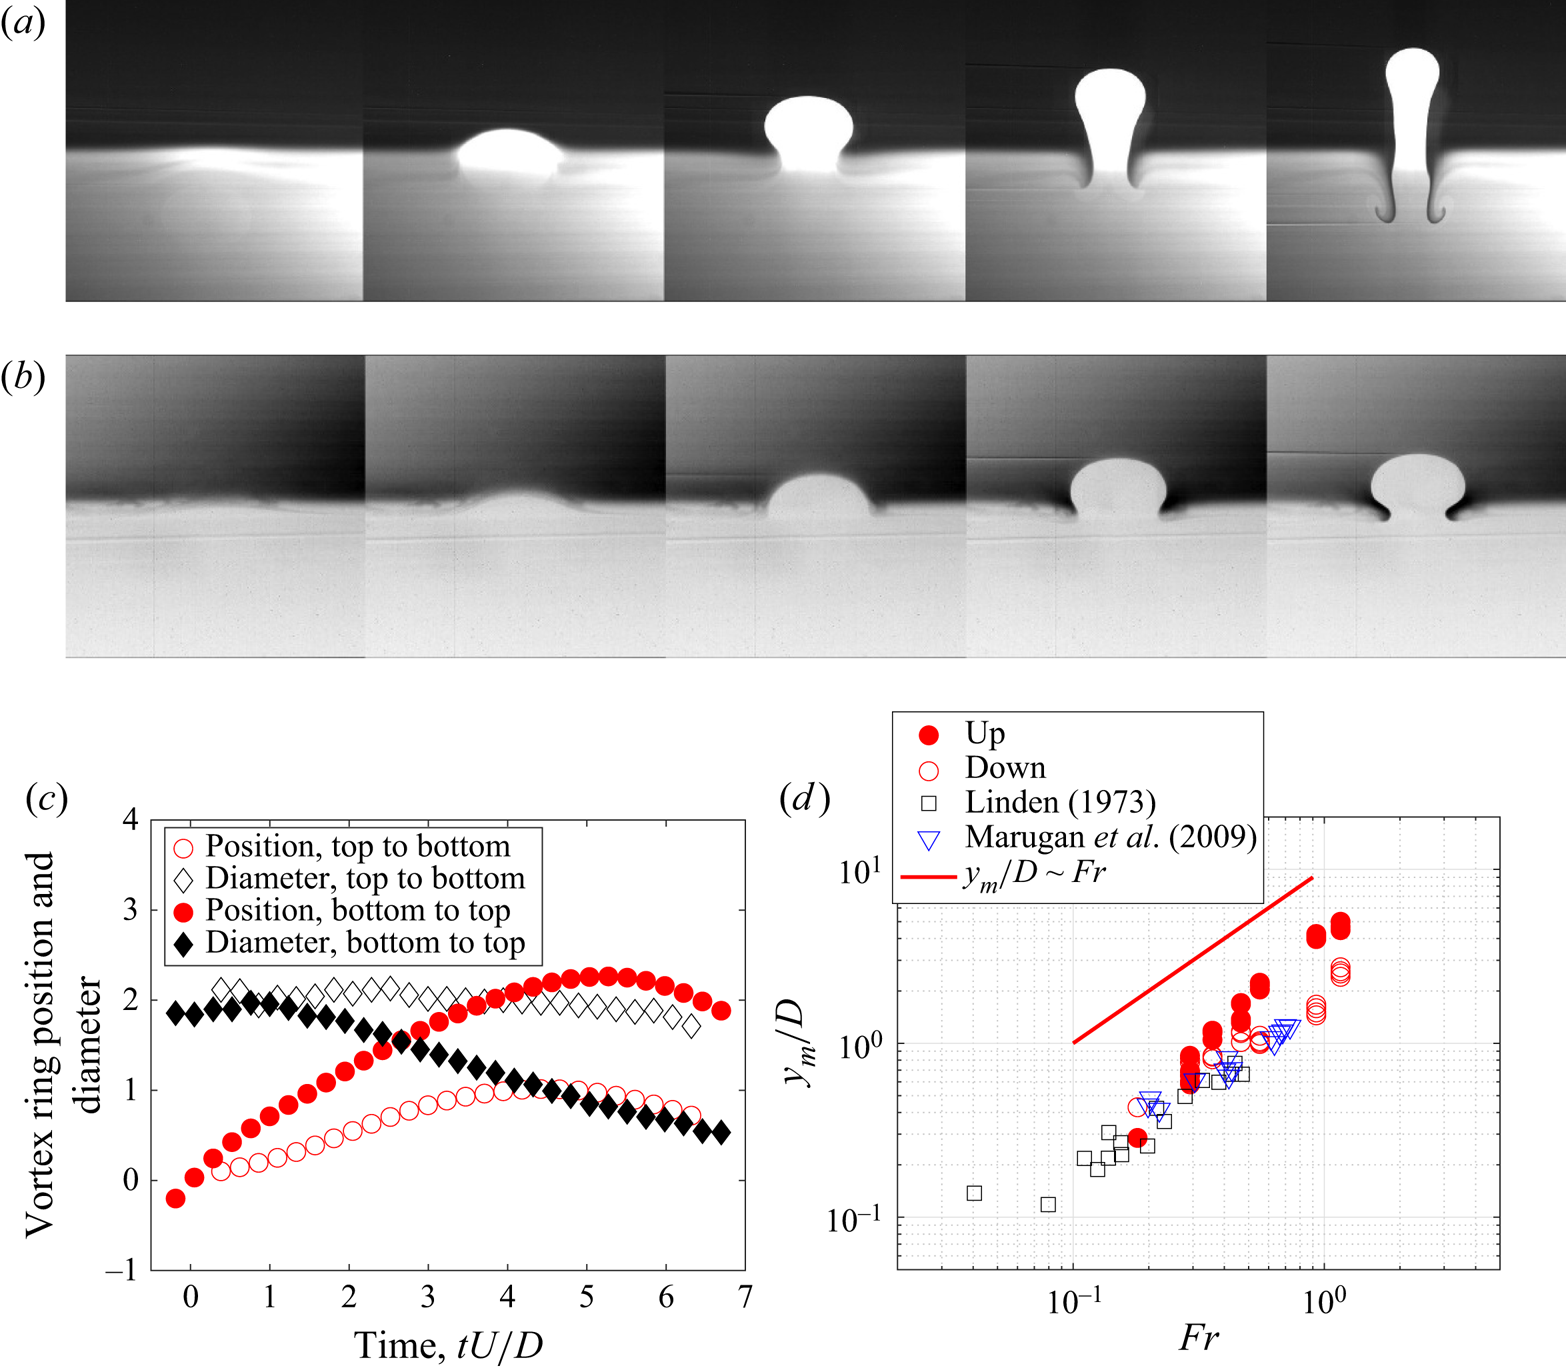
In the current study, the position and diameter of the vortex ring were tracked once the vortex ring crossed the interface between the two fluid layers (figure 3c). It was observed that the diameter of the vortex ring (solid diamond in figure 3c) decreases when crossing the interface to less dense fluids (figure 3a). This is likely due to the backflow and the peeling process, in line with the experimental work by Dahm et al. (Reference Dahm, Scheil and Tryggvason1989) and the theoretical prediction in (1.4). However, when the vortex ring crosses the interface to denser fluids (hollow diamonds in figure 3c), the diameter shrinking effect is smaller than that in the other direction (solid diamonds, bottom to top, figure 3c). In addition, the penetration depth of the ring (circles in figure 3c) also depends on the direction of travel of the vortex. It was found that the vortex penetrated deeper into the second layer when moving against the density gradient than when moving downward towards the denser fluid solution. The asymmetry in the process can be explained by focusing on the effect of the initial conditions on the generation of baroclinic vorticity as the vortex ring crosses the interface. This will be further discussed in § 4 using the pressure and density fields.
The same experiment was repeated for different density ratios (Froude number,  $Fr$) (table 1). The vortex positions were tracked, and the maximum penetration depths were computed and compared with results in the literature (figure 3d). Our experimental data (filled and empty red circles) is in good agreement with measurements reported in the literature, thereby validating our methodology. In particular, Linden (Reference Linden1973) reported that the slope of the best-fit curve was close to 1 (solid line in figure 3d).
3.2. Penetration depth and circulation
Experiments were repeated with different density ratios (Froude number,  $Fr$). The maximum penetration depth is identified and reported for each case (figure 4a). Even though our experimental results follow a general trend as reported in the literature, the curves of maximum penetration distance do not overlap. At a given Froude number, the vortex ring moving towards a less dense fluid layer attains a longer penetration depth (solid circles) than if moving towards a denser fluid solution. This is consistent with what has been observed in § 3.1, corroborating the inherent asymmetry in the vortex ring motion across a density interface.
Asymmetry of motion. (a) Normalized maximum penetration distance,  $y_m$, as a function of Froude number, $Fr$. Empty and filled symbols show experimental results for vortex rings moving along and against the density gradient, respectively. The solid and dashed lines are the best fit for each data group. (b) Normalized circulation, $\varGamma /\varGamma _o$, where $\varGamma_o$ is the maximum circulation of the main vortex ring, as a function of dimensionless time for both cases ( $\rho = 1005\ {\rm kg}\ {\rm m}^{-3}$ in table 1). Similar to (a), empty and filled symbols correspond to vortex rings moving downwards and upwards, respectively. Squares denote the value of the circulation of the main vortex ring, while the circles correspond to the circulation associated with baroclinic vorticity.
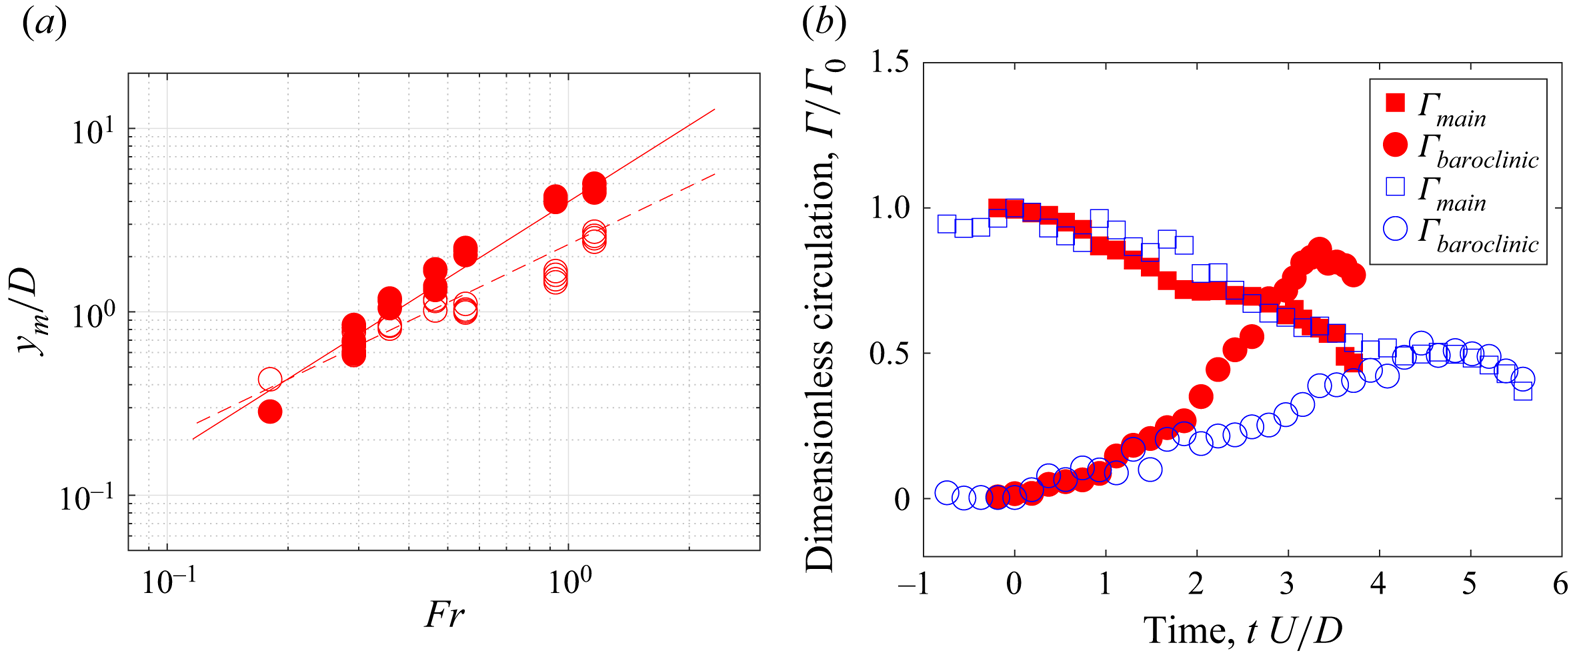
To understand the vortex propagation asymmetry, the circulation of the main vortex ring is examined along with the circulation associated with the baroclinic vorticity generated at the density interface (e.g. figure 2b,c). The evolution of circulation for the main vortex ring (squares) and the baroclinic vorticity (circles) once the vortex ring crosses the density interface is presented in figure 4(b). Independent of the travel direction, the circulation of the main vortex ring decreases when crossing the density interface, which is in line with the peeling effects discussed in § 3.1. In contrast, the circulation of the baroclinic vorticity (circles) increases when the vortex ring crosses the density interface. It is to be noted that the baroclinic circulation associated with the upward-travelling vortex ring (filled circles in figure 4b) reaches its maximum much sooner and attains a much higher value than the downward-travelling vortex ring (empty circles in figure 4b). The high baroclinic circulation of the upward-travelling vortex ring is assumed to induce a stronger backflow at the density interface (figure 3a), leading to a stronger peeling effect and thus resulting in a smaller vortex ring diameter, which is supported by the observations in figure 3(a,b). Therefore, a smaller drag force is expected for the upward vortex ring, given its smaller diameter, resulting in a greater penetration depth maximum than for the case of a bigger downward-moving vortex ring.
4. Further analysis and discussion
From Marshall & Plumb (Reference Marshall and Plumb2016), the vorticity conservation equation for a fluid with a non-uniform density is
 \begin{equation} \frac{\partial \boldsymbol{\omega}}{\partial t}+(\boldsymbol{v} \boldsymbol{\cdot} \boldsymbol{\nabla}) \boldsymbol{\omega}=(\boldsymbol{\omega}\boldsymbol{\cdot}\boldsymbol{\nabla})\boldsymbol{ v}-\boldsymbol{\omega}(\boldsymbol{\nabla}\boldsymbol{\cdot}\boldsymbol{v})+\nu \nabla^2\boldsymbol{\omega}+\frac{1}{\rho^2}\left(\boldsymbol{\nabla}\rho\times\boldsymbol{\nabla} P\right), \end{equation}
where  $\boldsymbol {\omega }$ is vorticity, $\boldsymbol {v}$ is velocity, $\nu$ is kinematic viscosity, $\rho$ is density and $P$ is pressure. For an axisymmetric flow, the first term on the right-hand side vanishes. For an incompressible fluid flow, the second term on the right-hand side is also zero. Therefore, neglecting viscous effects, on either side of the interface gives
 \begin{equation} \frac{{\rm D} \boldsymbol{\omega}}{{\rm D} t}=\frac{1}{\rho^2}\left(\boldsymbol{\nabla}\rho\times\boldsymbol{\nabla} P\right). \end{equation}
 Considering the axisymmetry of vortex rings, integrating (4.2) over half the cross-sectional region of the vortex ring and the associated induced flow (as shown in figure 2c) gives the rate of change of circulation,  $\varGamma _b$,
 \begin{equation} \frac{{\rm D} \varGamma_{b}}{{\rm D} t}=\int_S\frac{1}{\rho^2}\left(\boldsymbol{\nabla}\rho\times\boldsymbol{\nabla} P\right){\rm d}\boldsymbol{S}, \end{equation}
where  ${\rm d}\boldsymbol {S}$ is a surface element vector in half the cross-sectional region of the vortex ring and the associated induced flow (as shown in figure 2c). Equation (4.3) shows that the rate of change of circulation is related to the cross product of the density and pressure gradients at the density interface.
Figure 5 includes a schematic showing the orientation of the density and the pressure gradients as the vortex ring crosses the interface (solid blue line). While the orientation of the pressure gradient is independent of the direction of travel of the vortex ring, the density gradients between the two cases are flipped by  $180^{\circ }$, $\Delta \rho ^*_{12} = -\Delta \rho ^*_{21}$, depending on whether the vortex ring travels towards a denser or lighter fluid layer. Therefore, from (4.2), the baroclinic vorticity generated at the density interface has opposite signs, resulting in different contributions to the circulation: one increasing and the other decreasing. Specifically, to the right of the vortex ring, the cross product of the density and the pressure gradients is positive for the upward penetration (figure 5a) but negative for the downward penetration (figure 5b), suggesting that the total vorticity generated at the density interface is larger for the upward than for the downward penetration case. This trend is consistent with the circulation evolution plot in figure 4(b).
Schematic of the physical process causing asymmetry in vortex ring penetration depth. Panels (a,b) show the vortex ring crossing from below and above the interface, respectively. The pressure gradient is the same for both cases ( $\boldsymbol {\nabla } P_1 = \boldsymbol {\nabla } P_2$). However, the density gradient is different between the two cases ( $\boldsymbol {\nabla }\rho _1 = - \boldsymbol {\nabla }\rho _2$). Thus, considering (4.2) the contribution to baroclinic vorticity production is different: one is positive and the other is negative. (a) Crossing from high to low density. (b) Crossing from low to high density.

Finally, it is worth noting that the generation of baroclinic vorticity and the observed difference in the maximum penetration depth of translating vortices in this study are important from an ecological standpoint. While so-called Darwinian drift has been identified as a successful large-scale transport mechanism with potentially far-reaching implications, studies rarely include the effect of migrating direction relative to ocean stratification. Our study suggests that the swimming direction of self-propelled mesozooplankton may have important consequences for the vertical transport of nutrients, carbon and oxygen across stable density gradients. Taking this into account, from the individual-organism level, the thrust force produced by an organism will likely depend on the swimming direction with respect to the stratification, which may affect organism behaviours in activities such as feeding, preying and escaping. Likewise, the amount of induced biogenic transport will also depend on the direction in which the organism travels relative to the ocean density gradient. For instance, consider a jellyfish swimming through a stratified fluid, the hydrodynamic forces on the organism and the induced mixing can be expected to differ depending on whether it swims upwards or downwards, even if the jellyfish pumps at the same rate. From the swarm-organism level, those differences inherent from the individual level may become significant during collective motion, such as the diel vertical migrations of aggregations, resulting in different amounts of transport depending on the swimming direction relative to the stratification. Including these differences in either regional or global modelling efforts will be necessary to accurately understand the role of organisms as ecosystem engineers.
5. Conclusion
In this study, we performed experiments to quantify the kinematics of a vortex ring crossing the fluid interface of a stable two-layer stratified system. Focus was given to the differences arising from the orientation of the vortex travel direction relative to the density gradient. The maximum penetration depth of the vortex ring crossing a density interface was measured and validated with relevant literature. It was found that the evolution of the vortex ring position, size and the maximum penetration depth differ with respect to the penetration direction (along or against the density gradient). This difference can be attributed to the asymmetry in the generation of baroclinic vorticity due to the orientation of the density and pressure gradients at the density interface. It was found that a greater maximum penetration depth is associated with a stronger baroclinic vorticity. Specifically, the higher circulation of the baroclinic vorticity in the upward penetration motion leads to a stronger peeling effect on the vortex ring, resulting in a smaller vortex ring size and a smaller drag in the penetration process, which contributes to the larger maximum penetration depth. Finally, while the vortex ring penetration of density interfaces was studied only in the vertical direction, we hypothesize that similar asymmetry can also be observed with the vortex ring penetrating the density interface at an oblique angle or with the vortex ring travelling in a continuously stratified fluid. Going forward, we plan to leverage our findings to improve the characterization of marine ecosystems in global ocean circulation models. While the hydrodynamic signature of migrating mesozooplankton aggregations have just started to get analysed, symmetry of fluid motion is usually assumed, having important consequences for the net amount of biogenic induced transport of oxygen, carbon and nutrients.
Supplementary material
Supplementary material is available at https://doi.org/10.1017/jfm.2023.165.
Acknowledgements
R.Z. is grateful to the Fulbright-Garca Robles Foundation and PASPA-DGAPA-UNAM for financial support during his sabbatical year at Caltech. M.M.W. thanks J. Dabiri for insightful discussions during her years at Caltech. Y.S. and M.M.W. were partially funded by the National Aeronautics and Space Administration Ocean Biology and Biogeochemistry Program (80NSSC22K0284).
Funding
This work was supported by the Fulbright-Garca Robles Foundation and PASPA-DGAPA-UNAM (R.Z.) and the National Aeronautics and Space Administration Ocean Biology and Biogeochemistry Program (Y.S. and M.M.W., grant number 80NSSC22K0284).
Declaration of interests
The authors report no conflict of interest.


 Open access

