


Introduction
Mental disorders are increasingly recognized as leading contributors to the burden of disease, with depression and anxiety as two of the most disabling conditions [1]. Depression and anxiety are highly prevalent across the life course, and women are twice as likely as men to experience these conditions [Reference Malhi and Mann2, Reference Craske and Stein3]. Previous studies have shown that depression and anxiety are not only associated with various physical morbidities and reduced quality of life [Reference Fleetwood, Guthrie, Jackson, Kelly, Mercer and Morales4–Reference Hohls, König, Quirke and Hajek6], but also negatively affect family interactions, placing significant physical and psychosocial burdens on other family members [Reference Senaratne, Van Ameringen, Mancini and Patterson7, Reference Wong, Frost, Timko, Heinz and Cronkite8]. Traditionally, depression and anxiety have been considered internalized disorders with unclear mechanisms [Reference Malhi and Mann2, Reference Craske and Stein3]. Recent research further indicates that family history constitutes one of the strongest risk factors for depression and anxiety, often associated with more severe symptoms, greater disease burden, and other unfavorable clinical characteristics [Reference van Sprang, Maciejewski, Milaneschi, Elzinga, Beekman and Hartman9].
Epidemiological studies on intergenerational association and familial aggregation have shown that mental disorders, including depression and anxiety, are heritable and tend to co-occur within families. An early nationally representative US study showed strong familial aggregation of major depressive disorder (MDD) and generalized anxiety disorder, with offspring of affected parents having 88 and 75% higher odds of corresponding symptoms, respectively [Reference Kendler, Davis and Kessler10]. Similarly, a Dutch study indicated that depression and anxiety in first-degree relatives were associated with increased recurrence risk ratios for both within-domain and cross-domain symptoms in participants [Reference Wang, Snieder and Hartman11]. Another study from Sweden on MDD and anxiety further showed the strongest intergenerational associations among generations who shared both genetic and rearing relationships [Reference Kendler, Abrahamsson, Ohlsson, Sundquist and Sundquist12].
Notably, the intergenerational association of mental disorders has been reported to be stronger among female family members [Reference Landman-Peeters, Ormel, Van Sonderen, Den Boer, Minderaa and Hartman13–Reference Fang, Yu, Zhi, Xi, Peng and Cai15]. For example, evidence from China found that female offspring with MDD were more frequently paired with MDD-affected mothers than with MDD-affected fathers or male counterparts [Reference Fang, Yu, Zhi, Xi, Peng and Cai15]. In addition, previous studies have mainly focused on intergenerational mental health associations in children and adolescents in relation to perinatal factors or family history [Reference Goodman, Rouse, Connell, Broth, Hall and Heyward16–Reference Goodman21]. Although some have examined parental mental health in adult offspring, they do not capture the concurrent manifestation of mental health problems across generations within adult families [Reference Brummelhuis, Kop and Videler22]. These gaps are particularly relevant in the Chinese context. Women born during the era of the one-child policy may have grown up in smaller family units, experienced stronger emotional dependence in childhood [Reference Liu and Jiang23], and become the primary source of emotional support for aging parents in adulthood [Reference Kwete, Knaul, Essue, Touchton, Arreola-Ornelas and Langer24, Reference Chen, Zhuoga and Deng25]; such long-term close intergenerational bonds may make them more susceptible to their mothers’ emotional states [Reference Polenick, Kim, DePasquale, Birditt, Zarit and Fingerman26, Reference Brown, Grimm, Wells, Hua and Levenson27].
Most studies have relied on registry-based data, where diagnosed cases are typically more severe, potentially underestimating the true prevalence and introducing selection bias [Reference Wang, Snieder and Hartman11, Reference Kendler, Abrahamsson, Ohlsson, Sundquist and Sundquist12, Reference Gronemann, Jacobsen, Wium-Andersen, Jørgensen, Osler and Jørgensen28]. Besides, prior studies often relied on proxy reports from the interviewees to assess the mental disorders of family members, which could introduce reporting bias [Reference Merikangas, Cui, Heaton, Nakamura, Roca and Ding29]. Therefore, this study aimed to examine the intergenerational associations of depression and anxiety in adult females. We hypothesized that: (1) depression and anxiety would show both within-domain and cross-domain intergenerational associations, with dose–response relationships; and (2) these associations might vary by sociodemographic characteristics.
Methods
Study design and participants
This cross-sectional study was conducted as part of the Grandmothers, Mothers, and Their Children’s Health (GMATCH) study, which collected data from three generations of women within families in Huai’an City, China. Initially, 27,923 women who gave birth in Huai’an City between July 1, 2020, and June 30, 2021, were identified as eligible for participation through the Maternity Information System, which covers more than 99.5% of all registered pregnancies. These women (G1, the maternal generation), their mothers (G0, the grandmaternal generation), and children (G2, the offspring generation) were invited to participate in the GMATCH cohort as family units in 2023. As of December 2023, a random sample of 2,242 families had been enrolled in the cohort. Trained interviewers collected information on demographics, lifestyle factors, and health status using face-to-face interviews and implemented a rigorous quality control process to ensure data quality. More details about GMATCH can be found elsewhere [Reference Cheng, Ding, Zhang, Wang, Zhu and Xu30, Reference Wang, Zhang, Ding, Dai, Zhu and Xu31]. This study was approved by the Ethics Committee of Huai’an Maternal and Child Health Care Hospital Affiliated to Yangzhou University (No: 2021060). All participants provided written informed consent.
In the present study, two generations in grandmother-mother (G0-G1) dyads from the GMATCH were included as the study population (n = 2,242 dyads). We further excluded 112 dyads with missing covariate information, resulting in a final analytical sample of 2,130 dyads (Supplementary Figure S1). This study adheres to the Strengthening the Reporting of Observational Studies in Epidemiology (STROBE) guidelines.
Assessment of depression and anxiety
Depression was assessed using the 10-item version of the Center for Epidemiologic Studies Depression Scale (CESD-10), and anxiety was assessed using the 7-item Generalized Anxiety Disorder Scale (GAD-7), in both G0 and G1 [Reference Andresen, Malmgren, Carter and Patrick32–Reference Gong, Zhou, Zhang, Zhu, Wang and Shen35]. Each self-reported item of the CESD-10 and GAD-7 ranges from 0 (rarely or none of the time) to 3 (most or all of the time), with total scores ranging from 0 to 30 for the CESD-10 and 0 to 21 for the GAD-7. Supplementary Table S1 provides a detailed description of each item. Higher scores represent more severe depressive and anxiety symptoms. Depression and anxiety were defined as CESD-10 and GAD-7 scores ≥10, respectively [Reference Yu, Lin and Hsu34, Reference Gong, Zhou, Zhang, Zhu, Wang and Shen35]. In addition, based on previous studies, scores below 10 were further divided into 0–4 and 5–9 to capture heterogeneity within the non-case range and to examine whether subthreshold symptom severity was related to intergenerational associations, and to provide a basis for subsequent dose–response analyses [Reference Spitzer, Kroenke, Williams and Löwe33, Reference Tsai, Hsiao, Liao and Lee36].
Covariates
Based on previous studies on the intergenerational association and familial aggregation of mental disorders [Reference Gronemann, Jacobsen, Wium-Andersen, Jørgensen, Osler and Jørgensen28, Reference Jaffee, Sligo, McAnally, Bolton, Baxter and Hancox37, Reference Liang, Bai, Hsu, Huang, Ko and Yeh38], covariates in the present study included the age, educational level (G0: uneducated, incomplete primary school, primary school, senior high school or above; G1: junior high school or below, senior high school, junior college, undergraduate or above), household income (categorized into quartiles), employment status (employed versus unemployed/self-employed/other), place of residence (urban versus rural) for both G0 and G1, and cohabitation status between G0 and G1.
Statistical analysis
The characteristics of the G0 and G1 were summarized as mean ± standard deviation (SD) for continuous variables and frequency (percentage) for categorical variables according to the depression and anxiety status of G0 and G1. The distributions of CESD-10 and GAD-7 scores in G1 were summarized as median (quartile 1, quartile 3) and visualized using density plots by depression and anxiety in G0. Differences between groups were compared using the Student’s t-test, Mann–Whitney U test, or Chi-square test, as appropriate.
Multivariable logistic regression models were used to estimate odds ratios (ORs) and 95% confidence intervals (CIs) for within-domain and cross-domain intergenerational associations of depression and anxiety between the grandmaternal and maternal generations. Given the interest in symptom severity, multivariable negative binomial regression models were used to estimate prevalence ratios (PRs) and 95% CIs for within-domain and cross-domain intergenerational associations of CESD-10 scores and GAD-7 scores. Two models were fitted for both the logistic and negative binomial regressions. Model 1 was unadjusted, and Model 2 was adjusted for age, educational level, household income, employment status, and place of residence in both generations. Variance inflation factors (VIFs) were used to assess multicollinearity. All VIF values for the independent variables were less than 3, suggesting no evidence of multicollinearity [Reference Kim39].
Restricted cubic splines (RCS) were used to explore potential nonlinear associations. Considering the highly right-skewed distributions of CESD-10 and GAD-7 scores and their clinical relevance, we prespecified knots at scores of 0, 5, 10, and 15, and used the Akaike information criterion to determine the optimal number and locations of knots [Reference Harrell40]. Ultimately, four knots were selected to investigate the nonlinear intergenerational associations of depressive symptom severity, and three knots (at GAD-7 scores of 0, 5, and 10) were selected to examine the nonlinear intergenerational associations of anxiety symptom severity.
We conducted subgroup analyses to assess whether within-domain and cross-domain intergenerational associations of depression and anxiety varied by age group, educational level, household income, employment status, place of residence, and cohabitation status. The interactive effects were tested by performing likelihood ratio tests [Reference Nahhas41].
All analyses were performed using R software (version 4.4.0). A two-sided P < 0.05 was considered statistically significant.
Results
Characteristics of the participants
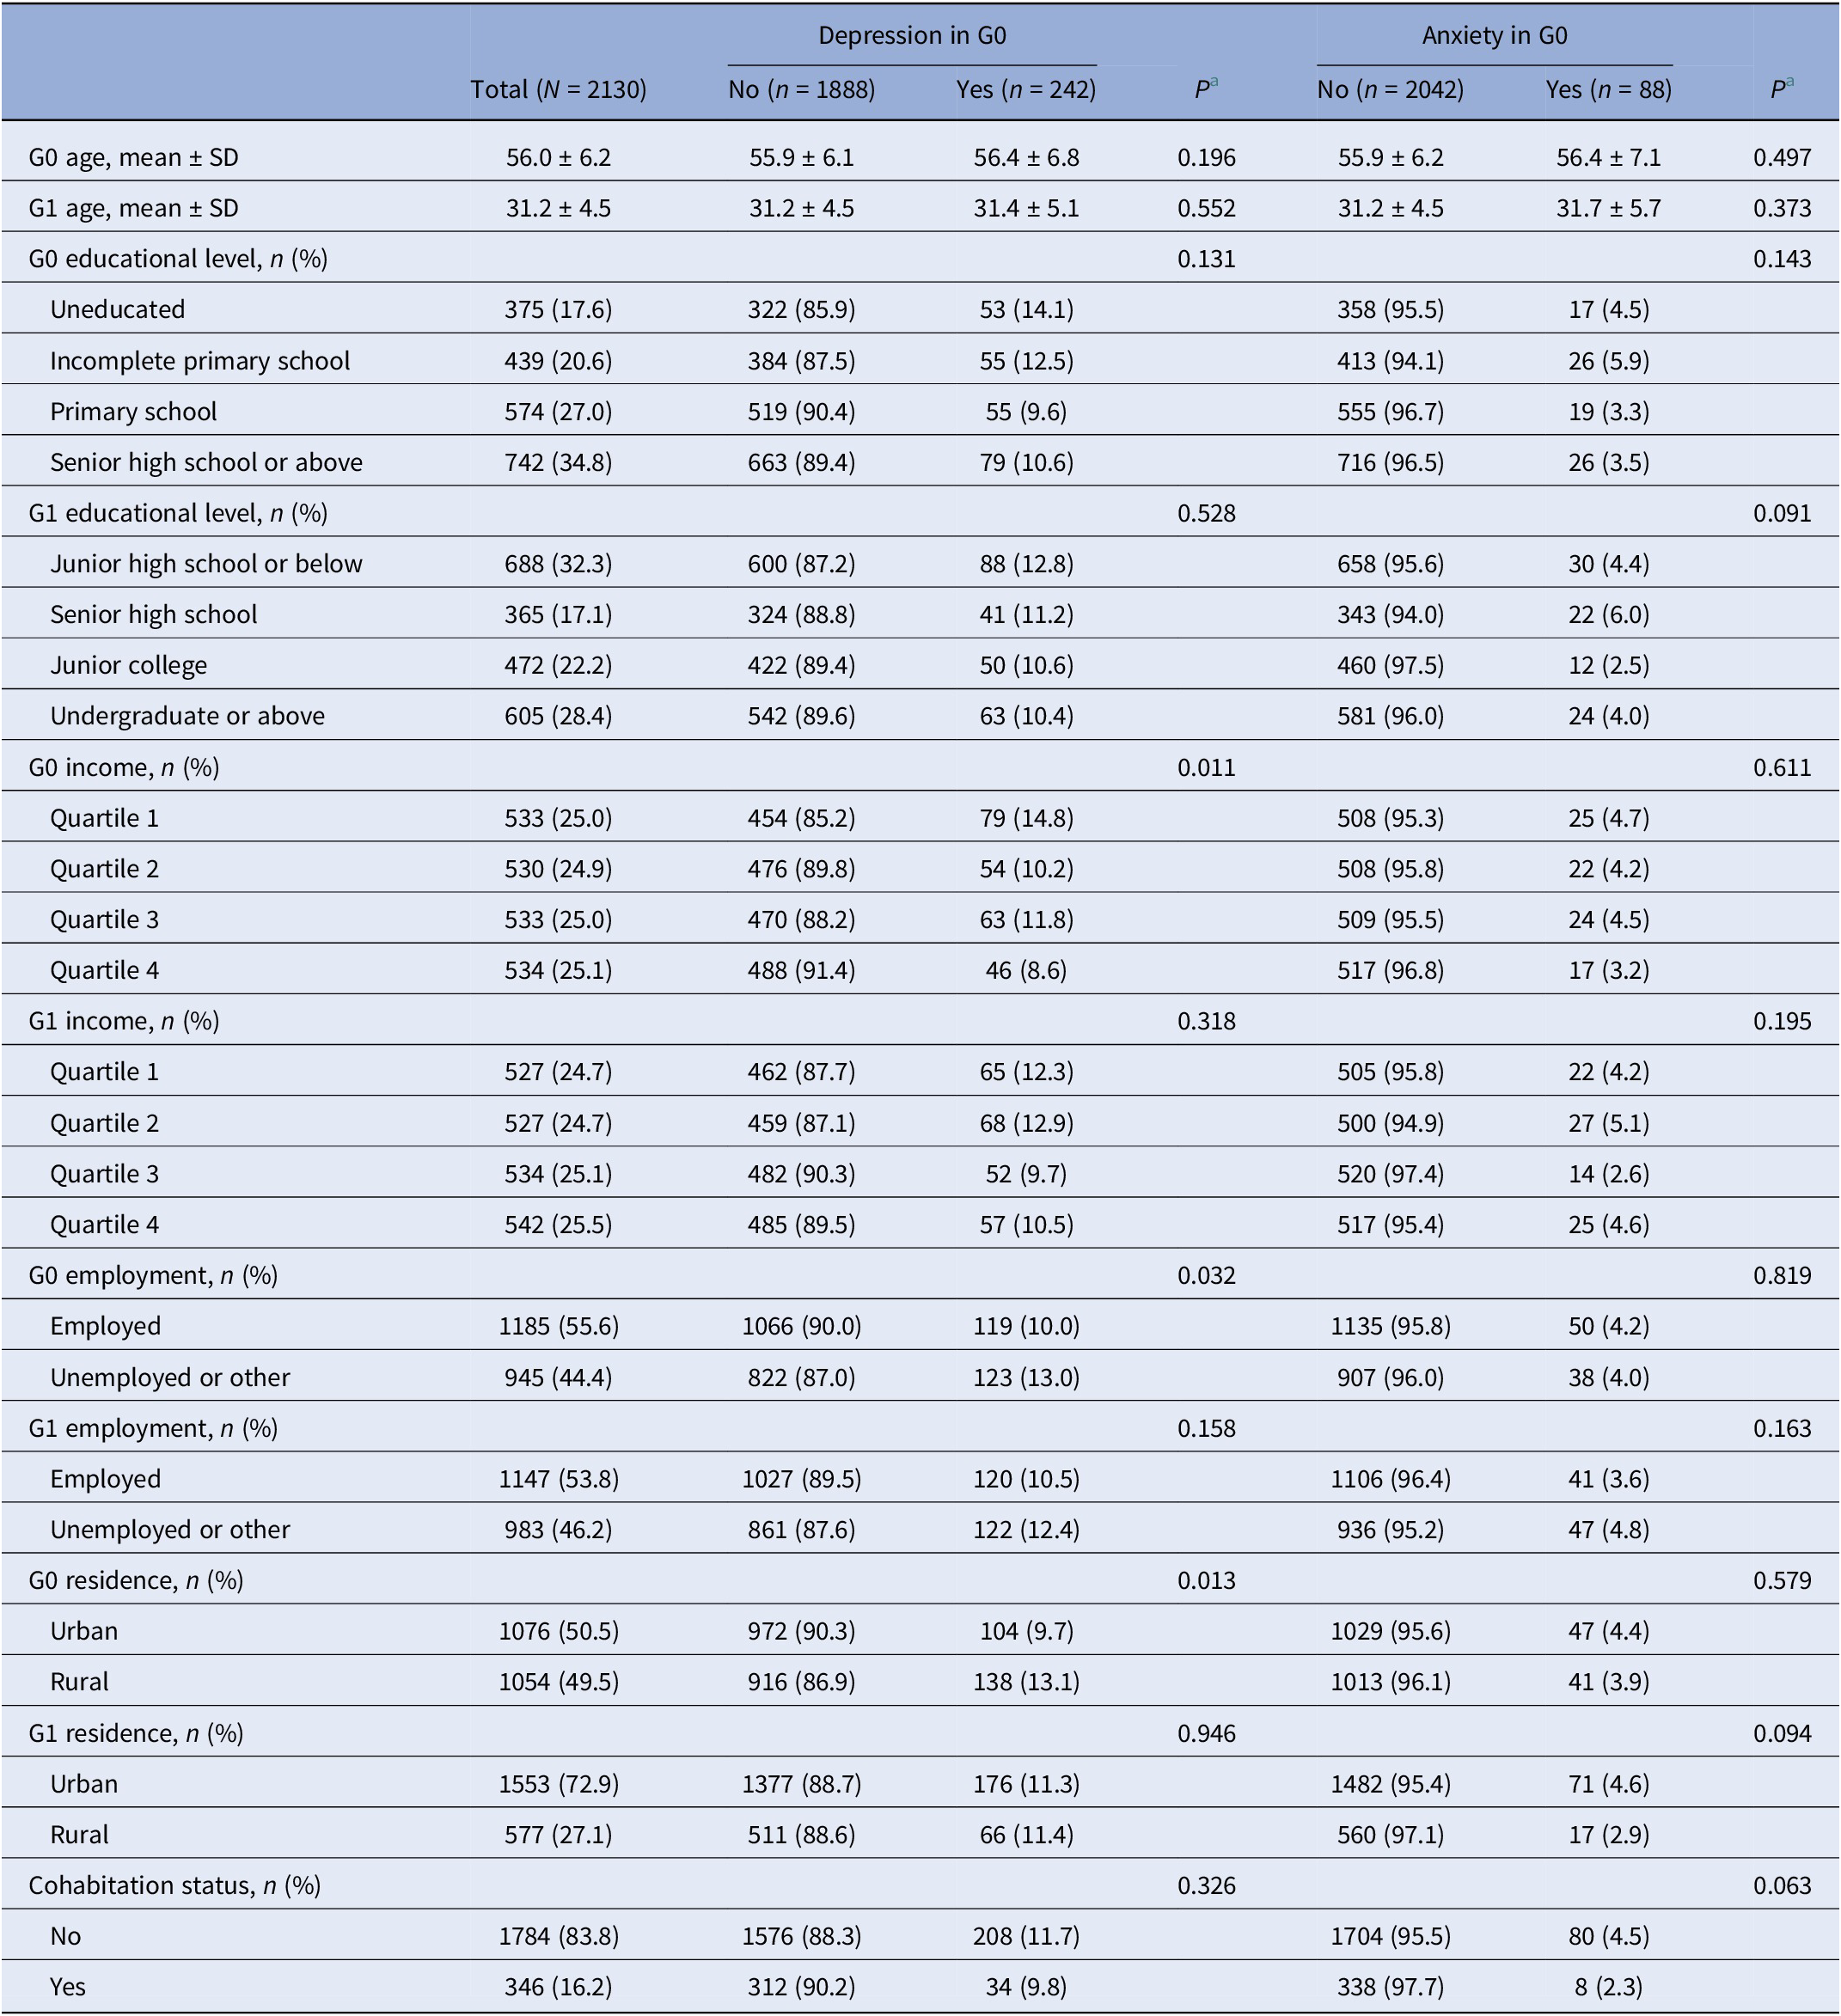
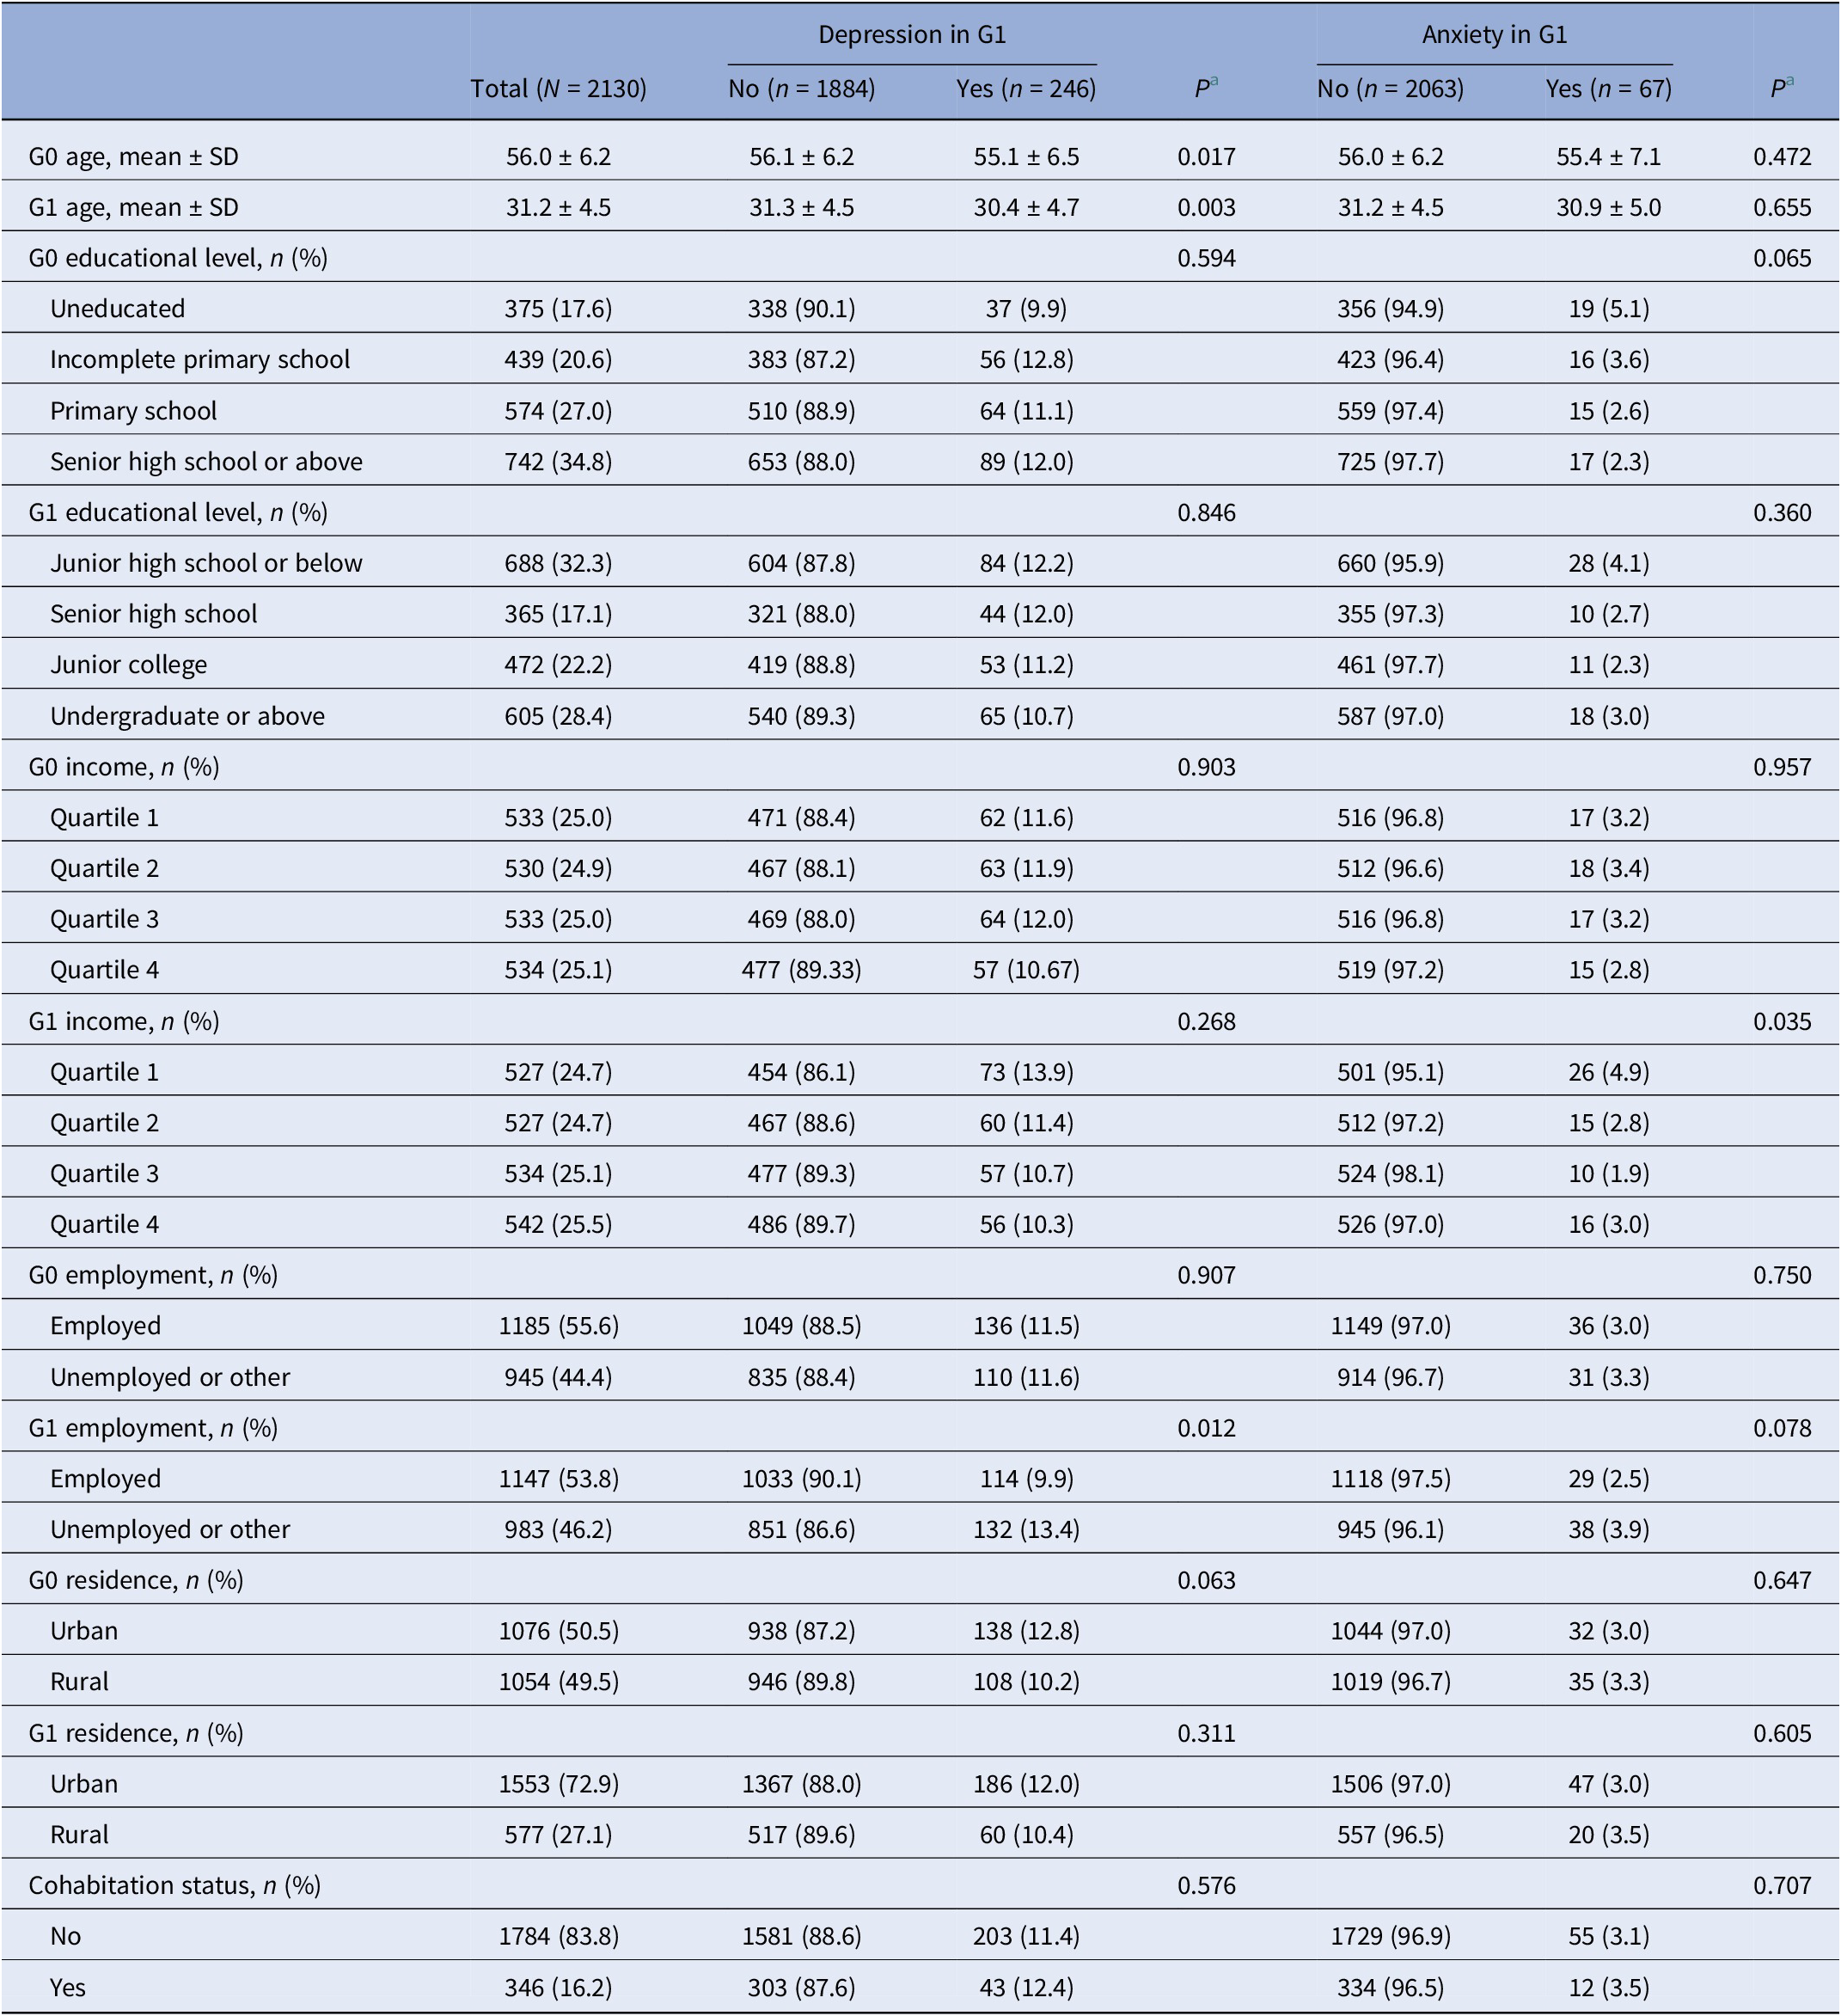
We included 2,130 G0-G1 dyads to investigate the intergenerational associations of depression and anxiety. The characteristics of the participants according to the depression and anxiety status of G0 and G1 are summarized in Tables 1 and 2. Among G0 participants, 242 (11.4%) experienced depression, and 88 (4.1%) experienced anxiety. The mean (SD) age of G0 participants was 56.0 (6.2) years. G0 participants with depression were more likely to have lower household income, be unemployed, and reside in rural areas. A total of 246 (11.5%) G1 participants reported depression, and 67 (3.1%) reported anxiety. The mean (SD) age of G1 was 31.2 (4.5) years. G1 participants with depression were more likely to be younger, have younger mothers, and be unemployed, while those with anxiety were more likely to be from lower-income groups. Supplementary Figure S2 shows the distributions of CESD-10 and GAD-7 scores in G1 according to depression or anxiety status in G0. G1 participants whose G0 counterparts reported depression or anxiety had higher depression and anxiety symptom scores.
Baseline characteristics of the grandmaternal (G0) and maternal (G1) generation according to depression and anxiety of the grandmaternal generation (G0)

[Table 1] Long description
The table has eight columns. The first column lists variables for G0 (grandmaternal) and G1 (maternal) generations, including age, education, income, employment, residence, and cohabitation status. The second column shows total values for all participants N equals 2130. The next two columns subdivide by depression in G0, with counts for No n equals 1888 and Yes n equals 242, followed by a P value. The next two columns subdivide by anxiety in G0, with counts for No n equals 2042 and Yes n equals 88, followed by a P value. For each variable, corresponding means with standard deviations or counts with percentages are provided. For example, G0 age mean plus or minus S D is 56.0 plus or minus 6.2 overall, 55.9 plus or minus 6.1 for no depression, 56.4 plus or minus 6.8 for depression, P equals 0.196. G1 age mean plus or minus S D is 31.2 plus or minus 4.5 overall, 31.2 plus or minus 4.5 for no depression, 31.4 plus or minus 5.1 for depression, P equals 0.552. Educational levels are shown in categories such as uneducated, incomplete primary school, primary school, and senior high school or above, with counts and percentages for each depression and anxiety group. Income is divided into quartiles, with similar breakdowns. Employment is categorized as employed or unemployed or other. Residence is urban or rural. Cohabitation status is yes or no. P values are provided for each comparison, with the lowest P values for G0 income (0.011), G0 employment (0.032), and G0 residence (0.013) in the depression columns, indicating significant differences. Abbreviations are defined as G0 for grandmaternal generation and G1 for maternal generation. P values were calculated by t-tests or chi-square test as appropriate.
Abbreviations: G0, the grandmaternal generation; G1, the maternal generation.
a P values were calculated by t-tests or chi-square test when appropriate.
Baseline characteristics of the grandmaternal (G0) and maternal (G1) generations according to depression and anxiety in the maternal generation (G1)

[Table 2] Long description
Starting from the top, the table lists variables in the leftmost column, with data for total sample, then splits by depression in G1 (no n=1884, yes n=246, P value), and anxiety in G1 (no n=2063, yes n=67, P value). For G0 age, mean ± SD is 56.0 ± 6.2 overall, 56.1 ± 6.2 for no depression, 55.1 ± 6.5 for yes, P=0.017; 56.0 ± 6.2 for no anxiety, 55.4 ± 7.1 for yes, P=0.472. G1 age, mean ± SD is 31.2 ± 4.5 overall, 31.3 ± 4.5 for no depression, 30.4 ± 4.7 for yes, P=0.003; 31.2 ± 4.5 for no anxiety, 30.9 ± 5.0 for yes, P=0.655. G0 educational level is subdivided into uneducated, incomplete primary, primary, and senior high or above, with percentages and counts for each depression/anxiety group. For example, uneducated: 375 (17.6%) total, 338 (90.1%) no depression, 37 (9.9%) yes; 356 (94.9%) no anxiety, 19 (5.1%) yes. Similar breakdowns are provided for G1 educational level, G0 and G1 income (quartiles 1-4), G0 and G1 employment (employed, unemployed/other), G0 and G1 residence (urban, rural), and cohabitation status (no, yes). P values are provided for each variable for depression and anxiety comparisons. Abbreviations: G0 is grandmaternal generation, G1 is maternal generation. P values calculated by t-tests or chi-square test as appropriate.
Abbreviations: G0, the grandmaternal generation; G1, the maternal generation.
a P values were calculated by t-tests or chi-square test when appropriate.
Intergenerational associations of depression and anxiety
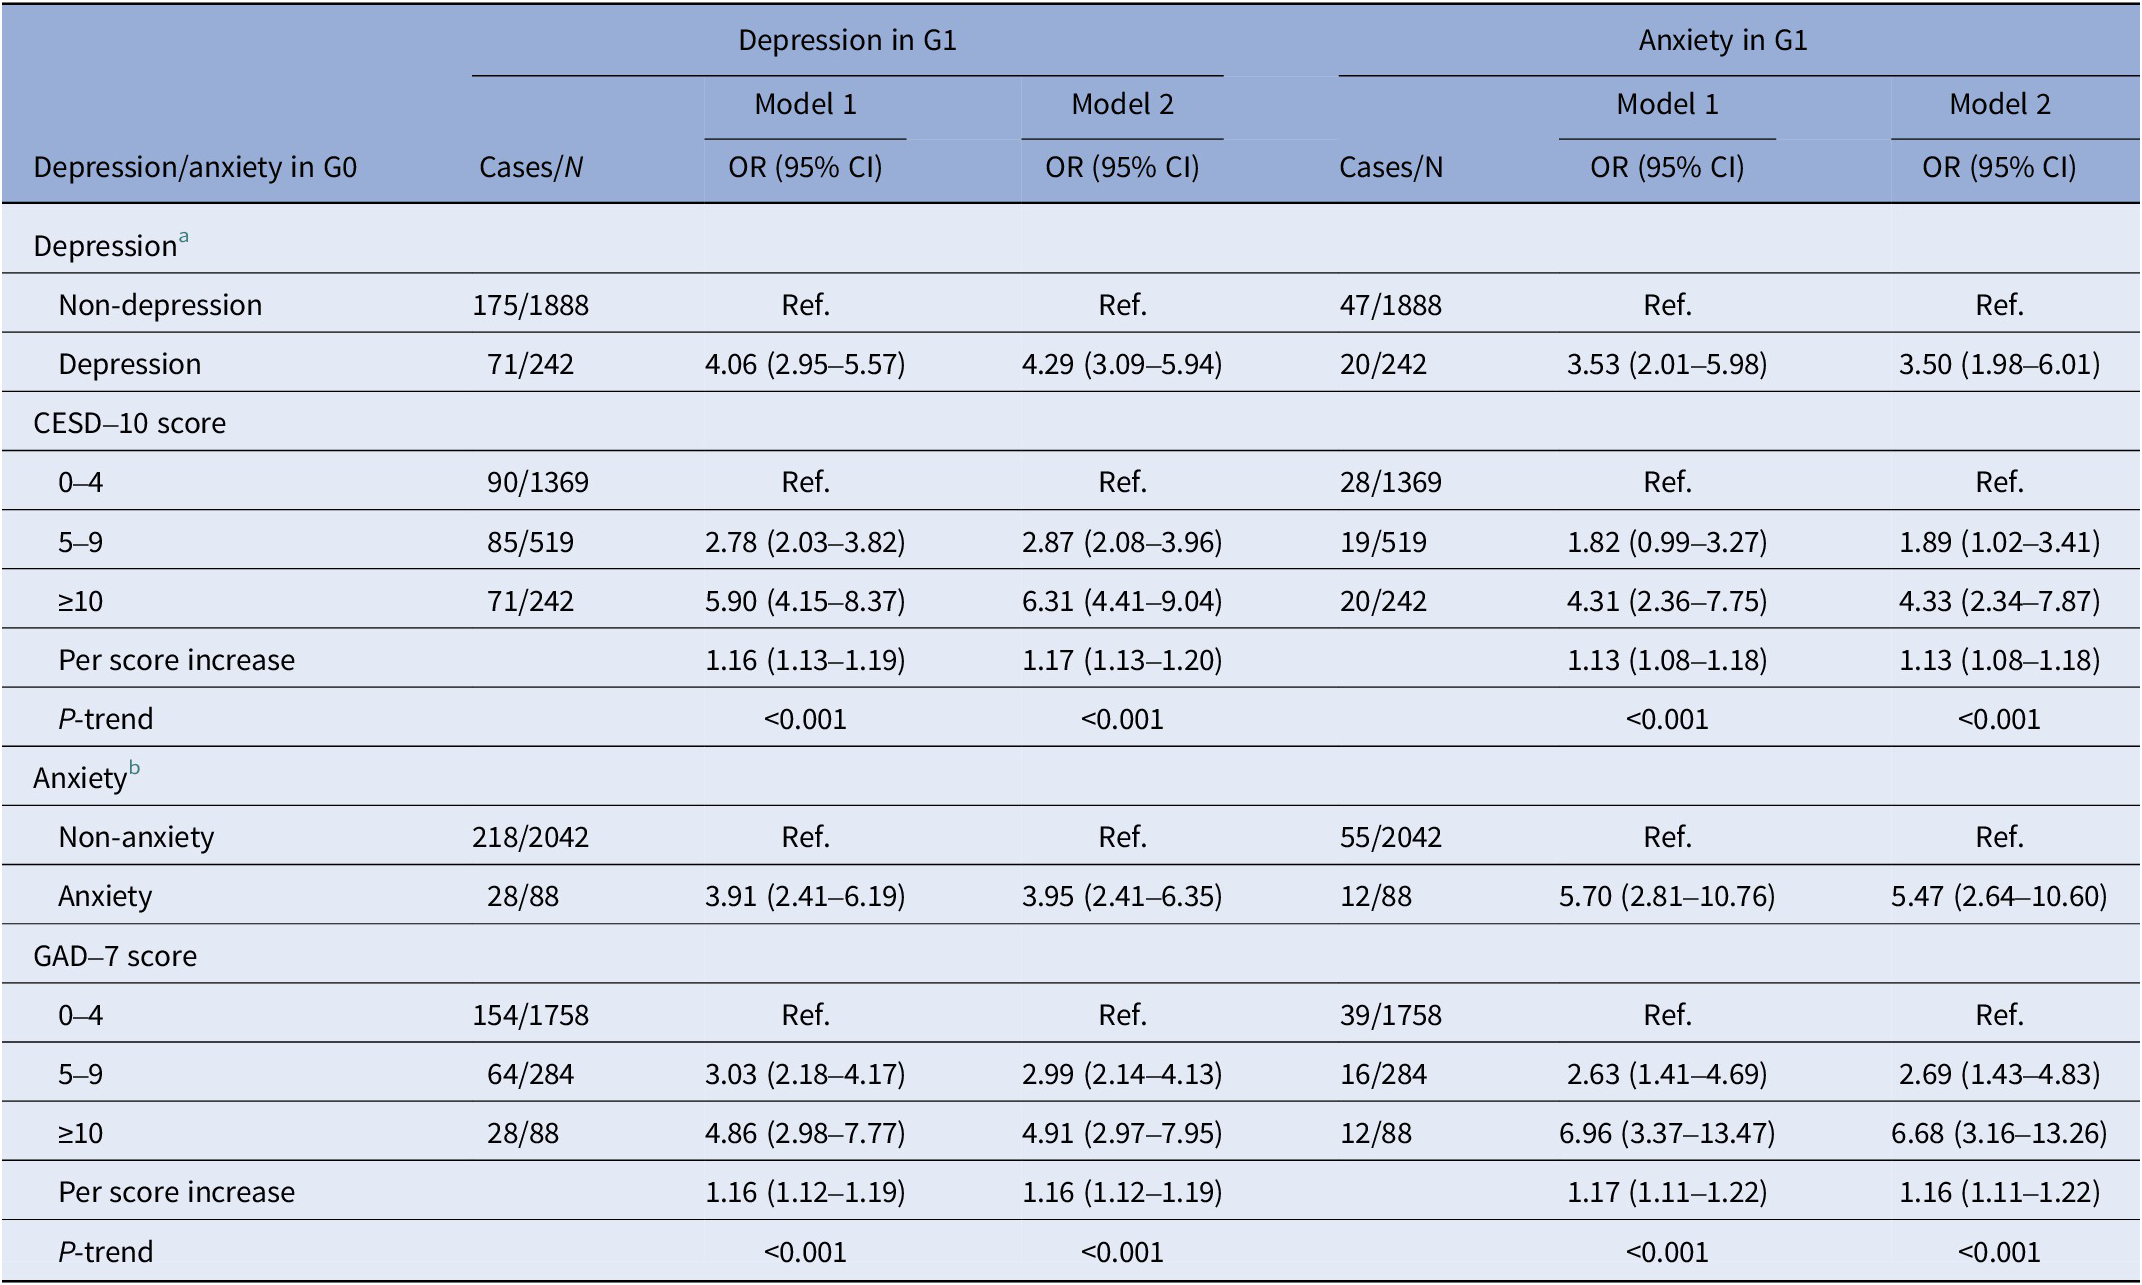
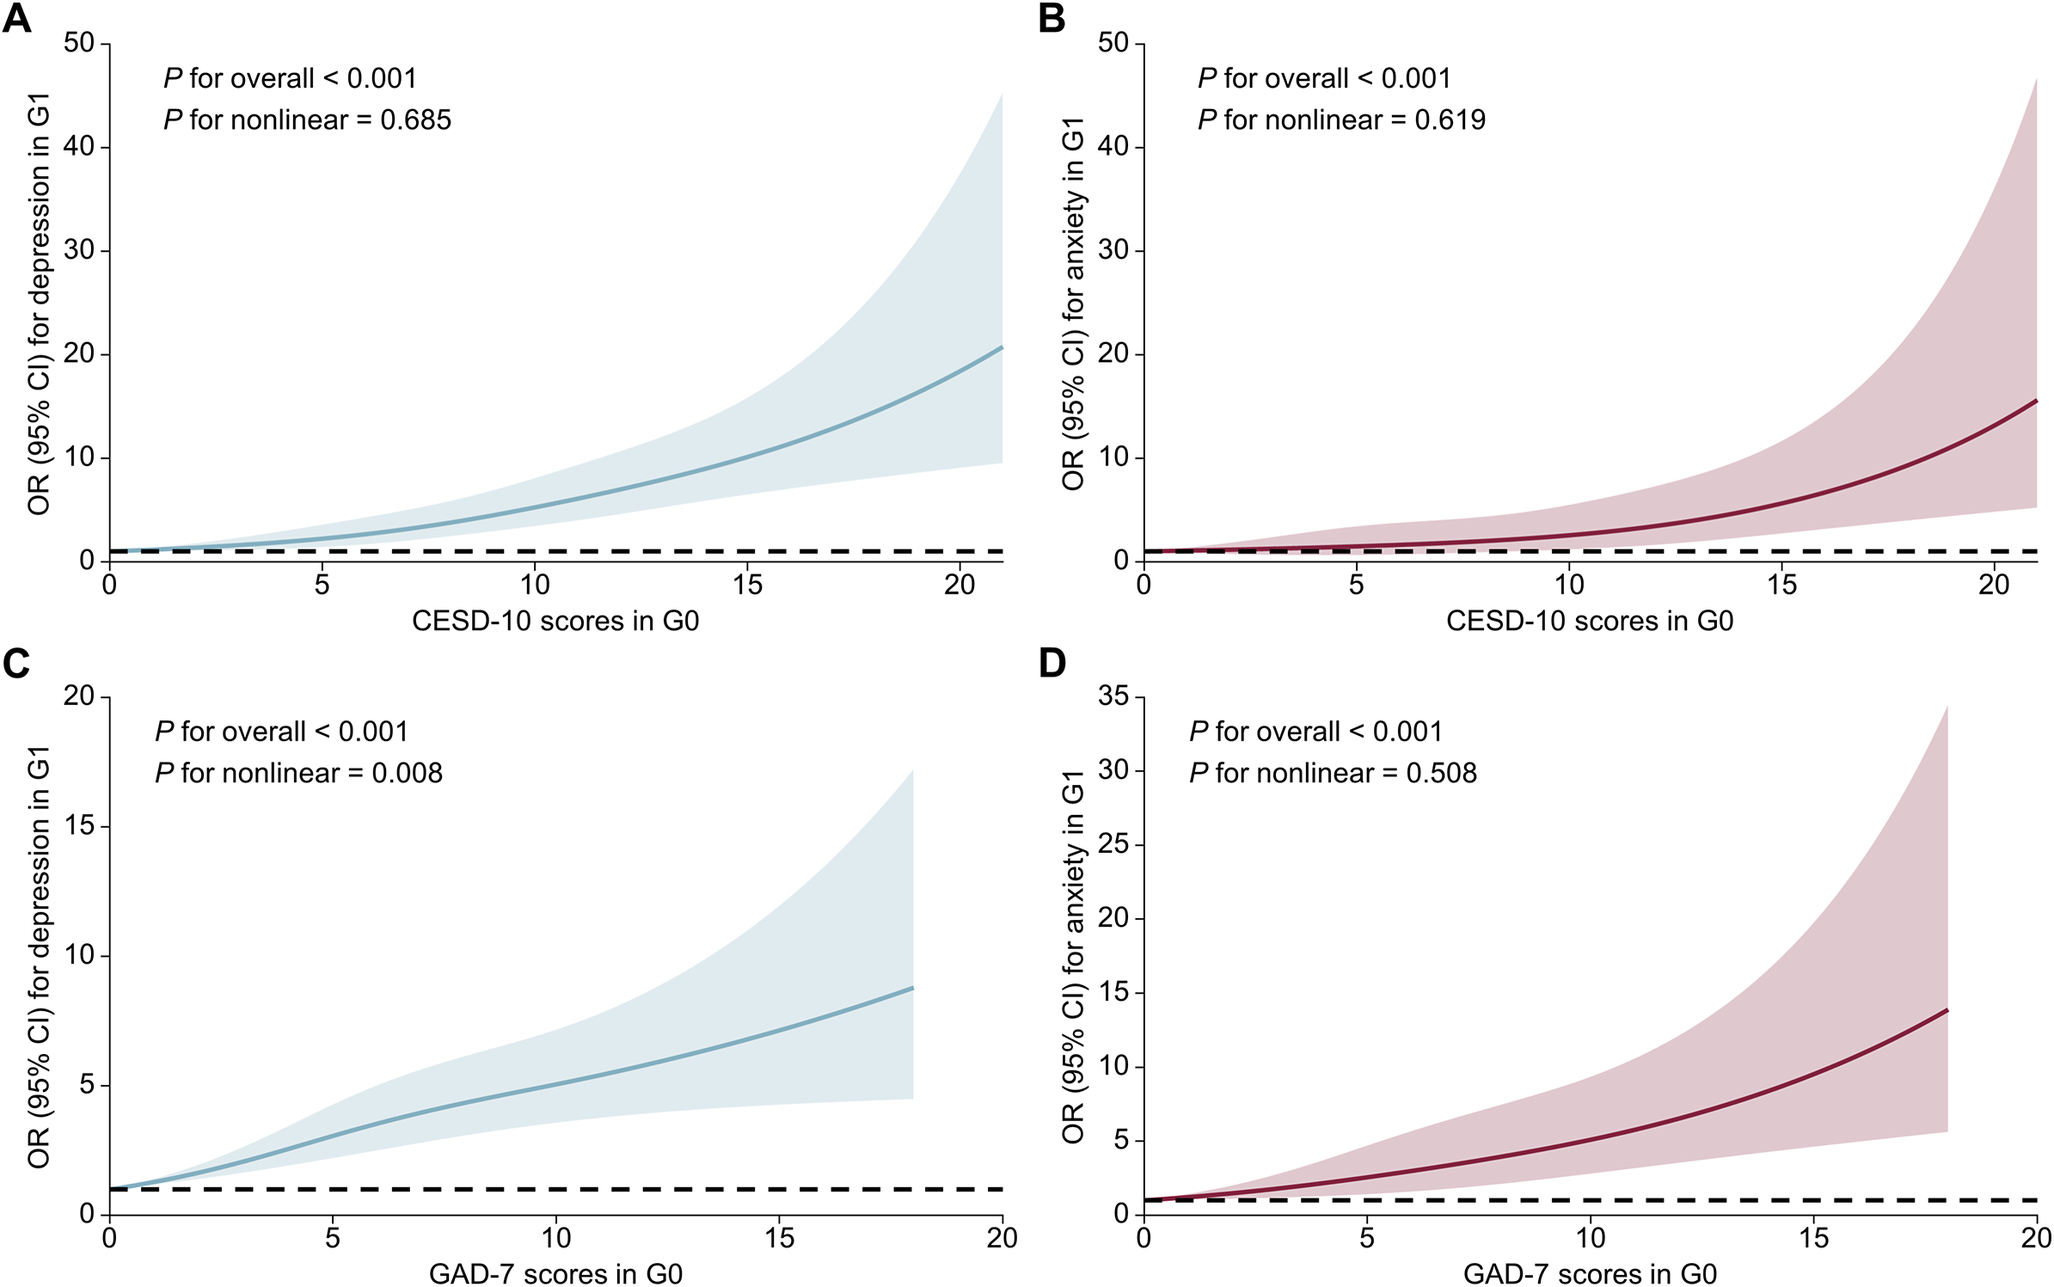
Table 3 displays intergenerational associations of depression and anxiety between G0 and G1 using multivariable logistic models. After adjusting for covariates, depression in G0 was significantly associated with higher odds of depression and anxiety in G1 (OR: 4.29, 95% CI: 3.09–5.94 for depression, and OR: 3.50, 95% CI: 1.98–6.01 for anxiety). When G0 CESD-10 scores were categorized as 0–4, 5–9, and ≥ 10, a graded dose–response relationship was observed, with a G0 CESD-10 score of ≥10 being associated with the highest odds of depression (OR: 6.31, 95% CI: 4.41–9.04) and anxiety (OR: 4.33, 95% CI: 2.34–7.87) in G1. A one-point increase in G0’s CESD-10 score was associated with 1.17-fold (95% CI: 1.13–1.20) and 1.13-fold (95% CI: 1.08–1.18) higher odds of depression and anxiety in G1, respectively. In addition, depression in G0 was associated with higher CESD-10 (PR: 1.79, 95% CI: 1.58–2.04) and GAD-7 (PR: 1.98, 95% CI: 1.61–2.43, Supplementary Table S2) scores in G1. The RCS indicated that, as CESD-10 scores in G0 increased, the odds of depression and anxiety in G1, as well as CESD-10 and GAD-7 scores in G1, increased monotonically (Figure 1A, B, Supplementary Figure S3A and Supplementary Figure S3B).
Intergenerational associations of depression and anxiety between the grandmaternal (G0) and maternal (G1) generations

[Table 3] Long description
The table has rows for grandmaternal depression and anxiety status and columns for maternal depression and anxiety outcomes, subdivided by cases, Model 1, and Model 2. For grandmaternal depression, maternal depression cases are 175 out of 1888 for non-depression and 71 out of 242 for depression, with odds ratios of 4.06 (2.95 to 5.57) in Model 1 and 4.29 (3.09 to 5.94) in Model 2. Maternal anxiety cases are 47 out of 1888 for non-depression and 20 out of 242 for depression, with odds ratios of 3.53 (2.01 to 5.98) in Model 1 and 3.50 (1.98 to 6.01) in Model 2. For CESD-10 scores in grandmothers, maternal depression odds ratios increase from reference at 0 to 4, to 2.78 (2.03 to 3.82) for 5 to 9, and 5.90 (4.15 to 8.37) for 10 or more in Model 1. Maternal anxiety odds ratios similarly increase. Per score increase, the odds ratio is 1.16 (1.13 to 1.19) for depression and 1.13 (1.08 to 1.18) for anxiety. For grandmaternal anxiety, maternal depression cases are 218 out of 2042 for non-anxiety and 28 out of 88 for anxiety, with odds ratios of 3.91 (2.41 to 6.19) in Model 1 and 3.95 (2.41 to 6.35) in Model 2. Maternal anxiety cases are 55 out of 2042 for non-anxiety and 12 out of 88 for anxiety, with odds ratios of 5.70 (2.81 to 10.76) in Model 1 and 5.47 (2.64 to 10.60) in Model 2. For GAD-7 scores in grandmothers, maternal depression odds ratios rise from reference at 0 to 4, to 3.03 (2.18 to 4.17) for 5 to 9, and 4.86 (2.98 to 7.77) for 10 or more in Model 1. Maternal anxiety odds ratios also increase with higher GAD-7 scores. Per score increase, the odds ratio is 1.16 (1.12 to 1.19) for depression and 1.17 (1.11 to 1.22) for anxiety. All P-trend values are less than 0.001, indicating significant trends. Model 1 is unadjusted; Model 2 adjusts for demographic and socioeconomic factors.
Note: Model 1 was unadjusted; Model 2 was adjusted for age, educational level, income, employment status, residence of G0 and G1, and their cohabitation status.
Abbreviations: G1, the maternal generation; CESD-10, Centre for Epidemiological Studies Depression 10-item Scale; GAD-7, 7-item Generalized Anxiety Disorder Scale; OR, odds ratio; CI, confidence interval.
a Depression in G0, defined as a CESD-10 score ≥ 10.
b Anxiety in G0, defined as a GAD-7 score ≥ 10.
Restricted cubic spline for intergenerational association of depression and anxiety between the grandmaternal (G0) and maternal (G1) generations based on logistic regression.
Note: Beyond the maximum observed values (21 in Figure A, B, and 18 in Figure C, D), the curves can be linearly extrapolated to avoid overfitting in extreme ranges with sparse data.
G0, the grandmaternal generation; G1, the maternal generation; CESD-10, Centre for Epidemiological Studies Depression 10-item Scale; GAD-7, 7-item Generalized Anxiety Disorder Scale; CI, confidence interval; OR, odds ratio; .

[Figure 1] Long description
Panel A, at the top left, plots C E S D dash 10 scores in G 0 on the x axis against odds ratio with 95 percent confidence interval for depression in G 1 on the y axis. The curve shows a nonlinear upward trend, with P for overall less than 0 point 0 0 1 and P for nonlinear equals 0 point 6 8 5. Panel B, at the top right, uses the same x axis but plots odds ratio for anxiety in G 1, also showing a nonlinear increase, with P for overall less than 0 point 0 0 1 and P for nonlinear equals 0 point 6 1 9. Panel C, at the bottom left, plots G A D dash 7 scores in G 0 on the x axis against odds ratio for depression in G 1, showing a steeper nonlinear rise, with P for overall less than 0 point 0 0 1 and P for nonlinear equals 0 point 0 0 8. Panel D, at the bottom right, plots G A D dash 7 scores in G 0 against odds ratio for anxiety in G 1, showing a similar nonlinear increase, with P for overall less than 0 point 0 0 1 and P for nonlinear equals 0 point 5 0 8. All panels include shaded regions representing 95 percent confidence intervals, and the curves are extrapolated linearly beyond maximum observed values to avoid overfitting.
Similarly, anxiety in G0 was associated with higher odds of depression and anxiety in G1 (OR: 3.95, 95% CI: 2.41–6.35 for depression, and OR: 5.47, 95% CI: 2.64–10.60 for anxiety). Compared with G0 individuals with GAD-7 scores of 0–4, those with GAD-7 scores of ≥10 had the highest odds of both anxiety and depression in G1. The corresponding odds ratios were 4.91 (95% CI: 2.97–7.95) for depression and 6.68 (95% CI: 3.16–13.26) for anxiety. A one-point increase in G0’s GAD-7 score was associated with 1.16-fold higher odds of both depression (95% CI: 1.12–1.19) and anxiety (95% CI: 1.11–1.22) in G1. Additionally, anxiety in G0 was associated with a higher CESD-10 (PR: 1.72, 95% CI: 1.40–2.13) and GAD-7 (PR: 2.01, 95% CI: 1.47–2.83, Supplementary Table S2) scores in G1. Monotonic dose–response relationships were also observed between G0 GAD-7 scores and depression and anxiety in G1, as reflected in both symptom odds and symptom scores (Figure 1C, D, Supplementary Figure S3C and Supplementary Figure S3D).
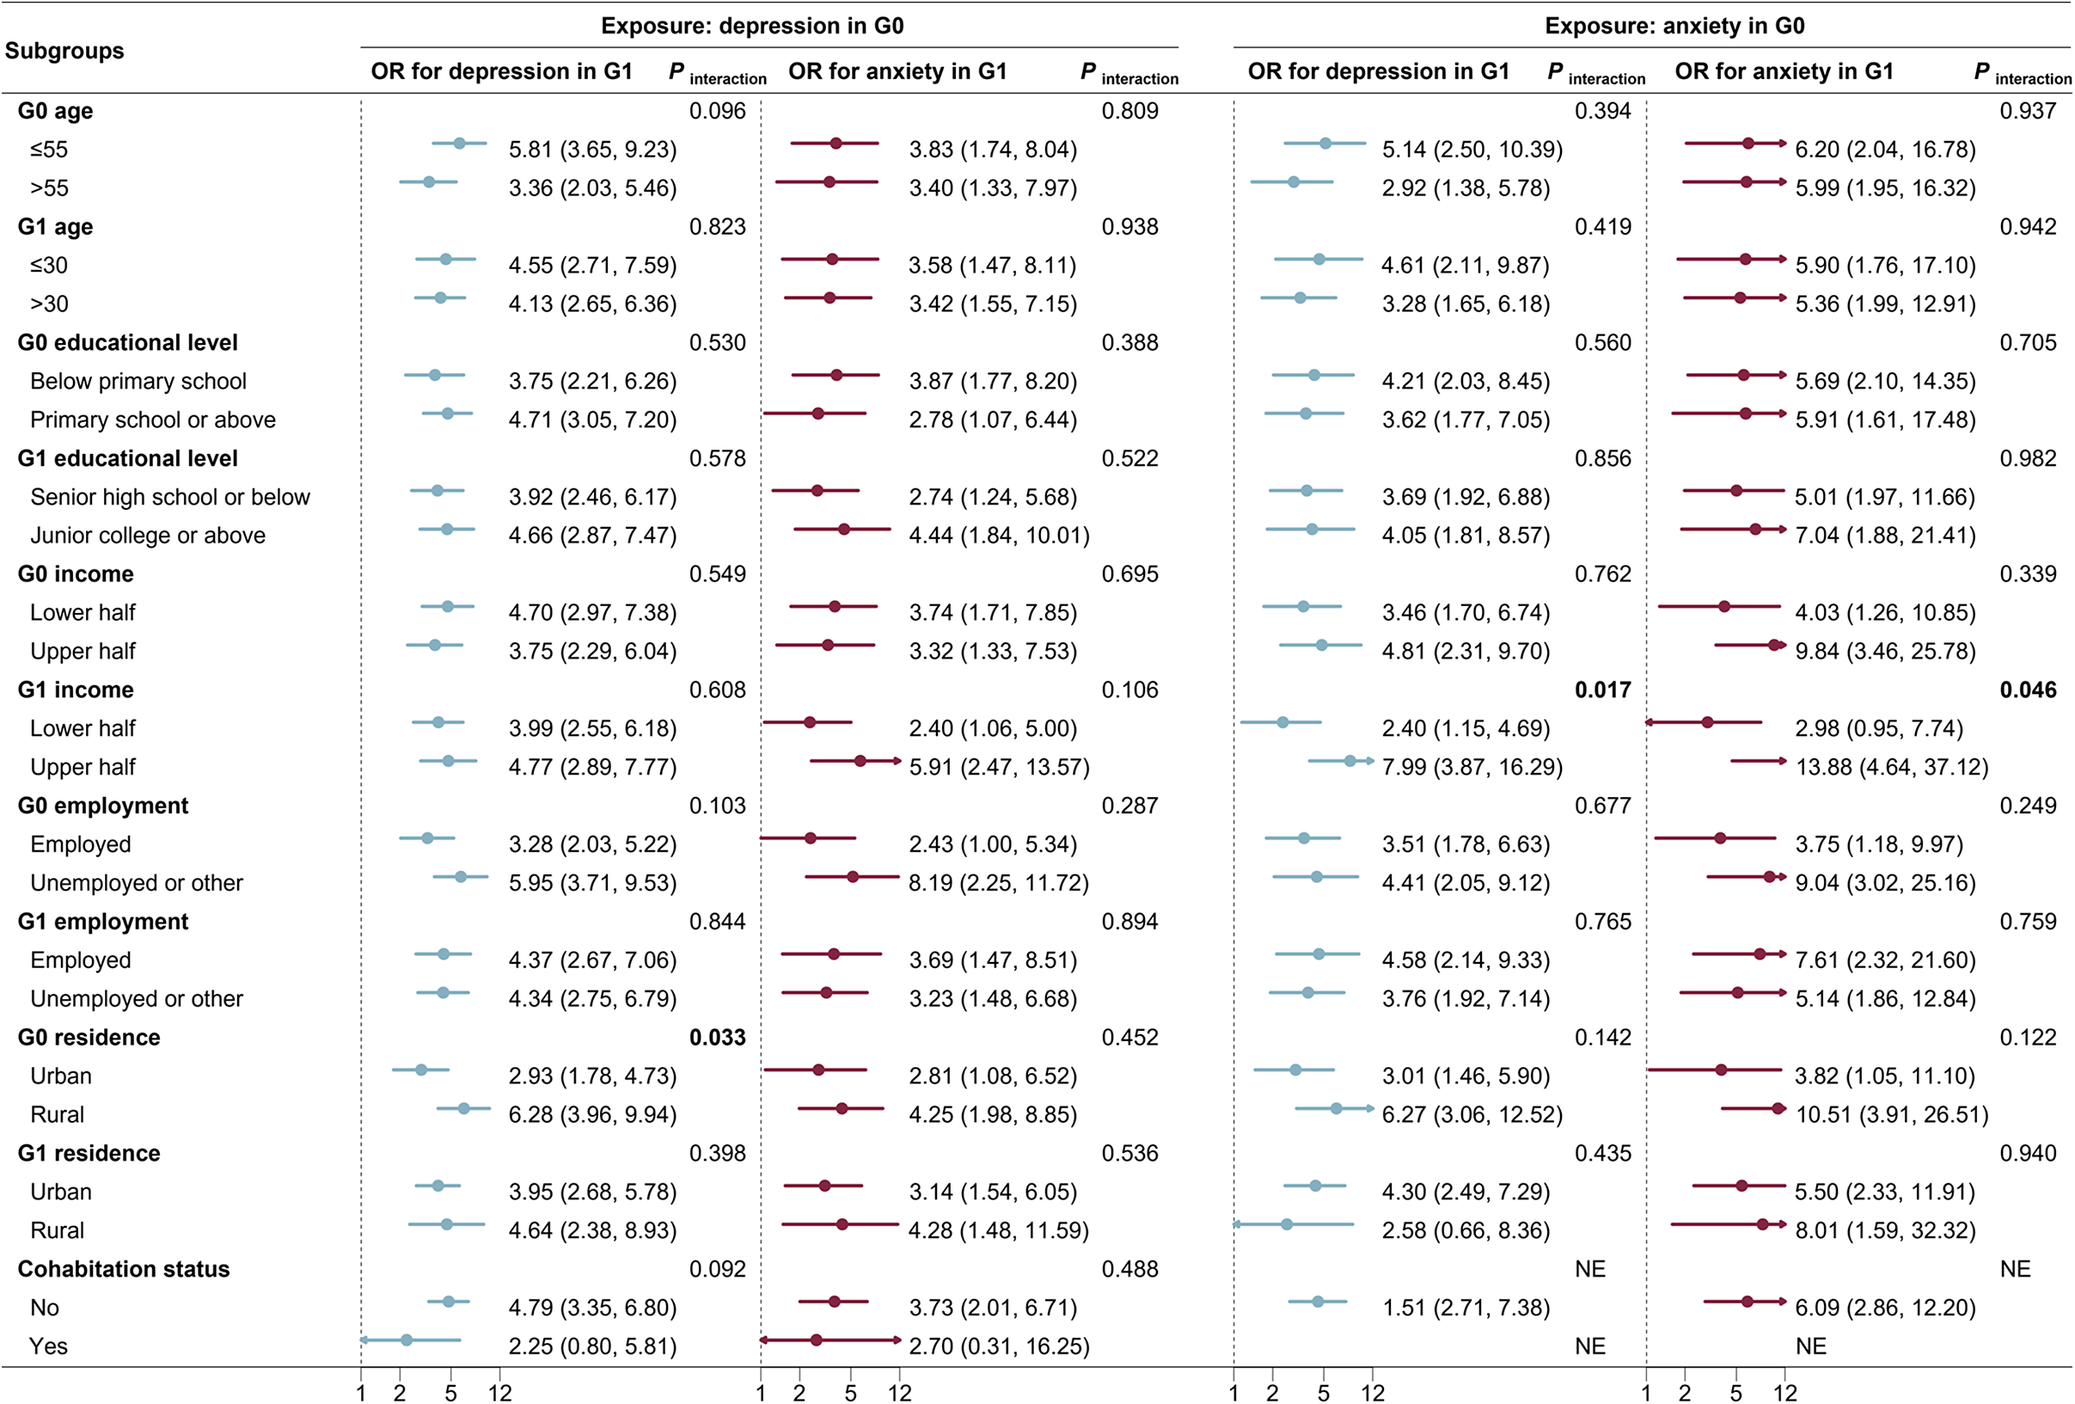
Subgroup analyses (Figure 2) showed that the intergenerational associations of G0 anxiety with G1 depression and anxiety were more pronounced among those with higher household income in G1. In addition, the intergenerational association of depression was more pronounced among participants whose G0 lived in rural areas. Although higher point estimates were observed for the associations of G0 anxiety with G1 depression and anxiety in this subgroup, the interaction did not reach statistical significance.
Subgroup analyses for intergenerational association of depression and anxiety between the grandmaternal (G0) and maternal (G1) generations. Notes: Bold type indicates statistical significance (P < 0.05); G0 refers to the grandmaternal generation, and G1 refers to the maternal generation. NE: not estimated due to insufficient sample size. CI, confidence interval; OR, odds ratio.

[Figure 2] Long description
The plot contains four main data columns under two exposure categories: depression in G 0 and anxiety in G 0. Each exposure is split into two outcome columns: odds ratio for depression in G 1 and odds ratio for anxiety in G 1. Subgroups are listed vertically on the left, including G 0 and G 1 age, educational level, income, employment, residence, and cohabitation status. For each subgroup, horizontal lines represent odds ratios with 95 percent confidence intervals, and significant results are bolded. For example, under G 0 depression exposure, G 0 age less than or equal to 55 shows an odds ratio of 5.81 (3.65, 9.23) for depression in G 1, while G 0 residence in rural areas shows a significant odds ratio of 6.43 (1.96, 9.94). Under G 0 anxiety exposure, G 1 income upper half shows a significant odds ratio of 7.99 (3.87, 16.29) for anxiety in G 1. P interaction values are listed for each subgroup comparison. NE indicates not estimated due to insufficient sample size. The x-axis for each plot is labeled with odds ratio values from 1 to 12.
Discussion
Among 2,130 grandmother-mother (G0-G1) dyads from the GMATCH study, we found that depression and anxiety were associated across generations, both within-domain and cross-domain. Moreover, a dose–response relationship was observed in these intergenerational associations; that is, more severe symptoms in G0 were associated with greater severity of depressive and anxiety symptoms in G1. In addition, the intergenerational association of depression was stronger when G0 were rural residents, while G0 mental symptoms were more strongly associated with anxiety in G1 among those with higher household income.
Comparison with previous studies
Previous evidence on the familial aggregation and intergenerational association of mental disorders partially supports our findings. Two previous meta-analyses of genetic epidemiological studies have demonstrated significant associations between mental disorders in affected individuals and increased odds of corresponding mental disorders in their first-degree relatives (OR: 2.84, 95% CI: 2.31–3.49 for MDD; OR: 6.1, 95% CI 2.5–14.9 for generalized anxiety disorder), which converge with the ORs for depression and anxiety observed in the present study [Reference Sullivan, Neale and Kendler42, Reference Hettema, Neale and Kendler43]. Two recent studies based on the Lifelines cohort further investigated the familial aggregation of mental and internalizing disorders [Reference Wang, Snieder and Hartman11, Reference Bos, Monden, Wray, Zhou, Kendler and Rosmalen44]. The findings quantified the intergenerational associations and familial aggregation of depression and anxiety, with recurrence risk ratios of 1.77–2.10 for depression and 1.55–1.56 for generalized anxiety disorder among first-degree relatives, as well as evidence of cross-domain co-aggregation [Reference Wang, Snieder and Hartman11, Reference Bos, Monden, Wray, Zhou, Kendler and Rosmalen44]. Another two studies from the National Institute of Mental Health Family Study revealed the familial aggregation of anxiety and depression within U.S. families [Reference Merikangas, Cui, Heaton, Nakamura, Roca and Ding29, Reference Iorfino, Marangoni, Cui, Hermens, Hickie and Merikangas45].
Previous intergenerational studies of mental disorders have typically relied on registry-based family history data [Reference Kendler, Abrahamsson, Ohlsson, Sundquist and Sundquist12, Reference Fang, Yu, Zhi, Xi, Peng and Cai15, Reference Gronemann, Jacobsen, Wium-Andersen, Jørgensen, Osler and Jørgensen28]. While these studies have demonstrated familial risks, they have failed to account for the role of environmental factors in intergenerational association and the cross-generational co-occurrence burden of mental disorders within families at the same time point. Research on the intergenerational association of mental disorders between mothers and their offspring has typically been limited to child and adolescent offspring, and stronger intergenerational associations have been observed between two generations of women [Reference Morris, McGrath, Goldman and Rottenberg14, Reference Fang, Yu, Zhi, Xi, Peng and Cai15, Reference Pearson, Evans, Kounali, Lewis, Heron and Ramchandani18–Reference Goodman21, Reference Liu, Li, Zheng and Wang46]. This research gap may be particularly important in the Chinese context. The culture of filial piety emphasizes the need for emotional connectedness between generations, and under the one-child policy, parents may have had to rely more heavily on daughters to maintain these emotional bonds [Reference Chen, Zhuoga and Deng25]. Based on the GMATCH cohort, we found that the intergenerational association of mental disorders persisted between two generations of adult women and exhibited a dose–response relationship, providing rare evidence from China.
The subgroup analyses found that the intergenerational associations of depression and anxiety were not influenced by parental socioeconomic status, which is consistent with previous research [Reference Mikkonen, Moustgaard, Remes and Martikainen47, Reference Lewis, Rice, Harold, Collishaw and Thapar48]. However, these associations appeared stronger among families in which the parental generation resided in rural areas and the offspring had higher household income. Caregiving support and empathic relationships may partly explain this difference [Reference Polenick, Kim, DePasquale, Birditt, Zarit and Fingerman26, Reference Brown, Grimm, Wells, Hua and Levenson27]. A plausible explanation is that older adults in rural settings may be more vulnerable to mental disorders and more likely to rely on family members for emotional support and caregiving [Reference L’Heureux, Parmar, Dobbs, Charles, Tian and Sacrey49]. This may strengthen psychological empathy between mothers and daughters, thereby contributing to the intergenerational transmission of psychological symptoms. In addition, adult women with higher income are more likely to provide informal care for their parents, thereby strengthening emotional bonds [Reference Wang, Li, Ding, Feng, Tang and Sun50]. The results also suggest the need to consider the influence of offspring socioeconomic status on the upward intergenerational association.
Mechanisms
Several potential mechanisms may account for our findings. Genetics partially accounts for the intergenerational association and familial aggregation of mental disorders. Evidence from twin studies suggested that genetic factors account for 37 and 32% of the familial aggregation of MDD and generalized anxiety disorder, respectively [Reference Wang, Snieder and Hartman11, Reference Sullivan, Neale and Kendler42, Reference Hettema, Neale and Kendler43]. Moreover, biological pathways underlying intergenerational associations may emerge early in life: maternal depression-related exposures may influence fetal neurodevelopment through dysregulation of the hypothalamic–pituitary–adrenal axis, immune-inflammatory responses, oxytocin and estrogen systems, and epigenetic regulation, thereby shaping offspring susceptibility to depression and anxiety from early life and potentially contributing to mother-daughter clustering in adulthood [Reference Sawyer, Zunszain, Dazzan and Pariante51]. Shared environmental factors may offer an alternative explanation. Evidence suggests that mothers with depression are more likely to adopt negative parenting practices and perpetrate child maltreatment, thereby increasing the risk of depression in their offspring that can persist into adulthood [Reference Goodman52, Reference Plant, Pariante, Sharp and Pawlby53]. Another explanation is co-rumination, which refers to the repeated discussion of psychological disorders within mother-daughter dyads. Evidence has shown that co-rumination plays an important role in both depression and anxiety, with stronger effects observed among women and adults [Reference Spendelow, Simonds and Avery54, Reference Dong, Qi and Zhao55]. Family conflict, caregiving demands, and parenting stress may also contribute to the development of psychiatric disorders across generations [Reference Senaratne, Van Ameringen, Mancini and Patterson7, Reference Jin, Liu, Li, Hu, Hong and Li56, Reference Zou, Lin, Jiang, Su, Qin and Han57].
Implications
These findings have important implications for public health. A report from the World Health Organization has identified dysfunctional family functioning and emotional distress among family members as key risk factors for mental disorders, calling for psychological risk assessment at the family level [58]. Our findings support the inclusion of family history of mood disorders in mental health screening protocols for young women in community settings, to help detect high-risk groups that might otherwise remain hidden. Our study extends the intergenerational association of mental symptoms to adult mother–daughter pairs and provides large-scale evidence from China. In this study, the adult daughters were born during the era of China’s one-child policy and had recently taken on caregiving roles in newly formed three-generation households, where they often bore substantial caregiving responsibilities and played a central role in maintaining the family’s emotional functioning. Therefore, primary care providers should assess mental health within the family unit, particularly among women in such caregiving roles [Reference Zou, Lin, Jiang, Su, Qin and Han57, 59]. In addition, the observed dose–response associations underscore the need for stratified mental health screening and targeted support for families where parental symptom burden is high. For family members, enhancing emotional support, sharing caregiving responsibilities, and effectively resolving conflicts may help reduce the intergenerational risk of mental disorders and limit their further transmission to the next generation [Reference Kuhney, Miklowitz, Schiffman and Mittal60, Reference Gorla, Rothenberg, Godwin and Copeland61].
Strengths and limitations
Our study has several strengths. This study included a large, family-based sample of two generations of women, with their depressive and anxiety symptoms assessed using validated scales, respectively. The response rate of the survey was high, and no missing data on depressive and anxiety symptoms existed. Some limitations of our study are noteworthy. First, this study employed a cross-sectional design, which limited our ability to disentangle potential longitudinal associations and to examine the role of key mediating factors. It should be noted that this study focused more on the co-occurring burden of mental disorders across two generations, whereas the underlying causal mechanisms may still require long-term longitudinal studies and genomic analyses to be clarified. Second, intergenerational associations of mental symptoms may vary according to the age at maternal diagnosis and the age at which offspring are exposed [Reference Gronemann, Jacobsen, Wium-Andersen, Jørgensen, Osler and Jørgensen28], but we were unable to determine whether G0 mental disorders had already occurred earlier in life. Third, we lacked genetic data and therefore could not assess the role of familial genetic risk in these intergenerational associations. Fourth, some individuals, particularly those in the G0 generation, may be reluctant to disclose their mental health status, resulting in underestimation of the intergenerational associations [Reference Mackenzie, Rosario, Krook, Vogel and Wade62]. Nevertheless, the CESD-10 and GAD-7 scales are well-established tools for assessing depression and anxiety in the general population and have shown reasonable correlations with clinical diagnoses [Reference Andresen, Malmgren, Carter and Patrick32, Reference Spitzer, Kroenke, Williams and Löwe33]. Fifth, although the sample in our study was randomly selected, participants with severe mental disorders might be less likely to participate, which could have introduced selection bias. Sixth, our sample was limited to women who were 2–3 years postpartum and their mothers, which may not capture a broader age range. Caution is therefore warranted when generalizing the findings to other age groups or intergenerational associations across all types of first-degree relatives. Finally, the economic status of Huai’an City in Jiangsu Province is above the national average, which may limit the generalizability of our findings to other regions of China [Reference Wang, Zhang, Ding, Dai, Zhu and Xu31]. Therefore, future large-scale prospective studies are needed to disentangle the distinct contributions of genetic and environmental factors, as well as the roles of potential mediators and moderators, in order to identify possible intervention pathways.
Conclusions
In summary, our study found within-domain and cross-domain intergenerational associations of depression and anxiety among adult women in families; that is, maternal depression and anxiety were each associated with higher odds of both depression and anxiety in daughters. Moreover, more severe symptoms in the maternal generation were associated with greater severity of mental disorders in the daughter generation. Therefore, interventions for mental disorders should consider the psychological interconnections within families and incorporate the family as a unit in risk assessment and intervention.
Abbreviations
- CESD-10
-
10-item version of the Center for Epidemiologic Studies Depression Scale
- CI
-
confidence interval
- MDD
-
major depressive disorder
- G0
-
the grandmaternal generation
- G1
-
the maternal generation
- GAD-7
-
7-item Generalized Anxiety Disorder Scale
- GMATCH
-
The Grandmothers, Mothers, and Their Children’s Health study
- OR
-
odds ratio
- PR
-
prevalence ratio
- RCS
-
restricted cubic spline
- SD
-
standard deviation
- VIF
-
variance inflation factors
Supplementary material
The supplementary material for this article can be found at http://doi.org/10.1192/j.eurpsy.2026.12224.
Data availability statement
The data of the GMATCH are not available for sharing.
Acknowledgements
We thank all the volunteers who participated in the study, and all the researchers and staff who contributed to the GMATCH.
Author contribution
Junjie Lin: Methodology, Data Curation, Formal analysis, Software, Writing - Original Draft, Visualization. Yaguan Zhou: Methodology, Data Curation, Validation, Writing - Review & Editing. Yue Zhang, Hui Wang, Jiyue Dai, Yue Liu, Zifan Zhang, Yangyang Cheng, Sunyi Wang, Hongyu Cai, Yipei Zhao, Weijie Ding: Data Curation, Writing - Review & Editing. Xiaoqin Zhu: Methodology, Investigation, Data Curation, Validation. Xiaolin Xu: Methodology, Validation, Writing – Review & Editing, Supervision, Funding acquisition.
Financial support
Xiaolin Xu was supported by the China Medical Board (No. 21–416), and Xiaolin Xu, Weijie Ding, and Hui Wang were supported by the Huai’an Science and Technology Program (HAB2024039).
Competing interests
The authors report no conflicts of interest. The authors are responsible for the content and writing of the article.
Ethics approval and informed consent
All participants in the GMATCH provided informed consent. The GMATCH has ethical approval from the Ethics Committee of Huai’an Maternal and Child Health Care Hospital Affiliated to Yangzhou University (No: 2021060).
Consent for publication
This manuscript has the consent of the participant for the use of her data and for the publication of the data that appear in the article.


 Open access


Comments
No Comments have been published for this article.