


1. Introduction
Dense granular systems in nature and industry are often non-monodisperse – i.e. consisting of particles of disparate sizes. In non-monodisperse granular systems, the constituent grains segregate based on size during flow, forming complex patterns (e.g. Shinbrot & Muzzio Reference Shinbrot and Muzzio2000; Gray & Thornton Reference Gray and Thornton2005; Hill & Fan Reference Hill and Fan2008; Fan & Hill Reference Fan and Hill2010; Schlick et al. Reference Schlick, Fan, Isner, Umbanhowar, Ottino and Lueptow2015; Gray Reference Gray2018; Umbanhowar, Lueptow & Ottino Reference Umbanhowar, Lueptow and Ottino2019). The ability to predict the dynamics of segregation is important across applications. For example, in geophysics, granular size segregation can manifest in landslides and debris flows (Johnson et al. Reference Johnson, Kokelaar, Iverson, Logan, LaHusen and Gray2012), in which larger grains segregate to the top of the flow, potentially causing more damage, while in industry, size segregation can be an undesirable effect when blending granular constituents of various sizes.
The current understanding is that there are two driving forces for size segregation in dense granular flows. The first is pressure gradients, which are typically induced by gravity. In pressure-gradient-driven size segregation, small particles move more readily through the interstitial spaces that open and close during flow through a process referred to in the literature as ‘kinetic sieving’, leading to a system stratified along the direction of pressure gradients (Savage & Lun Reference Savage and Lun1988; Gray & Thornton Reference Gray and Thornton2005; Gray & Chugunov Reference Gray and Chugunov2006; Thornton et al. Reference Thornton, Weinhart, Luding and Bokhove2012; Fan et al. Reference Fan, Schlick, Umbanhowar, Ottino and Lueptow2014). While pressure-gradient-driven segregation has been the focus of significant study, Hill and coworkers (Hill & Fan Reference Hill and Fan2008; Fan & Hill Reference Fan and Hill2010, Reference Fan and Hill2011b; Hill & Tan Reference Hill and Tan2014) demonstrated that grains can also segregate in inhomogeneous flows along directions orthogonal to gravitationally induced pressure gradients, driven instead by gradients in the shear strain rate. As an example, this mechanism has been observed in the split-bottom cell experiments of Hill & Fan (Reference Hill and Fan2008). In these experiments, not only do the larger particles segregate to the top of the cell, but they also segregate perpendicular to the direction of pressure gradients towards more rapidly shearing regions. Shear-strain-rate-gradient-driven segregation has received comparatively less attention in modelling efforts.
Due to the complexity of flow and segregation patterns, developing a general, predictive, continuum model for coupled size segregation and flow in dense granular materials remains an open challenge. Although much progress has been made over recent decades (e.g. Savage & Lun Reference Savage and Lun1988; Gray & Thornton Reference Gray and Thornton2005; Gray & Chugunov Reference Gray and Chugunov2006; Fan & Hill Reference Fan and Hill2011b; Fan et al. Reference Fan, Schlick, Umbanhowar, Ottino and Lueptow2014; Tunuguntla, Weinhart & Thornton Reference Tunuguntla, Weinhart and Thornton2017; Gray Reference Gray2018; Umbanhowar et al. Reference Umbanhowar, Lueptow and Ottino2019), the development of continuum models that are capable of simultaneously predicting the evolution of both segregation and flow fields, based solely on the geometry of the flow configuration, applied loads and boundary/initial conditions is still in its infancy. Instead, most continuum models for size segregation require some flow field quantity, such as the velocity or stress fluctuation field, to be measured first from experiments or discrete element method (DEM) simulations and then used as model input. A crucial reason for the incompleteness of current models is the lack of a dense granular flow rheology theory that may be coupled to segregation models. A widely used class of viscoplastic models for steady, dense granular flow is based on the  $\mu (I)$ rheology (MiDi Reference MiDi2004; da Cruz et al. Reference da Cruz, Emam, Prochnow, Roux and Chevoir2005; Jop, Forterre & Pouliquen Reference Jop, Forterre and Pouliquen2005; Srivastava et al. Reference Srivastava, Silbert, Grest and Lechman2021), where $\mu$ is the stress ratio and $I$ is the inertial number. One recent work that couples rheology and segregation in dense granular flows is that of Barker et al. (Reference Barker, Rauter, Maguire, Johnson and Gray2021), which combines a regularized version of the $\mu (I)$ rheology (Barker & Gray Reference Barker and Gray2017) with a model for gravity-driven segregation. However, it has been well documented in the literature (e.g. Kamrin Reference Kamrin2019) that the $\mu (I)$ rheology, even in its regularized form, can break down in the presence of spatial flow inhomogeneity, which can be attributed to non-local effects not accounted for in the $\mu (I)$ rheology.
To address this point, significant effort has gone into the development of size-dependent, non-local continuum constitutive theories for dense granular flow rheology, and coupling a non-local rheological model with a segregation model provides a route to robust, simultaneous prediction of flow and segregation fields. In this paper, we focus on the non-local granular fluidity (NGF) model of Kamrin and coworkers (Kamrin & Koval Reference Kamrin and Koval2012; Henann & Kamrin Reference Henann and Kamrin2013; Kamrin Reference Kamrin2019), which has been successfully applied to predicting dense flows of monodisperse grains in a wide variety of flow geometries. Then, the overarching aim of this paper is to formulate a continuum theory for simultaneous prediction of flow and size segregation in dense granular systems by integrating the NGF model with a phenomenological size-segregation model. This is a broad goal, and in this paper, we narrow our focus to several simpler, quasi-one-dimensional flow configurations. In most real-world flows, both the pressure-gradient-driven and shear-strain-rate-gradient-driven segregation mechanisms are present, making it difficult to disentangle them. Therefore, our plan for this paper is to isolate and examine the shear-strain-rate-gradient-driven mechanism. Specifically, we study the shear-strain-rate-gradient-driven segregation mechanism by considering flows of dense, bidisperse systems of both disks and spheres in two flow geometries in which the pressure field is spatially uniform: (i) vertical chute flow and (ii) annular shear flow. Therefore, shear-strain-rate gradients are the sole drivers of segregation. In order to inform continuum model development, we perform DEM simulations using the open-source software LAMMPS (Plimpton Reference Plimpton1995), which function as ‘numerical experiments’. The coupled continuum model that we develop is then validated by comparing its predictions of the transient evolution of the segregation field and the steady-state flow field against additional DEM simulation results.
This paper is organized as follows. In § 2, we discuss the continuum model that we use to describe flow and size segregation in bidisperse, dense granular materials. Specifically, §§ 2.1 and 2.2 introduce the mixture theory framework used to describe dense, bidisperse granular mixtures, and in § 2.3, we briefly revisit the  $\mu (I)$ rheology and the NGF model for monodisperse granular systems and discuss their extension to bidisperse systems. Then, in § 2.4, we propose a model for shear-strain-rate-gradient-driven size segregation. In §§ 3 and 4, we consider granular diffusion and shear-strain-rate-gradient-driven segregation, respectively, and independently determine the two dimensionless material parameters that appear in the size-segregation model for both disks and spheres. Then, in § 5, the proposed segregation model is coupled with the NGF model and applied to both vertical chute flow and annular shear flow to predict the transient evolution of the segregation dynamics, and the predicted continuum fields are compared against DEM measurements. In the end, our model demonstrates a level of fidelity in simultaneously predicting the flow and segregation dynamics that has not been previously achieved. We close with a discussion of the segregation model and some concluding remarks in § 6.
2. Continuum framework
In this section, we discuss the continuum framework used to describe dense, bidisperse granular systems and propose constitutive equations for rheology and size segregation. Throughout, we utilize a mixture-theory-based approach, which is common in continuum modelling of dense, bidisperse mixtures (e.g. Gray & Thornton Reference Gray and Thornton2005; Gray & Chugunov Reference Gray and Chugunov2006; Fan & Hill Reference Fan and Hill2011b; Gray Reference Gray2018; Umbanhowar et al. Reference Umbanhowar, Lueptow and Ottino2019; Bancroft & Johnson Reference Bancroft and Johnson2021; Barker et al. Reference Barker, Rauter, Maguire, Johnson and Gray2021; Duan et al. Reference Duan, Umbanhowar, Ottino and Lueptow2021), and we use standard component notation, which supposes an underlying set of Cartesian basis vectors  $\{\boldsymbol {e}_i|i=1,2,3\}$, and in which the components of vectors, $\boldsymbol {v}$, and tensors, $\boldsymbol {\sigma }$, are denoted by $v_i$ and $\sigma _{ij}$, respectively. The Einstein summation convention is employed, and the Kronecker delta, $\delta _{ij}$, is utilized to denote the components of the identity tensor.
2.1. Bidisperse systems
We consider granular mixtures consisting of particles with two sizes – large grains with an average diameter of  $d^{l}$ and small grains with an average diameter of
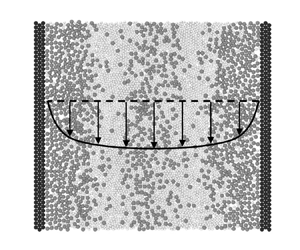
  $d^{s}$. We consider both two-dimensional systems of disks, as illustrated in figure 1, and three-dimensional systems of spheres. To eliminate the effect of density-based segregation (e.g. Tripathi & Khakhar Reference Tripathi and Khakhar2013) and isolate size-based segregation, all particles are made of the same material with mass density $\rho _{s}$, which represents the area density for disks and the volume density for spheres. Throughout, we utilize the notational convention in which we denote large-grain quantities using a superscript ${l}$ and small-grain quantities using a superscript ${s}$. The species-specific solid fractions – i.e. the areas occupied by each species per unit total area for disks and the volumes occupied by each species per unit total volume for spheres – are $\phi ^{l}$ and $\phi ^{s}$, respectively, and the total solid fraction is $\phi = \phi ^{l} + \phi ^{s}$. The concentration of each species then follows as $c^{l} = \phi ^{l}/\phi$ and $c^{s} = \phi ^{s}/\phi$, so that $c^{l} + c^{s} = 1$. The average mixture grain size is defined as the sizes of both species weighted by their concentrations, $\bar {d} = c^{l}d^{l} + c^{s}d^{s}$. We make the common idealization that the total area for dense systems of disks or total volume for dense systems of spheres does not change (Savage Reference Savage1998; Gray & Thornton Reference Gray and Thornton2005; Gray & Chugunov Reference Gray and Chugunov2006; Fan & Hill Reference Fan and Hill2011b), and therefore $\phi$ is idealized as constant at each point in space and at each instant in time during the segregation process. We have verified in our DEM simulations that area (or volume) dilatation at flow initiation occurs over a much shorter time scale than the process of segregation, and that, subsequently, the solid fraction field is approximately uniform both spatially and temporally. Moreover, we have verified that dilatancy-driven secondary flows (e.g. Dsouza & Nott Reference Dsouza and Nott2021) are not observed in the dense flows considered in this work. Therefore, the idealization of a constant solid fraction is reasonable. Throughout this study, we use $\phi =0.8$ for disks, and $\phi =0.6$ for spheres.
A representative schematic of a dense, bidisperse granular system consisting of two-dimensional disks.

Regarding the kinematics of flow, each species has an associated partial velocity,  $v_i^{l}$ and $v_i^{s}$, and the mixture velocity is given by $v_i = c^{l}v_i^{l} + c^{s}v_i^{s}$. The mixture strain-rate tensor is then defined using the mixture velocity in the standard way: ${\mathsf{D}}_{ij} = (1/2)(\partial v_i/\partial x_j + \partial v_j/\partial x_i)$, where ${\mathsf{D}}_{kk}=0$ since we have assumed that the mixture area (or volume) does not change. The equivalent shear strain rate is defined as $\dot {\gamma } = (2{\mathsf{D}}_{ij}{\mathsf{D}}_{ij})^{1/2}$.
Then, the relative area (or volume) flux for each grain type,  $\nu ={l}$ or ${s}$, is defined through the difference between its partial velocity and the mixture velocity as $w_i^{\nu } = c^{\nu } ( v_i^{\nu }-v_i )$, so that $w_i^{l} + w_i^{s}=0$. Conservation of mass for each species requires that ${\rm D}{c}^{\nu }/{\rm D}t + \partial w_i^{\nu }/\partial x_i = 0$, where ${\rm D}(\bullet )/{\rm D}t$ is the material time derivative. Due to the fact that $c^{l} + c^{s} = 1$, only one of $c^{l}$ and $c^{s}$ is independent. Therefore, we utilize $c^{l}$ as the field variable that describes the dynamics of size segregation in the following discussion, and the evolution of $c^{l}$ is governed by its conservation of mass equation
 \begin{equation} \dfrac{{\rm D}{c}^{l}}{{\rm D}t} + \dfrac{\partial w_i^{l}}{\partial x_i} = 0. \end{equation}
2.2. Stress and the equations of motion
We recognize that the symmetric Cauchy stress tensor  $\sigma _{ij} = \sigma _{ji}$ represents the Cauchy stress of the mixture, rather than the partial stress of either species. Regarding stress-related quantities for the granular mixture, we define the pressure $P=-(1/3)\sigma _{kk}$, the stress deviator $\sigma _{ij}' = \sigma _{ij} + P\delta _{ij}$, the equivalent shear stress $\tau = (\sigma _{ij}'\sigma _{ij}'/2)^{1/2}$ and the stress ratio $\mu =\tau /P$. The Cauchy stress is then governed by the standard equations of motion
 \begin{equation} \phi\rho_{s}\frac{{\rm D}v_i}{{\rm D}t}= \frac{\partial \sigma_{ij}}{\partial x_j} + b_i, \end{equation}
where  $\phi$ is the constant total solid fraction, and $b_i$ is the non-inertial body force per unit volume (typically gravitational). In order to close the system of equations, we require (i) rheological constitutive equations for the Cauchy stress $\sigma _{ij}$ and (ii) a constitutive equation for the flux $w_i^{l}$, each of which is discussed in the following subsections.
2.3. Rheological constitutive equations for bidisperse mixtures
In this section, we discuss the rheology of dense, bidisperse granular mixtures. Our strategy for formulating rheological constitutive equations for bidisperse mixtures is to relate mixture-related quantities, such as the Cauchy stress  $\sigma _{ij}$ and the strain-rate tensor ${\mathsf{D}}_{ij}$, instead of specifying constitutive equations for species-specific partial stresses and then combining them to obtain the mixture stress.
The starting point of this discussion is the local inertial, or  $\mu (I)$, rheology (MiDi Reference MiDi2004; da Cruz et al. Reference da Cruz, Emam, Prochnow, Roux and Chevoir2005; Jop et al. Reference Jop, Forterre and Pouliquen2005), which follows from dimensional arguments. For a dense, monodisperse system of dry, stiff grains with mean grain diameter $d$ subjected to homogeneous shearing, the local inertial rheology asserts that the stress ratio $\mu$ is given through the equivalent shear strain rate $\dot {\gamma }$ and the pressure $P$ through the dimensionless relationship $\mu =\mu _{loc}(I)$, where $I=\dot {\gamma }\sqrt {d^2\rho _{s}/P}$ is the inertial number, representing the ratio of the microscopic time scale associated with particle motion $\sqrt {d^2\rho _{s}/P}$ to the macroscopic time scale of applied deformation $1/\dot {\gamma }$. As shown by Rognon et al. (Reference Rognon, Roux, Naaïm and Chevoir2007) and Tripathi & Khakhar (Reference Tripathi and Khakhar2011), the inertial rheology function $\mu _{loc}(I)$ may be straightforwardly generalized from monodisperse to bidisperse systems by defining the inertial number for a bidisperse system as $I = \dot {\gamma }\sqrt {\bar {d}^2\rho _{s}/P}$, where the average mixture grain size for a bidisperse system $\bar {d}$ has been used in place of $d$ for a monodisperse system. Then, the same local rheology function $\mu _{loc}(I)$ utilized for the monodisperse system may be used for bidisperse systems without any changes to the parameters appearing in the fitting function. This approach neglects potential effects of new dimensionless quantities that arise in a bidisperse granular system, such as the grain-size ratio $d^{l}/d^{s}$, but has been shown to capture DEM data well (Rognon et al. Reference Rognon, Roux, Naaïm and Chevoir2007; Tripathi & Khakhar Reference Tripathi and Khakhar2011).
To demonstrate this point, consider DEM simulations of homogeneous, simple shearing of a dense, bidisperse system of disks, illustrated in figure 2(a) for the case of  $d^{l}/d^{s}=1.5$ and a system-wide large-grain concentration of $c^{l}=0.5$. Details of the simulated granular systems, including grain interaction properties, for both two-dimensional disks and three-dimensional spheres are given in Appendix A.1. The large particles are dark grey, and the small particles are light grey. With the system-wide mean grain size denoted by $\bar {d}_0 = c^{l}d^{l} + (1-c^{l})d^{s}$, the rectangular domain has a length of $L=60\bar {d}_0$ in the $x$-direction and a height of $H=60\bar {d}_0$ in the $z$-direction, which is filled with $\sim$5000 flowing grains. Shearing is driven through the relative motion of two parallel, rough walls, which each consist of a thin layer of touching glued grains, denoted as black in figure 2(a). Walls consisting of glued grains are utilized to minimize slip between the walls and the adjacent granular medium and mitigate any potential boundary effects associated with slip. The bottom wall is fixed, and the top wall moves with a velocity $v_{w}$ along the $x$-direction. Following previous works in the literature (da Cruz et al. Reference da Cruz, Emam, Prochnow, Roux and Chevoir2005; Koval et al. Reference Koval, Roux, Corfdir and Chevoir2009; Kamrin & Koval Reference Kamrin and Koval2012; Zhang & Kamrin Reference Zhang and Kamrin2017; Liu & Henann Reference Liu and Henann2018; Kim & Kamrin Reference Kim and Kamrin2020), the $z$-position of the top wall is not fixed but continuously adjusted using a feedback scheme so that the normal stress applied by the top wall is maintained at a target value of $\sigma _{zz}(z=0)=-P_{w}$. Periodic boundary conditions are applied along the $x$-direction. For homogeneous simple shearing, no segregation will occur since the flow is homogeneous and no pressure or strain-rate gradients are present. We utilize the DEM procedures described in detail in Liu & Henann (Reference Liu and Henann2018) in order to extract the relationship between $\mu$ and $I$ for bidisperse mixtures with grain-size ratios of $d^{l}/d^{s} = 1.5, 2.0, 2.5$ and 3.0 and $c^{l}=0.5$. The simulated relationships are plotted in figure 2(b) using triangular symbols of different colours, along with the monodisperse data from Liu & Henann (Reference Liu and Henann2018) plotted as grey circles. The relationship between $\mu$ and $I$ for dense systems of disks is observed to be approximately independent of $d^{l}/d^{s}$. As for the monodisperse case, the DEM data for bidisperse mixtures of disks may be fitted by a linear, Bingham-like functional form
 \begin{equation} \mu_{loc}(I) = \mu_{s} + bI, \end{equation}
as shown by the solid line in figure 2(b), where  $\mu _{s}=0.272$ and $b=1.168$ are the dimensionless material parameters for monodisperse disks (Liu & Henann Reference Liu and Henann2018).
(a) Configuration for two-dimensional DEM simulations of bidisperse simple shear flow. Upper and lower layers of black grains denote rough walls. Dark grey grains indicate large flowing grains, and light grey grains indicate small flowing grains. A  $10\,\%$ polydispersity is utilized for each species to prevent crystallization. (b) The local inertial rheology ( $\mu$ vs $I = \dot {\gamma }\sqrt {\bar {d}^2\rho _{s}/P}$) for monodisperse as well as bidisperse mixtures of disks for grain-size ratios of $d^{l}/d^{s} = 1.5$, 2.0, 2.5 and 3.0 and $c^{l}=0.5$. The solid black line represents the best fit to the monodisperse DEM data using (2.3) with $\mu _{s}=0.272$ and $b=1.168$. (c) The local inertial rheology for monodisperse and bidisperse mixtures of spheres for grain-size ratios of $d^{l}/d^{s} = 1.5$ and 2.0 and $c^{l} = 0.5$ along with the DEM data of Tripathi & Khakhar (Reference Tripathi and Khakhar2011). The solid black curve represents the best fit to the monodisperse DEM data using (2.4) with $\mu _{s}=0.37$, $\mu _2 = 0.95$, and $I_0=0.58$.

Similarly, we consider DEM simulations of homogeneous, simple shearing of dense, bidisperse systems of spheres. The simulation domain consists of a rectangular box of length  $L=20\bar {d}_0$ in the $x$-direction (i.e. the shearing direction), width $W=10\bar {d}_0$ in the $y$-direction (i.e. the direction perpendicular to the plane of shearing) and height $H=40\bar {d}_0$ in the $z$-direction. The domain is filled with $\sim$10 000 flowing grains, and periodic boundary conditions are applied along both the $x$- and $y$-directions. The simulation domain is bounded along the $z$-direction by two parallel, rough walls, consisting of touching glued grains, and as for the case of disks, shearing along the $x$-direction and normal stress along the $z$-direction are applied by the walls. We perform DEM simulations of steady simple shearing for size ratios of $d^{l}/d^{s} = 1.5$ and $2.0$ for a system-wide large-grain concentration of $c^{l}=0.5$ as well as for the monodisperse case over a range of top wall velocities. The $\mu$ vs $I$ relationship extracted from DEM simulations for these cases along with data from the prior DEM study of Tripathi & Khakhar (Reference Tripathi and Khakhar2011) collapse quite well, as shown in figure 2(c), showing minimal dependence on $d^{l}/d^{s}$. This relationship for dense systems of spheres may be fitted using the nonlinear functional form of Jop et al. (Reference Jop, Forterre and Pouliquen2005) for $\mu _{loc}(I)$
 \begin{equation} \mu_{loc}(I) = \mu_{s} + \frac{\mu_2 - \mu_{s}}{I_0/I + 1}, \end{equation}
as shown by the solid curve in figure 2(c), where  $\{\mu _{s} = 0.37, \mu _2 = 0.95, I_0 = 0.58\}$ are the dimensionless parameters for frictional spheres. (We note that these parameters are nearly the same as those determined by Zhang & Kamrin (Reference Zhang and Kamrin2017) for monodisperse frictional spheres.) In this way, one may capture the rheology of bidisperse mixtures of both disks and spheres in homogeneous simple shearing without introducing additional fitting functions or adjustable parameters beyond those used for the monodisperse case.
Despite the successes of the local inertial rheology in capturing steady, homogeneous shear flow, it has been well established in the literature that a local rheological modelling approach cannot be applied to a broad set of inhomogeneous flows that span the quasi-static and dense inertial flow regimes  $(I\lesssim 10^{-1})$, such as annular shear flow (Koval et al. Reference Koval, Roux, Corfdir and Chevoir2009; Tang et al. Reference Tang, Brzinski, Shearer and Daniels2018), split-bottom flow (Fenistein & van Hecke Reference Fenistein and van Hecke2003) and gravity-driven heap flow (Komatsu et al. Reference Komatsu, Inagaki, Nakagawa and Nasuno2001). In these dense, inhomogeneous flows, significant deviation from a one-to-one constitutive relationship $\mu =\mu _{loc}(I)$ is observed (Koval et al. Reference Koval, Roux, Corfdir and Chevoir2009; Kamrin & Koval Reference Kamrin and Koval2012), stemming from the fact that local rheological modelling does not account for cooperative effects, which become dominant in the quasi-static regime. Therefore, to consider inhomogeneous flows of dense, bidisperse granular systems, it is necessary to generalize a non-local rheological modelling approach to the case of dense, bidisperse mixtures. In the present work, we focus attention on the NGF model of Kamrin & Koval (Reference Kamrin and Koval2012), which has been shown to robustly capture a variety of inhomogeneous, steady flows of monodisperse granular systems (Kamrin Reference Kamrin2019). As is standard in the NGF model, we introduce the granular fluidity $g$, which is a positive, scalar field quantity, and recognize that $g$ represents the fluidity of the mixture. (See Zhang & Kamrin (Reference Zhang and Kamrin2017) and Kim & Kamrin (Reference Kim and Kamrin2020) for further discussion of the kinematic description of the granular fluidity field for monodisperse granular systems.) Then, we utilize the steady-state form of the NGF model, which relates the stress state, the strain rate, and the granular fluidity through two constitutive equations: (i) the flow rule and (ii) the non-local rheology.
First, invoking the common idealization that the Cauchy stress deviator and the strain-rate tensor are co-directional (Rycroft, Kamrin & Bazant Reference Rycroft, Kamrin and Bazant2009), the flow rule relates the Cauchy stress tensor  $\sigma _{ij}$, the strain-rate tensor ${\mathsf{D}}_{ij}$ and the granular fluidity through
 \begin{equation} \sigma_{ij} =-P\delta_{ij} + 2\dfrac{P}{g}{\mathsf{D}}_{ij}. \end{equation}
Taking the magnitude of the deviatoric part of (2.5) and rearranging leads to the following scalar form of the flow rule:
 \begin{equation} \dot{\gamma} = g\mu. \end{equation}
Second, the granular fluidity of the bidisperse mixture is governed by the following differential relation:
 \begin{equation} g = g_{loc}(\mu,P) + \xi^2(\mu) \frac{\partial^2 g}{\partial x_i \partial x_i}, \end{equation}
where  $g_{loc}(\mu,P)$ is the local fluidity function and $\xi (\mu )$ is the stress-dependent cooperativity length. The grain size enters (2.7) through (i) the time scale associated with microscopic particle motion that appears in the local fluidity function $g_{loc}(\mu,P)$ and (ii) the length scale that scales the cooperativity length $\xi (\mu )$, and both of these roles must be considered when generalizing the NGF model from monodisperse to bidisperse systems.
The local fluidity function gives the granular fluidity during steady, homogeneous shear flow at a given state of stress and is related to the local inertial rheology function  $\mu _{loc}(I)$. Denote the inverted form of the local inertial rheology function $\mu _{loc}(I)$ as
 \begin{equation} I_{loc}(\mu) = \left\{\begin{array}{@{}ll} \mu^{-1}_{loc}(\mu) & \text{if $\mu>\mu_{s}$,}\\ 0 & \text{if $\mu\le \mu_{s}$,} \end{array}\right. \end{equation}
which is a function of the stress ratio  $\mu$. Then, following the generalization of the local inertial rheology discussed above, in which the time scale associated with microscopic particle motion is taken to be $\sqrt {\bar {d}^2\rho _{s}/P}$ for a bidisperse mixture, the local fluidity function is $g_{loc}(\mu,P) = \sqrt {P/\bar {d}^2\rho _{s}}\, I_{loc}(\mu )/\mu$. For the case of bidisperse disks, using (2.3), the local fluidity function is
 \begin{equation} g_{loc}(\mu,P) = \left\{\begin{array}{@{}ll} \sqrt{\dfrac{P}{\bar{d}^2\rho_{s}}} \, \dfrac{(\mu-\mu_{s})}{b\mu} & \text{if $\mu > \mu_{s}$,}\\ 0 & \text{if $\mu\le\mu_{s}$,}\end{array}\right. \end{equation}
with  $\{\mu _{s}=0.272, b=1.168\}$, and for the case of bidisperse spheres, using (2.4), the local fluidity function is
 \begin{equation} g_{loc}(\mu,P) = \left\{\begin{array}{@{}ll} I_0\sqrt{\dfrac{P}{\bar{d}^2\rho_{s}}}\,\dfrac{(\mu-\mu_{s})}{\mu(\mu_2-\mu)} & \text{if $\mu>\mu_{s}$,}\\[10pt] 0 & \text{if $\mu\le\mu_{s}$,} \end{array} \right. \end{equation}
with  $\{\mu _{s} = 0.37, \mu _2 = 0.95, I_0 = 0.58\}$. No additional adjustable parameters beyond those used to describe the local inertial rheology for the monodisperse case are introduced in the local fluidity function.
As discussed in several of our previous works (Henann & Kamrin Reference Henann and Kamrin2014; Kamrin & Henann Reference Kamrin and Henann2015; Liu & Henann Reference Liu and Henann2017), the manner in which the cooperativity length  $\xi (\mu )$ depends on the stress ratio $\mu$ is also connected to the choice of the $\mu _{loc}(I)$ function. Without going into details here, the functional forms for the cooperativity length corresponding to (2.3) and (2.4) are
 \begin{equation} \xi(\mu) = \frac{A\bar{d}}{\sqrt{|\mu - \mu_{s}|}}\quad\text{and}\quad \xi(\mu) = A\bar{d}\sqrt{\dfrac{(\mu_2-\mu)}{(\mu_2-\mu_{s})|\mu-\mu_{s}|}}, \end{equation}
respectively. The parameter  $A$ is a dimensionless material constant, referred to as the non-local amplitude, which quantifies the spatial extent of cooperative effects. In the monodisperse case, the cooperativity length is directly proportional to the grain size $d$, and motivated by the success in generalizing the local inertial rheology, we follow an analogous approach to generalize the cooperativity length to the bidisperse case. We replace $d$ for monodisperse grains with $\bar {d}$ for bidisperse grains, resulting in the expressions for the cooperativity length (2.11a,b), in which $\xi (\mu )$ is proportional to $\bar {d}$. Regarding the non-local amplitude $A$, we also follow an approach that is analogous to the generalization of the local inertial rheology and utilize values of $A$ previously determined for monodisperse frictional disks and spheres – namely, $A=0.90$ as determined by Liu & Henann (Reference Liu and Henann2018) for monodisperse disks and $A=0.43$ as determined by Zhang & Kamrin (Reference Zhang and Kamrin2017) for monodisperse spheres. The generalization of the cooperativity length and the choices of $A$ for bisdisperse mixtures will be tested in later sections by comparing flow fields predicted by the NGF model with measured flow fields in DEM simulations of bidisperse, inhomogeneous flows.
2.4. Segregation model
The segregation model consists of the constitutive equation for the large-grain flux  $w_i^{l}$. In the present work, we focus on dense flows in the absence of pressure gradients, and we take the large-grain flux $w_i^{l}$ to comprise two contributions: (i) a diffusion flux $w_i^{diff}$ and (ii) a shear-strain-rate-gradient-driven segregation flux $w_i^{seg}$, so that
 \begin{equation} w_i^{l} = w_i^{diff} + w_i^{seg}. \end{equation}
 First, the diffusion flux acts counter to segregation to mix the species and is taken to be given in the standard form, in which the diffusion flux is driven by concentration gradients:  $w_i^{diff} = -D ( \partial c^{l}/\partial x_i )$, where $D$ is the binary diffusion coefficient (Utter & Behringer Reference Utter and Behringer2004; Artoni et al. Reference Artoni, Larcher, Jenkins and Richard2021; Bancroft & Johnson Reference Bancroft and Johnson2021). Following prior works (e.g. Barker et al. Reference Barker, Rauter, Maguire, Johnson and Gray2021; Duan et al. Reference Duan, Umbanhowar, Ottino and Lueptow2021; Trewhela, Ancey & Gray Reference Trewhela, Ancey and Gray2021), based on dimensional arguments, we take the diffusion coefficient for a bidisperse system to be
 \begin{equation} D = C_{diff} \bar{d}^2 \dot{\gamma}, \end{equation}
where  $C_{diff}$ is a dimensionless material parameter which remains to be calibrated. Therefore, we have that the diffusion flux is
 \begin{equation} w_i^{diff} =-C_{diff} \bar{d}^2 \dot{\gamma} \dfrac{\partial c^{l}}{\partial x_i}. \end{equation}
 Second, regarding segregation, a major question is what field quantity drives the segregation flux in the absence of pressure gradients. Gradients of a number of kinematic quantities are possible – e.g. strain rate, velocity fluctuations or fluidity. For perspective, we note that recent works (Fan & Hill Reference Fan and Hill2011b; Hill & Tan Reference Hill and Tan2014; Tunuguntla, Thornton & Weinhart Reference Tunuguntla, Thornton and Weinhart2016; Tunuguntla et al. Reference Tunuguntla, Weinhart and Thornton2017) have shown that gradients in kinetic stress, which are defined through the velocity fluctuations, correlate well with segregation flux. In the present work, we adopt the simplest approach and hypothesize that the segregation flux is driven by gradients in the shear strain rate  $\dot {\gamma }$ and take the segregation flux to be given in the following phenomenological form:
 \begin{equation} w_i^{seg} = C_{seg}^{S} \bar{d}^2 c^{l}(1-c^{l}) \dfrac{\partial \dot{\gamma}}{\partial x_i}. \end{equation}
The factor  $c^{l}(1-c^{l})$ ensures that segregation ceases when the bidisperse mixture becomes either all large $(c^{l} = 1)$ or all small $(c^{l} = 0)$ grains, and the factor $\bar {d}^2$ is present for dimensional consistency. The quantity $C^{S}_{seg}$ is a dimensionless material property. While it is possible for $C^{S}_{seg}$ to depend on the size ratio $d^{l}/d^{s}$, we will demonstrate that this effect is negligible over the range of size ratios considered in the DEM simulations of § 4 and therefore treat $C^{S}_{seg}$ as a constant, dimensionless material parameter, which will be determined by fitting to DEM simulation results for disks and spheres, respectively.
Combining (2.14), (2.15) and (2.12) with conservation of mass (2.1), we obtain the following differential relation governing the dynamics of  $c^{l}$:
 \begin{equation} \dfrac{{\rm D}{c}^{l}}{{\rm D}t} + \dfrac{\partial}{\partial x_i} \left(-C_{diff} \bar{d}^2 \dot{\gamma} \dfrac{\partial c^{l}}{\partial x_i} + C^{S}_{seg} \bar{d}^2 c^{l}(1-c^{l}) \dfrac{\partial \dot{\gamma}}{\partial x_i} \right) = 0 , \end{equation}
where  $\{ C_{diff}, C^{S}_{seg} \}$ represent two constant dimensionless material parameters that remain to be determined.
We close this section by noting that the incompressibility constraint, the equations of motion (2.2), the non-local rheology (2.7) and the segregation dynamics equation (2.16) represent a closed system of equations for the velocity field  $v_i$, the pressure field $P$, the fluidity field $g$ and the large-grain concentration field $c^{l}$, which may be used to simultaneously predict flow fields and the segregation dynamics in the absence of pressure gradients.
3. Diffusion flux
In this section, we determine values of  $C_{diff}$ for dense, bidisperse systems of frictional disks and spheres. Consider homogeneous simple shear flow of such a bidisperse mixture, as shown in figure 2(a) for disks. Again, no segregation occurs in this setting, since neither of the segregation driving forces (pressure gradients or shear-strain-rate gradients) are present (Tripathi & Khakhar Reference Tripathi and Khakhar2011). During steady, simple shearing, the motion of individual grains in the direction transverse to flow (the $z$-direction in figure 2a) approximates a random walk for both two-dimensional systems of disks and three-dimensional systems of spheres. Therefore, by measuring the mean square displacement (MSD) of a system of $N$ particles as a function of time, we may determine the binary diffusion coefficient $D$ (e.g. Natarajan, Hunt & Taylor Reference Natarajan, Hunt and Taylor1995; Campbell Reference Campbell1997; Utter & Behringer Reference Utter and Behringer2004; Cai et al. Reference Cai, Xiao, Zheng and Zhao2019; Bancroft & Johnson Reference Bancroft and Johnson2021) through
 \begin{equation} \text{MSD}(t)=\dfrac{1}{N} \sum_{n=1}^N(z_n(t)-z_n(0))^2 = 2Dt, \end{equation}
where  $z_n(t)$ is the $z$-coordinate of the $n$th grain at time $t$. We simulate homogeneous, steady simple shear flows of disks for grain-size ratios of $d^{l}/d^{s} = 1.5$, 2.0, 2.5 and 3.0 and at various shearing rates. We also simulate homogeneous, steady simple shear flows of spheres for the monodisperse case as well as for grain-size ratios of $d^{l}/d^{s} = 1.5$, 2.0 and 2.5 over a range of shearing rates. To avoid wall effects in the calculation of the MSD (3.1), grains that are initially within $15\bar {d}_0$ of either the top or bottom wall in figure 2(a) are excluded from the system of particles used to calculate the MSD for disks, leaving a set of $N\approx 2400$ grains. For spheres, particles initially within $5\bar {d}_0$ of the top and bottom walls are excluded, so that a set of $N\approx 9000$ grains are used to calculate the MSD. Both large and small grains are included in the calculation of the MSD for the mixture. After a sufficiently long time, the calculated MSD is linear in time in all cases for both disks and spheres, allowing one to extract the diffusion coefficient $D$ for each case.
The diffusion coefficient  $D$ is plotted against $\dot {\gamma }\bar {d}^2$ (with both quantities normalized by $d^{s} \sqrt {P_{w}/\rho _{s}}$) for disks in figure 3(a) and for spheres in figure 3(b). The DEM data for the binary diffusion coefficient collapse to a nearly linear relation with $D\sim \dot {\gamma }\bar {d}^2$ across the range of size ratios and shearing rates considered. A best fit of the slopes of the linear relations – the solid black lines in figures 3(a) and 3(b) – yields
 \begin{equation} C_{diff}=\dfrac{D}{\dot{\gamma}\bar{d}^2}=0.20\text{ for disks and }C_{diff}=\dfrac{D}{\dot{\gamma}\bar{d}^2}=0.045\text{ for spheres.} \end{equation}
These results are consistent with previous results in the literature. For example, for dense, frictional spheres, the recent work of Bancroft & Johnson (Reference Bancroft and Johnson2021) found a value of  $C_{diff}\approx 0.05$ with a weak dependence on the inertial number, and Duan et al. (Reference Duan, Umbanhowar, Ottino and Lueptow2021) estimated a value of $C_{diff}=0.046$. In order to further assess the fitted value of $C_{diff}$ in a diffusion-dominated setting, we have performed a consistency test for disks by considering simple shearing of an initially fully segregated cell, which is described in Appendix B. In this case, diffusion drives remixing of the two species. Using the fitted value of $C_{diff}$ for disks in (3.2), we are able to quantitatively capture the diffusive remixing process, which provides confidence in our fitted value of $C_{diff}$.
The binary diffusion coefficient  $D$, calculated using the MSD (3.1), vs $\dot {\gamma }\bar {d}^2$ in homogeneous, steady simple shear DEM simulations. (a) Data for bidisperse mixtures of disks for grain-size ratios of $d^{l}/d^{ s} = 1.5, 2.0, 2.5$ and 3.0. Both axes are normalized by $d^{s} \sqrt {P_{w}/\rho _{s}}$. Each symbol represents $D$ calculated from one DEM simulation of a specified size ratio at one shearing rate. The solid line represents the best fit of a linear relation with $C_{diff}=0.20$. (b) Data for bidisperse mixtures of spheres for the monodisperse case and for grain-size ratios of $d^{l}/d^{s} = 1.5, 2.0$ and 2.5. The solid line represents the best fit of a linear relation with $C_{diff}=0.045$.

4. Shear-strain-rate-gradient-driven segregation flux
Having independently determined the material parameter  $C_{diff}$ for both frictional disks and spheres, we next turn to testing the constitutive equation for the shear-strain-rate-gradient-driven segregation flux (2.15) and determining the material parameter $C^{S}_{seg}$ by studying two representative flow configurations in the absence of pressure gradients: (i) vertical chute flow and (ii) annular shear flow.
4.1. Vertical chute flow
Consider a dense, bidisperse granular mixture flowing down a long vertical chute with parallel, rough walls separated by a distance  $W$ under the action of gravity $G$. This flow geometry has been utilized extensively in the literature to study dense flows of monodisperse, frictional disks (Kamrin & Koval Reference Kamrin and Koval2012; Liu & Henann Reference Liu and Henann2018) and spheres (Zhang & Kamrin Reference Zhang and Kamrin2017; Kim & Kamrin Reference Kim and Kamrin2020) as well as flows of bidisperse, frictional spheres (Fan & Hill Reference Fan and Hill2011a,Reference Fan and Hillb). Beginning with the case of bidisperse disks, the DEM set-up is shown in figure 4(a) for $W=60\bar {d}_0$, where $\bar {d}_0$ is the system-wide average grain size. In all cases for disks, we take the chute length to be $L=60\bar {d}_0$ and apply periodic boundary conditions along the $z$-direction. The parallel, rough walls consist of touching glued large grains, denoted as black in figure 4(a). The left vertical wall is fixed, and the right wall is fixed in the $z$-direction but can move slightly in the $x$-direction so as to maintain a constant compressive normal stress $P_{w}$ on the granular material, utilizing the same wall-position control method described in Liu & Henann (Reference Liu and Henann2018). We have verified that the chute length $L$ is sufficiently large, so that it does not affect the resulting flow and segregation fields and all fields are invariant along the $z$-direction. In the resulting flow fields, the only non-zero component of the velocity is $v_z$, which only depends on the cross-channel coordinate $x$. A typical steady velocity field is qualitatively sketched in figure 4(a), illustrating that the shear strain rate is greatest at the walls $(x = \pm W/2)$.
(a) Initial well-mixed configuration for two-dimensional DEM simulation of bidisperse vertical chute flow with  $4327$ flowing grains. The chute width is $W=60\bar {d}_0$. As in figure 2, black grains on both sides represent rough walls. (Only large particles are used as wall grains here.) (b) Segregated configuration after flowing for a total simulation time of $\tilde {t} = t/( d^{s}\sqrt {\rho _{s}/P_{w}} )=4.3 \times 10^5$. (c) Spatio-temporal evolution of the large-grain concentration field. Spatial profiles of (d) the concentration field $c^{l}$ and (e) the normalized velocity field $(v_{cen}-v_z)\sqrt {\rho _{s}/P_{w}}$ at three times ( $\tilde {t} =4 \times 10^3$, $4 \times 10^4$ and $4 \times 10^5$) as indicated by the horizontal lines in (c).

In all of our DEM simulations of vertical chute flow of bidisperse disks, we observe that the stress field quickly becomes independent of time, so that macroscopic inertia (i.e. the left-hand side of (2.2)) may be neglected. Moreover, we observe that the normal stresses are approximately equal, i.e.  $\sigma _{zz}\approx \sigma _{xx}$. Therefore, due to the force balance along the $z$-direction, the equivalent shear stress field is $\tau (x) = |\sigma _{xz}(x)| = |\sigma _{zx}(x)| = \phi \rho _{s}G|x|$, where $x$ is measured from the centreline of the chute, and due to the force balance along the $x$-direction, the pressure field is $P(x) = -\sigma _{xx}(x) = P_{w}$. The stress ratio field then follows as
 \begin{equation} \mu(x) = \mu_{w}\left(\dfrac{|x|}{W/2}\right), \end{equation}
where  $\mu _{w}=\phi \rho _{s}GW/2P_{w}$ is the maximum value of $\mu$, occurring at the walls $(x = \pm W/2)$. We note that while flow is driven by gravity, the pressure field is constant throughout the chute and no pressure gradients are present. Therefore, segregation occurs only due to shear-strain-rate gradients, enabling us to consider this effect in isolation.
Apart from the grain interaction properties that are held constant throughout this work (Appendix A.1), there are four important dimensionless parameters that fully describe each case of vertical chute flow of dense, bidisperse granular mixtures: (i)  $W/\bar {d}_0$, the dimensionless chute width; (ii) $\mu _{w}$, the maximum stress ratio, which occurs at the walls and controls the total flow rate; (iii) $c^{l}_0(x)$, the initial large-grain concentration, which is not necessarily constant but can be a spatially varying field; and (iv) $d^{l}/d^{s}$, the bidisperse grain-size ratio. This list of system parameters $\{W/\bar {d}_0,$ $\mu _{w},$ $c^{l}_0,$ $d^{l}/d^{s}\}$ specifies the geometry, loads and initial conditions of a given case of vertical chute flow. As a representative base case, we consider the parameter group $\{W/\bar {d}_0 = 60,\mu _{w}=0.45,c^{l}_0=0.5,d^{l}/d^{s}=1.5\}$. We then run the corresponding DEM simulation starting from the well-mixed initial configuration shown in figure 4(a) and observe that, after a simulation time of $\tilde {t} = t/( d^{s}\sqrt {\rho _{s}/P_{w}} )= 4.3 \times 10^5$, the large, dark-grey grains segregate towards the regions near the walls where the shear strain rate is greatest, while the small, light-grey grains gather in bands just inside these regions, as shown in figure 4(b). A well-mixed core persists along the centre of the vertical chute where the shear strain rate is nearly zero. To obtain a more quantitative picture of the segregation process, we coarse grain the concentration field $c^{l}$ in both space and time and plot contours of the spatio-temporal evolution of $c^{l}$ in figure 4(c). The large-grain concentration field evolves rapidly in time during the initial stages of the segregation process. Then, over longer times, the evolution becomes slower. Spatial profiles of the concentration and velocity fields at three snapshots in time – specifically, $\tilde {t} = t/( d^{s}\sqrt {\rho _{s}/P_{w}} ) =4 \times 10^3$, $4 \times 10^4$ and $4 \times 10^5$ as indicated by the horizontal lines in figure 4(c) – are plotted in figures 4(d) and 4(e). These three snapshots correspond to early, medium, and late times with respect to the segregation process. The spatial $c^{l}$ profiles shown in figure 4(d) demonstrate the transition from a well-mixed state to a segregated state with large-grain-rich and small-grain-rich regions. In figure 4(e), the normalized velocity fields $(v_{cen} - v_z)\sqrt {\rho _{s}/P_{w}}$, relative to the velocity at the centre of the chute, $v_{cen} = v_z(x=0)$, show that the velocity field rapidly develops into a steady flow field, even while the segregation process is still ongoing, and the $c^{l}$ field continues to evolve.
At long times, near the end of the simulated time window ( $\tilde {t} = t/( d^{s}\sqrt {\rho _{ s}/P_{w}} )\gtrsim 3 \times 10^5$), the concentration field evolves very slowly, so that ${\rm D}{c}^{l}/{\rm D}t \approx 0$, and the state of segregation may be regarded as quasi-steady. Therefore, according to (2.1) and (2.12) and the no-flux boundary condition at the walls, the total flux is approximately zero ( $w_i^{l} = w_i^{diff} + w_i^{seg} \approx 0_i$) at each $x$-position, meaning that the segregation flux is approximately balanced by the diffusion flux in this quasi-steady flow regime. Then, using the expressions for the two fluxes, (2.14) and (2.15), this observation implies that
 \begin{equation} C_{diff}\bar{d}^2\dot{\gamma}\dfrac{\partial c^{l}}{\partial x} \approx C^{S}_{seg} \bar{d}^2c^{l}(1-c^{l})\dfrac{\partial \dot{\gamma}}{\partial x}. \end{equation}
The field quantities appearing in this expression may be obtained by coarse graining the DEM data in the quasi-steady flow regime. Therefore, since  $C_{diff}$ has been previously determined, (4.2) may be used to determine the parameter $C^{S}_{seg}$ as follows. First, we acquire the field quantities $c^{l}$ (and hence $\bar {d}$) and $v_z$ by spatially coarse graining $152$ evenly distributed snapshots in time in the quasi-steady regime ( $\tilde {t} > 3 \times 10^5$). (Results are not particularly sensitive to the quasi-steady regime criterion, and this value is only provided as a guideline.) Then, we arithmetically average these fields in time, yielding fields that only depend on the spatial coordinate $x$, and take spatial gradients, as described in Appendix A.2, to obtain ${\partial c^{l}}/{\partial x}$, $\dot {\gamma } = {\partial v_z}/{\partial x}$ and ${\partial \dot {\gamma }}/{\partial x} = {\partial ^2 v_z}/{\partial x^2}$. Next, as suggested by (4.2), we plot $C_{diff}\bar {d}^2\dot {\gamma }({\partial c^{l}}/{\partial x})$ vs $\bar {d}^2c^{l}(1-c^{l})({\partial \dot {\gamma }}/{\partial x})$ in figure 5(a), in which each symbol represents a unique $x$-position. A linear relation is observed, supporting our choice for the form of the constitutive equation for the segregation flux (2.15). In order to obtain further evidence for this choice, we consider four additional cases: (i) a lower flow rate case $\{W/\bar {d}_0 = 60,\mu _{w}=0.375,c^{l}_0=0.5,d^{l}/d^{s}=1.5\}$; (ii) a narrower channel case $\{W/\bar {d}_0 = 40,\mu _{w}=0.45,c^{l}_0=0.5,d^{l}/d^{s}=1.5\}$; (iii) a more large grains case $\{W/\bar {d}_0 = 60,\mu _{w}=0.45,c^{l}_0=0.75,d^{l}/d^{s}=1.5\}$; and (iv) a larger size ratio case $\{W/\bar {d}_0 = 60,\mu _{w}=0.45,c^{l}_0=0.5,d^{l}/d^{s}=3.0\}$. Coarse graining the quasi-steady fields for each case and including the field data in figure 5(a), we observe a strong linear collapse. Finally, the dimensionless material parameter $C_{seg}^{S}$ may be obtained from the slope of the linear relation in figure 5(a) (indicated by the solid line). We determine the numerical value for disks to be $C^{S}_{seg}=0.23$ and note that this value indeed appears to be independent of the grain-size ratio $d^{l}/d^{s}$ over the range of 1.5 to 3.0 for disks.
Collapse of  $C_{diff}\bar {d}^2\dot {\gamma }({\partial c^{l}}/{\partial x})$ vs $\bar {d}^2c^{l}(1-c^{l})({\partial \dot {\gamma }}/{\partial x})$ for several cases of vertical chute flow of (a) bidisperse disks and (b) bidisperse spheres. Symbols represent coarse-grained, quasi-steady DEM field data, and the solid lines are the best linear fits using (a) $C^{S}_{seg}=0.23$ for disks and (b) $C^{S}_{seg}=0.08$ for spheres.

We carry out an analogous set of DEM simulations for dense, bidisperse mixtures of spheres to determine the value of  $C^{S}_{seg}$ for spheres. The DEM set-up for spheres is similar to that shown in figure 4(a) for disks with a domain size of length $L=20\bar {d}_0$ in the $z$-direction, width $W$ in the $x$-direction, which is varied in our DEM simulations, and out-of-plane thickness $H=10\bar {d}_0$ in the $y$-direction. Periodic boundary conditions are applied along both the $y$- and $z$-directions for spheres, and a constant compressive normal stress $\sigma _{xx} = -P_w$ is applied using the same feedback scheme as utilized for disks. In DEM simulations of dense flows of spheres, we observe normal stress differences, in which the normal stresses $\sigma _{yy}$ and $\sigma _{zz}$ are slightly different from the prescribed value of $\sigma _{xx}= -P_w$, which is a widely reported feature of dense flows of spheres in the literature (e.g. Srivastava et al. Reference Srivastava, Silbert, Grest and Lechman2021). However, all normal stresses, and hence the pressure field, are spatially uniform, and segregation occurs only due to shear-strain-rate gradients. As for disks, the set of system parameters $\{W/\bar {d}_0,$ $\mu _{w},$ $c^{l}_0,$ $d^{l}/d^{s}\}$ specifies the geometry, loads and initial conditions for a given case of vertical chute flow. Here, the dimensionless parameter $\mu _{w} = \phi \rho _{s}GW/2P_{w}$ continues to control the total flow rate down the chute. We consider five different cases: (i) a base case $\{W/\bar {d}_0 = 60,\mu _{w}=0.51,c^{l}_0=0.5,d^{l}/d^{s}=1.5\}$; (ii) a lower flow rate case $\{W/\bar {d}_0 = 60,\mu _{w}=0.46,c^{l}_0=0.5,d^{l}/d^{s}=1.5\}$; (iii) a narrower channel and higher flow rate case $\{W/\bar {d}_0 = 50,\mu _{w}=0.59,c^{l}_0=0.5,d^{l}/d^{s}=1.5\}$; (iv) a more large grains and higher flow rate case $\{W/\bar {d}_0 = 60,\mu _{w}=0.58,c^{l}_0=0.75,d^{l}/d^{s}=1.5\}$; and (v) a larger size ratio and higher flow rate case $\{W/\bar {d}_0 = 60,\mu _{w}=0.58,c^{l}_0=0.5,d^{l}/d^{s}=2.0\}$. Each case involves $\sim$20 000 flowing grains. After a sufficiently long simulation time, a quasi-steady state is attained in each case, implying the flux balance (4.2). The quasi-steady field quantities appearing in (4.2) are extracted for 1000 snapshots in time using the coarse-graining techniques described in Appendix A.2 and then arithmetically averaged in time. The calculated quasi-steady diffusion flux $C_{diff}\bar {d}^2\dot {\gamma }({\partial c^{l}}/{\partial x})$ at discrete $x$-positions for each of the five cases is plotted vs the calculated quantity $\bar {d}^2c^{l}(1-c^{l})({\partial \dot {\gamma }}/{\partial x})$ in figure 5(b), and we observe a linear relation. Therefore, the form of the constitutive equation for the segregation flux (4.2) is also applicable to dense, bidisperse systems of spheres. The numerical value of the dimensionless material parameter $C^{S}_{seg}$ for spheres is determined from the slope of the linear relation to be $C^{S}_{seg} = 0.08$, which appears to be independent of the grain-size ratio $d^{l}/d^{s}$ over the range of 1.5 to 2.0 for spheres.
4.2. Annular shear flow
The constitutive equation for the segregation flux (2.15) and the fitted values of the material parameters should be general across different flow geometries. To test this for the case of disks, we apply the same process described in the preceding section for vertical chute flow to a different flow geometry – annular shear flow. In this flow geometry, flow is driven through motion of the boundary rather than by gravity, but as in vertical chute flow, the pressure field is spatially uniform, which eliminates hydrostatic pressure gradients so that only shear-strain-rate-gradient-driven size segregation occurs.
Our DEM simulations of annular shear flow of a dense, bidisperse granular mixture of disks follow the procedures utilized in prior works in the literature for monodisperse, frictional disks (Koval et al. Reference Koval, Roux, Corfdir and Chevoir2009; Kamrin & Koval Reference Kamrin and Koval2012, Reference Kamrin and Koval2014; Liu & Henann Reference Liu and Henann2018). Consider a dense, bidisperse granular mixture in a two-dimensional annular shear cell with rough circular walls of inner radius  $R$ and outer radius $R_{o}$, as shown in figure 6(a) for the case of $R=60\bar {d}_0$. The inner and outer walls consist of rings of glued large grains, denoted as black in figure 6(a). The circumferential velocity of the inner wall is prescribed to be $v_{w}$, and its radial position is fixed. The outer wall does not rotate, and its radius $R_{o}$ fluctuates slightly so as to maintain a constant imposed compressive normal stress $P_{w}$, utilizing the wall-position control method used throughout this work (Koval et al. Reference Koval, Roux, Corfdir and Chevoir2009). As in Liu & Henann (Reference Liu and Henann2018), we simulate the full shear cell, as shown in figure 6(a), instead of applying periodic boundary conditions along the circumferential direction to a slice (Koval et al. Reference Koval, Roux, Corfdir and Chevoir2009; Kamrin & Koval Reference Kamrin and Koval2012, Reference Kamrin and Koval2014). In this flow geometry, all fields are axisymmetric (i.e. invariant along the $\theta$-direction), and the only non-zero component of the velocity field is the circumferential component $v_\theta$. Moreover, flow tends to localize near the inner wall with $v_\theta$ rapidly decaying with radial position, as qualitatively illustrated by the steady velocity field sketched in figure 6(a). We choose the outer radius $R_{o}$ to be sufficiently large so that it does not affect the resulting flow and segregation fields, and based on our experience, we take $R_{o}=2R$. Therefore, the role of the outer wall is simply to apply a far-field pressure, and otherwise, it does not affect the flow and segregation fields.
(a) Initial well-mixed configuration for two-dimensional DEM simulation of bidisperse annular shear flow with 40 108 flowing grains. The inner-wall radius is  $R=60\bar {d}_0$, and the outer-wall radius is $R_{o}=2R$. The inner and outer walls consist of rings of glued large grains, denoted as black. (b) Segregated configuration after flowing for a total simulation time of $\tilde {t}=t/( R/v_{w} )=584$. (c) Spatio-temporal evolution of the large-grain concentration field. Spatial profiles of (d) the concentration field $c^{l}$ and (e) the normalized circumferential velocity field ${v}_\theta /v_{w}$ at three times ( $\tilde {t}=5$, $50$ and $500$) as indicated by the horizontal lines in (c).

Regarding the stress field, in all of our DEM simulations of annular shear flow of bidisperse disks, we observe that the normal stresses are approximately equal, i.e.  $\sigma _{rr}\approx \sigma _{\theta \theta }$, and spatially uniform, so that the force balance along the $r$-direction gives that the pressure field is $P(r) = -\sigma _{rr}(r) = P_{w}$. Since the pressure field is spatially uniform, all segregation in annular shear flow is due to shear-strain-rate gradients. The moment balance gives that the equivalent shear stress field is $\tau (r) = |\sigma _{r\theta }(r)| = |\sigma _{\theta r}(r)| = \tau _{w}(R/r)^2$, where $\tau _{w}$ is the inner-wall shear stress. It is important to note that $\tau _{w}$ is not directly prescribed in our DEM simulations. Instead, the inner-wall velocity $v_{w}$ is prescribed, and $\tau _{w}$ arises as a result. The stress ratio field is then
 \begin{equation} \mu(r) = \mu_{w}(R/r)^2, \end{equation}
where  $\mu _{w}=\tau _{w}/P_{w}$ is the maximum value of $\mu$, occurring at the inner wall $(r = R)$.
As for vertical chute flow, there are four important dimensionless parameters that specify the geometry, loads and initial conditions for a given case of annular shear flow of dense, bidisperse granular mixtures: (i)  $R/\bar {d}_0$, the dimensionless inner-wall radius; (ii) $\tilde {v}_{w} = (v_{w}/R)\sqrt {{\rm \pi} \bar {d}_0^2\rho _{s}/(4P_{w})}$, the dimensionless inner-wall velocity, which determines $\tau _{w}$ and hence $\mu _{w}$; (iii) $c^{l}_0(r)$, the initial large-grain concentration field; and (iv) $d^{l}/d^{s}$, the bidisperse grain-size ratio. We choose a representative base case of annular shear flow identified by the parameter set $\{R/\bar {d}_0 = 60,\tilde {v}_{w}=0.01,c^{l}_0=0.5,d^{l}/d^{s}=1.5\}$. The well-mixed initial configuration for the base-case DEM simulation is shown in figure 6(a), and the segregated configuration after driving flow for a total simulation time of $\tilde {t}=t/( R/v_{w} )=584$ is shown in figure 6(b). The large, dark-grey grains segregate into a ring near the inner wall, while the small, light-grey grains form a band just outside this region. Outside of these bands, where the shear strain rate is very small, the large and small grains remain well mixed. Contours of the spatio-temporal evolution of the coarse-grained concentration field $c^{l}$ are plotted in figure 6(c), illustrating the time evolution of the $c^{l}$ field. Spatial profiles of the concentration and velocity fields at three selected snapshots during the segregation dynamics ( $\tilde {t}=t/( R/v_{w} )=5, 50$ and 500 as indicated by the dashed lines in figure 6c) are shown in figures 6(d) and 6(e). The radial $c^{l}$ profiles in figure 6(d) demonstrate the formation of large-grain-rich and small-grain-rich regions with a persistent well-mixed far field. The normalized velocity fields in figure 6(e) demonstrate that the flowing zone is localized near the inner wall with slow creeping flow observed far from the wall. As in the case of vertical chute flow, the velocity field quickly develops into a steady flow field, while the large-grain concentration field $c^{l}$ evolves over a longer time scale.
Again, at long times, near the end of the simulated time window ( $\tilde {t}=t/( R/v_{w} )\gtrsim 500$), the concentration field evolves very slowly, which we identify as the quasi-steady regime. (We note that this is not a true steady state and that over even longer times, the concentration field will continue to evolve very slowly to more and more segregated states.) In this regime, the segregation and diffusion fluxes approximately balance at each $r$-position, implying that
 \begin{equation} C_{diff}\bar{d}^2\dot{\gamma}\dfrac{\partial c^{l}}{\partial r} \approx C^{S}_{seg} \bar{d}^2c^{l}(1-c^{l})\dfrac{\partial \dot{\gamma}}{\partial r} . \end{equation}
As for vertical chute flow, we spatially coarse grain the DEM data to obtain the  $c^{l}$ and $v_\theta$ fields for $144$ evenly distributed snapshots in time in the quasi-steady regime ( $\tilde {t} \gtrsim 500$), which are arithmetically averaged in time to obtain the quasi-steady $c^{l}(r)$ and $v_\theta (r)$ fields and then spatially differentiated to obtain the remaining field quantities in (4.4). Next, we plot $C_{diff}\bar {d}^2\dot {\gamma }({\partial c^{l}}/{\partial r})$ vs $\bar {d}^2c^{l}(1-c^{l})({\partial \dot {\gamma }}/{\partial r})$ in figure 7 with each symbol representing a unique $r$-position. Finally, this process is repeated for four additional cases of annular shear flow: (i) a lower inner-wall velocity $\{R/\bar {d}_0 = 60,\tilde {v}_{w}=0.001,c^{l}_0=0.5,d^{l}/d^{s}=1.5\}$; (ii) a smaller inner-wall radius $\{R/\bar {d}_0 = 40,\tilde {v}_{w}=0.01,c^{l}_0=0.5,d^{l}/d^{s}=1.5\}$; (iii) more large grains $\{R/\bar {d}_0 = 60,\tilde {v}_{w}=0.01,c^{l}_0=0.75,d^{l}/d^{s}=1.5\}$; and (iv) a larger size ratio $\{R/\bar {d}_0 = 60,\tilde {v}_{w}=0.01,c^{l}_0=0.5,d^{l}/d^{s}=3.0\}$, and the coarse-grained, quasi-steady fields are included in the data plotted in figure 7. Collectively, we observe a strong collapse to a linear relation. Crucially, the slope of the linear relation in figure 7 (indicated by the solid line) gives the same value for the dimensionless material parameter $C_{seg}^{S}$ obtained by fitting to vertical chute flow data, $C_{seg}^{S}=0.23$. This observation of agreement between the best fit values of $C_{seg}^{S}$ obtained using two different flow geometries provides support for our choice of the constitutive equation for the segregation flux (2.15) and the fitted value of $C^{S}_{seg}$ for disks. Having established that the parameter $C^{S}_{seg}$ is independent of the flow geometry, driving conditions and initial conditions, we henceforth regard $C^{S}_{seg}$ as a material parameter for a given dense granular system, analogous to how rheological material parameters such as $\mu _{s}$ are regarded. Of course, the values of $C^{S}_{seg}$ determined above for disks and spheres likely depend on grain interaction properties, such as the inter-particle friction coefficient, but elucidating this dependence is beyond the scope of the present work.
Collapse of  $C_{diff}\bar {d}^2\dot {\gamma }({\partial c^{l}}/{\partial r})$ vs $\bar {d}^2c^{l}(1-c^{l})({\partial \dot {\gamma }}/{\partial r})$ for several cases of annular shear flow of bidisperse disks. Symbols represent coarse-grained, quasi-steady DEM field data, and the solid line is the best linear fit using $C^{S}_{seg}=0.23$.

5. Validation of the continuum model in the transient regime
In the preceding section, we only used DEM data from the quasi-steady regime to test the constitutive equation for the shear-strain-rate-gradient-driven segregation flux (2.15) and to determine the material parameter  $C_{seg}^{S}$. In this section, we compare continuum model predictions of the transient evolution of segregation and flow fields with the DEM data for both vertical chute flow and annular shear flow as a validation test of the model. To obtain continuum model predictions in the transient regime, we couple the segregation dynamics equation (2.16) with the NGF model, (2.6) and (2.7), and use fixed sets of material parameters for disks
 \begin{equation} \{ \mu_{s}=0.272, b=1.168, A=0.90, C_{diff}=0.20, C^{S}_{seg}=0.23 \}, \end{equation}
and for spheres
 \begin{equation} \{ \mu_{s}=0.37, \mu_2=0.95, I_0=0.58, A=0.43, C_{diff}=0.045, C^{S}_{seg}=0.08 \}. \end{equation}
5.1. Vertical chute flow
First, we describe in detail how the continuum model is solved to obtain predictions for the transient evolution of segregation and flow fields for the case of vertical chute flow of disks. In vertical chute flow, the stress field may be straightforwardly deduced from a static force balance, giving that the pressure field is uniform,  $P(x) = P_{w}$, and that the stress ratio field $\mu (x)$ is given through (4.1) and, therefore, the balance of linear momentum (2.2) is satisfied and does not further enter the solution procedure. Continuum model predictions are obtained by numerically solving the remaining governing equations using finite differences. Summarizing the coupled boundary/initial-value problem for flow and segregation in the context of vertical chute flow, the unknown fields are the velocity field $v_z(x,t)$ and the accompanying strain-rate field $\dot {\gamma }(x,t) = \partial v_z/\partial x$, the granular fluidity field $g(x,t)$ and the large-grain concentration field $c^{l}(x,t)$. The governing equations are (i) the flow rule (2.6)
 \begin{equation} \dot{\gamma} = g\mu, \end{equation}
(ii) the non-local rheology (2.7)
 \begin{equation} g = g_{loc}(\mu,P_{w}) + \xi^2(\mu)\dfrac{\partial^2 g}{\partial x^2}, \end{equation}
with  $g_{loc}$ and $\xi$ given through (2.9) and (2.11a), respectively, and (iii) the segregation dynamics equation (2.16)
 \begin{equation} \dfrac{\partial c^{l}}{\partial t} + \dfrac{\partial}{\partial x}\left(-C_{diff}\bar{d}^2\dot{\gamma}\dfrac{\partial c^{l}}{\partial x} + C^{S}_{seg}\bar{d}^2c^{l}(1 - c^{l})\dfrac{\partial \dot{\gamma}}{\partial x}\right) = 0, \end{equation}
where  $\bar {d} = c^{l}d^{l} + (1-c^{l})d^{s}$.
The non-local rheology (5.4) requires non-standard boundary conditions for the granular fluidity field at the walls. Walls consisting of touching glued grains are employed in the DEM simulations throughout this work, and to select a reasonable fluidity boundary condition for this type of wall, we look to DEM simulation results for the simple shear flows of figure 2, in which we observe a spatially uniform strain-rate field with minimal deviation near the walls. Therefore, we elect to use a fluidity boundary condition that would predict a uniform strain-rate field when applied to these simple shear flows. There are two options: (i) a Dirichlet boundary condition wherein the fluidity at the boundary is a function of the stress state through the local fluidity function, i.e.  $g = g_{loc}(\mu _{w},P_{w})$ at $x=\pm W/2$ for vertical chute flow, or (ii) a homogeneous Neumann fluidity boundary condition, i.e. $\partial g/\partial x$ at $x=\pm W/2$ for vertical chute flow. Other choices for the fluidity boundary condition would result in a non-uniform solution for the fluidity field (and hence the strain-rate field) when applied to simple shear flow, in which deviations from a uniform strain-rate field arise in boundary layers at the walls. We have tested both of these options for the fluidity boundary conditions and found that continuum model predictions are similar for all cases of vertical chute flow and annular shear flow considered in the present work. In all continuum model predictions that follow, we impose inhomogeneous Dirichlet fluidity boundary conditions at the walls. Regarding boundary conditions for (5.5), we impose no-flux boundary conditions at the walls, i.e. $w_x^{l} = -C_{diff} \bar {d}^2 \dot {\gamma } (\partial c^{l}/\partial x) + C^{S}_{seg} \bar {d}^2 c^{l}(1 - c^{l})(\partial \dot {\gamma }/\partial x) = 0$ at $x=\pm W/2$. Due to the time derivative in (5.5), an initial condition for the concentration field $c^{l}_0(x) = c^{l}(x,t=0)$ is required. In order to account for the concentration fluctuations inherent in the initial state, we obtain the coarse-grained $c^{l}$ field from the initial DEM configuration for each case and utilize this field as the initial condition field $c_0^{l}(x)$ in each of the respective continuum simulations.
Then, for a given case identified through a set of input parameters  $\{W/\bar {d}_0,$ $\mu _{w},$ $c^{l}_0(x),$ $d^{l}/d^{s}\}$, we obtain numerical predictions of the continuum model utilizing finite differences as follows. First, at a given point in time, the concentration field $c^{l}(x)$ is known, allowing the average grain-size field to be calculated through $\bar {d}(x) = c^{l}(x)d^{l} + (1-c^{l}(x))d^{s}$. Using the stress ratio field $\mu (x)$ for vertical chute flow (4.1), the local fluidity $g_{loc}(\mu,P)$ and the cooperativity length $\xi (\mu )$ ((2.9) and (2.11a)) may be calculated at each spatial grid point. Then, the non-local rheology (5.4) may be used to solve for the fluidity field $g(x)$ at the current step, using central differences in space. The strain-rate field follows using (5.3), which may be integrated to obtain the velocity field $v_z(x)$. Next, (5.5) is used to determine the concentration field at the next time step utilizing the forward Euler method and central differences in space with one modification – the spatial derivatives of $c^{l}$ appearing in the diffusion flux term in (5.5) are treated implicitly in order to improve numerical stability. This completes one time step, and this process is repeated to step forward in time and calculate the transient evolution of the concentration and flow fields, $c^{l}(x,t)$ and $v_z(x,t)$. In our finite-difference calculations, we utilize a fine spatial resolution of $\Delta x \ll \bar {d}_0$, and we have verified that the time step is sufficiently small in order to ensure stable, accurate results.
We compare predictions of the continuum model against DEM data for all five cases of vertical chute flow considered in § 4.1 in order to test the generality of the model. Figures 8 and 9 summarize the comparisons for these five cases. The first columns of figures 8 and 9 show the spatio-temporal contours of the evolution of the  $c^{l}$ field measured in the DEM simulations for each case, and the second columns show comparisons of the DEM simulations (solid black lines) and the continuum model predictions (dashed grey lines) for the $c^{l}$ field at four snapshots in time ( $\tilde {t} = t/( d^{s}\sqrt {\rho _{s}/P_{w}} ) =4 \times 10^3$, $2 \times 10^4$, $1 \times 10^5$ and $4 \times 10^5$), indicated by the horizontal lines in the first columns of figures 8 and 9. Based on figures 8 and 9, the coupled model generally does a good job capturing the salient features of the evolution of the $c^{l}$ field across all cases. For instance, for the narrower chute case shown in figure 8(c), the segregation process nearly completes within the simulated time window with the mixed core along the centre of the chute nearly disappearing, and the continuum model prediction captures this observation well.
Comparisons of continuum model predictions with corresponding DEM simulation results for the transient evolution of the segregation dynamics for three cases of vertical chute flow of disks. (a) Base case  $\{W/\bar {d}_0 = 60,\mu _{w}=0.45,c^{l}_0=0.5,d^{l}/d^{s}=1.5\}$. (b) Lower flow rate case $\{W/\bar {d}_0 = 60,\mu _{w}=0.375,c^{l}_0=0.5,d^{l}/d^{s}=1.5\}$. (c) Narrower chute width case $\{W/\bar {d}_0 = 40,\mu _{w}=0.45,c^{l}_0=0.5,d^{l}/d^{s}=1.5\}$. Additional cases are shown in figure 9. For each case, the first column shows spatio-temporal contours of the evolution of $c^{l}$ measured in the DEM simulations. The second column shows comparisons of the DEM simulations (solid black lines) and continuum model predictions (dashed grey lines) of the $c^{l}$ field at four time snapshots representing different stages of the segregation process: $\tilde {t}=4 \times 10^3$, $2 \times 10^4$, $1 \times 10^5$ and $4 \times 10^5$ in the sequence of top left, top right, bottom left, bottom right. The third column shows comparisons of the quasi-steady, normalized velocity profiles at $\tilde {t}=4 \times 10^5$ from DEM simulations and continuum model predictions.

Comparisons of continuum model predictions with corresponding DEM simulation results for the transient evolution of the segregation dynamics for two cases of vertical chute flow of disks. (a) More large grains case  $\{W/\bar {d}_0 = 60,\mu _{w}=0.45,c^{l}_0=0.75,d^{l}/d^{ s}=1.5\}$. (b) Larger size ratio case $\{W/\bar {d}_0 = 60,\mu _{w}=0.45,c^{l}_0=0.5,d^{l}/d^{s}=3.0\}$. Additional cases are shown in figure 8. Results are organized as described in the caption of figure 8.

Regarding flow fields, comparisons of the quasi-steady, normalized velocity fields at  $\tilde {t} = 4 \times 10^5$ from the DEM simulations and the continuum model predictions are shown in the third columns of figures 8 and 9. Since the velocity field evolves minimally during the segregation process, only the flow field at long time is shown. We note that the velocity field is well predicted in all cases, including the creeping regions far from the wall. This favourable comparison stems from the ability of the NGF model to transition seamlessly between the dense inertial flow regime, such as the region near the walls in vertical chute flow where $\mu >\mu _{s}$, and the quasi-static flow regime, such as the central region of the chute where $\mu <\mu _{s}$. Further, the good agreement provides support for the assumptions underlying our generalization of the NGF model to bidisperse granular systems discussed in § 2.3 – in particular, the choices to use the average grain size $\bar {d}$ in the expression for the cooperativity length (2.11a) and to continue to use the numerical value for the non-local amplitude determined for monodisperse systems, $A=0.90$, without refitting. We note that since the diffusion and segregation fluxes in our model depend strongly on the flow kinematics through the strain rate and its gradient, respectively, accurate predictions of flow kinematics obtained using the generalized NGF model are crucial to successfully capturing the dynamics of the concentration field using the segregation model (5.5). To illustrate this point, the results of figure 8(a) are compared with predictions of the segregation model when coupled with a regularized version of the $\mu (I)$ rheology rather than the NGF model in Appendix C.
Next, we make comparisons between continuum model predictions and DEM data for vertical chute flow of bidisperse spheres. The governing equations and boundary conditions are the same as those used above for bidisperse disks. That is, the fluidity field is governed by the non-local rheology (5.4) with Dirichlet fluidity boundary conditions at the walls ( $g=g_{loc}(\mu _{w}, P_{w})$ at $x=\pm W/2$), and the concentration field is governed by the segregation dynamics equation (5.5) with no-flux boundary conditions at the walls ( $w_x^{l}=0$ at $x=\pm W/2$). The only difference from the process described above for bidisperse disks is that the values $P_{w}$ and $\mu _{w}$ used in the continuum simulations are obtained from the coarse-grained stress fields in the DEM data for each case, rather than based on the nominal value of the compressive wall stress $P_{w}$ applied in the DEM simulation. This is done to account for the normal stress differences that arise for spheres, which slightly affect the predicted velocity fields and hence the consequent concentration fields. We consider three different cases: (i) the base case $\{W/\bar {d}_0 = 60,\mu _{w}=0.51,c^{l}_0=0.5,d^{l}/d^{s}=1.5\}$, (ii) the more large grains and higher flow rate case $\{W/\bar {d}_0 = 60,\mu _{w}=0.58,c^{l}_0=0.75,d^{l}/d^{s}=1.5\}$ and (iii) the larger size ratio and higher flow rate case $\{W/\bar {d}_0 = 60,\mu _{w}=0.58,c^l_0=0.5,d^l/d^s=2.0\}$, which are shown in figures 10(a), 10(b), and 10(c), respectively. The first column of figure 10 shows the spatio-temporal contours of the evolution of the $c^{l}$ field from the DEM data. The second column shows comparisons between the DEM simulations (solid black lines) and the continuum model predictions (dashed grey lines) for the $c^{l}$ field at four snapshots in time ( $\tilde {t} = t/( d^{s}\sqrt {\rho _{s}/P_{w}} ) =5 \times 10^2$, $2 \times 10^3$, $1 \times 10^4$ and $4.5 \times 10^4$), indicated by the horizontal lines in the first column of figure 10. Lastly, comparisons of the quasi-steady, normalized velocity fields at $\tilde {t} = 4.5 \times 10^4$ from the DEM simulations and the continuum model predictions are shown in the third column of figure 10. The continuum model is able to capture the decaying velocity field quite well in all cases, and therefore, our choice to continue using the value of the non-local amplitude estimated for monodisperse systems, $A=0.43$, without readjustment works well for spheres. Overall, the coupled continuum model is capable of quantitatively predicting both the flow fields and the transient evolution of the segregation dynamics in vertical chute flow of bidisperse spheres.
Comparisons of continuum model predictions with corresponding DEM simulation results for the transient evolution of the segregation dynamics for three cases of vertical chute flow of spheres. (a) Base case  $\{W/\bar {d}_0 = 60,\mu _{w}=0.51,c^{l}_0=0.5,d^{l}/d^{s}=1.5\}$. (b) More large grains and higher flow rate case $\{W/\bar {d}_0 = 60,\mu _{w}=0.58,c^{l}_0=0.75,d^{l}/d^{s}=1.5\}$. (c) Larger grain-size ratio and higher flow rate case $\{W/\bar {d}_0 = 60,\mu _{w}=0.58,c^{l}_0=0.5,d^{l}/d^{s}=2.0\}$. Results are organized as described in the caption of figure 8.

5.2. Annular shear flow
We utilize an analogous process to obtain continuum model predictions for the transient evolution of concentration and flow fields in annular shear flow of disks. In annular shear, based on the static force and moment balances, the pressure field is uniform,  $P(r)=P_{w}$, and the stress ratio field is given by (4.3). The governing equations (5.4) and (5.5) are modified to appropriately account for the divergence and Laplacian operators in cylindrical coordinates. Also, since $v_{w}$, not $\mu _{w}$, is specified in our DEM simulations of annular shear, while $\mu _{w}$ is specified in our continuum simulations, we iteratively adjust the value of $\mu _{w}$ input into our continuum simulations in order to achieve the target value of $v_{w}$ in the predicted quasi-steady flow field. Otherwise, our process for obtaining numerical predictions from the continuum model is the same. Dirichlet fluidity boundary conditions and no-flux boundary conditions are imposed at the walls, and the initial concentration field is extracted from the initial DEM configuration for each case.
Then, we compare continuum model predictions against DEM data for the five cases of annular shear flow discussed in § 4.2 in order to further validate the model. Figures 11 and 12 summarize the comparisons for these fives cases and are organized in the same manner as figures 8 and 9. Again, the coupled, continuum model does a good job capturing the segregation dynamics and its dependence on the input parameters. Moreover, the quasi-steady velocity fields are well predicted by the NGF model in all cases, including the quasi-static, creeping region far from the inner wall, which is key to accurately capturing the evolution of the concentration field. We reiterate that all continuum model predictions are obtained using the same set of material parameters for disks (5.1). As for vertical chute flow, to illustrate the key role played by the NGF model in capturing the segregation dynamics, the results of figure 11(a) for the base case of annular shear flow are compared with predictions of the segregation model when coupled with a local rheological model in Appendix C.
Comparisons of the continuum model predictions with corresponding DEM simulation results for the transient evolution of the segregation dynamics for three cases of annular shear flow of disks. (a) Base case  $\{R/\bar {d}_0 = 60,\tilde {v}_{w}=0.01,c^{l}_0=0.5,d^{l}/d^{s}=1.5\}$. (b) Lower inner-wall velocity case $\{R/\bar {d}_0 = 60,\tilde {v}_{w}=0.001,c^{l}_0=0.5,d^{l}/d^{s}=1.5\}$. (c) Smaller annular shear cell case $\{R/\bar {d}_0 = 40,\tilde {v}_{w}=0.01,c^{l}_0=0.5,d^{l}/d^{s}=1.5\}$. Additional cases are shown in figure 12. For each case, the first column shows spatio-temporal contours of the evolution of $c^{l}$ measured in the DEM simulations. The second column shows comparisons of the DEM simulations (solid black lines) and continuum model predictions (dashed grey lines) of the $c^{l}$ field at four time snapshots representing different stages of the segregation process: $\tilde {t}=5$, $50$,
$50$,  $200$ and $550$ in the sequence of top left, top right, bottom left, bottom right. The third column shows comparisons of the quasi-steady, normalized velocity profiles at $\tilde {t}=550$ from DEM simulations and continuum model predictions.

Comparisons of the continuum model predictions with corresponding DEM simulation results for the transient evolution of the segregation dynamics for two cases of annular shear flow of disks. (a) More large grains case  $\{R/\bar {d}_0 = 60,\tilde {v}_{w}=0.01,c^{l}_0=0.75,d^{l}/d^{s}=1.5\}$. (b) Larger size ratio case $\{R/\bar {d}_0 = 60,\tilde {v}_{w}=0.01,c^{l}_0=0.5,d^{l}/d^{s}=3.0\}$. Additional cases are shown in figure 11. Results are organized as described in the caption of figure 11.

6. Discussion and conclusion
In this paper, we studied coupled size segregation and flow in dense, bidisperse granular systems of disks and spheres and developed a phenomenological continuum model that captures the simultaneous evolution of both segregation and flow fields. We focused on the shear-strain-rate-gradient-driven size-segregation mechanism in two configurations in which the pressure field is uniform – vertical chute flow and annular shear flow – and based on observations from DEM simulations, we proposed a phenomenological constitutive equation for the shear-strain-rate-gradient-driven flux. When combined with a standard model for granular diffusion, the segregation model involves two dimensionless parameters  $\{C_{diff},C^{S}_{seg}\}$, which multiply the two fluxes appearing in the model – the diffusion and shear-strain-rate-gradient-driven fluxes, respectively. By coupling the segregation model with the NGF model adapted to bidisperse systems, we may quantitatively predict both the flow fields and the segregation dynamics for dense flows of bidisperse disks and spheres for two distinct flow geometries and under a number of different flow conditions.
Size segregation in granular materials is a complex and rich problem, so there remain many avenues for model improvement and unresolved research questions to be answered. One important question relates to the constitutive equation for the shear-strain-rate-gradient-driven segregation flux (2.15). Although our use of a constitutive equation driven by gradients in  $\dot {\gamma }$ does a good job capturing the DEM data, there are other theories in the literature based on gradients of other field quantities. In particular, Hill and coworkers (Fan & Hill Reference Fan and Hill2011b; Hill & Tan Reference Hill and Tan2014) have proposed that gradients in the kinetic stress, which is related to the velocity fluctuation $\delta v$ and hence the granular temperature $T=(\delta v)^2$, drive segregation. Zhang & Kamrin (Reference Zhang and Kamrin2017) have found that the granular fluidity $g$ for a monodisperse granular system may be represented kinematically through the velocity fluctuation $\delta v$ and the solid fraction $\phi$ through $g = F(\phi )\delta v/d$, where $F(\phi )$ is a function of the solid fraction $\phi$. Therefore, motivated by the kinematic relation of Zhang & Kamrin (Reference Zhang and Kamrin2017), other forms for the constitutive equation for $w_i^{seg}$ based on gradients in $g$ can be proposed. For example, instead of (2.15), consider the following form for the segregation flux:
 \begin{equation} w_i^{seg} = C^{S}_{seg} \bar{d}^2c^{l}(1-c^{l})\dfrac{\partial g}{\partial x_i}. \end{equation}
Then, applying the quasi-steady flux balance condition,
 \begin{equation} C_{diff}\bar{d}^2\dot{\gamma}\dfrac{\partial c^{l}}{\partial x_i}\approx C^{S}_{seg} \bar{d}^2c^{l}(1-c^{l})\dfrac{\partial g}{\partial x_i}, \end{equation}
to the quasi-steady DEM data for vertical chute flow and annular shear flow of disks, we obtain the collapses shown in figures 13(a) and 13(b), respectively. (The coarse-grained values of  $g$ and its gradient are obtained using the coarse-grained values of $\dot {\gamma }$ and its gradient, calculated as described in Appendix A.2, along with $\mu$ and its gradient, calculated using (4.1) and not by coarse graining.) The solid lines represent the best linear fit using $C^{S}_{seg} = 0.08$. The collapses are reasonable but not as strong as those shown in figures 5(a) and 7 for a segregation flux based on gradients in the shear strain rate, leading us to make the pragmatic choice to work with the constitutive equation (2.15).
(a) Collapse of  $C_{diff}\bar {d}^2\dot {\gamma }({\partial c^{l}}/{\partial x})$ vs $\bar {d}^2c^{l}(1-c^{l})({\partial g}/{\partial x})$ for several cases of vertical chute flow and (b) collapse of $C_{diff}\bar {d}^2\dot {\gamma }({\partial c^{l}}/{\partial r})$ vs $\bar {d}^2c^{l}(1-c^{l})({\partial g}/{\partial r})$ for several cases of annular shear flow of bidisperse disks. (c) Collapse of $C_{diff}\bar {d}^2\dot {\gamma }({\partial c^{l}}/{\partial x})$ vs $\sqrt {\rho _{s}/P}\bar {d}c^{l}(1-c^{l})({\partial T}/{\partial x})$ for several cases of vertical chute flow and (d) collapse of $C_{diff}\bar {d}^2\dot {\gamma }({\partial c^{l}}/{\partial r})$ vs $\sqrt {\rho _{s}/P}\bar {d}c^{l}(1-c^{l})({\partial T}/{\partial r})$ for several cases of annular shear flow of bidisperse disks. Symbols represent coarse-grained, quasi-steady DEM field data, and the solid lines represent the best linear fit using $C^{S}_{seg}=0.08$ for (a,b) and $C^{S}_{seg}=0.7$ for (c,d).

Additionally, we have tested a possible constitutive equation for the segregation flux driven by gradients in the granular temperature  $T=(\delta v)^2$. The precise definitions of the granular temperature $T$ and the velocity fluctuation $\delta v$ as well as the coarse-graining method used to obtain these quantities from DEM data follow Zhang & Kamrin (Reference Zhang and Kamrin2017). Then, consider the following form for the segregation flux:
 \begin{equation} w_i^{seg} = C^{S}_{seg} \sqrt{\rho_{s}/P} \bar{d} c^{l}(1-c^{l})\dfrac{\partial T}{\partial x_i}, \end{equation}
where the inertial time  $\sqrt {\rho _{s}/P} \bar {d}$ is included in the prefactor for dimensional reasons. We note that due to the kinematic relation $g = F(\phi )\delta v/d$, gradients in the granular temperature are not directly proportional to gradients in the granular fluidity, and small variations in the solid fraction $\phi$ may potentially affect the relationship between $\partial T/\partial x_i$ and $\partial g/\partial x_i$, although we have not studied this point in detail here. Therefore, (6.3) is distinct from (6.1) as a candidate for the flux constitutive equation. As above, upon applying the quasi-steady flux balance condition
 \begin{equation} C_{diff}\bar{d}^2\dot{\gamma}\dfrac{\partial c^{l}}{\partial x_i} \approx C^{S}_{seg} \sqrt{\rho_{s}/P} \bar{d} c^{l}(1-c^{l})\dfrac{\partial T}{\partial x_i}, \end{equation}
to the quasi-steady DEM data, figures 13(c) and 13(d) show the collapses for granular-temperature-gradient-driven segregation for vertical chute flow and annular shear flow of disks, respectively. In this case, the solid lines represent the best linear fit using  $C^{S}_{seg} = 0.7$. The collapse is quite good; however, in order to utilize the constitutive equation (6.3) in practice, an additional constitutive equation that gives the granular temperature field in terms of other continuum quantities – such as strain rate, stress and fluidity – is needed. Recent work by Kim & Kamrin (Reference Kim and Kamrin2020) offers a path forward on this point. In closing, we acknowledge that the possibility for an alternative form for the segregation flux $w^{seg}_i$ remains and that future work involving additional flow geometries is required to conclusively judge which constitutive equation is the most predictive.
Another question regarding the constitutive equation for the segregation flux is how the pre-factor depends on  $c^{l}$ and the grain-size ratio $d^{l}/d^{s}$. A simple pre-factor with symmetric dependence on $c^{l}$ through $c^{l}(1-c^{l})$ (in addition to the dependence on $c^{l}$ that enters through $\bar {d}$) and independent of $d^{l}/d^{s}$ is sufficient to capture the DEM data in the absence of pressure gradients considered in this work. However, in the context of pressure-gradient-driven size segregation, other researchers (e.g. Gajjar & Gray Reference Gajjar and Gray2014; van der Vaart et al. Reference van der Vaart, Gajjar, Epely-Chauvin, Andreini, Gray and Ancey2015; Tunuguntla et al. Reference Tunuguntla, Weinhart and Thornton2017; Barker et al. Reference Barker, Rauter, Maguire, Johnson and Gray2021; Trewhela et al. Reference Trewhela, Ancey and Gray2021) have utilized flux constitutive equations that depend asymmetrically on $c^{l}$ and involve the grain-size ratio $d^{l}/d^{s}$. It remains to determine whether such dependencies in the constitutive equation for the shear-strain-rate-gradient-driven flux could lead to refined predictions of size segregation in uniform-pressure flows or extend the applicability of the model to grain-size ratios beyond those considered in this work.
Further, in this paper, we have focused on two simple flow geometries that have two important features: (i) the continuum fields are one-dimensional, only varying along one spatial direction, and (ii) the pressure field is spatially uniform. In order to apply the proposed continuum model in more complex flow geometries, such as heap flows or split-bottom flow, two important steps are necessary. First, this paper solely considered shear-strain-rate-gradient-driven size segregation. Now that a predictive continuum model for this mechanism has been established, it remains to return to pressure-gradient-driven size segregation in order to incorporate this mechanism by introducing an additional flux contribution to (2.12) to obtain a more general model. We anticipate that the considerable progress in the literature on modelling pressure-gradient-driven size segregation (e.g. Gajjar & Gray Reference Gajjar and Gray2014; van der Vaart et al. Reference van der Vaart, Gajjar, Epely-Chauvin, Andreini, Gray and Ancey2015; Tunuguntla et al. Reference Tunuguntla, Weinhart and Thornton2017; Barker et al. Reference Barker, Rauter, Maguire, Johnson and Gray2021; Duan et al. Reference Duan, Umbanhowar, Ottino and Lueptow2021; Trewhela et al. Reference Trewhela, Ancey and Gray2021) may be leveraged to this end. Second, a robust numerical implementation of the complex system of coupled equations that is capable of addressing problems in general geometries, involving multi-dimensional continuum fields, is needed. One possible approach is to utilize the finite-element method, as in previous work involving the NGF model (Henann & Kamrin Reference Henann and Kamrin2016). These steps will be addressed in future works.
Finally, while the model proposed in this work is expected to be applicable to dense flows spanning the quasi-static and dense inertial flow regimes  $(I\lesssim 10^{-1})$, it is not intended to be applied to flows in the dilute, or collisional, flow regime $(I\gtrsim 10^{-1})$, in which particle interactions are dominated by collisions rather than enduring contacts. In the dilute flow regime, accounting for dilatation is important, and moreover, different segregation trends are possible. For example, Fan & Hill (Reference Fan and Hill2011a) showed that in the dilute regime, the segregation trend reverses in vertical chute flow with large particles segregating toward regions of low strain rate. Continuum theories based on granular kinetic theory are suited for describing flows in this regime.
Funding
This work was supported by funds from the National Science Foundation (CBET-1552556).
Declaration of interests
The authors report no conflict of interest.
Author contributions
D.L and H.S. contributed equally to this work.
Appendix A. Discrete-element method simulations and coarse-graining procedures
A.1. Simulated granular systems
We consider two types of simulated granular systems: two-dimensional systems consisting of a dense collection of circular disks and three-dimensional systems consisting of a dense collection of spheres. We consider bidisperse systems and denote the mean diameter of the large particles as  $d^{l}$ and the mean diameter of the small particles as $d^{s}$ for both types. For both disks and spheres, we take $d^{l}=3$ mm and $d^{s}=2$ mm for the base case, so that $d_{l}/d_{s}=1.5$. For both large and small particles, the diameters of individual particles are chosen from a uniform distribution over the range of $\pm 10\,\%$ of the respective mean diameters to prevent crystallization. In the two-dimensional granular system, $\rho _{s}$ denotes the grain-material area density, which we take to be $\rho _s = 3.26 \ {\rm kg}\ {\rm m}^{-2}$ for both large and small disks, and in the three-dimensional granular system, $\rho _{s}$ denotes the grain-material volume density, which is taken to be $\rho _{s} = 2450\ {\rm kg}\ {\rm m}^{-3}$ for both large and small spheres to eliminate density-based segregation. For two-dimensional systems, the mass of the large disks is given by $m^{l}= ({{\rm \pi} }/{4}) (d^{l})^2 \rho _{s}$, and the mass of the small disks is given as $m^{s}= ({{\rm \pi} }/{4}) (d^{s})^2 \rho _{s}$, so that the characteristic grain mass is $m=c^{l}_0 m^{l} + (1-c^{l}_0)m^{s}$, where $c^{l}_0$ is the initial concentration of the large grains. Similarly, for three-dimensional systems, the mass of the large spheres is $m^{l}= ({{\rm \pi} }/{6}) (d^{l})^3 \rho _{s}$, and the mass of the small spheres is $m^{s}= ({{\rm \pi} }/{6}) (d^{s})^3 \rho _{s}$, so that the characteristic grain mass is $m=c^{l}_0 m^{l} + (1-c^{l}_0)m^{s}$.
For the grain interaction model, the interaction force is given through a spring/dashpot contact law that accounts for elasticity, damping and sliding friction (da Cruz et al. Reference da Cruz, Emam, Prochnow, Roux and Chevoir2005; Koval et al. Reference Koval, Roux, Corfdir and Chevoir2009; Kamrin & Koval Reference Kamrin and Koval2014; Zhang & Kamrin Reference Zhang and Kamrin2017). The normal contact force  $F_{n}$ is given linearly through the normal component of the contact overlap, denoted by $\delta _{n}$, with stiffness $k_{n}$ and the relative normal velocity, denoted by $\dot {\delta }_{n}$, with damping coefficient $g_{n}$ as $F_{n}=k_{n}\delta _{n} + g_{n} \dot {\delta }_{n}$ whenever $\delta _{n}\ge 0$ and $F_{n}=0$ whenever $\delta _{n}<0$. The normal damping coefficient is given by $g_{n} = \sqrt {m k_{n}}(-2 \ln e)/\sqrt {2({\rm \pi} ^2 + \ln ^2 e)}$ where $e$ is the coefficient of restitution for binary collisions and $m$ is the characteristic grain mass discussed above. We denote the tangential stiffness and damping coefficient as $k_{t}$ and $g_{t}$, respectively, and take $g_{t}=0$, so that the tangential force is given as $F_{t} = k_{t} \delta _{t}$ whenever $\delta _{n}\ge 0$, where $\delta _t$ is the tangential component of the contact displacement. The magnitude of the tangential component of the contact force is limited by Coulomb friction, which depends on the inter-particle friction coefficient $\mu _{surf}$. Thus, the parameter set $\{k_{n}, k_{t}, e, \mu _{surf}\}$ fully describes the interaction properties. Throughout, the normal stiffness $k_{n}$ is taken to be sufficiently large so that grains behave as stiff and nearly rigid. For two-dimensional systems, $k_{n}/P > 10^4$, and for three-dimensional systems, $k_{n}/P \bar {d}_0 > 10^4$, where $P$ is the characteristic confining pressure for a given configuration (force per unit length in two dimensions and force per unit area in three dimensions) and $\bar {d}_0=c^{l}_0d^{l} + (1-c^{l}_0)d^{s}$ is the characteristic grain size. In the stiff grain regime, the only interaction parameter that significantly affects the rheology of dense grains is $\mu _{surf}$, which we have kept constant as $\mu _{surf}=0.4$ throughout. The other parameters, namely the ratio $k_{n}/k_{t}$ and the restitution coefficient $e$, have negligible effects on the rheology (Kamrin & Koval Reference Kamrin and Koval2014) and thus the segregation dynamics in the stiff particle regime, so we maintain $k_{t}/k_{n} = 1/2$ and $e=0.1$ throughout. Finally, the open-source software LAMMPS (Plimpton Reference Plimpton1995) is used to numerically integrate the equations of motion for each particle, and we restrict the time step for numerical integration to be $0.01$– $0.1$ of the binary collision time $\tau _{c} = \sqrt {m({\rm \pi} ^2 + \ln ^2 e)/4 k_{n}}$ for stability and accuracy of the simulation results.
A.2. Averaging methods
In this appendix, we describe the spatial and temporal averaging methods utilized to extract continuum fields from our DEM data. We begin with the spatial averaging procedure for a given snapshot of DEM data at a time  $t$. All flows considered in this work are one-dimensional, in which the continuum fields vary only along one direction – i.e. along the $z$-direction in simple shear flow (figure 2), along the $x$-direction in vertical chute flow (figure 4) and along the $r$-direction in annular shear flow (figure 6) – and periodic along all other directions. Here, we describe the procedure for vertical chute flow of disks in detail, which may be straightforwardly adapted to the other flow geometries. We utilize a bin-based coarse-graining process, in which we construct a slender rectangle that spans the simulation domain along the $z$-direction and is centred at a given $x$-position with a finite width along the $x$-direction. (For annular shear flow of disks, the bins are thin, annular rings that are centred at a given $r$-position with a finite thickness along the $r$-direction.) Then, we assign each intersected grain $i$ a weight $A_i$, defined as the area of the grain $i$ inside the bin. Following Tunuguntla et al. (Reference Tunuguntla, Weinhart and Thornton2017) for a bidisperse system, we denote the sets of large and small grains intersected by the bin as ${\mathcal {F}}^{l}$ and ${\mathcal {F}}^{s}$, respectively, so that the set of all grains intersected by the bin is ${\mathcal {F}} = {\mathcal {F}}^{l} \cup {\mathcal {F}}^{s}$ with ${\mathcal {F}}^{l} \cap {\mathcal {F}}^{s} = \varnothing$. The instantaneous solid area fraction field for species $\nu$ is $\phi ^{\nu }(x,t) = (\sum _{i \in {\mathcal {F}}^\nu } A_i)/A$, where $A$ is the total area of the bin, and the corresponding concentration field for species $\nu$ is $c^{\nu }(x,t) = \phi ^{\nu }(x,t)/\phi (x,t)$ with $\phi (x,t)=\phi ^{l}(x,t)+\phi ^{s}(x,t)$. With the instantaneous velocity of each grain $i$ denoted as $\boldsymbol {v}_i(t)$, the instantaneous velocity field is $\boldsymbol {v}(x,t)=(\sum _{i \in {\mathcal {F}}} A_i\boldsymbol {v}_i(t))/(\sum _{i \in {\mathcal {F}}} A_i)$. (We note that this definition of the instantaneous velocity field is consistent with first defining species-specific velocity fields – i.e. $\boldsymbol {v}^\nu (x,t) = (\sum _{i\in {\mathcal {F}}^\nu } A_i \boldsymbol {v}_i(t))/(\sum _{i \in {\mathcal {F}}^\nu } A_i)$ – and then calculating the mixture-level field – i.e. $\boldsymbol {v}(x,t) = c^{l}(x,t) \boldsymbol {v}^{l}(x,t) + (1 - c^{l}(x,t))\boldsymbol {v}^{s}(x,t)$.) Likewise, with the instantaneous stress tensor associated with grain $i$ defined as $\boldsymbol {\sigma }_i(t) = (\sum _{j\ne i} \boldsymbol {r}_{ij}\otimes \boldsymbol {f}_{ij})/({\rm \pi} d_i^2/4)$, where $\boldsymbol {r}_{ij}$ is the position vector from the centre of grain $i$ to the centre of grain $j$,
$j$,  $\boldsymbol {f}_{ij}$ is the contact force applied on grain $i$ by grain $j$, and $d_i$ is the diameter of grain $i$, the instantaneous stress field is $\boldsymbol {\sigma }(x,t) = (\sum _{i \in {\mathcal {F}}} A_i\boldsymbol {\sigma }_i(t))/A$.
In vertical chute flow of spheres, we utilize a similar spatial coarse-graining approach. Instead of two-dimensional, rectangular bins, we use three-dimensional, rectangular-cuboidal bins that span the simulation domain along the  $y$- and $z$-directions and are centred at a given $x$-position with a finite width along the $x$-direction. Then, the weight for each grain $i$ is the volume $V_i$ of the grain $i$ inside the bin. The instantaneous solid volume fraction field for species $\nu$ is $\phi ^\nu (x,t) = (\sum _{i \in {\mathcal {F}}^\nu } V_i)/V$, where $V$ is the total volume of the bin; the instantaneous concentration field for species $\nu$ is $c^{\nu }(x,t) = \phi ^{\nu }(x,t)/\phi (x,t)$; the instantaneous velocity field is $\boldsymbol {v}(x,t)=(\sum _{i \in {\mathcal {F}}} V_i\boldsymbol {v}_i(t))/(\sum _{i \in {\mathcal {F}}} V_i)$; the instantaneous stress tensor associated with grain $i$ is $\boldsymbol {\sigma }_i(t) = (\sum _{j\ne i} \boldsymbol {r}_{ij}\otimes \boldsymbol {f}_{ij})/({\rm \pi} d_i^3/6)$; and the instantaneous stress field is $\boldsymbol {\sigma }(x,t) = (\sum _{i \in {\mathcal {F}}} V_i\boldsymbol {\sigma }_i(t))/V$.
Our analysis of the size-segregation process in this paper depends on obtaining accurate and high-resolution coarse-grained  $c^{l}$ fields from the DEM data. Therefore, the choices of the bin width and the spatial resolution of the bins are crucial. Throughout, we take a bin width of $4\bar {d}_0$ and a spatial resolution of roughly $0.1\bar {d}_0$ for both disks and spheres. Note that for these choices, adjacent bins overlap. We have ensured that a bin width of $4\bar {d}_0$ is sufficiently small so that the coarse-grained data are not over-smoothed. Specifically, we have tested that the coarse-grained velocity and stress fields are insensitive to the choice of bin width over the range of $0$ to $9.6\bar {d}_0$. In the limit that the bin width goes to zero, the coarse-graining procedure reduces to that utilized successfully in the literature for the velocity and stress fields for both disks (e.g. da Cruz et al. Reference da Cruz, Emam, Prochnow, Roux and Chevoir2005; Koval et al. Reference Koval, Roux, Corfdir and Chevoir2009) and spheres (e.g. Zhang & Kamrin Reference Zhang and Kamrin2017; Kim & Kamrin Reference Kim and Kamrin2020). However, as shown by Weinhart et al. (Reference Weinhart, Hartkamp, Thornton and Luding2013), applying a coarse-graining procedure with a small or zero bin width to the $\phi$ field – and hence the $\phi ^{l}$, $\phi ^{s}$, $c^{l}$, and $c^{s}$ fields – will lead to spatial fluctuations due to particle layering near the walls. We have ensured that a bin width of $4\bar {d}_0$ is sufficiently large so that these layering effects are not observed in the $c^{l}$ field – i.e. we are within the ‘plateau range’ (Weinhart et al. Reference Weinhart, Hartkamp, Thornton and Luding2013) of bin widths that produce bin-width-independent, coarse-grained continuum fields. We note that when plotting spatio-temporal contours of the concentration fields, profiles of the concentration fields, and profiles of the velocity fields (e.g. figure 4), we truncate the coarse-grained DEM data from bins centred within one half of a bin width ( $2\bar {d}_0$) from the walls. Furthermore, to ensure that the collapses of the DEM data used to determine the dimensionless material parameter $C_{seg}^{S}$ (i.e. figures 5, 7 and 13) are representative of bulk behaviour and not wall effects, we use a more conservative criterion and do not include DEM data from bins within $6\bar {d}_0$ of the walls.
The collapses of figures 5, 7 and 13 are obtained in the long-time regime, in which the fields evolve slowly in time. Since the flow is quasi-steady, the instantaneous concentration and velocity fields are simply arithmetically averaged in time (using 152 instantaneous snapshots for vertical chute flow of disks, 1000 snapshots for vertical chute flow of spheres and 144 snapshots for annular shear flow of disks) to obtain fields that only depend on the spatial coordinate. Then, the necessary first and second-order spatial derivatives of the field quantities (e.g.  $\partial c^{l}/\partial x$, $\dot {\gamma } = \partial v_z/\partial x$, and $\partial \dot {\gamma }/\partial x = \partial ^2 v_z/\partial x^2$ for vertical chute flow) are obtained from these time-averaged fields. We apply a spatial derivative filter to the time-averaged DEM fields in order to obtain accurate estimates of the spatial derivatives. We note that the order of time averaging and spatial differentiation does not noticeably affect the DEM data presented in this paper for the long-time regime. Also, we have tested using both cutoff Gaussian functions and Lucy functions (Weinhart et al. Reference Weinhart, Hartkamp, Thornton and Luding2013; Tunuguntla et al. Reference Tunuguntla, Thornton and Weinhart2016) for the kernel function of the derivative filter as well as a range of kernel function widths to ensure that the reported results in this study are independent of these choices.
Unlike for the steady concentration and velocity fields, which allow for arithmetic time-averaging, the transient concentration fields for dense flows of disks (e.g. figure 4d) are time averaged in a slightly different manner using a cutoff Gaussian filter. In particular, this process is performed by applying a normalized, cutoff Gaussian time filter to the DEM data at each  $x$-position. Denoting the standard deviation of the Gaussian kernel function as $\sigma _{t}$, so that the cutoff time width of the Gaussian kernel is $6\sigma _{t}$, the time-smoothed field quantity at a given $x$-position and time $t$ is then given by the convolution of the DEM data over a time period of $6\sigma _{t}$, centred at time $t$, with the cutoff Gaussian kernel. We have tested a range of kernel widths $\sigma _{t}$ to ensure that the coarse-grained concentration fields appearing in this paper are insensitive to this choice. For the transient concentration fields for dense flows of spheres (second column of figure 10), no additional time smoothing is needed, and the concentration fields are simply instantaneous snapshots in time. This is possible primarily because spatial smoothing is being done over a greater volume and a larger number of grains, and therefore the instantaneous concentration fields are relatively more smooth.
Appendix B. Diffusion flux consistency test
Our process for determining the segregation flux – and hence the material parameter  $C^{S}_{seg}$ – is based on the assumption that the segregation and diffusion fluxes balance in the quasi-steady regime. Therefore, it is essential that the dimensionless material parameter $C_{diff}$ appearing in the constitutive equation for the diffusion flux (2.14) has been accurately determined, so that the coarse-grained diffusion flux is accurate. In § 3, we determined $C_{diff}$ for dense flows of frictional disks to be 0.20 using MSD data from DEM simulations of simple shear flow of a well-mixed bidisperse granular system. In this appendix, we perform an independent consistency check that tests whether the constitutive equation for the diffusion flux (2.14) using this fitted value of $C_{diff}$ for disks is capable of predicting the evolution of the $c^{l}$ field in a diffusion-dominated problem.
Consider homogeneous simple shear flow of an initially segregated system with large grains (dark grey) on the bottom and small grains (light grey) on the top, as shown in figure 14(a) for the case of  $d^{l}/d^{s}=1.5$. The rectangular domain has a length of $L=60\bar {d}_0$ in the $x$-direction and a height of $H=120\bar {d}_0$ in the $z$-direction. As in §§ 2.3 and 3, shearing along the $x$-direction and normal stress along the $z$-direction are applied by the walls. We perform DEM simulations of simple shearing for a nominal inertial number of $(v_{w}/H)\sqrt {\bar {d}_0^2\rho _{s}/P_{w}} = 0.1$. We run the DEM simulation starting from the initially segregated configuration, and the spatio-temporal evolution of the coarse-grained $c^{l}$ field is shown in figure 14(b) for $d^{l}/d^{s}=1.5$. We observe that the interface between large and small grains, which is initially sharp, becomes diffuse with a transition width that grows with time. We define a transition width at a given point in time as the distance between the positions at which $c^{l}$ equals 0.1 and 0.9 in snapshots of the spatial $c^{l}$ profile. For grain-size ratios of $d^{l}/d^{s}=1.5$ and 3.0, this transition width as a function of the square root of the dimensionless time $\tilde {t} = t/(H/v_{w})$ is plotted in figure 14(c), using solid lines, displaying roughly linear behaviour – typical of diffusive behaviour – with a slight dependence on $d^{l}/d^{s}$.
(a) Initially segregated configuration for two-dimensional DEM simulation of bidisperse simple shear flow with  $d^{l}/d^{s}=1.5$ and $8649$ flowing grains. Upper and lower layers of black grains denote rough walls. Dark grey grains indicate large flowing grains, and light grey grains indicate small flowing grains. A 10 % polydispersity is utilized for each species to prevent crystallization. (b) Spatio-temporal evolution of the large-grain concentration field, illustrating the transition width that grows with time. (c) Normalized transition width vs square root of normalized time $\tilde {t} = t/(H/v_{w})$.

Next, we apply the continuum model for the evolution of  $c^{l}$ (2.16) to this problem. As for planar shear flow of a well-mixed bidisperse system (figure 2), no pressure gradient is present. Therefore, the evolution of $c^{l}$ is governed by (2.16)
 \begin{equation} \dfrac{\partial {c}^{l}}{\partial t} + \dfrac{\partial}{\partial z} \left(-C_{diff} \bar{d}^2 \dot{\gamma} \dfrac{\partial c^{l}}{\partial z} + C^{S}_{seg} \bar{d}^2 c^{l}(1-c^{l}) \dfrac{\partial \dot{\gamma}}{\partial z} \right) = 0 , \end{equation}
where  $\bar {d} = c^{l}d^{l} + (1 - c^{l})d^{s}$. In this flow configuration, the shear strain rate is approximately constant. Therefore, the shear-strain-rate gradient is approximately zero throughout, and the diffusion flux is the dominant flux, which acts to remix the flowing grains. This may be understood in the context of the local inertial rheology. Since the stress ratio $\mu$ is spatially constant in homogeneous planar shear, the resulting inertial number field $I$ is also spatially constant. Since the inertial number depends on both $\bar {d}$ and $\dot {\gamma }$, spatial variation in $\bar {d}$ leads to spatial variation in $\dot {\gamma }$. This spatial variation in $\dot {\gamma }$ is slight, and consequently, the magnitude of the diffusion flux at each point in space is much greater than the magnitude of the segregation flux. While the effect of segregation is small, we still include the shear-strain-rate-gradient-driven segregation flux with $C_{ seg}^{S}= 0.23$ and solve (B1) when analysing the problem shown in figure 14(a). We note that due to the small effect of segregation and the dependence of $\bar {d}$ on $c^{l}$, (B1) is similar to but not exactly the same as the linear diffusion equation in one dimension, so the solution is close to but not exactly an error function.
We obtain predictions for the evolution of the  $c^{l}$ field by solving (B1) using the fully segregated initial condition for $c^{l}(z,t=0)$, no-flux boundary conditions at $z=0$ and $z=H$, a spatially constant value of inertial number $I$ consistent with that prescribed in the DEM simulations, a given grain-size ratio $d^{l}/d^{s}$, and $C_{diff}=0.20$. We note that since $I$ is taken to be spatially constant, $\dot {\gamma } = (I/\bar {d})\sqrt {P_{ w}/\rho _{s}}$ varies slightly in space due to the $c^{l}$-dependence of $\bar {d}$. We extract the transition width as a function of time from continuum simulation results for $d^{ l}/d^{s}=1.5$ and 3.0 and include these results in figure 14(c) as dashed lines. The continuum model predictions agree well with the DEM data and are even capable of capturing the small difference due to the grain-size ratio. This result indicates that the expression for the diffusion flux (2.14) and the fitted material parameter value $C_{diff}=0.20$ are indeed consistent with DEM data for disks.
Appendix C. Comparison with a local rheological model
In this appendix, we compare selected continuum model predictions for bidisperse disks from § 5 with corresponding predictions of the quasi-steady velocity fields and the segregation dynamics using a local rheological model. In particular, we apply the partial regularization strategy of Barker & Gray (Reference Barker and Gray2017) to the linear form of the local inertial rheology (2.3) and couple the resulting rheological model with the segregation model developed in this work for dense, bidisperse flows in the absence of pressure gradients. Upon regularization, the linear form of the local inertial rheology may be expressed as the following local constitutive equation for the strain rate  $\dot {\gamma }$ in terms of the stress ratio $\mu$ and the pressure $P$:
$P$:
 \begin{equation} \dot{\gamma}(\mu,P) = \sqrt{\dfrac{P}{\bar{d}^2\rho_{s}}} \left\{\begin{array}{@{}ll} \dfrac{\mu-\mu_{s}}{b} & \text{if $\mu>\mu_1^{N}$,}\\[10pt] A_- \exp\left(-\dfrac{\alpha}{\mu^2}\right) & \text{if $\mu\le \mu_1^{N}$,}\end{array}\right. \end{equation}
where  $\{\mu _{s},b\}$ are the dimensionless rheological parameters given in (5.1) for disks, $\mu _1^{N} = \mu _{s} + bI_1^{N}$, $A_- = I_1^{N}\exp (\alpha /(\mu _1^{N})^2)$ and $\{I_1^{N},\alpha \}$ are dimensionless regularization parameters. Here, we take $\{I_1^{N} = 0.00482, \alpha =1.9\}$, which, by the criteria of Barker & Gray (Reference Barker and Gray2017), gives well-posed behaviour for low to moderate inertial numbers ( $I\lesssim 0.91$) and, moreover, ensures that the relation between $\dot {\gamma }$ and $\mu$ at fixed $P$ in (C1) is smooth in addition to being continuous.
The local rheological constitutive equation (C1) is coupled with the segregation dynamics equation (5.5) and used to obtain predictions for vertical chute flow. Figure 15(a) shows comparisons for the base case of vertical chute flow of disks  $\{W/\bar {d}_0 = 60,\mu _{w}=0.45,c^{l}_0=0.5,d^{l}/d^{s}=1.5\}$. The first column shows comparisons of the DEM simulations (solid black lines) and the continuum model predictions using (C1) (dash-dotted grey lines) for the $c^{l}$ field at the same four snapshots in time as in figure 8(a), and a comparison of the quasi-steady, normalized velocity fields is shown in the second column. Continuum model predictions using the NGF model from figure 8(a) are also included as dashed grey lines. While the regularized local inertial rheology predicts a non-zero strain rate for all $x\ne 0$ in vertical chute flow, the strain rate and its gradient are very small in the central region of the vertical chute where $\mu <\mu _{s}$, and this region is predicted to behave as nearly rigid. Therefore, the local rheological model cannot capture the velocity field in the creeping region away from the walls, and since the flow kinematics are not accurately predicted, the segregation dynamics cannot be captured. The predicted concentration field effectively does not evolve in the nearly rigid, central region of the chute, which leads to inaccurate predictions of the segregation dynamics in the regions near the walls.
Comparisons of continuum model predictions with corresponding DEM simulation results for the transient evolution of the segregation dynamics for (a) the base case of vertical chute flow of disks  $\{W/\bar {d}_0 = 60,\mu _{w}=0.45,c^{l}_0=0.5,d^{l}/d^{s}=1.5\}$ and (b) the base case of annular shear flow of disks $\{R/\bar {d}_0 = 60,\tilde {v}_{w}=0.01,c^{ l}_0=0.5,d^{l}/d^{s}=1.5\}$. The first column shows comparisons of the DEM simulations (solid black lines), continuum model predictions using the NGF model (dashed grey lines) and continuum model predictions using a local rheological model (dash-dotted grey lines) of the $c^{l}$ field at four time snapshots representing different stages of the segregation process. The second column shows comparisons of the quasi-steady, normalized velocity profiles from DEM simulations and both types of continuum model predictions.

Analogous observations for the base case of annular shear flow of disks  $\{R/\bar {d}_0 = 60,\tilde {v}_{w}=0.01,c^{l}_0=0.5,d^{l}/d^{s}=1.5\}$ are summarized in figure 15(b). The regularized local inertial rheology cannot capture the decaying flow field – in particular, the quasi-static, creeping behaviour far from the inner wall – because it predicts nearly rigid behaviour in the region away from the wall where $\mu <\mu _{s}$. As a result, the predicted evolution of the concentration field occurs in a narrow region near the inner wall, which is not consistent with the DEM data. These observations illustrate that by accurately predicting flow kinematics across flow geometries, the NGF model plays a key role in the ability of the coupled continuum model to capture the segregation dynamics.


 Open access