

Introduction
One of the most significant problems in reconstructing the tree of life is reconciling conflicting signals from independent data sources, for example, between fossil and molecular data. The date of origin for many clades has been estimated to be much older by molecular (particularly molecular clock) methods than the fossil record would suggest (Wang et al. Reference Wang, Kumar and Hedges1999; Eizirik et al. Reference Eizirik, Murphy and O’Brien2001; Brown et al. Reference Brown, Rest, Garcia-Moreno, Sorenson and Mindell2008), but there are potential problems with both data types. Fossil findings are only able to provide a minimum age for the appearance of a taxon, because older fossils could always be found (Benton Reference Benton2004). Molecular studies, on the other hand, may be methodologically liable to overestimate time since divergence (Rodriguez-Trelles et al. Reference Rodriguez-Trelles, Tarrio and Ayala2002). In many cases, the discrepancy between estimated dates and the fossil record has been considered to be unreasonably large; modern birds, for example, are predicted by various molecular studies to have originated and diversified early in the Cretaceous (Paton et al. Reference Paton, Haddrath and Baker2002; Brown et al. Reference Brown, Rest, Garcia-Moreno, Sorenson and Mindell2008), but only disputed fragmentary fossils are known earlier than the latest Cretaceous (Brocklehurst et al. Reference Brocklehurst, Upchurch, Mannion and O’Connor2012). Most unambiguous metazoan phyla first appear in the fossil record in strata that are early Cambrian in age, about 530 Ma (Wang et al. Reference Wang, Kumar and Hedges1999), but even recent molecular studies give divergence dates into the Cryogenian, well over 700 Ma (dos Reis et al. Reference dos Reis, Thawornwattana, Angelis, Telford, Donoghue and Yang2015). In the case of Metazoa, this discrepancy can be explained by a poor Precambrian fossil record for metazoans (dos Reis et al. Reference dos Reis, Thawornwattana, Angelis, Telford, Donoghue and Yang2015), but this is not necessarily true for all groups.
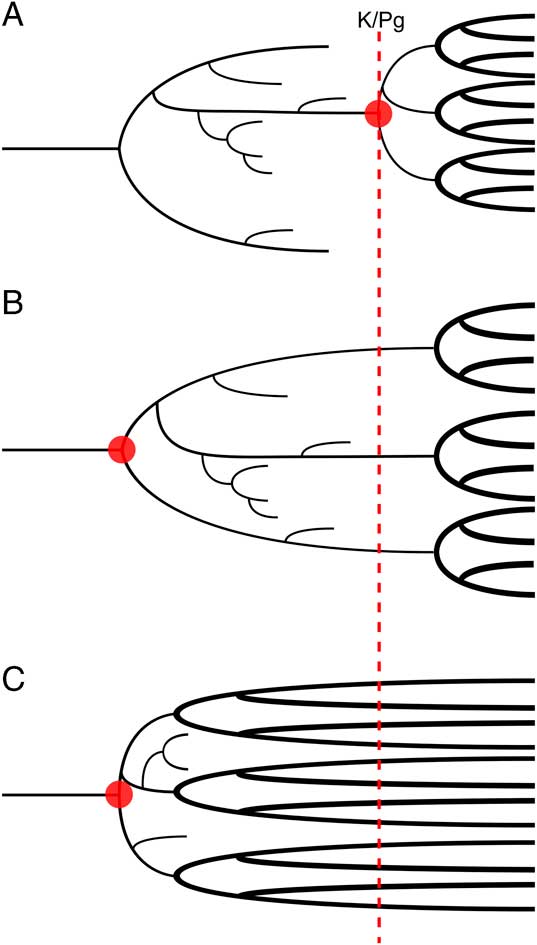
The origin of placental mammals is an important example of how attempts to estimate divergence dates have produced conflicting results from different data sources. Crown placental fossils are known from the earliest Paleocene (66 Ma) onward in large numbers, but currently there are no unambiguous examples from the Cretaceous. This marked shift in the terrestrial vertebrate fossil record is often interpreted as evidence for an “explosive model” of early placental evolution that posits that placental mammals originated and quickly diversified after the Cretaceous/Paleogene (K/Pg) boundary (Archibald and Deutschman Reference Archibald and Deutschman2001; Fig. 1A). It has been further suggested that the end-Cretaceous mass extinction caused an extreme ecological reorganization (Jablonski and Chaloner Reference Jablonski and Chaloner1994), serving to accelerate morphological evolution and facilitating the rapid diversification of the explosive model (Alroy Reference Alroy1999). Such an adaptive radiation would have allowed mammals to fill the ecological niches left vacant after the extinction of the nonavian dinosaurs (Carroll Reference Carroll1997).
Three alternate theories of early placental evolution. The theories differ in their placement of the point of origination of the clade (red circles), and the timing of the subsequent interordinal diversification (thick black lines). A, Explosive model; B, long-fuse model; and C, short-fuse model.
As a single unambiguous Cretaceous occurrence of a crown placental mammal would be enough to disprove a strict explosive model, the phylogenetic position of certain Cretaceous eutherian taxa has been the focus of considerable attention (Prasad et al. Reference Prasad, Verma, Sahni, Parmar and Khosla2007; Archibald et al. Reference Archibald, Zhang, Harper and Cifelli2011). Indeed, there are many Late Cretaceous eutherians that have been proposed as crown placentals. Perhaps the most contentious has been Protungulatum, a morphologically primitive eutherian originally assigned to Arctocyonidae, a likely polyphyletic (Halliday et al. Reference Halliday, Upchurch and Goswami2015) family of “archaic ungulates” (Archibald Reference Archibald1998). Although known primarily from the Paleocene, Protungulatum is also known from a single occurrence in the Late Cretaceous (Archibald et al. Reference Archibald, Zhang, Harper and Cifelli2011), and interestingly, a recent phylogenetic analysis has placed the taxon within crown Placentalia (O’Leary et al. Reference O’Leary, Bloch, Flynn, Gaudin, Giallombardo, Giannini, Goldberg, Kraatz, Luo, Meng, Ni, Novacek, Perini, Randall, Rougier, Sargis, Silcox, Simmons, Spaulding, Velazco, Weksler, Wible and Cirranello2013). Another recent study (Spaulding et al. Reference Spaulding, O’Leary and Gatesy2009) also recovered Protungulatum well within the crown, in a polytomy with the Laurasian ungulate clades Perissodactyla and Artiodactyla, or even within Artiodactyla. However, several other recent phylogenetic analyses have instead resolved Protungulatum as a stem eutherian, close to, but outside of, Placentalia (Wible et al. Reference Wible, Rougier, Novacek and Asher2007; Goswami et al. Reference Goswami, Prasad, Upchurch, Boyer, Seiffert, Verma, Gheerbrant and Flynn2011; Halliday et al. Reference Halliday, Upchurch and Goswami2015). These studies similarly resolved Purgatorius, a possible early euarchontan, or even early primate (Chester et al. Reference Chester, Bloch, Boyer and Clemens2015) from the earliest Paleocene (with dubious Cretaceous occurrences; Van Valen and Sloan Reference Van Valen and Sloan1965), just outside of crown Placentalia, but constraining these taxa within the crown group did not result in statistically longer trees (Archibald et al.’s [Reference Archibald, Zhang, Harper and Cifelli2011] reanalysis of Wible et al. [Reference Wible, Rougier, Novacek and Asher2007]). Another possible Cretaceous euarchontan is Deccanolestes from the latest Cretaceous of India, which was first described as a nonplacental eutherian but has since been variably allied with euarchontans, primates, lipotyphlan insectivores, or afrosoricids (e.g., Smith et al. Reference Smith, De Bast and Sigé2010). However, recent studies have resolved Deccanolestes within a nonplacental eutherian clade Adapisoriculidae (Goswami et al. Reference Goswami, Prasad, Upchurch, Boyer, Seiffert, Verma, Gheerbrant and Flynn2011).
Two K/Pg boundary–crossing groups also bear on the timing of placental origins: Leptictida and Cimolesta. Leptictids were first described as crown placentals and are formed of diverse Cretaceous to Oligocene taxa, with ongoing debate on the group’s composition (Hooker Reference Hooker2013). Hooker (Reference Hooker2014) suggested that the Cretaceous taxon Gyposonictops forms part of the placental crown group, while another phylogeny has recovered a crown position for the closely related Leptictis (O’Leary et al. Reference O’Leary, Bloch, Flynn, Gaudin, Giallombardo, Giannini, Goldberg, Kraatz, Luo, Meng, Ni, Novacek, Perini, Randall, Rougier, Sargis, Silcox, Simmons, Spaulding, Velazco, Weksler, Wible and Cirranello2013). However, other studies again suggest a stem position for these taxa (Wible et al. Reference Wible, Rougier, Novacek and Asher2007; Goswami et al. Reference Goswami, Prasad, Upchurch, Boyer, Seiffert, Verma, Gheerbrant and Flynn2011; Halliday et al. Reference Halliday, Upchurch and Goswami2015), with Halliday et al. (Reference Halliday, Upchurch and Goswami2015) recovering them as paraphyletic sister taxa to Placentalia, suggesting there is significant uncertainty in both the monophyly and affinities of this group. Similarly, cimolestids range from Cretaceous to Eocene or Oligocene, with continuing debate over their taxonomic composition, affinities, and monophyly (Archibald 2011; Rook and Hunter Reference Rook and Hunter2014; Halliday et al. Reference Halliday, Upchurch and Goswami2015). Thus, while there are many potential Late Cretaceous placentals, there is yet no definitive occurrence of a placental mammal prior to the K/Pg boundary, and consequently an explosive model cannot be rejected on the evidence of paleontological occurrences.
In contrast to the direct evidence provided by the fossil record, many studies have reconstructed placentals as originating prior to the K/Pg (Springer Reference Springer1997; Eizirik et al. Reference Eizirik, Murphy and O’Brien2001; dos Reis et al. Reference dos Reis, Inoue, Hasegawa, Asher, Donoghue and Yang2012). The most recent Bayesian divergence estimates from molecular data and stochastic methods applied to paleontological data also indicate an origin for crown placental mammals in the latest Cretaceous (dos Reis et al. Reference dos Reis, Donoghue and Yang2014; Halliday et al. Reference Halliday, Upchurch and Goswami2016; Halliday and Goswami Reference Halliday and Goswami2016b). These estimates of an early origination for crown Placentalia led to the development of two further models of early placental evolution (Archibald and Deutschman Reference Archibald and Deutschman2001). The “long-fuse model” suggests that placentals originated in the Cretaceous (Fig. 1B), but interordinal diversification occurred near to or after the K/Pg boundary, while the “short-fuse model” instead postulates that the extant placental orders originated and quickly diversified in the Early to mid-Cretaceous (Archibald and Deutschman Reference Archibald and Deutschman2001; Fig. 1C). Support for the long-fuse model comes primarily from molecular analyses, most recently from a phylogenomic analysis of extant placentals (dos Reis et al. Reference dos Reis, Inoue, Hasegawa, Asher, Donoghue and Yang2012) that placed the majority of intraordinal placental diversification events after the K/Pg boundary but the origin of Placentalia and interordinal diversifications in the Late Cretaceous. Support for the short-fuse model comes from some studies (e.g., Bininda-Emonds et al. Reference Bininda-Emonds, Cardillo, Jones, MacPhee, Beck, Grenyer, Price, Vos, Gittleman and Purvis2007) that have given divergence estimates placing both inter- and intraordinal diversifications in the Cretaceous.
In general, origination dates for crown Placentalia based on molecular data have become younger over time (Goswami Reference Goswami2012). However, even the youngest age to be reconstructed from molecular data to date (90–88 Ma; dos Reis et al. Reference dos Reis, Inoue, Hasegawa, Asher, Donoghue and Yang2012) does not entirely close the gap between molecular divergence studies and those based on the fossil record (Goswami Reference Goswami2012). Moreover, while phylogenomic data place the origins of the Placentalia at 90–88 Ma (dos Reis et al. Reference dos Reis, Inoue, Hasegawa, Asher, Donoghue and Yang2012), another recent study using a molecular supermatrix placed it at approximately 100 Ma (Meredith et al. Reference Meredith, Janecka, Gatesy, Ryder, Fisher, Teeling, Goodbla, Eizirik, Simao, Stadler, Rabosky, Honeycutt, Flynn, Ingram, Steiner, Williams, Robinson, Burk-Herrick, Westerman, Ayoub, Springer and Murphy2011), indicating that a consensus has not yet been achieved.
It has long been acknowledged that the fossil record is far from complete (Newell Reference Newell1962; Raup Reference Raup1976; Retallack Reference Retallack1984; Maxwell and Benton Reference Maxwell and Benton1990; Foote and Sepkoski Reference Foote and Sepkoski1999). The fossils available for study represent only a small portion of past diversity and are subject to sampling biases. This undisputable fact has led some to conclude that true signals of past diversity are overcome by sampling effects, especially in older sediments (Alroy et al. Reference Alroy, Marshall, Bambach, Bezusko, Foote, Fürsich, Hansen, Holland, Ivany, Jablonski, Jacobs, Jones, Kosnik, Lidgard, Low, Miller, Novack-Gottshall, Olszewski, Patzkowsky, Raup, Roy, Sepkoski, Sommers, Wagner and Webber2001; Smith Reference Smith2001).
Therefore, to determine whether the lack of Cretaceous placental mammals is due to a real post-Cretaceous diversification or because of incomplete sampling, we must determine to what extent the fossil record can be considered an accurate representation of past diversity. Foote et al. (Reference Foote, Hunter, Janis and Sepkoski1999) assessed the relative preservation probability of taxa before and after the end-Cretaceous mass extinction, concluding that a completely unpreserved diversity of crown placentals in the Mesozoic required an exceptional (and therefore unlikely) reduction in preservation probability. Taxa, however, may be preserved but not identified as members of a clade if available fossils do not preserve key synapomorphies. This problem is exacerbated by the observation that phylogenetically informative characters tend to be preferentially lost during taphonomic processes, causing more incomplete taxa to be resolved as more basal, a phenomenon known as “stemward slippage” (Sansom and Wills Reference Sansom and Wills2013). Thus, to fully assess the difference in quality of the placental fossil record, completeness of morphological data must be taken into account.
Here, we quantify the quality of the fossil evidence, using morphological data to measure the completeness of eutherian taxa throughout the fossil record. The completeness of the Cretaceous and Paleogene eutherian fossil record is useful in determining whether morphological data available from fossil eutherians is sufficient to produce a reliable signal of crown-group occurrence. Additionally, and more importantly, this study assessed whether completeness varies through geological time. If so, this variation may result in systematic differences in the ability to identify crown-group placental mammals. As the earliest certain placental mammal fossils are known from the earliest Paleogene, the completeness of the fossil record either side of the K/Pg boundary is of particular importance. An increase in completeness across the K/Pg boundary suggests that the lack of Cretaceous placental fossils may be due to a poorer fossil record, permitting Early Cretaceous divergence dates and providing evidence of a short-fuse model of early placental evolution. Conversely, if there were no significant change in completeness across the boundary, it would suggest a genuine absence of placental mammals in the Cretaceous and an explosive adaptive radiation in the aftermath of the end-Cretaceous mass extinction. This result would provide support for either an explosive model, or a long-fuse model.
Finally, the relationships between completeness and a range of paleoenvironmental proxies were examined to identify any potential effects of environmental and geological processes on the completeness of the eutherian fossil record.
Materials and Methods
Character Completeness Metric
The completeness of fossil taxa was estimated using the character completeness metric (CCM; occasionally referred to as the proportional completeness metric [PCM]), proposed by Mannion and Upchurch (Reference Mannion and Upchurch2010) and applied in several other studies of vertebrate groups such as birds and pterosaurs (Brocklehurst et al. Reference Brocklehurst, Upchurch, Mannion and O’Connor2012; Dean et al. Reference Dean, Mannion and Butler2016). The CCM uses the percentage of phylogenetic characters that are available to be scored for a given taxon as an estimate of completeness, such that:
 $$\eqalign{{\rm CCM}=\,&{\rm number}\,{\rm of}\,{\rm characters}\,{\rm available}\,{\rm to}\,\cr&{\rm be}\,{\rm scored/total}\,{\rm number}\,{\rm of}\,{\rm characters}$$
Originally, two forms of the CCM were proposed, CCM1, in which only the completeness of the best-preserved specimen was considered, and CCM2, which considered the completeness of all known material for the taxon (Mannion and Upchurch Reference Mannion and Upchurch2010). Here, an alternative measure was used in which the CCM score for each taxon is computed from cladistic matrices (Bell et al. Reference Bell, Upchurch, Mannion and Lloyd2013). A hypothetical data set (Table 1) will be used to demonstrate. This data set consists of two matrices, each containing two taxa. Taxa A and C appear in only one matrix each, so their CCM scores are calculated using equation (1) such that:
 $${\rm Taxon}\,{\rm A}\!\!:{\rm CCM}=5/10=0.5$$
 $${\rm Taxon}\,{\rm C}\!\!:{\rm CCM}=16/20=0.8$$
Hypothetical matrices. Summaries of two hypothetical cladistics matrices, matrix 1 and matrix 2, containing a total of three different taxa (A, B, and C) and their character completeness metric (CCM) scores.

Taxon B, however, appears in both matrices, so its CCM score is an average of the CCM scores from the two matrices:
 $${\rm Taxon}\,{\rm B}\!\!:{\rm CCM}=\left[ {\left( {9/10} \right){\plus}\left( {14/20} \right)} \right]/2=0.8$$
This approach allowed the character completeness of taxa to be compared across matrices that differ in both taxic and character sampling, allowing a wider range of taxa to be incorporated into the study.
Data Collection
Cladistic matrices were collected from the published literature with the aim of covering all major eutherian groups (Supplementary Table 1). Soft tissue or molecular characters were removed where present. When multiple matrices were found to have been derived from a common parent matrix, duplicates were discarded to minimize nonindependence. Duplicate matrices often only contained a subset of the taxa/characters of the parent matrix, so in order to maximize the amount of data available for analysis, the largest duplicate matrix was chosen for inclusion in the final data set.
Two data sets were constructed in which taxa were alternatively grouped to the species or genus level, and all analyses were conducted separately on both data sets. Those taxa given in matrices at the species level were kept in both data sets; however, those taxa given only to the genus level were not included in the species-level data set, unless the genus was monospecific according to both the Paleobiology Database (PaleoDB; Paleobiology Database 2015) and the Index to Organism Names (Clarivate Analytics 2009), in which case it was assumed that all specimens assigned to that genus belonged to the only species. Any non-eutherian taxa used as outgroups in the collected matrices were removed prior to analysis.
The genus-level data set comprised 445 Cretaceous and Paleogene genera (Supplementary Table 2), while the species-level data set contained 333 species. The genus-level data set is larger, because in many matrices, the operational taxonomic units are genera consisting of a composite of multiple species. Such data are not usable in the species-level data set, except in cases in which the genus is monospecific and therefore equivalent to the species. A potential bias in the species-level data set is that sampled matrices at the species level tend to sample many species of a given genus, leading to clusters of closely related taxa in the species data set.
Occurrence data for the taxa were downloaded from the PaleoDB (last accessed 25 February 2015). Occurrences were downloaded for all eutherian taxa at the species level from the Cretaceous up to (and including) the Oligocene. The information downloaded included spatial and temporal information about each occurrence, as well as a description of each locality’s taphonomy, stratigraphy, and geology. In total 75,755 occurrences were downloaded. If occurrence data for a taxon were not available on the PaleoDB, information from the published literature was used when possible.
Completeness Estimation
All matrices were processed using specifically written code (Bell et al. Reference Bell, Upchurch, Mannion and Lloyd2013) for the statistical platform R (R Core Team 2014), whereby all matrices were loaded into the R environment and CCM values were calculated for each taxon across all matrices. Taxon names were manually checked and corrected to remove spelling mistakes and ensure consistency. Where a taxon has more than one possible name, or there are disputes over the placement of a taxon, the nomenclature according to the PaleoDB was preferred (e.g., Chasmotherium was changed to Hyrachyus in the data set, in accordance with the PaleoDB).
Some of the collected matrices did not record characters from major partitions of the skeleton and dentition, meaning that the raw CCM value was not a fair representation of overall completeness. For example, a specimen known from dentition alone would have a much higher CCM in a matrix scored only for dental characters than in one that also considers cranial and postcranial characters. Therefore, for matrices with reduced character sampling, the CCM value for each taxon was scaled down according to the character richness of the skeletal regions covered within the matrix. The scaling factors were determined by counting the proportion of total characters assigned to various skeletal regions in the four largest matrices (only considering those that covered the entire skeleton). For example, it was determined that dental characters, on average, make up 36.92% of characters in a matrix containing all partitions, so a matrix that only covers dental characters was scaled down by a factor of 0.3692 (Table 2). This process assumes that where a skeletal region was not included in a matrix, it was unavailable for all taxa the matrix contains. For some taxa, this is likely to be a fair assumption; however, for others, this process will artificially lower completeness values.
Character scaling factors. The proportion of all characters that refer to four different skeletal regions, counted and averaged over four large matrices. These values are used to scale the completeness values of taxa in matrices that do not cover all skeletal regions.

Temporal Binning Methods
For temporal comparisons, taxa were assigned to geological stages using the International Chronostratigraphic Chart (Gradstein et al. Reference Gradstein, Ogg, Schmitz and Ogg2012). Taxon occurrence data from the PaleoDB were used to assign taxa to geological-stage bins. Most taxa have multiple occurrences, and a taxon was assigned to a single bin if all of its occurrences fell within that bin. However, if the occurrences spanned multiple bins, then the taxon was counted multiple times; once per bin.
The oldest species in the data set are Eomaia scansoria and Murtoilestes abramovi, which appear in the Barremian and the Aptian, respectively. As the focus of this study is the variation in the CCM across the K/Pg boundary, no species younger than the Paleogene were included, with the limit set at the end of the Chattian. Mean CCM values were calculated for each time bin, with the results bootstrapped to account for uneven sampling across bins.
There is a large variation in the length of geological stages; the shortest is 2.4 Myr (Selandian), while the longest is 12.5 Myr (Albian). This variation could be problematic; it has been suggested that smaller stages will have less time in which sediment can be laid down, reducing the sample size for the stage (Raup Reference Raup1972; Miller and Foote Reference Miller and Foote1996), which could hinder statistical analyses. However, previous studies have found no effect of stage length on richness (Fastovsky et al. Reference Fastovsky, Huang, Hsu, Martin-Mcnaughton, Sheehan and Weishampel2004; Brocklehurst et al. Reference Brocklehurst, Kammerer and Fröbisch2013). To test the effect of stage length here, a Spearman’s rank correlation was used to test for a relationship between the length of a stage bin and its CCM value. In addition, a time series of the CCM was also created using the 10 million year bins of the PaleoDB (Alroy et al. Reference Alroy, Marshall, Bambach, Bezusko, Foote, Fürsich, Hansen, Holland, Ivany, Jablonski, Jacobs, Jones, Kosnik, Lidgard, Low, Miller, Novack-Gottshall, Olszewski, Patzkowsky, Raup, Roy, Sepkoski, Sommers, Wagner and Webber2001) (herein referred to as 10Myr bins). These are centered on the K/Pg boundary (66Ma) and allow for comparisons to be made between the CCM of placental mammals 10 Myr prior and post the K/Pg boundary.
Temporal Patterns of Completeness
Welch’s two-sample t-tests were used to examine differences between individual sequential geological-stage bins. This was repeated for 10 Myr bins, allowing a comparison of the two binning methods. Since multiple t-test hypotheses were tested (for the geological-stage bins and the 10 Myr bins: 32 tests in total), the Benjamini-Hochberg procedure (Benjamini and Hochberg Reference Benjamini and Hochberg1995) was used to correct p-values as a control for false discovery rate (FDR).
The overall trend in the CCM time series was analyzed using a linear regression model. However, the time series was found to show significant partial autocorrelation at lag 1, so a Prais-Winsten estimation was used as a correction (Prais and Winsten Reference Prais and Winsten1954).
The CCM time series was also compared with a eutherian richness curve derived from occurrence data downloaded from the PaleoDB (accessed 25 February 2015) and calculated using shareholder-quorum subsampling (SQS) (Alroy Reference Alroy2010) at a range of quorum levels.
Paleoenvironment and Previous Studies
The pattern in the CCM was then compared with a number of paleoenvironmental factors and proxies for environmental change. First, the CCM time series was compared with a sea-level curve (Miller et al. Reference Miller, Kominz, Browning, Wright, Mountain, Katz, Sugarman, Cramer, Christie-Blick and Pekar2005) that had previously been implicated as a controlling factor in parts of the completeness of the sauropodomorph fossil record (Mannion and Upchurch Reference Mannion and Upchurch2010). It has been suggested that, for terrestrial taxa, the fossil record may be worse in times of high sea level due to the decreased land area in which fossils can be preserved (Markwick Reference Markwick1998). It is unclear if this effect applies generally to eutherian mammals, especially given the emergence of marine eutherians (cetaceans and sirenians) in the Eocene (Gingerich et al. Reference Gingerich, Wells, Russell and Shah1983, O’Leary et al. Reference O’Leary, Bloch, Flynn, Gaudin, Giallombardo, Giannini, Goldberg, Kraatz, Luo, Meng, Ni, Novacek, Perini, Randall, Rougier, Sargis, Silcox, Simmons, Spaulding, Velazco, Weksler, Wible and Cirranello2013).
The CCM was also compared with a time series of the marine-carbonate strontium-isotope ratio (87Sr/86Sr) using a Spearman’s rank correlation test. Changes in 87Sr/86Sr over long timescales (>1 Myr) are indicative of tectonic activity (Richter et al. Reference Richter, Rowley and DePaolo1992); periods of increased plate tectonics lead to increased erosion of crustal rocks rich in 87Sr, which is washed into the oceans, increasing marine 87Sr/86Sr ratios (Richter et al. Reference Richter, Rowley and DePaolo1992; Capo et al. Reference Capo, Stewart and Chadwick1998). Increased crustal erosion may lead to increased deposition of fossil-bearing formations, which would influence completeness.
This analysis was repeated with marine-carbonate carbon (δ13C) and oxygen (δ18O) stable isotope ratios (Prokoph et al. Reference Prokoph, Shields and Veizer2008). The δ13C record provides insight into the global carbon cycle, reflecting changes in ocean productivity, circulation, and carbon storage, while δ18O largely reflects paleotemperature and global ice volume (Leng Reference Leng2006). δ13C and δ18O are not entirely independent (e.g., δ13C is, to a small extent, controlled by temperature) and are most useful in combination (Leng Reference Leng2006; Prokoph et al. Reference Prokoph, Shields and Veizer2008), where they are indicative of a number of aspects of the paleoenvironment that could influence completeness of the fossil record by affecting preservation processes.
In fact, it is well understood that these proxy measures are cross-correlated, and therefore likely to be under the control of the same factors (Veizer et al. Reference Veizer, Ala, Azmy, Bruckschen, Buhl, Bruhn, Carden, Diener, Ebneth, Godderis, Jasper, Korte, Pawellek, Podlaha and Strauss1999). Therefore, Akaike information criterion (AIC) analysis, calculated using generalized least squares, was used to find the best model for explaining the variation in the CCM observed among combinations of δ13C, δ18O, 87Sr/86Sr, sea level, SQS richness,and formation count (as a measure of sampling). For comparison, a null (white-noise) model will also be included.
Previous completeness studies using the CCM have been completed on sauropodomorph dinosaurs (Mannion and Upchurch Reference Mannion and Upchurch2010), Cretaceous birds (Brocklehurst et al. Reference Brocklehurst, Upchurch, Mannion and O’Connor2012), and pterosaurs (Dean et al. Reference Dean, Mannion and Butler2016). Mannion and Upchurch (Reference Mannion and Upchurch2010) also used an alternative but similar completeness measure known as the skeletal completeness metric (SCM). The pattern in eutherian CCM was tested for correlation with each completeness metric used in these three studies to ascertain whether the fossil records of the different groups are under the same controls, again using Spearman’s rank correlation coefficient. These studies do not include taxa from the Cenozoic, so the comparison here was restricted to the Cretaceous. The Benjamini-Hochberg procedure was used for the 12 Spearman’s tests (separate from the t-test correction) as a control for FDR. Furthermore, generalized differencing was used to correct for autocorrelation in all time-series correlation tests (McKinney Reference McKinney1990).
Results
The results described in the text are for the genus-level analysis, unless otherwise specified (species-level results are given in Supplementary Tables 5 and 6 and Supplementary Fig. 1).
Correlations with Bin Duration
There was no significant correlation found between bin length and CCM (r s=−0.4926, p=0.5588) or between the number of taxa in a bin and CCM (r s=−0.1617, p=0.9768) (all correlation test results can be found in Table 3).
Results of correlation tests at the genus level. All correlation tests were completed using Spearman’s rank correlation coefficient (r s). p-values were corrected using the Benjamini-Hochberg procedure. CCM, character completeness metric; PCM, proportional completeness metric; SCM, skeletal completeness metric.

Completeness through Time
The overall pattern in the CCM can be seen in Figure 2. The Prais-Winsten regression for the CCM time series indicated a significant trend in the CCM over time when corrected for autocorrelation (t=−4.7178, p=0.0106). The CCM increases toward the present; however, the rise in the CCM was mostly a gradual one, and no two consecutive geological-stage bins showed a significant difference from each other (Supplementary Table 3).
Eutherian completeness timescale at the genus level. The CCM value of each geological-stage bin from the Cretaceous to the Oligocene is plotted (black line). This value is the average of the completeness values of all taxa present in that bin. Gray points represent the individual genera, plotted in the middle of their ranges. The red line indicates the Cretaceous/Paleogene boundary. CCM, character completeness metric.
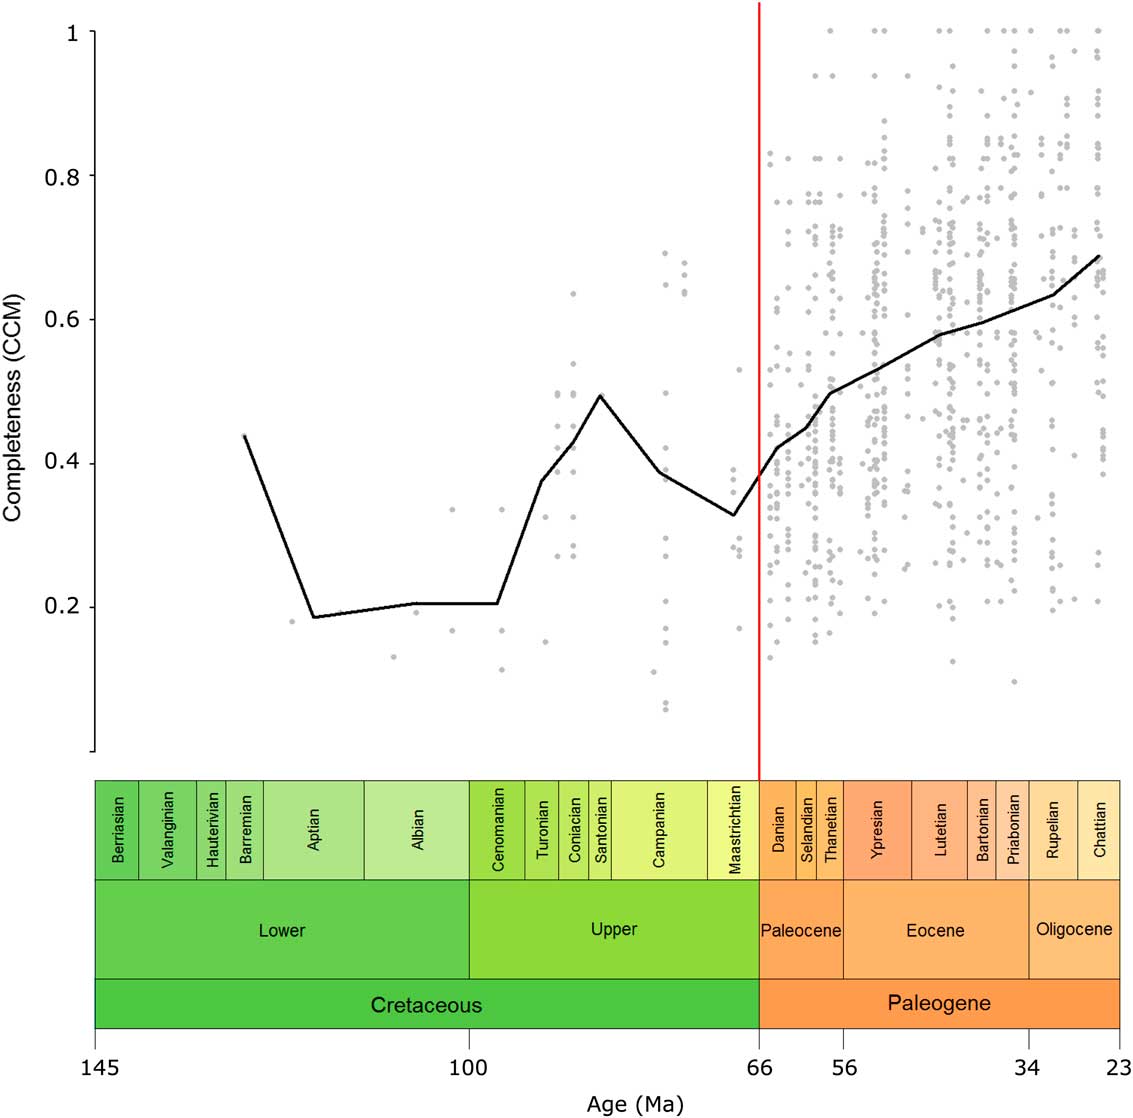
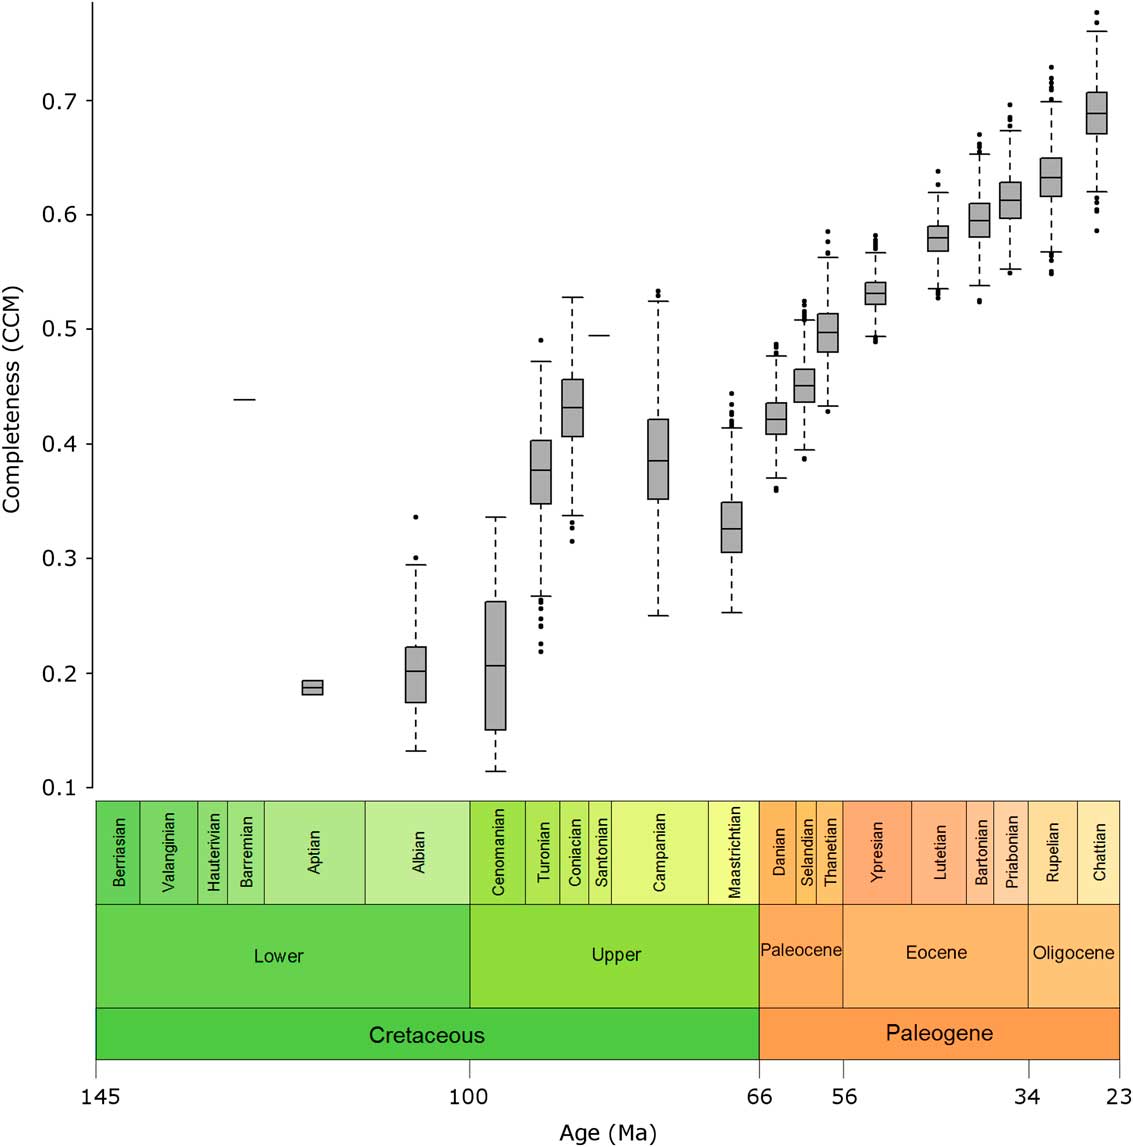
Variation in the CCM was greater in the Cretaceous than for the Paleogene, as shown, for example, by a doubling in the CCM in the space of just over 9 Myr from the Cenomanian to the Coniacian, and by larger error bars in many Cretaceous stages compared with those in the Cenozoic (Fig. 3).
Box plots of bootstrap samples. Box plots show the range of CCM values for each geological-stage bin generated when the taxa within the bin are subjected to bootstrap resampling.
As with the other consecutive bins, a t-test showed no significant difference between the Maastrichtian and Danian (t=2.3669, p=0.7064), and similarly, there was no difference between the 10Myr bins either side of the K/Pg boundary (t=0.4991, p=0.9890; Table 4). The only consecutive 10 Myr bins that showed a significant difference from one another were the 56–46 Ma and 66–56 Ma bins (t=3.5004, p=0.0125; Supplementary Table 4), with a significant increase in the CCM from the Paleocene to the early Eocene.
Results for t-tests comparing periods surrounding K/Pg at the genus level. Comparison of CCM scores in the pre- and post-K/Pg period, using geological-stage data bins and 10-Myr bins. All used a Welch’s two-sample t-test. The p-values were corrected using the Benjamini-Hochberg procedure.

Shareholder-Quorum Subsampling
The small sample sizes available in the early to mid-Cretaceous meant that species richness could not be estimated in a number of bins. From the Campanian onward, however, the sample sizes were large enough to calculate SQS species richness at higher quorum levels.
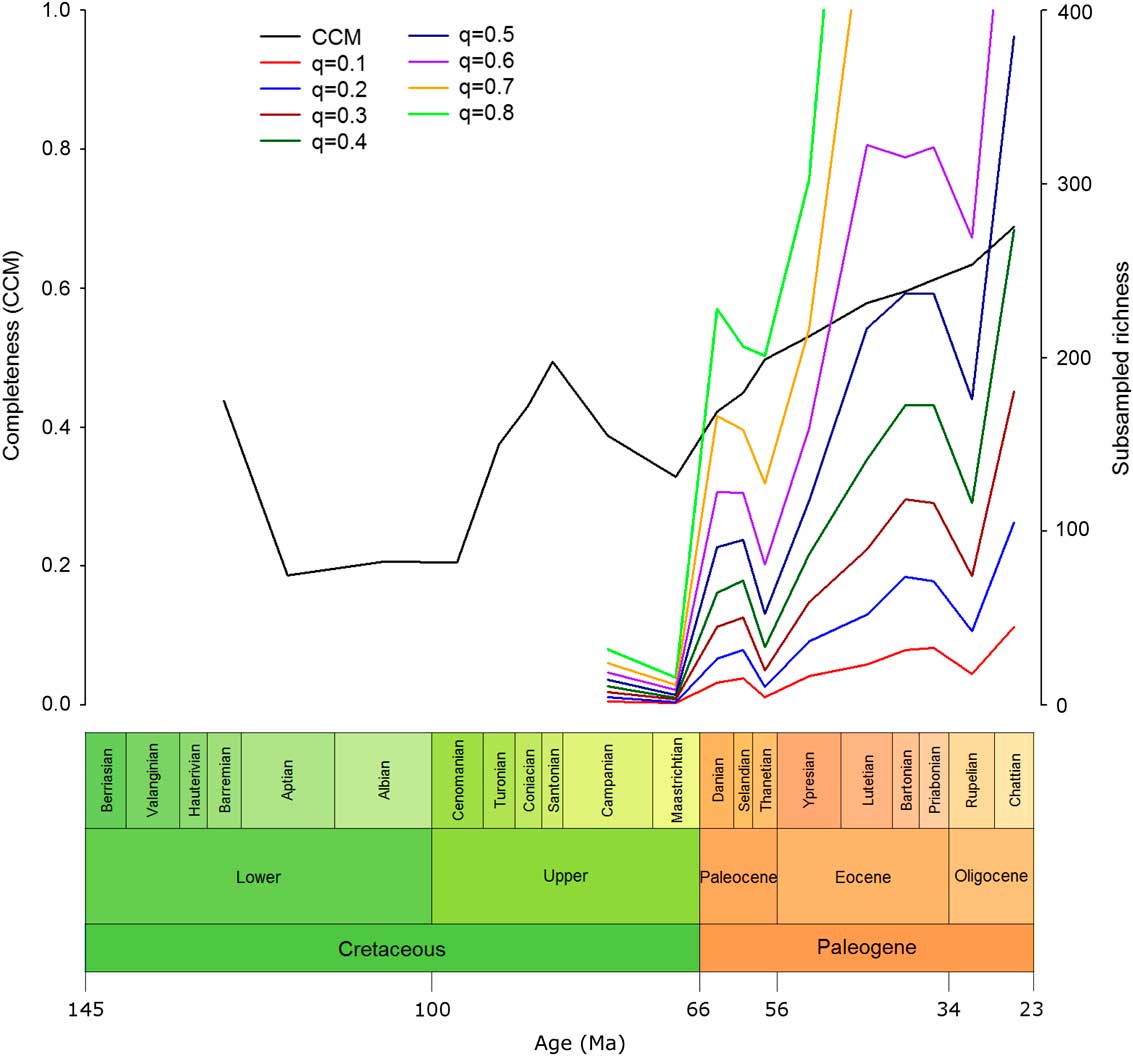
Eutherian richness in the late Cretaceous was found to be low (Fig. 4). There was a large increase across the K/Pg boundary at all quorum levels (except q=0.9, for which the sample size was too small in the majority of bins). There was an overall pattern of increasing richness within the Paleogene; however, this was not a simple, steady increase. Following the increase across the K/Pg boundary, there was a sharp dip in richness in the Thanetian, which, while not matching the low richness levels of the Cretaceous, does mark the lowest level of eutherian richness seen at any stage during the Paleogene. This was followed by another large increase in richness through the Eocene, which was interrupted by a sharp drop in richness in the Rupelian. Finally, there was an immediate recovery with an increase in richness in the Chattian.
Completeness against SQS-subsampled richness. Eutherian CCM values with SQS-subsampled eutherian richness over time at a range of quorum values. CCM, character completeness metric; SQS, shareholder-quorum subsampling; q, quorum.
Paleoenvironment and Previous Studies
The CCM was not found to be significantly correlated with any of the three isotope proxy measures; 87Sr/86Sr (r s=−0.0662, p=0.9768), δ13C (r s=−0.3064, p=0.9768) and δ18O (r s=0.1005, p=0.9768). There was also no significant correlation between CCM and sea level (r s=−0.3627, p=0.9768). However, in the maximum-likelihood analysis, 87Sr/86Sr was shown to be the best of all combinations of explanatory variables for explaining the variation in CCM with an Akaike weight (AICw) of 0.8022 (Table 5). The next-best model was a combination of 87Sr/86Sr and δ18O (AICw=0.1500). Each of the 14 best-supported models involved 87Sr/86Sr, while the null model was not well supported (AICw<0.0001).
Results of the AIC analysis at the genus level showing the Akaike weights (AICw) for the five best-supported models. The variables included were carbon (δ13C), oxygen (δ18O), and strontium (87Sr/86Sr) isotope ratios, sea level, the number of fossil-bearing formations per stage, shareholder-quorum-subsampling richness at q=0.4, and a null (white-noise) model.

No significant correlation was found between eutherian CCM and any of the sauropodomorph completeness measures (Mannion and Upchurch Reference Mannion and Upchurch2010) or the measure of bird completeness (Brocklehurst et al. Reference Brocklehurst, Upchurch, Mannion and O’Connor2012).
Species-Level Data Set
Species- and genus-level analyses were in broad agreement. Species-level analyses only differed from those at the genus level in failing to return a significant difference between the 66–56 Ma and 56–46 Ma bins. While there was a more pronounced difference in completeness between the Danian and the Maastrichtian, this was not significant (t=3.3204, p=0.2001).
Discussion
The CCM provides an important method of assessing the quality of the fossil record of a clade, and incorporating data from multiple phylogenetic matrices allows extensive data sets to be collated with relative ease. However, because cladistic analyses are adversely affected by missing data, relatively incomplete taxa are less likely to be included in any given matrix. For any given time period, a sample of taxa subjected to rigorous phylogenetic analysis will be more complete than the population of fossils from that time period. However, this problem is more prevalent in time periods with higher richness, as researchers have more scope to pick more complete taxa. In less-rich time periods, the options may be limited. We therefore expect that, if this effect is true, the Paleogene bins should be assigned higher values than the raw fossil record would provide.
Verrière et al. (Reference Verrière, Brocklehurst and Fröbisch2016) compared several methods of estimating the completeness of the fossil record and outlined a number of issues with the method used here. First, this method involves assigning a completeness value to a taxon throughout its range; this could be problematic, because this assumes that the same proportion of characters may be scored for a taxon regardless of its stratigraphic position. Furthermore, it has been suggested that the CCM method used here is liable to underestimate completeness (Verrière et al. Reference Verrière, Brocklehurst and Fröbisch2016). This is because there are often characters in the matrices used that refer to structures that are not applicable to some of the taxa included. These characters will be marked as missing in these taxa, which leads to an artificial lowering of the CCM. However, when looking at the fossil record of Parareptilia, the method used here shows a high level of agreement with the method employed by Brocklehurst et al. (Reference Brocklehurst, Upchurch, Mannion and O’Connor2012), which does not suffer from this problem, suggesting that the two methods are measuring the same signal (Verrière et al. Reference Verrière, Brocklehurst and Fröbisch2016). The present method is preferable in terms of the ease with which the data can be collected (no access to original specimens is required), allowing for larger samples to be collected; however, these limitations should be kept in mind when interpreting the results.
Eutherian CCM was relatively variable during the Cretaceous (Fig. 2). The relatively high value for the Barremian is an outlier, since it is it is derived from only one taxon (Eomaia). The CCM was low during the Aptian, Albian, and Cenomanian but sharply increased toward the Santonian before decreasing toward the end-Cretaceous. The peak in the Santonian may be an artifact of low sample size, since this stage is represented by only one taxon; however, the preceding two stages are better sampled, so the general trend of sharply increasing completeness through the first half of the Upper Cretaceous does appear to be genuine. Across the K/Pg boundary there was an increase in the CCM that will be discussed in detail in the “K/Pg Boundary” section. There was then a gradual increase in the CCM throughout the Paleogene. When examining the CCM of the eutherian fossil record at 10 Ma intervals, many of the patterns seen in the stage-level data are visible, but the peaks and troughs in the CCM are less pronounced. This pattern may be due to the longer time bins masking fine-scale changes or the larger sample sizes decreasing stochasticity. The overall trend of increasing CCM over time may exist because more recent deposits, having had less time to be destroyed, have a greater likelihood of being sampled to a higher degree. This means that taxa from more recent deposits are likely to be known from a greater number of specimens, which, as a result, have a greater chance of being more complete.
K/Pg Boundary
The results presented here indicate no significant change in the CCM of the eutherian fossil record between the Late Cretaceous and the early Paleogene. There is therefore no reason to suspect that Late Cretaceous eutherians are any more susceptible to taxonomic misidentification due to a lack of synapomorphies than are Danian taxa.
It also seems unlikely that the lack of Cretaceous placental fossils is due to a proportionally poorly sampled fossil record, because specimens known from this period are no less complete than those from the early Paleogene. Foote et al. (Reference Foote, Hunter, Janis and Sepkoski1999) examined the conditions necessary to plausibly explain a missing diversity of Mesozoic placental mammals. Even using the lowest estimate for the diversity that may be missing, the preservation rate would have to be an order of magnitude lower than the expected preservation rate as estimated using the fossil record of other Late Cretaceous mammals, which is itself lower than the estimated preservation rate of Cenozoic mammals. This seems highly unlikely, given that we have shown that there was no sharp disjunct in the CCM of the eutherian fossil record from the Cretaceous to the Paleogene.
Shareholder-Quorum Subsampling and Early Placental Evolution
The SQS analysis shows that there is a large difference between eutherian richness levels in the Cretaceous and the Paleogene (Fig. 4). The Cretaceous has very low richness, as would be expected from the relatively small number of Cretaceous eutherian fossils. The sharp rise in richness across the K/Pg boundary is not accompanied by a simultaneous change in the CCM, suggesting that the richness increase seen is not merely an effect of sampling. Although Longrich et al. (Reference Longrich, Scriberas and Wills2016) found that mammals suffered severe extinction at the K/Pg, they also reported rapid recovery. The methods employed in the present study cannot account for species turnover, and subsequent increases in species richness outweigh the loss in the mass extinction itself.
The general increase in richness across the Paleogene supports an overall eutherian radiation during this period, although the increase occurs in stages, interspersed with dips in species number, suggesting that there was not a continuous radiation throughout the Paleogene, implying nontrivial rates of extinction at the Paleocene/Eocene and Eocene/Oligocene boundaries.
This result lends support to the explosive model of early placental evolution, in which the group originated and diversified proximal to the K/Pg boundary. The sharp rise in richness across the K/Pg boundary represents the adaptive radiation predicted by this model to have taken place within the first few million years of the Paleocene, and resulted in morphological and ecological specialization of many placental lineages (Halliday et al. Reference Halliday, Upchurch and Goswami2016; Halliday and Goswami Reference Halliday and Goswami2016a).
A short-fuse model is not supported, given that the vast majority of the increase in eutherian richness occurred in the Paleogene, not the Cretaceous. While a long-fuse model cannot be ruled out, the results indicate that any placental taxa from the Late Cretaceous must have been present either in small numbers, in order to avoid discovery in a relatively complete fossil record, or in an unsampled region, as postulated in the “Garden of Eden” hypothesis (Hunter and Janis Reference Hunter and Janis2006).
Study Resolution: Influence of Data Bins
No correlation between CCM score and taxon richness was found. There was also no correlation between the length of a bin and its respective CCM. Therefore, it can be said that the choice of geological stages as time bins is appropriate, since the boundaries of each bin do not appear to be influencing the results.
The higher variation in the CCM in Cretaceous bins may be due to the small sample sizes of these bins; there were just 35 taxa in the entire Cretaceous sample, while even the smallest Paleogene bin alone contained 29 taxa.
Paleoenvironment
Mannion and Upchurch (Reference Mannion and Upchurch2010) found an inverse relationship between sea level and sauropodomorph completeness, supporting a previously suggested mechanism whereby increases in sea level act to reduce the land area in which sauropodomorphs can live, and therefore be sampled by the fossil record (Markwick Reference Markwick1998). No relationship was found in the present study between sea level and eutherian CCM, despite eutherians being restricted to terrestrial environments until the evolution of early cetaceans and sirenians during the Eocene (Gingerich et al. Reference Gingerich, Wells, Russell and Shah1983, O’Leary et al. Reference O’Leary, Bloch, Flynn, Gaudin, Giallombardo, Giannini, Goldberg, Kraatz, Luo, Meng, Ni, Novacek, Perini, Randall, Rougier, Sargis, Silcox, Simmons, Spaulding, Velazco, Weksler, Wible and Cirranello2013). Analysis of only Cretaceous and Paleogene bins was also not significant. Sauropodomorph dinosaurs had much larger body sizes than Cretaceous mammals and were likely to have been preserved under different taphonomic processes, perhaps explaining the lack of correlation between eutherian CCM and sea level. It is possible that eutherian fossils, being generally smaller, were more likely to be transported into other deposits than sauropodomorphs, thus reducing the requirement for terrestrial deposition.
No significant correlation was found between the CCM and δ18O, δ13C, or 87Sr/86Sr. However the AIC analysis returned strong support for a model involving 87Sr/86Sr in explaining the variance in the CCM; not only was the 87Sr/86Sr record by far the best model, but the next best supported models are 87Sr/86Sr and δ18O, and 87Sr/86Sr and δ13C. This is likely because these proxy measures are not independent of each other; previous factor analysis of these isotope records, as well as the sulfur isotope record (δ34S), returned three common factors, together accounting for 79% of their total variance. Two of these factors, accounting for 63% of the total variance, were suggested to be tectonic factors (Veizer et al. Reference Veizer, Ala, Azmy, Bruckschen, Buhl, Bruhn, Carden, Diener, Ebneth, Godderis, Jasper, Korte, Pawellek, Podlaha and Strauss1999).
Tectonic activity could affect the CCM through changes in sediment deposition. Increased tectonic activity results in increased erosion and, consequently, increased sedimentation and deposition rates. It has been suggested that tectonic activity may therefore act as a secondary control on fossil preservation (Crampton et al. Reference Crampton, Foote, Cooper, Beu and Peters2011). However, since the correlation analysis did not find a significant relationship between the CCM and 87Sr/86Sr, further investigation is required.
Completeness Patterns
The significant difference observed between the CCM of the first two 10 Myr bins following the K/Pg, the 66–56 Ma and 56–46 Ma bins, might be explained by the Paleocene–Eocene thermal maximum (PETM), currently dated to ca. 56 Ma (Charles et al. Reference Charles, Condon, Harding, Paelike, Marshall, Cui, Kump and Croudace2011). A sudden increase in global temperatures is marked by a sharp dip in the δ13C record, indicating a large addition of isotopically light carbon. This increase in the CCM is not recovered in the geological-stage bins, although the Thanetian is a relatively short bin (3.2 Ma) that may not contain enough taxa to support a statistically significant difference between the two bins. We have not found a relationship between fossil record completeness and paleotemperature; however, the increase in global temperatures that characterize the PETM were likely to be accompanied by other environmental and ecological changes that could have contributed to the increase in completeness observed here.
Previous Completeness Studies
No correlation was found between Cretaceous eutherian CCM and any of the measures of sauropodomorph completeness (Mannion and Upchurch Reference Mannion and Upchurch2010) or with the CCM of birds (Brocklehurst et al. Reference Brocklehurst, Upchurch, Mannion and O’Connor2012) or pterosaurs (Dean et al. Reference Dean, Mannion and Butler2016). This suggests that the fossil record of eutherian mammals is under different controls than these groups. Brocklehurst et al. (Reference Brocklehurst, Upchurch, Mannion and O’Connor2012) suggested that the bird fossil record was not controlled by the same factors as the sauropodomorph record, largely because of the differences in body size and the effect of Lagerstätten. This was supported by the conclusions of Dean et al. (Reference Dean, Mannion and Butler2016), who found a strong correlation between pterosaurs and birds, both of which have (compared with sauropods) small and fragile skeletons capable of preservation in Lagerstätte deposits.
Lagerstätten are nonexistent for Cretaceous eutherians, such that where peaks occur in bird and pterosaur completeness due to such formations, there is no corresponding peak for eutherian completeness. An alternative possible explanation is that Cretaceous eutherians occupied different habitats than birds and pterosaurs; for example, Cretaceous eutherians were predominantly terrestrial, and as such would be preserved mostly in terrestrial deposits, whereas birds and pterosaurs can be found in both terrestrial and marine deposits because they were able to fly (Brocklehurst et al. Reference Brocklehurst, Upchurch, Mannion and O’Connor2012). The difference between eutherians and sauropodomorphs could be explained by the large difference in body size between the two groups; even though both were predominantly terrestrial, their fossil records would be under the control of different factors. Another reason for the lack of correlation between eutherians and other groups may be the relatively small number of eutherian taxa in the Cretaceous; while the sample sizes within each bin are sufficient to assess long-term CCM levels, they may be too low for taxonomic patterns within bins to be characterized.
Conclusions
There was no significant change in the CCM of the eutherian fossil record across the K/Pg boundary. This result supports the view that phylogenetic placement of Cretaceous eutherians is no more biased by completeness of specimens than is that of Paleogene eutherians. As a result, it can be said that a lack of any definitively identified Cretaceous crown-group placental mammals is not a result of misidentification due to missing synapomorphies. Several Cretaceous eutherians have variably been assigned to the crown and the stem of Placentalia, including Protungulatum (Wible et al. Reference Wible, Rougier, Novacek and Asher2007; O’Leary et al. Reference O’Leary, Bloch, Flynn, Gaudin, Giallombardo, Giannini, Goldberg, Kraatz, Luo, Meng, Ni, Novacek, Perini, Randall, Rougier, Sargis, Silcox, Simmons, Spaulding, Velazco, Weksler, Wible and Cirranello2013), Purgatorius (Wible et al. Reference Wible, Rougier, Novacek and Asher2007; Chester et al. Reference Chester, Bloch, Boyer and Clemens2015), Deccanolestes (Smith et al. Reference Smith, De Bast and Sigé2010; Goswami et al. Reference Goswami, Prasad, Upchurch, Boyer, Seiffert, Verma, Gheerbrant and Flynn2011), the cimolestids (McKenna and Bell Reference McKenna and Bell1997; Rook and Hunter Reference Rook and Hunter2014), and the leptictids (Hooker Reference Hooker2014; Halliday et al. Reference Halliday, Upchurch and Goswami2015). Our results do not resolve these phylogenetic discrepancies but show that completeness of the fossils themselves cannot be held responsible for the lack of unambiguous Cretaceous placentals.
An explosive model of early placental diversification after the end-Cretaceous mass extinction is therefore supported by this analysis. Dates for the origin of Placentalia that are tens of millions of years prior to the K/Pg boundary, such as those typically suggested by molecular clock studies, can only be reconciled with the results of this analysis if a systematic bias in preservation prevented the earliest placentals from being preserved at all throughout the period from divergence to the end of the Cretaceous—a situation that becomes increasingly less likely with earlier dates. Finally, the eutherian fossil record is not influenced by the same factors that affected bird or sauropodomorph completeness during the Cretaceous and does not appear to be under the influence of paleotemperature or sea level.
Acknowledgments
We would like to thank reviewers N. Brocklehurst and D. Polly for their useful and constructive comments. This work was supported by Natural Environment Research Council award NE/J/500136/1 to T.J.D.H., Leverhulme Trust grant RPG-2014/364 to A.G., and T.J.D.H., and Leverhulme Trust grant RPG-2010/129 to A.G. This is Paleobiology Database publication #290.
Supplementary Material
Data available from the Dryad Digital Repository: http://dx.doi.org/10.5061/dryad.r0881


 Open access