


Introduction
Biodiversity loss and species extinctions are ongoing, with a decline of most indicators of the state of biodiversity (Butchart et al., Reference Butchart, Walpole, Collen, van Strien, Scharlemann and Almond2010; Ceballos et al., Reference Ceballos, Ehrlich, Barnosky, García, Pringle and Palmer2015; Pimm & Joppa, Reference Pimm and Joppa2015). Despite the political commitment shown by parties to the Convention on Biological Diversity to implement the Global Strategy for Plant Conservation, to stem the continuing loss of plant diversity (UNEP, 2000, 2010), plant species are also following this negative trend (Brummitt et al., Reference Brummitt, Bachman, Griffiths-Lee, Lutz, Moat and Farjon2015; Royal Botanic Gardens, Kew, 2016; Humphreys et al., Reference Humphreys, Govaerts, Ficinski, Nic Lughadha and Vorontsova2019).
The Caribbean archipelago is a global biodiversity hotspot, with high levels of endemism and a flora that is threatened primarily by habitat conversion for agriculture and livestock farming (Myers, Reference Myers1988; IPBES, Reference Rice, Seixas, Zaccagnini and BedoyaGai2018). To tackle the conservation deficit of the Caribbean (Maunder et al., Reference Maunder, Leiva, Santiago-Valentín, Stevenson, Acevedo-Rodríguez and Meerow2008; Dryflor et al., Reference Dryflor, Delgado-Salinas, Dexter, Linares-Palomino, Oliveira-Filho and Prado2016; Jestrow et al., Reference Jestrow, Peguero, Jiménez, Verdecia, González-Oliva and Moya2018), the UK Overseas Territories team at the Royal Botanic Gardens, Kew, has been studying the flora of the Caribbean islands (Hamilton et al., Reference Hamilton, Bárrios, Clubbe, Corcoran, Gdaniec and Sanchez2016; Hamilton & Bárrios, Reference Hamilton and Bárrios2017) to assess the IUCN Red List status of species (IUCN, 2012) and to provide evidence for conservation interventions. A recent review has highlighted the knowledge gaps and conservation significance of plants in the UK Overseas Territories (Clubbe et al., Reference Clubbe, Ainsworth, Bárrios, Bensusan, Brodie and Cannon2020).
Vachellia anegadensis (Britton) Seigler & Ebinger (synonym Acacia anegadensis Britton), a c. 8 m tall tree, was formerly believed to be endemic to the island of Anegada but a 2008 survey identified a population on the island of Fallen Jerusalem (Bárrios & Hamilton, Reference Bárrios and Hamilton2018). We undertook targeted surveys to collect data for evaluation of the distribution, population genetics, dependency on pollinators, and main threats to this species. Here we use these new data to develop conservation recommendations to safeguard the long-term survival of this threatened species. These data also formed part of the evidence to recategorize this species as Endangered (Bárrios & Hamilton, Reference Bárrios and Hamilton2018).
Study area
The British Virgin Islands, a UK Overseas Territory in the Caribbean Sea, comprises c. 240 mostly small and uninhabited islands and cays. The study sites are the islands of Anegada and Fallen Jerusalem (Fig. 1a). The 40 km2 Anegada, the most north-easterly island of the archipelago and the only one that is of non-volcanic origin, rises to c. 8 m altitude and is inhabited by c. 250 people, who live on the western part of the island, mostly around The Settlement. (Island Resources Foundation, 2013). The submerged limestone reef from which Anegada originated formed 119,000–130,000 years ago (Hedges, Reference Hedges, Woods and Sergile2011). The c. 1 km2 Fallen Jerusalem, an uninhabited volcanic island formed c. 80 million years ago, rises to 50 m altitude and was designated a Bird Sanctuary in 1959 and a National Park in 1974 (Gardner et al., Reference Gardner, Smith-Abbott, Woodfield, Lloyd, Smith-Abbott and Woodfield2008).
(a) The British Virgin Islands, showing the locations of Anegada and Fallen Jerusalem, the two islands where the endemic tree Vachellia anegadensis occurs, and (b) distribution map of V. anegadensis on these two islands, as determined by our transect surveys.

Methods
Data collection
The distribution of V. anegadensis and the main threats to the species were determined by compiling information from literature and historical herbarium collections dating back to 1919 from JSTOR (2015), Missouri Botanical Garden (2015), New York Botanical Gardens (2015) and the UKOTs Online Herbarium (Reference Hamilton and Bárrios2020), and by carrying out field surveys during 2014–2019. In presence/absence transect surveys 5 × 5 m quadrats were searched every 100 m, for a minimum of six quadrats per transect, without limiting the number of quadrats per transect. Transects covered both islands, with a total of 20 transects. To ensure each transect was restricted to a single vegetation type, transects started 5–10 m from vegetation boundaries, as defined by the Anegada vegetation map (McGowan et al., Reference McGowan, Broderick, Clubbe, Gore, Godley and Hamilton2006). Transect orientation was chosen randomly, using a random number in the range 1–360, but avoided highly disturbed areas, although roads and paths were used for access and as transect lines. Voucher specimens of V. anegadensis were collected at the start of each transect, ensuring a collection every 1 km across the island, to document the full morphological diversity of this species, across all habitat types. Data were collected using two data entry forms, one for presence and one for absence. If V. anegadensis was not present in a quadrat but was up to 10 m away from the edge of the quadrat, this was noted. For all quadrats where V. anegadensis was present, the main threat, if present, was recorded as grazing, development, disturbance, clearing, invasive species, dumping or agriculture. Development was defined as construction, including roads or houses adjacent to quadrats, but also when signs of future development, such as development markers on the ground were observed. On Fallen Jerusalem, because of time restrictions, a single transect was undertaken with a southerly orientation, crossing the entire island. Threats were recorded in the same way as on Anegada. Data were compiled using BRAHMS 7 (University of Oxford, 2015).
Population structure was investigated using DNA extracted from leaf samples, which were taken from a randomly selected V. anegadensis in a quadrat containing the species c. every 500 m on Anegada. Leaf samples were collected from all V. anegadensis on Fallen Jerusalem because of the low number of individuals. A modified Doyle & Doyle (Reference Doyle and Doyle1987) method was used to extract genomic DNA. Amplified fragment length polymorphism (AFLP) analysis was used to determine genetic diversity both within and between islands, to identify whether there were populations with unique genotypes and to infer population structure. AFLP reactions followed the Vos et al. (Reference Vos, Hogers, Bleeker, Reijans, van de Lee and Hornes1995) protocol, modified for the AFLP Plant Mapping Protocol (Applied Biosystems Inc., Foster City, USA). Fragments of total genomic DNA were obtained by mixing two restriction enzymes, EcoRI and MseI, and double stranded adapters EcoRI and MseI in a restriction-ligation reaction. DNA was then amplified by PCR, using primers capable of annealing to the known adapters. DNA fragments, from 50 to 500 base pairs, were produced and separated by electrophoresis. DNA markers were recognized as either band present or absent (Vos et al., Reference Vos, Hogers, Bleeker, Reijans, van de Lee and Hornes1995; Frankham et al., Reference Frankham, Briscoe and Ballou2002; Campbell et al., Reference Campbell, Duchesne and Bernatchez2003; Meudt & Clarke, Reference Meudt and Clarke2007). Three primer combinations were selected, by analysing DNA fragments with Genemapper 4.0 (Applied Biosystems, Foster City, USA), looking for high levels of polymorphism and reliable profiles. The primers used were CTA-(JOE-AAG); CAT-(FAM-ACT) and CTG-(NED-AGC).
Pollination studies were conducted on Anegada during April–July 2019. Visitation rates of hummingbirds and insects were monitored, separately, by direct sighting when the weather was dry and calm, during 6.00–14.00. Visitation by hummingbirds was monitored from 10 m in 30 minute observation periods; visitation by insects was monitored from 2 m in 10 minute observation periods. Visitation rate was calculated in two ways: (1) by counting the number of times we observed a given pollinator group to forage on the observed inflorescences (but ignoring the number of inflorescences visited during each feeding bout), divided by the number of observed inflorescences; and (2) by calculating the number of inflorescences visited during an observation period, divided by the number of observed inflorescences. The role of pollinators in fruit-setting was assessed experimentally. On 20 individuals of V. anegadensis, we recorded the proportion of 20 inflorescences bearing flowers that set fruit in each of two treatments: open and bagged inflorescences. For the open experiment, 20 newly opened inflorescences were marked with coloured string. For the bagged experiment, 20 late-stage buds were marked with coloured string and covered with a nylon mesh bag to exclude pollinators. The nylon mesh bags were removed as soon as the inflorescences had withered. After 4 weeks, fruit set was determined by counting the number of seed pods on each of the 40 inflorescences. The open and bagged inflorescences were paired on the 20 trees, to control for any potential micro-environmental and plant genetic effects on fruit set (Ricketts et al., Reference Ricketts, Daily, Ehrlich and Michener2004).
Data analysis
We imported the presence/absence dataset into ArcMap 10 (Esri, Redlands, USA) and incorporated presence occurrences into the Anegada vegetation map (McGowan et al., Reference McGowan, Broderick, Clubbe, Gore, Godley and Hamilton2006), producing a final species distribution map (Fig. 1b). Data on the number of times each of the seven pre-identified threats affected V. anegadensis were compiled and summarized.
AFLP fragments were detected within the size range of 50–500 base pairs and scored for peak size by GeneMapper panels with a bin width of 1.0 base pairs. These peaks were converted to binary data (1, peak present; 0, peak absent) and manually compared with the electropherograms to reconfirm presence or absence. Samples with results for all primers were combined into a single matrix. The matrix was analysed with STRUCTURE 2.3.4 (Pritchard et al., Reference Pritchard, Stephens and Donnelly2000), allowing us to infer population structure by simulating a series of genetic populations with a different mixture of individuals in each population. The model selected assumed admixture and independent allele frequency (Pritchard et al., Reference Pritchard, Stephens and Donnelly2000). We ran the analysis 10 times to be able to estimate the number of genetic clusters (K), from 1 to 10, with 100,000 steps burn-in period and 1,000,000 Markov chain Monte Carlo iterations. We uploaded the simulation results to the online resource STRUCTURE Harvester (Evanno et al., Reference Evanno, Regnaut and Goudet2005), to determine the most likely number of genetic populations using Bayesian clustering methods. Finally, we mapped the inferred ancestry for each individual for the value of K with the highest likelihood, in ArcMap.
For the pollination analysis, we used a Mann–Whitney U test to compare visitation rates by hummingbirds and insects. Subsequently, we used a Kruskal–Wallis test with a Dunn–Bonferroni post hoc test to examine differences in visitation rates among the four orders of insect visitors. We conducted the same tests for both measures of visitation rates. To test whether V. anegadensis has higher fruit/seed pod production when visited by pollinators, we used a Wilcoxon signed-rank test to compare seed pod production between the open and bagged pollination experiments. Statistical analyses were conducted using SPSS 26.0 (IBM, New York, USA).
Results
Distribution and main threats
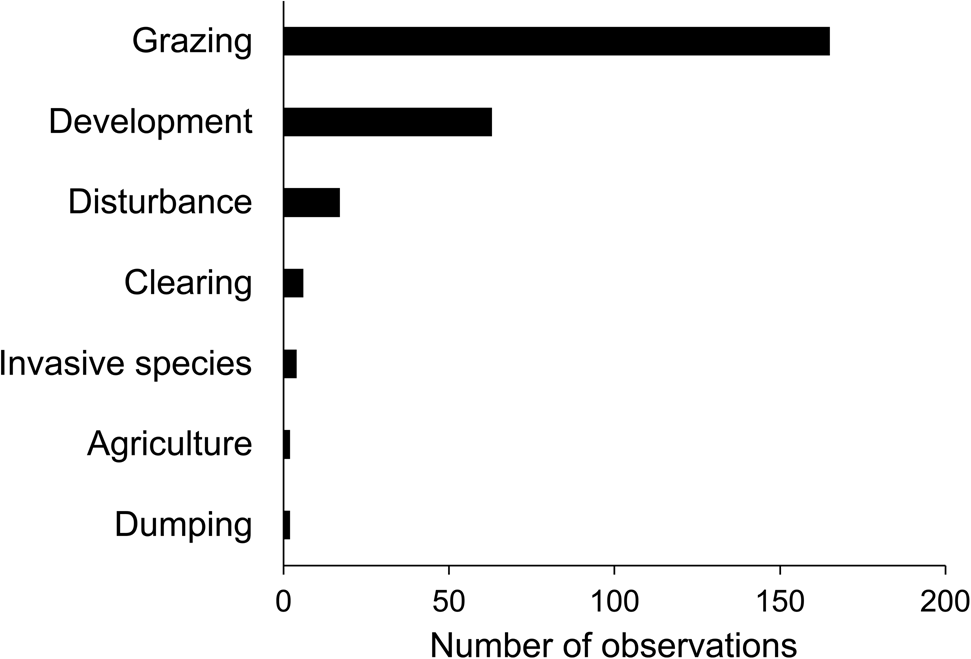
We surveyed a total of 513 quadrats on Anegada; V. anegadensis was present in 218 quadrats, absent in 198, and within 10 m of 97 quadrats where the species was considered absent. On Fallen Jerusalem, we mapped and collected DNA samples from all of the 42 trees observed. On Anegada, we recorded the species across the island except in the north-west where V. anegadensis was absent from most quadrats (Fig. 1b). We confirmed the presence of V. anegadensis in limestone scrub, limestone thicket, limestone woodland, dune thicket, dune scrub, the edge of dry salt flats, human-disturbed areas, seasonally flooded woodland, the edge of mangroves, and foredune. On Fallen Jerusalem, we found that V. anegadensis occupies a central corridor on the west of the island (Fig. 1b), an area classified as mixed forest or scrubland with succulents (Kennaway et al., Reference Kennaway, Helmer, Lefsky, Brandeis and Sherrill2008). We observed feral goats, cattle and donkeys grazing on Anegada, and this was the most commonly observed threat to V. anegadensis, followed by development (Fig. 2). We recorded cattle mostly near The Settlement and inhabited areas, and observed goats and goat droppings across the entire island.
Number of observations of seven potential, pre-identified threats affecting V. anegadensis on Anegada, recorded during our surveys.
Genetic structure
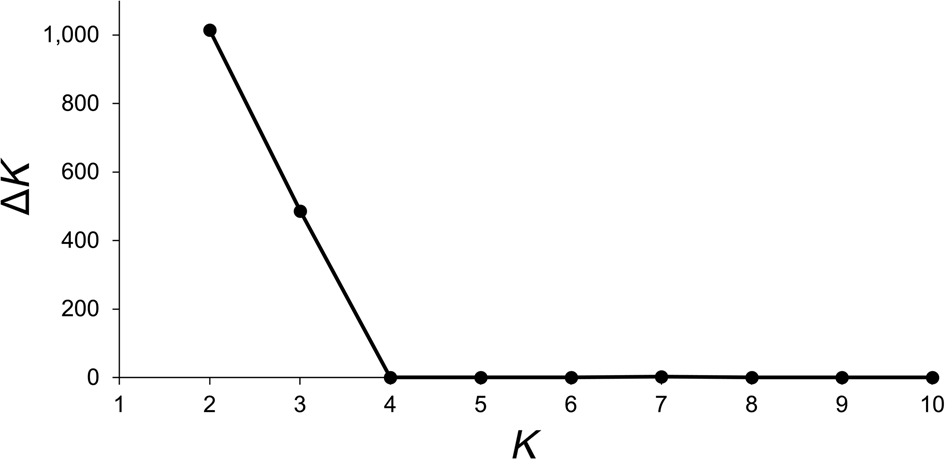
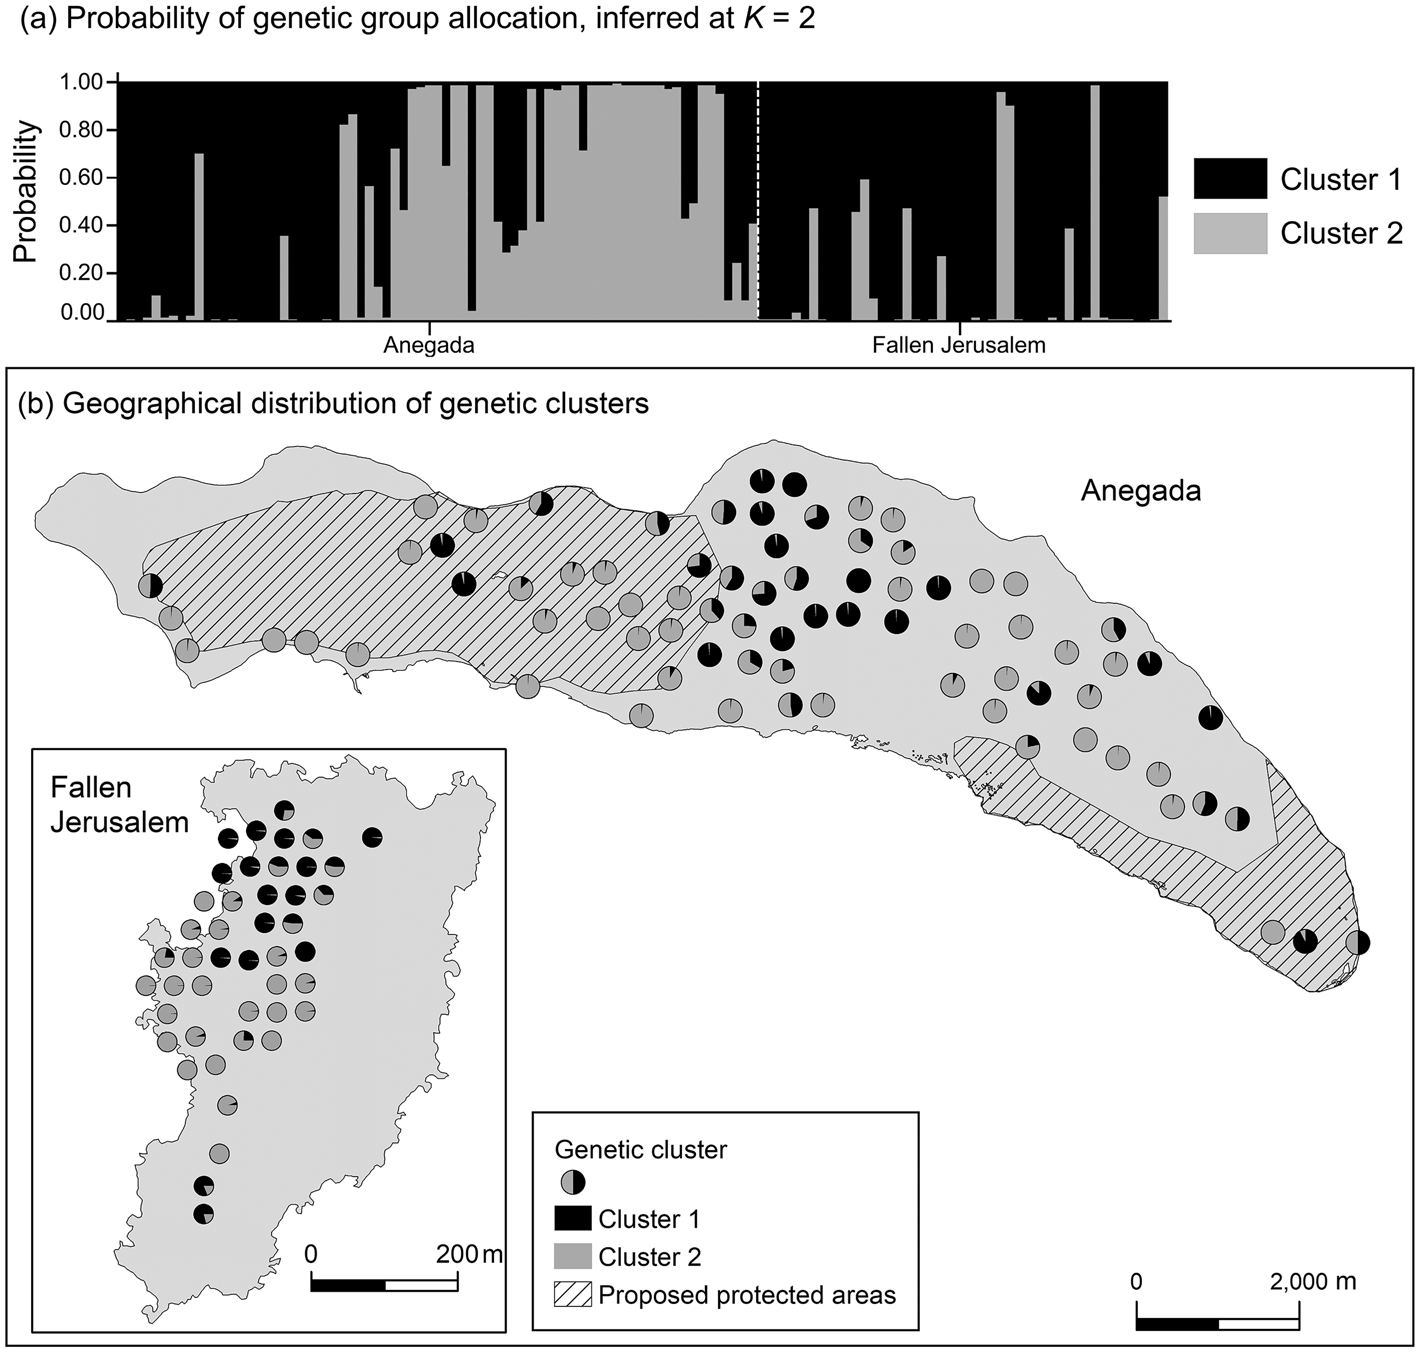
Data from 123 leaf samples were used for AFLP analysis. The three primer combinations amplified 354 loci, of which 38% on Anegada and 48% on Fallen Jerusalem were polymorphic. The highest value for ΔK (likelihood values) was for K = 2 (Fig. 3). Simultaneously, population structure analysis using Bayesian clustering methods revealed two genetic clusters (K = 2; Fig. 4a). When attempting to map each sample to the revealed genetic clusters, we were not able to assign a given population exclusively to a single cluster, and there were no clear geographical patterns (Fig. 4b).
Likelihood values (ΔK) obtained for K = 2 to K = 10, visualized with STRUCTURE Harvester (Evanno et al., Reference Evanno, Regnaut and Goudet2005), to determine the most probable numbers of genetic clusters (K) of V. anegadensis, across Anegada and Fallen Jerusalem (Fig. 1).
(a) Probability of genetic cluster membership of V. anegadensis individuals of Anegada and Fallen Jerusalem, inferred at K = 2. The model assumed admixture and independent allele frequency. (b) Geographical distribution of genetic clusters for K = 2. To visualize the individual samples we chose a non-overlapping display that approximates the exact location of the sample.
Pollination
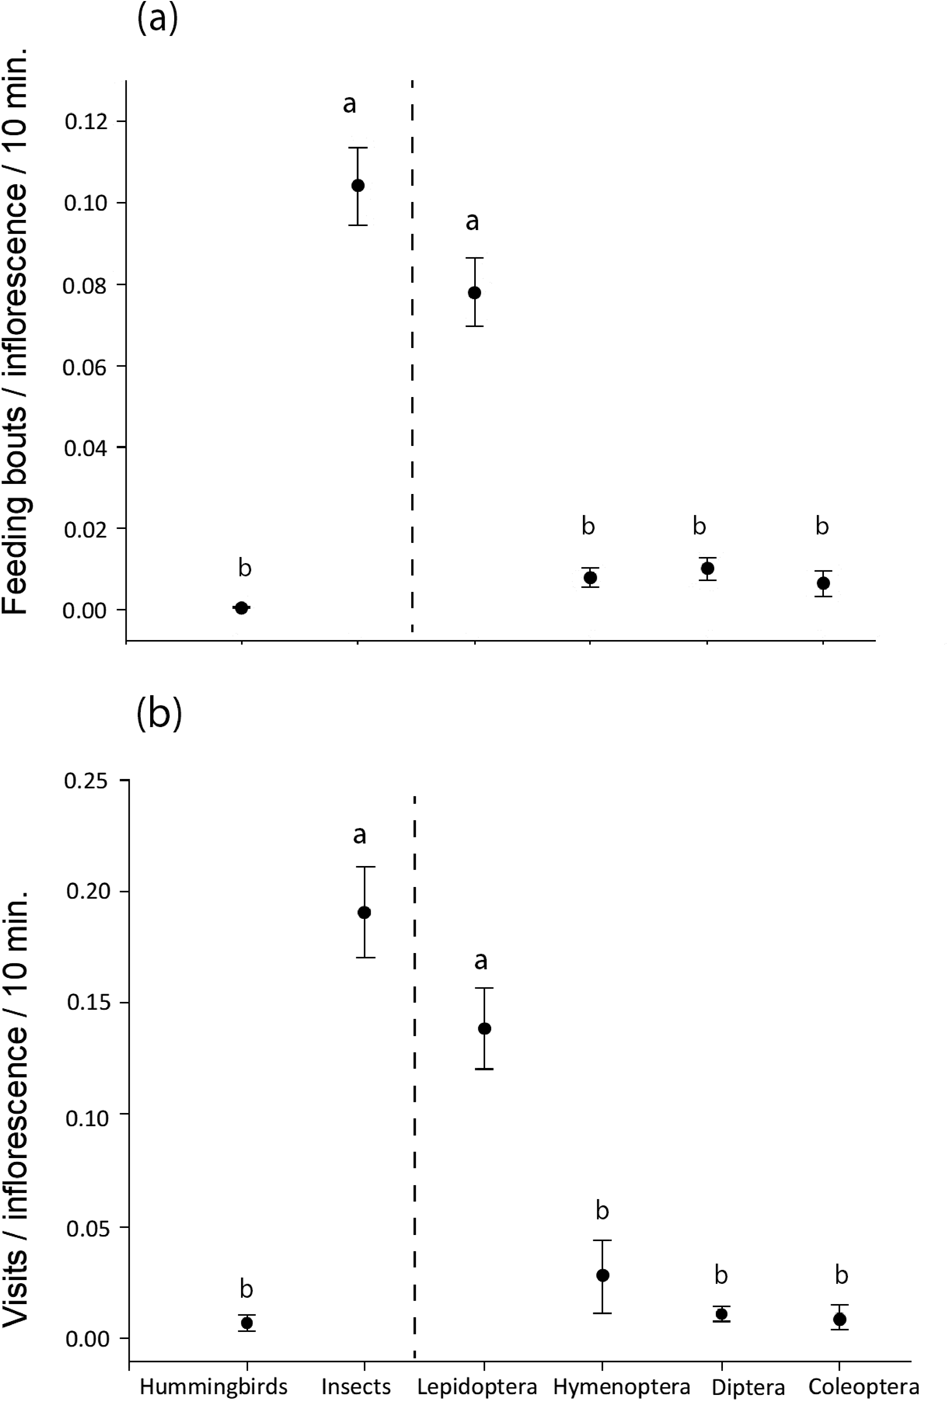
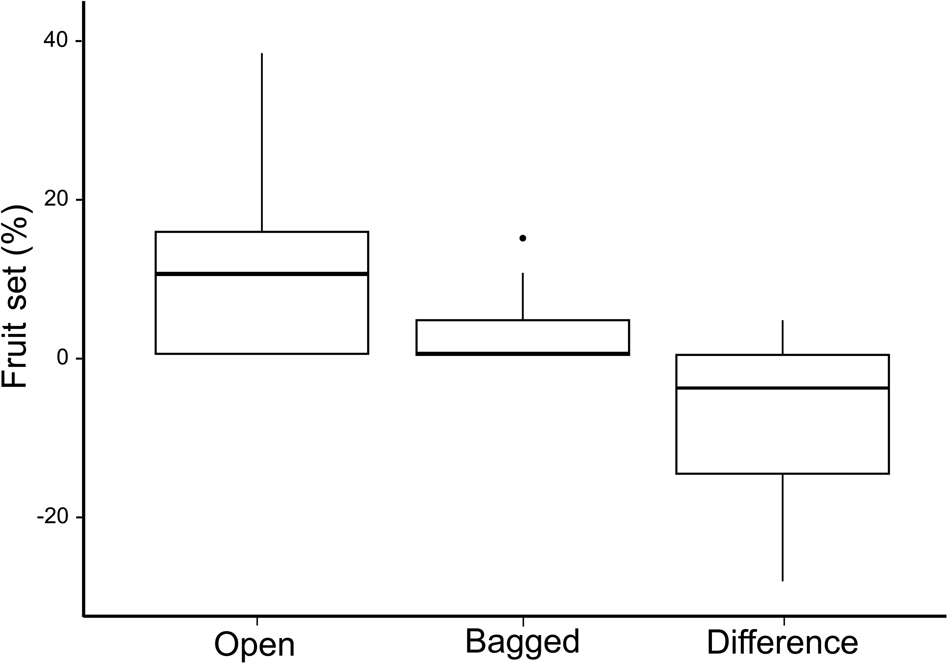
For both measures of visitation rate, insects were more frequent visitors than hummingbirds (Mann–Whitney U = 5,138 for feeding bouts/inflorescence/10 minutes, U = 5,092 for number of visits/inflorescence/10 minutes, P < 0.05). Among the insect visitors, lepidopterans were the most frequent visitors, and hymenopterans, dipterans and coleopterans were equally common visitors (Kruskal–Wallis test with a Dunn–Bonferroni post hoc test: H = 109.18 for feeding bouts/inflorescence/10 minutes, H = 108.57 for number of visits/inflorescence/10 minutes, P < 0.05; Fig. 5). A Wilcoxon signed-rank test showed that the fruit set of the two pollinator treatments differed significantly (Z = −3,107, P < 0.05;). Although the bagged inflorescence buds produced some seed pods (median 0), the open pollinator treatment had a higher production of seedpods (median 10%; Fig. 6).
Mean ± SE visitation rate for hummingbirds, all insects and the four insect orders separately, as (a) number of feeding bouts/inflorescence/10 minutes, and (b) number of visits/inflorescence/10 minutes. Different letters indicate a significant difference at P < 0.05 between groups; hummingbirds vs insects compared by Mann–Whitney U test (left of vertical line) and between insect groups compared by a Dunn–Bonferroni post hoc test following a Kruskal–Wallis test (right of vertical line).
Box plots showing per cent fruit set under two paired pollination treatments, open and bagged, on 20 individual V. anegadensis, and the difference in produced seed pods for the two treatments. In each box plot, the middle thick line indicates the median, box limits are the first and third quartiles, vertical lines indicate the data range and the dot indicates an outlier.
Discussion
Although widespread on Anegada, and occurring on Fallen Jerusalem, the endemic tree V. anegadensis is threatened. On Anegada we confirmed previous studies, which documented it across the island (Clubbe et al., Reference Clubbe, Gillman, Acevedo-Rodríguez and Walter2004), although less abundant in the north-west. Fallen Jerusalem has a deficit of historical records and research. This species is mainly found in the forested interior of the island, which also coincides with the area that has higher availability of freshwater and reduced salt spray (authors, pers. obs.).
The analysis of population structure revealed distinct genetic clusters, but geographical location did not predict genetic differentiation. The genetic variability is equally spread, with no evidence of geographical clustering. Although studies of the genetic variation of tropical and Caribbean tree species suggest that geographically separate populations often have moderate levels of genetic differentiation (Loveless, Reference Loveless1992; Rivera-Ocasio et al., Reference Rivera-Ocasio, Aide and McMillan2002), this is not the case for V. anegadensis. This could be the result of continuing gene flow between the two islands and/or of historical colonization events. For example, trees on Fallen Jerusalem could have originated from a colonization event by trees from Anegada, or vice-versa (Loveless, Reference Loveless1992; Comes & Abbott, Reference Comes and Abbott1998; Aguirre-Planter et al., Reference Aguirre-Planter, Furnier and Eguiarte2000; Hedges, Reference Hedges, Woods and Sergile2011).
Feral animals and development appear to be the greatest threats to V. anegadensis on Anegada, in common with threats observed in other Caribbean regions (González-M. et al., Reference González-M., Garcia, Isaacs, Cuadros, López-Camacho and Rodríguez2018; Murray et al., Reference Murry, Colón-Merced, Colón-Rivera, Fury, García-Bermúdez, Herrera-Giraldo, Goldstein and DellaSala2020). Caribbean forests evolved in the absence of livestock and free from grazing by ungulates. Livestock were brought to the Caribbean c. 400 years ago by European settlers (Shepherd, Reference Shepherd2009). On Anegada, livestock were historically kept within walled pens, but these were destroyed during the establishment of the airstrip and road network during the 1960s, allowing the livestock to roam freely across the island (Veitch, Reference Veitch1999; Island Resources Foundation, 2013). This had a devastating effect on the native flora (Schofield, Reference Schofield1989; Mitchell, Reference Mitchell1999). Overgrazing reduces the number of seedlings, thus hindering regeneration. Overgrazing also depletes seed banks and, through changes to soil conditions, leads to compaction and reduction of top soil, which is essential for seed germination (Baker & Reeser, Reference Baker and Reeser1972; Veitch, Reference Veitch1999; Meléndez-Ackerman, Reference Meléndez-Ackerman2008). The impacts of these feral animals are not limited to the flora. The endemic Anegada iguana Cyclura pinguis, which disperses the seeds of V. anegadensis (Gerber, Reference Gerber1999; Bradley & Gerber, Reference Bradley and Gerber2005), has been faced with a shortage of food, as the native vegetation is consumed by feral animals (Veitch, Reference Veitch1999). Development of tourist infrastructure on Anegada is not yet comparable to that in other parts of the British Virgin Islands, but the 2007 Land Allocation Plan proposed a new settlement in the east, where the eastern salt ponds is the only protected area proposed on the island. Although this Land Allocation Plan has not yet been implemented, the development of a new settlement would have considerable impact on V. anegadensis as it would involve removal of more than half of the individuals on the island along with their habitat. During this study we observed indiscriminate road widening across the island, especially from The Settlement to Loblolly Bay, and illegal land clearance for farming on the western salt ponds, in both cases resulting in the death of V. anegadensis individuals. The threat of additional development remains and would have serious implications for the future of V. anegadensis without adequate protection measures in place.
Although Fallen Jerusalem is a National Park it receives few visitors. However, some tourists hike on the island, and use the beach, which can cause disturbance to the vegetation. Another potential threat on Fallen Jerusalem is invasive rats Rattus rattus (Hamilton et al., Reference Hamilton, Bradley and Heller2019). Rats feed on seeds and seedlings, contributing to the extinction of plant species (Wolf et al., Reference Wolf, Young, Zilliacus, Wegmann, McKown and Holmes2018). This alien species could be predating seeds and seedlings of V. anegadensis and may be the main reason why we did not observe recruitment on the island. Both islands are being affected by more frequent and more prolonged droughts, and more intense hurricanes, indicative of global climate change, and may be affected by future sea level rise (Hamilton, Reference Hamilton2016; IPCC, Reference Masson-Delmotte, Zhai, Pörtner, Roberts, Skea and Shukla2018).
Vachellia anegadensis is visited by a variety of pollinators, including hummingbirds and insects belonging to several orders, similar to other Caribbean plants (Dalsgaard et al., Reference Dalsgaard, Martín González, Olesen, Ollerton, Timmermann, Andersen and Tossas2009; Martin González et al., Reference Martin González, Dalsgaard, Ollerton, Timmermann, Olesen, Andersen and Tossas2009). However, insects, especially butterflies, are the most frequent floral visitor. Vachellia anegadensis had a low seed pod production when pollinators were excluded, indicating either that the tree may self-pollinate or be wind pollinated, as the nylon bags only excluded pollinators. The significantly higher production of seed pods in the absence of exclusion bags indicates the importance of pollinators, especially butterflies, for successful reproduction and thus the need for this to be considered in conservation strategies for V. anegadensis.
We recommend that a conservation strategy for V. anegadensis should aim to maintain the species’ present levels of genetic variability, reduce the pressure from threats and help maintain suitable habitat. These aims would be aided by the legal establishment of the protected areas proposed on Anegada in the Protected Areas System Plan (Lloyd et al., Reference Lloyd, Smith-Abbott and Woodfield2008). Long-standing land issues need to be resolved to manage these areas successfully for biodiversity and livelihoods. There is a pressing need to address the greatest threat to V. anegadensis, feral livestock that roam freely across the island. Some of the livestock do not seem to have owners, and owners of free-ranging livestock do not appear willing to tether them. The Protection of Trees and Conservation of Soil and Water Ordinance (Gardner et al., Reference Gardner, Smith-Abbott and Woodfield-Pascoe2007), which prohibits grazing of livestock in protected areas, is a mechanism that could address this issue once the protected areas are approved. In addition, some areas designated as proposed protected areas, which are uninhabited, need to be temporarily fenced, to prevent access by feral animals and to promote vegetation regeneration. Monitoring of V. anegadensis, and of the species’ pollinators and seed dispersers, is required, and also monitoring of the invasive alien plants Cryptostegia madagascariensis Bojer ex Decne. and Kalanchoe pinnata (Lam.) Pers, which we observed to be spreading from The Settlement. Studies on other islands in the Caribbean have shown that isolation of vegetation is an effective in situ conservation measure (Baker & Reeser, Reference Baker and Reeser1972; Debrot & de Freitas, Reference Debrot and de Freitas1993; Wittenberg & Cock, Reference Wittenberg and Cock2001). These proposed conservation measures need to be incorporated into a species management plan for V. anegadensis, to guide conservation interventions and to ensure the long-term survival of this threatened endemic species. Such a document could also provide a useful model to guide the conservation of other threatened Caribbean endemic plants.
Acknowledgements
This research was sponsored by the Mohamed bin Zayed Species Conservation Fund (project number: 13257818) and the Bentham-Moxon Trust. MD and BD thank the Danish National Research Foundation for its support of the Center for Macroecology, Evolution and Climate, GLOBE Institute, University of Copenhagen, Denmark (grant number DNRF96). BD thanks Independent Research Fund Denmark (grant no. 0135-00333B). SB thanks Steven Bachman for GIS support and the Director of the National Parks Trust of the Virgin Islands, Cassander Titley-O'Neal, for useful discussion on conservation issues in the British Virgin Islands. We thank all staff of the National Parks Trust of the Virgin Islands for facilitating this work.
Author contributions
Study design: SB, RC, MAH, CC, MD, BD; fieldwork: SB, MAH, MD; data analysis: SB, RC, CC, JH, MD, BD, writing: SB, CC, MD, BD; revision: all authors.
Conflicts of interest
None.
Ethical standards
This research abided by the Oryx guidelines on ethical standards.


 Open access