


1. Introduction
There is considerable evidence that greater ethnic diversity is associated with weaker economic performance. Alesina et al. (Reference Alesina, Devleeschauwer, Easterly, Kurlat and Wacziarg2004), Easterly and Levine (Reference Easterly and Levine1997) and Montalvo and Reynal-Querol (Reference Montalvo and Reynal-Querol2005b) find a negative effect of measures of ethnic diversity on economic growth. Alesina et al. (Reference Alesina, Baqir and Easterly1999) and Miguel and Gugerty (Reference Miguel and Gugerty2005) show that local supply of public goods is adversely affected when the population is ethnically heterogeneous, Costalli et al. (Reference Costalli, Moretti and Pischedda2014) use a synthetic control method to assess the national-level economic impact of civil war in a sample of 20 countries.
A common explanation for the negative effect of ethnic diversity on economic performance is that more ethnically diverse societies suffer more serious internal conflicts. Barro (Reference Barro1991) shows that revolutions and coups have a strong negative effect on growth. The empirical association between ethnic diversity and armed conflict has been quite extensively investigated. Bleaney and Dimico (Reference Bleaney and Dimico2011) presents evidence of a significant correlation, although Hegre and Sambanis (Reference Hegre and Sambanis2006) conclude that ethnic diversity is robustly correlated only with the probability of small-scale conflict.Footnote 1 There is some evidence that ethnic diversity makes conflicts harder to stop (Collier et al., Reference Collier, Hoeffler and Söderbom2004; Fearon, Reference Fearon2004), rather than that it makes them more likely to start (Collier and Hoeffler, Reference Collier and Hoeffler1998, Reference Collier and Hoeffler2004; Collier et al., Reference Collier, Hoeffler and Rohner2009; Fearon and Laitin, Reference Fearon and Laitin2003). Kanbur et al. (Reference Kanbur, Rajaram and Varshney2011) provides an in-depth survey of the relationship between ethnic diversity and ethnic strife. Blattman and Miguel (Reference Blattman and Miguel2010) also cover the topic extensively.Footnote 2
A persistent – and so far unresolved – matter of debate has been whether it is ethnic diversity per se or a particular pattern of diversity that is important. Montalvo and Reynal-Querol (Reference Montalvo and Reynal-Querol2005a) argue that conflict is associated with polarization between two sizeable ethnic groups rather than just the proliferation of groups as measured by a fractionalization index.Footnote 3 Some recent research has suggested that conflicts are particularly hard to stop in polarized societies (Montalvo and Reynal-Querol, Reference Montalvo and Reynal-Querol2010; Schneider and Wiesehomeier, Reference Schneider and Wiesehomeier2010).
In this paper, we investigate two possible reasons why it has proved hard to determine whether negative effects on economic performance are more strongly associated with polarized rather than fractionalized societies.
One is that, for purely mathematical reasons, the distinction between polarization and fractionalization is only relevant for societies with ethnic diversity above a certain threshold. Below this threshold, the two measures are very highly positively correlated, and therefore statistically indistinguishable. If the major feature of the data is that ethnically homogeneous societies are significantly more peaceful than those with even quite a limited degree of heterogeneity, and beyond that the level of diversity makes little difference, then statistical results will be similar whether diversity is measured by fractionalization or polarization. The first hypothesis is therefore that ethnic diversity is largely uncorrelated with conflict, except that near-homogeneous societies are more peaceful than others. In other words, the degree of ethnic diversity does not explain why one country with significant ethnic diversity is more prone to armed conflict than another country with significant ethnic diversity, but only why such countries are more conflict-prone than ethnically homogeneous countries.
The second hypothesis assumes that polarization is the critical aspect of ethnic diversity, but not necessarily just at the national level. In highly fractionalized societies, the national measure of polarization tends to be rather low, because of the limited population share of even the largest groups. However, if high levels of ethnic fractionalization are associated with regional concentration of minorities, as we show below to be typically the case, then many regions may have a very different ethnic composition from the national average, and in particular, they may have much higher levels of ethnic polarization than the national level.Footnote 4 On the other hand, because of the very different ethnic composition of different regions, in this situation, conflict is more likely to be confined to a limited geographical area. Although we do not have data on regional ethnic diversity, it is possible to test whether the geographical extent of conflict decreases at high levels of fractionalization, and whether minority groups are more likely to be engaged in rebellious activity when they are regionally concentrated.
Previous work that is quite closely related to this second hypothesis includes Toft (Reference Toft2003), Fearon and Laitin (Reference Fearon and Laitin2011) and Esteban and Ray (Reference Esteban and Ray2011). As Toft notes, bargaining theory tells us that armed conflict is not usually the rational solution to disagreements, because it is so costly to both sides, but may occur under certain conditions, of which the relevant one in this case is the indivisibility of the prize. Toft argues that, where minorities are regionally concentrated rather than dispersed, they are much more likely to regard their territory as indivisible, which tends to create conflict with other groups in the locality. This theory suggests that regional concentration of minorities should be positively correlated with the probability of armed conflict. It say nothing about the overall intra-regional population distribution, and tends to suggest that fractionalization is more important than polarization, because higher fractionalization implies more minorities.
Fearon and Laitin (Reference Fearon and Laitin2011) argues that nearly a third of ethnic civil wars arise from migration, mainly by members of the dominant ethnic group, into areas historically inhabited by a minority group. They discuss a number of examples, mainly from Asia. This idea seems quite closely related to ours in that local polarization appears to be an important factor, but it is more restrictive in that they stress the element of migration.
Esteban and Ray (Reference Esteban and Ray2011) hypothesize that either fractionalization or polarization can be relevant, depending on circumstances. They develop a theoretical model in which the relationship between the investment of resources in conflict and ethnic diversity depends on the nature of the prize for winning the conflict, and show that, in this model, ethnic polarization stimulates conflict if the prize is a public good, whereas ethnic fractionalization (splintering into many groups) stimulates conflict if the prize is a private good.
The intuition for this result is as follows: The probability of winning increases with a group's population and its per capita investment. If the prize is a private good, the losers can be completely excluded and the winners take the entire prize. The per capita gain from winning is therefore inversely related to the winning group's size, so small groups are tempted to invest a lot in the conflict, even though their winning probability for a given per capita investment is low. In this case, ethnic fractionalization stimulates investment in conflict. If, on the other hand, the prize is a public good, which will be enjoyed also by the losers, the gain from winning consists, not in the quantity of the good obtained, but only in being able to choose one's preferred form of the public good. The per capita gain from winning is therefore independent of group size, and it only pays groups that can significantly improve their probability of winning at the margin to invest in conflict. This incentive is greatest for two roughly equally size groups (i.e. when polarization is high). Esteban et al. (Reference Esteban, Mayoral and Ray2012) offer some supportive empirical evidence for this model.
This model suggests that either polarization or fractionalization may be associated with conflict, depending on circumstances. The purpose of the present paper is to offer a different reason why both polarization and fractionalization (measured at the national level) matter for conflict. As we show, ethnic groups are typically quite regionally concentrated. This is not surprising, since linguistic and cultural differences emerged historically mainly through geographical isolation. The implication of this is that the ethnic composition of regions of a country tends to differ quite markedly from the national average, and from each other. Conflict may therefore be quite localized, as is shown by geographically disaggregated data sets (i.e., Tollefsen et al., Reference Tollefsen, Strand and Buhaug2012). For example, in Turkey, conflict is mainly confined to areas with a substantial Kurdish-speaking population.
The hypothesis that we put forward here is that armed conflict is more common in polarized communities, whether they be polarized at the national level or at the local level. Ethnic fractionalization is not intrinsically associated with conflict, but if ethnic groups are regionally concentrated (as they tend to be), fractionalized countries will tend to have pockets of local polarization. If the second largest group is a relatively small proportion of the national population, but a large proportion of the population of a region, the national measure of polarization will be relatively low, but the local measure of polarization in that region will be quite high, as will be the national measure of ethnic fractionalization (the standard measure of ethnic diversity, equal to one minus the Herfindahl index of concentration). This hypothesis would explain why ethnic fractionalization and polarization perform about equally well in predicting the presence of conflict in a country (i.e., in the model of Bleaney and Dimico, Reference Bleaney and Dimico2011), fractionalization picks up conflict associated with local (but not national) polarization, while both measures are low in ethnically homogeneous countries.
To test this hypothesis, we use group-level data from the MAR dataset in order to have a direct test of the relationship between ethnic polarization at a subnational level (measured by the regional concentration of the group) and the probability of armed conflict, and also its geographical extent. Consistent with our hypothesis, we find that local concentration of groups increases with the level of national fractionalization, and because of that national fractionalization increases the probability of local pockets of polarization. Therefore, countries with a higher level of national fractionalization tend to experience conflicts of smaller scale compared to ethnically polarized countries, which explains why ethnic fractionalization is more strongly correlated with conflict in datasets with a low-death threshold (i.e. the UCDP/PRIO with a 25 battle-related death threshold) than in those with a relatively high-death threshold (i.e. the correlates of war with a 1,000 death threshold). Our explanation of such an effect relates to the probability that ethnic fractionalized countries are characterized by pockets of local polarization, which then tend to increase the probability of local and less extensive conflicts. This explanation is confirmed by the group-level analysis where we show a significant relationship between the national level of fractionalization and the probability of regional concentration of groups (and therefore the level of subnational polarization) which then has a negative effect on the geographical extent of the conflict. These results are also consistent with evidence from Indonesia by Barron et al. (Reference Barron, Kaiser and Menno2009) who show a positive relation between local conflicts and ethnic clustering.
The paper is organised as follows. In Section 2, we test the first hypothesis: that the correlation between conflict and measures of ethnic diversity is most evident toward the homogeneous end of the spectrum. In Section 3, we show theoretically that ethnic fractionalization plus regional concentration of groups gives rise to pockets of local polarization. Section 4 provides evidence that minority groups are indeed regionally concentrated. Section 5 explores data from the minorities at Risk Project on the regional concentration of minorities and their participation in rebellious activities. Regional concentration is associated with greater incidence of conflict, but less geographical extent. These results are consistent with our hypothesis that local polarization makes a country susceptible to local conflicts. Section 6 concludes.
2. Conflict and ethnic diversity
The most commonly used measure of ethnic diversity is ethnic fractionalization, which is equal to one minus a Herfindahl index of concentration:
 $$\begin{equation}
F = 1 - \sum\limits_{i = 1}^n {\pi _i^2} ,
\end{equation}$$
$$\begin{equation}
F = 1 - \sum\limits_{i = 1}^n {\pi _i^2} ,
\end{equation}$$
where π i represents the population share of group i and n is the total number of groups. This measure has a minimum of zero, when there is just one group, and a maximum of one. In practice, it is strongly negatively correlated with the share of the largest group.
Esteban and Ray (Reference Esteban and Ray1994) argue that conflict is most likely when the largest group is faced by a substantial minority group. Based on this, Montalvo and Reynal-Querol (Reference Montalvo and Reynal-Querol2005a) uses the following index of ethnic polarization, which is a particular case of the class of indices proposed by Esteban and Ray (Reference Esteban and Ray1994):
 $$\begin{equation}
P = 1 - \sum\limits_{i = 1}^n {4{\pi _i}} {(0.5 - {\pi _i})^2} = 4\sum\limits_{i = 1}^n {\pi _i^2} (1 - {\pi _i}).
\end{equation}$$
$$\begin{equation}
P = 1 - \sum\limits_{i = 1}^n {4{\pi _i}} {(0.5 - {\pi _i})^2} = 4\sum\limits_{i = 1}^n {\pi _i^2} (1 - {\pi _i}).
\end{equation}$$
Polarization reaches a maximum of one when there are just two equally sized groups, and is in practice strongly positively correlated with the share of the second largest group. As shown in Figure 1, polarization diminishes at high levels of fractionalization, and also as the share of the dominant group becomes very large. Polarization and fractionalization are strongly positively correlated when the two largest groups form a large share of the population, but tend to be negatively correlated if the share of the two largest groups is relatively low.Footnote 5
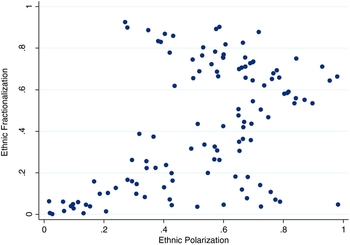
Figure 1. Ethnic fractionalization vs. ethnic polarization.
Table 1 shows the results of estimating a probit model for the incidence of conflict, based on the specification of Bleaney and Dimico (Reference Bleaney and Dimico2011). Models 1 and 2 are identical except that Model 2 includes ethnic polarization in place of ethnic fractionalization.Footnote 6 Both measures have highly significant positive coefficients in the full sample. Then, we divide the sample according to whether ethnic fractionalization is greater than 0.5 (Models 3 and 4) or less than 0.5 (Models 5 and 6). At higher levels of ethnic diversity (Models 3 and 4), neither fractionalization nor polarization is statistically significant, but at lower levels (Models 5 and 6), they are almost as statistically significant as in the full sample. These results dramatically confirm our first hypothesis, that polarization and fractionalization perform similarly in these empirical tests because the correlation is strongest at low levels of ethnic diversity where the two measures are highly positively correlated. In the remainder of the paper, we investigate the apparent statistical insignificance of ethnic variables at higher levels of diversity.
Table 1. Conflict and ethnic diversity (country-year data over the period 1945–2004)

Estimation method: probit. Robust z-statistics in parentheses.
***p < 0.01.
**p < 0.05.
*p < 0.1.
The dependent is a binary variable coded 1 if for any country-year there is conflict and 0 if in such a country-year there is not conflict. Source of data: UCDP/PRIO.
3. Ethnic fractionalization and polarization
The available data sets refer only to polarization (or fractionalization) at the national level. The relationship between this number and local polarization can be complex. Polarization at the local level will depend not just on the national population shares of each ethnic group but also on how geographically concentrated they are. If two large groups are geographically separated, it is possible that polarization could be low at the local level but high at the national level. On the other hand, if ethnic fractionalization (F) is high, in which case polarization (p) is necessarily quite low, there could be quite strongly polarized regions of the country. This is particularly the case as ethnic minorities are often geographically concentrated. For example, suppose that there are 10 groups each representing exactly 10% of the population. Then F = 0.90 and p = 0.36, which is not very high. If, however, these groups are unequally distributed across the country, so that in each region there are only five groups each representing 20% of the population, then local polarization is 0.64 in every region, which implies that the average local polarization is considerably greater than the national polarization (NP) figure.
Thus, the combination of high ethnic fractionalization and an uneven regional distribution of ethnic groups are likely to result in relatively high polarization levels in at least some regions. If polarization at the local as well as the national level increases the incidence of conflict, then high ethnic fractionalization will also tend to be associated with an increased incidence of local conflicts. We test this hypothesis using data on the proportion of the country affected by conflict in any given year.
To investigate the relationship between average local polarization and ethnic fractionalization more formally, consider cases where at least one ethnic group is not represented in any given region. We analyse two possibilities: (1) where the regional population shares are formed from the national population shares by adding the missing group's shares entirely to that of one other group, and (2) where the share of the missing group is redistributed equally among all the represented groups.
In the first case, as shown in the Appendix, the merging of any two groups with shares π i and π j will change polarization by
 $$\begin{equation}
\Delta P = 4{\pi _i}{\pi _j}[2 - 3({\pi _i} + {\pi _j})],
\end{equation}$$
$$\begin{equation}
\Delta P = 4{\pi _i}{\pi _j}[2 - 3({\pi _i} + {\pi _j})],
\end{equation}$$
which is positive if the two groups’ shares sum to less than two-thirds, but negative if they sum to more than two-thirds. Once the number of groups exceeds 3, and if the two largest groups make up less than two-thirds of the population, then all regions will have greater polarization than the national measure. Thus, in this case, it is highly likely that average local polarization exceeds NP when ethnic fractionalization is high.
Table 2 shows some numerical examples where there are n regions and n equally sized groups within the national population, but the groups are regionally concentrated to the extent of each being absent from either one or two regions. It is assumed that the groups that are present within a region are equally represented within the regional population. To take an example, when n = 5 and there are two groups absent from each region, the three groups that are present each make up one-third of the regional population. The table shows that as long as n ≥ 4, so that ethnic fractionalization is relatively high, regional polarization exceeds NP.
Table 2. National and local polarization

Note. It is assumed that a group is evenly distributed across regions where it is represented.
In the second case, it is shown in the Appendix that elimination of group j and redistribution of its share equally among the n remaining groups results in a change of polarization of
 $$\begin{equation}
\Delta P = 4a{m^2}[3F - 1 - a(1 + m + 3{m^2}) + {a^2}m(1 + 3m + 2{m^2})],
\end{equation}$$
$$\begin{equation}
\Delta P = 4a{m^2}[3F - 1 - a(1 + m + 3{m^2}) + {a^2}m(1 + 3m + 2{m^2})],
\end{equation}$$
where m = n −1, a = nπ j and F is the index of ethnic fractionalization defined in equation (1). The parameter a reflects the relative size of the excluded group j (which is equal to the average of the others when a = n/(n+1)). Equation (4) is more likely to be positive when F is high, but it is also negatively related to the size of the eliminated group (a). For a = 1, equation (5) reduces to
 $$\begin{equation}
\Delta P = 4{m^2}(3F - 2 + 2{m^3}).
\end{equation}$$
$$\begin{equation}
\Delta P = 4{m^2}(3F - 2 + 2{m^3}).
\end{equation}$$
This is always satisfied if F > ⅔, which is likely if n ≥ 3 and the largest group's share is less than 50%. Thus, when regional shares are constructed by setting one group's share to zero and adding the remainder equally to all the other groups’ national shares, average local polarization will exceed NP when F is high.
On the other hand, if there are only two groups (so F ≤ 0.50), deviations of regional population shares from the national population shares imply that the population-weighted average of regional polarization is below the national figure, although regional polarization will be greater than the national figure in some regions.Footnote 7
In the absence of regional data on ethnic composition, we capture this effect by using ethnic fractionalization as a proxy for the difference between average regional polarization (LP) and NP. As Table 2 suggests, this deviation tends to be negative when F is low and positive when F is high.
We hypothesize that the incidence of conflict is increasing in NP and in LP, but that the proportion of the country affected is decreasing in LP, for given NP, because if NP is low, some regions may be very unpolarized, or have ethnic composition very different from those where there is conflict, and so remain unaffected. Thus we expect the extent of conflict to be negatively related to the degree of ethnic fractionalization.
4. Regional concentration of minority groups
The MAR Project was initiated by Ted Gurr and is based at the University of Maryland's Center for International Development and Conflict Management (CIDCM). It ‘tracks politically-active ethnic groups throughout the world from 1945 to the present. identifying where they are, what they do, and what happens to them. MAR focuses specifically on ethnopolitical groups, non-state communal groups that have “political significance” in the contemporary world because of their status and political actions’. Political significance is determined by the following two criteria:
-
(1) The group collectively suffers, or benefits from, systematic discriminatory treatment vis-a-vis other groups in a society.
-
(2) The group is the basis for political mobilization and collective action in defense or promotion of its self-defined interests (MAR Codebook, pg 1).
This source provides information on geographical concentration of minority groups (by administrative region), and also for 1985 onwards the extent to which each group was involved in rebellious activity. The MAR data define minorities as either (1) widely geographically dispersed, (2) unevenly distributed with less than 50% in any one administrative region, (3) concentrated with between 50% and 75% in one region, or (4) highly concentrated with more than 75% in one region. Table 3 uses MAR data to show that in 83 cases out of 113, the second largest population group is at least 50% concentrated in one administrative region (and in 45 cases the population is more than 75% concentrated in one region).Footnote 8 These figures are not distorted by cases where the population of the second largest group is small — in fact concentration is more likely when the population share is larger, as is shown by the figures for mean population share. For example, the mean shares of the second group are 0.2 and 0.19, respectively, for the 83 countries in which either the majority of the population or the total share of the population of groups is concentrated in one region, but below 0.19 and 0.13 if the population is defined as widely dispersed or primarily urban, but otherwise dispersed. A similar pattern is evident in the case of the third and fourth largest groups. Out of all the minorities in the data set, 74.7% have at least 50% of their population concentrated in one administrative region of the country.
Table 3. Minority groups’ population share by regional concentration in 2000

In Tables 4 and 5, as an example, we show the level of regional concentration of groups for four highly fractionalized countries (Ghana, Nigeria, Angola, and Ethiopia), and for four highly polarized countries (Burundi, Rwanda, Latvia, and Estonia), respectively. Table 4 shows that groups in highly fractionalized countries are likely to be concentrated in one region. On the other hand, Table 5 shows that groups in highly polarized countries tend to be highly dispersed.
Table 4. Concentration of minority groups for selected fractionalized countries (1985–2005)

Table 5. Concentration of minority groups for selected polarized countries (1985–2005)

In Table 6, we provide evidence of the relationship between national ethnic diversity and regional concentration of minorities. In Model 1, the dependent variable is the degree of regional concentration of the group as specified above. The regressors are the national ethnic fractionalization index and dummies for different regions of the world. Only ethnic fractionalization is statistically significant (at the 1% level), and its coefficient is positive. In Model 2, we replace ethnic fractionalization with ethnic polarization and the coefficient is insignificant. In Model 3, we finally replace indices of fractionalization and polarization with population shares of the largest and second largest groups. Regional concentration of minorities is higher when the shares of the two largest groups are smaller. These results imply that, when ethnic fractionalization is relatively high, local polarization may be considerable even if the NP index is relatively low.
Table 6. Regional concentration of groups and ethnic fractionalization in 2000 (cross minority group data)

The dependent variable is coded GROUPCON in the MARGen data set. It takes the value 0, 1, 2, or 3, with 3 representing the highest level of concentration. Robust t-statistics in parentheses ***p < 0.01, **p < 0.05, *p < 0.1.
5. Regional concentration and extent of conflict
In this Section, we turn to the relationship between regional concentration of minority groups and extent of conflicts. Table 7 provides data on the scale of the rebellion by each minority group in a given year, from the same source. There are only 1,258 episodes in which a group is involved in a rebellion. Out of these 1,258 episodes, there are 579 observations in which the rebellion is quite local (political banditry, campaign of terrorism, and local rebellion). In 170 episodes, there has been civil war, and in 112 episodes there has been large-scale guerrilla activity. Finally, there are also 395 episodes in which the scale of the guerrilla activity is either intermediate or small.Footnote 9 The data fit particularly well with our analysis given that these categories are also coded taking into consideration the geographical extent of the conflict. For example, a local rebellion is defined as an armed attempt to seize power in a locale. Small-scale guerrilla activity is coded if there are (1) fewer than 1,000 armed fighters, (2) sporadic armed attacks (less than six reported per year), or (3) attacks in a small part of the area occupied by the group, or in one or two other locales. On the other hand, large-scale guerrilla activity is coded if there are (1) more than 1,000 armed fighters, (2) frequent armed attacks (more than six per year), or (3) attacks affecting a large part of the area occupied by the group. A civil war affects the entire country.
Table 7. Severity of rebellion by minority groups

In order to test whether greater regional concentration of minority groups is associated with a higher probability of conflict and whether these conflicts are more likely to be of limited extent, we estimate a two-stage Heckman model where at the selection stage (Panel B) the dependent variable is a minority group's involvement in rebellion, and at the outcome stage (Panel A), the dependent variable is a measure of the scale of the rebellion (1 = political banditry up to local rebellions, 2 = guerrilla activity of any scale, 3 = civil war). As a measure of local distribution of the group, we rescale the variable for the regional concentration of groups from the MARGen dataset on a 0–1 basis. As a result, the variable is zero if the group is geographically dispersed, and one if at least a minority of less than 50% of the population is concentrated in one region.Footnote 10 We also enter a full set of explanatory variables which includes national population (in logs), national GDP per capita (in log), dummies for anocracy, new independent states, and political instability, which Sambanis (Reference Sambanis2004) finds to be significant predictors of conflict; controls for oil dependency from Fearon and Laitin (Reference Fearon and Laitin2003), alluvial diamond mines as in Lujala et al. (Reference Lujala, Gleditsch and Gilmore2005), and the relevant minority group's population share from the MAR project. Year dummies are also used to capture changes in the probability of conflict over time (i.e. after the cold war).Footnote 11 The Heckman procedure controls for the sample selection bias (Heckman, Reference Heckman1979) related to the extent of conflict, given that the latter is only observed for countries/groups which experience a conflict. By controlling for the correlation between unobservable in the selection equation (probability of conflict) with unobservable in the outcome equation (extent of conflict), the Heckman estimator controls for such a sample selection bias. Indeed, suppose that a conflict tends to have a smaller extent in countries which are more prone to conflict (i.e. countries which have experienced conflicts for longer periods like Sri-Lanka and Ethiopia) and that this is in some way correlated with the distribution of groups. Then, if we do not control for this correlation between probability and extent of conflict, there is a risk of over-estimating the extent of conflict. Practically, the distribution of groups will capture the correlation between distribution of groups and conflict rather than the correlation between distribution of groups and extent of conflict.
Results are shown in Table 8 for three alternative exclusion restrictions (variables that appear in the selection equation only): (1) a measure of the average level of precipitation (Model 1) which according to Miguel et al. (Reference Miguel, Satyanath and Sergenti2004) affects conflict only through GDP growth and more specifically through commodity shocks (Ciccone, Reference Ciccone2011), (2) a measure of the share of population in the tropical area (Model 2) from Sachs (Reference Sachs2003) given that environment disease factors affect institutions (Acemoglu et al., Reference Acemoglu, Johnson and Robinson2002) and therefore the probability of conflict through state capability (Fearon and Laitin, Reference Fearon and Laitin2003), (3) a dummy for pre-colonial origin (Model 3) which records whether the group has been living in the current region (area) since the 18th century (before colonization).Footnote 12 Even though variables above represent plausible exclusion restrictions, the potential non-excludability of these variables should bias results toward zero, given the negative correlation between the probability and the extent of conflict. Therefore, in the worst case scenario, there may be a downward bias (biased toward zero) of the variable of interest.
Table 8. Severity of rebellion by minority groups – two-step heckman estimator (minority group year data over the period 1985–2005)

The dependent variable in Panel A is the severity of the rebellion recoded as 1 = political banditry up to local rebellions; 2 = guerrilla activity of any scale; 3 = civil war (see page 15). The dependent variable in Panel B is a dichotomous variable for whether such a group-year is involved in a conflict. Source: MARGen data set.
Robust z-statistics in parentheses: ***p < 0.01, **p < 0.05, *p < 0.1
In Table 8, the inverse Mills ratio is significant for two out of three models and as argued above the negative coefficient captures the negative relationship between extent and probability of conflict. In Model 1, the variable for the regional concentration of groups is significant at the 1% level with positive coefficients in the selection equation, indicating that even with a moderate degree of regional concentration rebellion is more frequent. In the outcome equation for Model 1, the concentration dummy has a significant negative coefficient, indicating that with greater concentration rebellions are more localized. In Model 2, we replace precipitation with the share of the population in tropical area as an exclusion restriction and results are quite similar. The concentration dummy increases the probability of conflict but has a negative effect on the extent of rebellion though the effect is not significant due to the fact that the mills ratio is also not significant causing problems of sample selection bias. Finally, in Model 3, we use the pre-colonial origins of the group as an exclusion restriction and results still hold with the dummy for regional concentration having a significant positive effect on the probability of conflict and a negative effect on the severity of rebellion.
The message of these results is, therefore, that more regionally concentrated minorities tend to engage in rebellions, and also that these rebellions are likely to be localized. This is consistent with our hypothesis about the importance of local polarization, which is likely to come about in ethnically fractionalized countries when groups are regionally concentrated. These results are also consistent with Toft's (Reference Toft2003) analysis of the impact of settlement patterns (i.e., regional concentration of groups) on the probability of ethnic violence when she argues that regional concentration of groups is likely to increase the probability of ethnic violence because of the higher capability related to the ability to mobilize fighters. She does not fully explore the impact of the distribution of groups on the extent of conflict. However her idea that groups concentrated in a historical homeland are more likely to be involved in conflict because of demands for independence seems consistent with our analysis related to the extent of conflict.
In Table 9, we show marginal effects for the concentration variable in Model 3 above. For groups which are regionally concentrated the probability of a local rebellion increases by almost 27.5%. However, the probability of guerrilla and civil war for groups that are regionally concentrated decreases by almost 6.5% and 21%, respectively. Therefore, the regional concentration of groups (which we use as a proxy of local polarization) on the one hand increases the probability of localized conflicts (local rebellion) and on the other hand, decreases the probability of more widespread conflicts (i.e. guerrilla or civil war) which seems to be in line with our predictions
Table 9. Marginal effects

6. Conclusions
The relationship between ethnic diversity and conflict is still a matter of debate. In this paper, we have first of all shown that this is because the relationship is far stronger at relatively low levels of diversity, where the two measures are so highly correlated as to be virtually indistinguishable. Then, we have offered an explanation for the weakness of the relationship at higher levels of diversity.
Our central point is that minorities tend not to be evenly distributed across the country, so there can be a big difference between regional and national measures of diversity. Our theory is that what matters is polarization, either at the national or the local level. Because the regional distribution of ethnic groups within a country can be very uneven, an ethnically fractionalized country may be quite polarized in some localities, even if its NP measure is not particularly high. Because of this, it may be difficult to pick up a relationship between conflict and NP measures at the more ethnically diverse end of the spectrum. The data strongly support this hypothesis: There is a strong correlation between the probability of conflict and either measure of ethnic diversity up to a measure of fractionalization of 0.5, but none at all above that level.
Using information on the geographical concentration of minorities and their involvement in rebellious activity from the data set of the Minorities at Risk Project, we find (a) that in ethnically fractionalized countries minority groups are more likely to be regionally concentrated, implying pockets of local polarization; and (b) that minorities whose populations are geographically concentrated are more likely to be involved in rebellious activity, although this activity is also more likely to be small-scale and local. This evidence on minority groups’ involvement in rebellion is consistent with the hypothesis that polarization at the local level makes local conflict more likely. The association between high ethnic fractionalization and significant polarization at the regional level explains why conflict is more likely in these cases than would be predicted on the basis of a relatively low level of NP.
Appendix 1
To investigate the relationship between average local polarization and ethnic fractionalization in the presence of regional concentration of groups more formally, consider cases where at least one ethnic group is not represented in any given region. We analyse two possibilities: (1) where the regional population shares are formed from the national population shares by adding the missing group's share entirely to that of one other group (which is equivalent to the merging of two groups), and (2) where the share of the missing group is redistributed equally amongst all the represented groups.
(1) Merging of two groups
If groups i and j merge, then from equation (2) the change in the polarization index is:
 $$\begin{equation}
\Delta P = 4[{({\pi _i} + {\pi _j})^2}(1 - {\pi _i} - {\pi _j}) - \pi _i^2(1 - {\pi _i}) - \pi _j^2(1 - {\pi _j})]\;{\rm{ = 4}}{\pi _{\rm{i}}}{\pi _{\rm{i}}}{\rm{[2 - 3(}}{\pi _{\rm{i}}}{\rm{ + }}{\pi _{\rm{i}}}{\rm{)]}}
\end{equation}$$
$$\begin{equation}
\Delta P = 4[{({\pi _i} + {\pi _j})^2}(1 - {\pi _i} - {\pi _j}) - \pi _i^2(1 - {\pi _i}) - \pi _j^2(1 - {\pi _j})]\;{\rm{ = 4}}{\pi _{\rm{i}}}{\pi _{\rm{i}}}{\rm{[2 - 3(}}{\pi _{\rm{i}}}{\rm{ + }}{\pi _{\rm{i}}}{\rm{)]}}
\end{equation}$$
This expression is positive if the two groups’ shares sum to less than two-thirds, but negative if they sum to more than two-thirds. Thus regional concentration of groups tends to increase local polarization up to the point where the merged group reaches a two-thirds majority locally. In particular, once the number of groups exceeds three, and if the two largest groups make up less than two-thirds of the population, then all regions will have greater polarization than the national measure. Note that this case of more than three groups with the two largest groups’ shares representing less than two-thirds implies a high degree of ethnic fractionalization.
Table A1. Descriptive statistics

(2) Elimination of one group with its share equally divided between the remaining groups
In the second case (the elimination of group j and redistribution of its share equally amongst the n remaining groups), the algebra is more involved. Let the eliminated group be group 1, and let there be n other groups.
Writing m = 1/n, then
 $$\begin{equation}
\Delta P = 4\sum\limits_{i = 2}^{n + 1} {[{{({\pi _i} + m{\pi _1})}^2}(1 - {\pi _i} - m{\pi _1})} - \pi _i^2(1 - {\pi _i})] - 4\pi _1^2(1 - {\pi _1})
\end{equation}$$
$$\begin{equation}
\Delta P = 4\sum\limits_{i = 2}^{n + 1} {[{{({\pi _i} + m{\pi _1})}^2}(1 - {\pi _i} - m{\pi _1})} - \pi _i^2(1 - {\pi _i})] - 4\pi _1^2(1 - {\pi _1})
\end{equation}$$
Expanding this gives
 $$\begin{equation}
\Delta P = 4\sum\limits_{i = 2}^{n + 1} {(2m{\pi _i}{\pi _1} - 3m\pi _i^2{\pi _1} - 3{m^2}{\pi _i}\pi _1^2 + {m^2}\pi _1^2 - {m^3}\pi _1^3)} - 4\pi _1^2(1 - {\pi _1})
\end{equation}$$
$$\begin{equation}
\Delta P = 4\sum\limits_{i = 2}^{n + 1} {(2m{\pi _i}{\pi _1} - 3m\pi _i^2{\pi _1} - 3{m^2}{\pi _i}\pi _1^2 + {m^2}\pi _1^2 - {m^3}\pi _1^3)} - 4\pi _1^2(1 - {\pi _1})
\end{equation}$$
Substituting
 $$\begin{equation*}
\sum\limits_{i = 2}^{n + 1} {1 = 1/m,\sum\limits_{i = 2}^{n + 1} {{\pi _i}} } = 1 - {\pi _1},\sum\limits_{i = 2}^{n + 1} {\pi _i^2} = 1 - F - \pi _1^2,
\end{equation*}$$
$$\begin{equation*}
\sum\limits_{i = 2}^{n + 1} {1 = 1/m,\sum\limits_{i = 2}^{n + 1} {{\pi _i}} } = 1 - {\pi _1},\sum\limits_{i = 2}^{n + 1} {\pi _i^2} = 1 - F - \pi _1^2,
\end{equation*}$$
we obtain
 $$\begin{equation}
\Delta P = 4m{\pi _1}(3F - 1) - 4(1 + m + 3{m^2})\pi _1^2 + 4(1 + 3m + 2{m^2})\pi _1^3
\end{equation}$$
$$\begin{equation}
\Delta P = 4m{\pi _1}(3F - 1) - 4(1 + m + 3{m^2})\pi _1^2 + 4(1 + 3m + 2{m^2})\pi _1^3
\end{equation}$$
Substituting < tex − math/> yields the following expression:
 $$\begin{equation}
\Delta P = 4a{m^2}[3F - 1 - a(1 + m + 3{m^2}) + {a^2}m(1 + 3m + 2{m^2})]
\end{equation}$$
$$\begin{equation}
\Delta P = 4a{m^2}[3F - 1 - a(1 + m + 3{m^2}) + {a^2}m(1 + 3m + 2{m^2})]
\end{equation}$$
where m = n −1, a = nπ j and F is the index of ethnic fractionalization as defined in equation (1) before the elimination of group 1. The parameter a reflects the relative size of the excluded group j (which is equal to the average of the others when a = n/(n+1)). Equation (A5) is more likely to be positive when F is high, but it is also negatively related to the size of the eliminated group (a). For a=1, equation (A5) reduces to
 $$\begin{equation}
\Delta P = 4{m^2}(3F - 2 + 2{m^3}).
\end{equation}$$
$$\begin{equation}
\Delta P = 4{m^2}(3F - 2 + 2{m^3}).
\end{equation}$$
This is always satisfied if F > ⅔, which is likely if n ≥ 3 and the largest group's share is less than 50%. Thus, when regional shares are constructed by setting one group's share to zero and adding the remainder equally to all the other groups’ national shares, average local polarization will exceed NP when F is high.
Appendix 2: Descriptive statistics, variables and sources of data
Group Concentration, Extent and Incidence of Conflict: Minority at Risk Dataset
Ethnic Fractionalization, Largest Ethnic Group, Second Largest Group, Mountainous Terrain, the Ratio of Oil Export to Manufacturer Exports: Fearon and Laitin (Reference Fearon and Laitin2003). Fearon and Laitin (Reference Fearon and Laitin2003) provide data on oil exports for the period 1945–1999. We use data from the Energy International Administration to calculate the ratio of oil exports to merchandise exports for the period 2000–2003.
GDP per Capita and Population: Penn World Table 6.2.
Alluvial diamonds: Lujala et al. (Reference Lujala, Gleditsch and Gilmore2005).
Ethnic Polarization: Montalvo and Reynal-Querol (Reference Montalvo and Reynal-Querol2005a). The polarization data are not available for all countries, so we impute the missing numbers using data on the share of the second largest group provided by FL. The correlation between polarization and the share of the second largest group is 0.77.
Regional Concentration and Rebellious Activity of Minority Groups: Minority at Risk Project (MAR).
Democracy: Marshall and Jaggers (Reference Marshall and Jaggers2002). We use a dummy which is equal one if the Polity2 index is above zero in order to capture whether a country is democratic or not, and the Polity2 index in order to control for the extent of democracy.


