


Non-technical Summary
Bryozoans (also known as colonial moss animals) filter plankton from ocean water for their food. They struggle with refiltering the same water repeatedly. They have evolved bumps on their colony surfaces to solve this problem. We think the height and spacing of these bumps should be inversely proportional to how curved the colony surface is. We test this idea using 285 million year old fossil bryozoans from Greenland and Australia. We show that the bumps are larger and closer on less-curved colonies as we predicted.
Introduction
One of the challenges for filter feeding animals is how to maximize feeding by minimizing refiltering previously filtered water (Hentschel and Shimeta, Reference Hentschel, Shimeta, Jørgensen and Fath2008). This is less of a problem for motile filter feeders (e.g., whale sharks or flamingos; Colman, Reference Colman1997; Anderson, Reference Anderson2017) than for sessile ones. Bryozoans are sessile filter feeders whose ciliated tentacles of their lophophore create a feeding current that draws plankton toward their mouth (Pratt, Reference Pratt2004, fig. 2; Winston and Migotto, Reference Winston, Migotto and Schwaha2021, fig. 6.4). This creates two problems for bryozoans. First, the filtered water accumulates between the canopy of tentacles and the colony surface causing a pressure buildup that stifles feeding (Shunatova and Ostrovsky, Reference Shunatova and Ostrovsky2002, figs. 4, 5). Second, previously filtered water gets refiltered in eddies (Grünbaum, Reference Grünbaum1995, fig. 6a; Pratt, Reference Pratt2004, fig. 7A(i)). Bryozoans overcome this problem by creating colony-wide feeding currents that keep the incurrent unfiltered water separate from the excurrent of previously filtered water, thus reducing refiltering of water and improving feeding efficiency (Banta et al., Reference Banta, McKinney and Zimmer1974; Cook, Reference Cook1977; Winston, Reference Winston1978, Reference Winston, Larwood and Abbott1979; Taylor, Reference Taylor1979; Lidgard, Reference Lidgard, Larwood and Nielsen1981; Dick, Reference Dick and Ross1987; Eckman and Okamura, Reference Eckman and Okamura1998; Pratt, Reference Pratt2004; von Dassow, Reference von Dassow2005a). The same phenomenon has also evolved in sponges (Bidder, Reference Bidder1923) and colonial ascidians (Vogel, Reference Vogel1994).
Empirical data and mathematical modeling of water flow in encrusting bryozoan colonies have shown that currents created by individual zooids may interact deleteriously (Bishop and Bahr, Reference Bishop, Bahr, Boardman, Cheetham and Oliver1973; Thorpe and Ryland, Reference Thorpe, Ryland and Ross1987; Grünbaum, Reference Grünbaum1995). This suggests colony-wide feeding currents are beneficial to the colony at least in low current velocities where flow remains laminar (Grünbaum, Reference Grünbaum1997; Eckman and Okamura, Reference Eckman and Okamura1998). The filtered water typically flows between the canopy of tentacles and the colony surface toward macular chimneys through which the previously filtered water is ejected away from the colony surface (McKinney, Reference McKinney1986a, fig. 4A; Taylor, Reference Taylor and Savazzi1999, fig. 41.3; Okamura and Partridge, Reference Okamura and Partridge2009, fig. 3). Macular chimneys typically form on flat or more often elevated parts of a colony called monticules (Banta et al., Reference Banta, McKinney and Zimmer1974, fig. 1; Winston, Reference Winston2010, fig. 2).
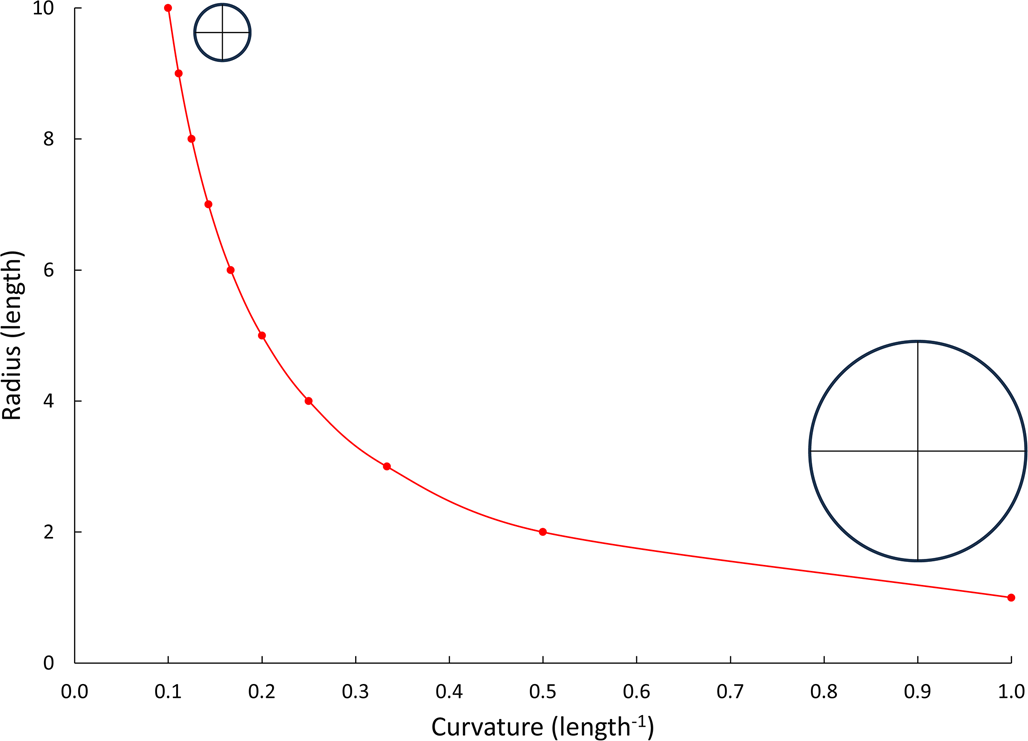
The bigger and flatter the colony surface, the greater the problem with refiltering water due to the greater incurrent volume (McKinney, Reference McKinney1986a, Reference McKinneyb). McKinney (Reference McKinney1986b) showed that in cylindrical colonies, macular chimneys form only in branches >2 mm diameter. That is because the surfaces of smaller-diameter cylinders are curved enough that the previously filtered water can escape between the lophophores. Larger-diameter cylinders have less surface curvature (Fig. 1). That is why the surface of our large spherical planet seems flat when standing on it. Branches on the largest bryozoan colonies are not cylindrical but frondose (Cuffey and Fine, Reference Cuffey and Fine2006). Frondose branches are typically more elliptical in cross section, for example, Heterotrypa frondosa (d'Orbigny, Reference d'Orbigny1850). Curvature varies across a frondose branch unlike a cylindrical branch.
Geometric relationship between cylinder radius and curvature of the cylinder's surface. Insets show transverse sections through endmember cylindrical branches.
Mathematics of curvature
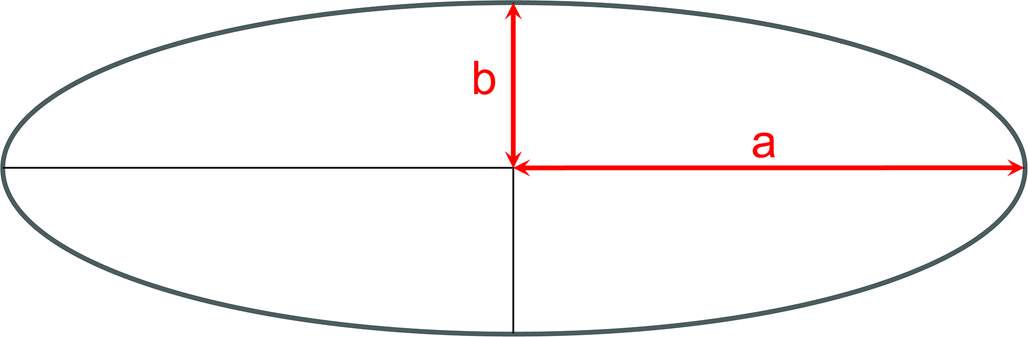
In cylindrical branches, the transverse section is a circle, so all the radii are equal. In frondose branches, the transverse section is an ellipse with two axes of unequal lengths. The equation for an ellipse is
 $$\displaystyle{{{\rm x}^2} \over {{\rm a}^2}} \,+\, \displaystyle{{{\rm y}^2} \over {{\rm b}^2}} = 1$$
where x and y are coordinates (x, y) of any point on the ellipse, and a is the length of the semi-major axis, and b is the length of the semi-minor axis (Fig. 2).
Geometry of an ellipse showing the semi-major (a) and semi-minor (b) axes.
One measures the “flatness” of the surface of an ellipse by its curvature (K) (Lebedeva et al., Reference Lebedeva, Sak and Brantley2015: p. 91, eq. 9).
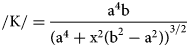 $$/{\rm K}/ = \displaystyle{{{\rm a}^ 4{\rm b}} \over {{( {\rm a}^4 + {\rm x}^2( {\rm b}^2-{\rm a}^2) ) }^{3/2}}}$$
If we measure curvature at top center of the ellipse at point (x, y), then (x, y) becomes (0, b) and curvature reduces to:
 $$/{\rm K}/{ = } \displaystyle{{\rm b} \over {{\rm a}^2}}$$
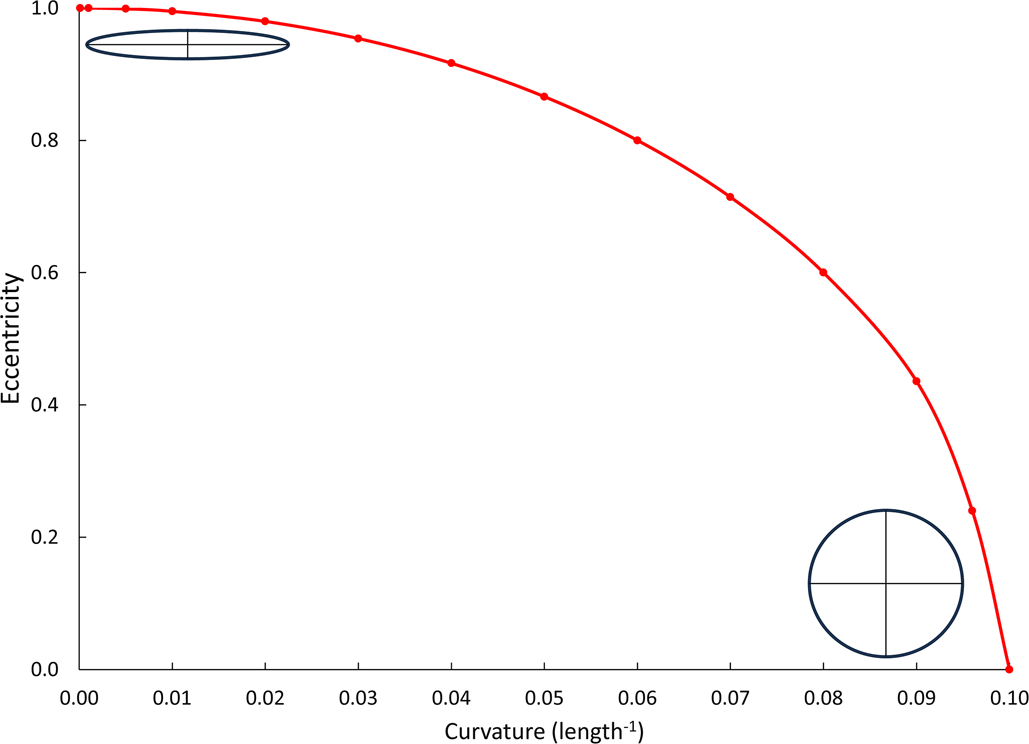
As a result, curvature across an elliptical branch decreases with increasing eccentricity (Fig. 3).
Graph showing how curvature across an elliptical branch decreases with increasing eccentricity. Insets show transverse sections through endmember elliptical branches.
The goal of this study is to see how branch surface curvature affects monticule height and spacing using two Permian stenolaemate bryozoans, both with blade-like monticulate branches with varying cross-sectional shape and size. Our hypothesis is that the curvature of the colony surface is inversely proportional to both the height and spatial density of monticules.
Materials and geologic setting
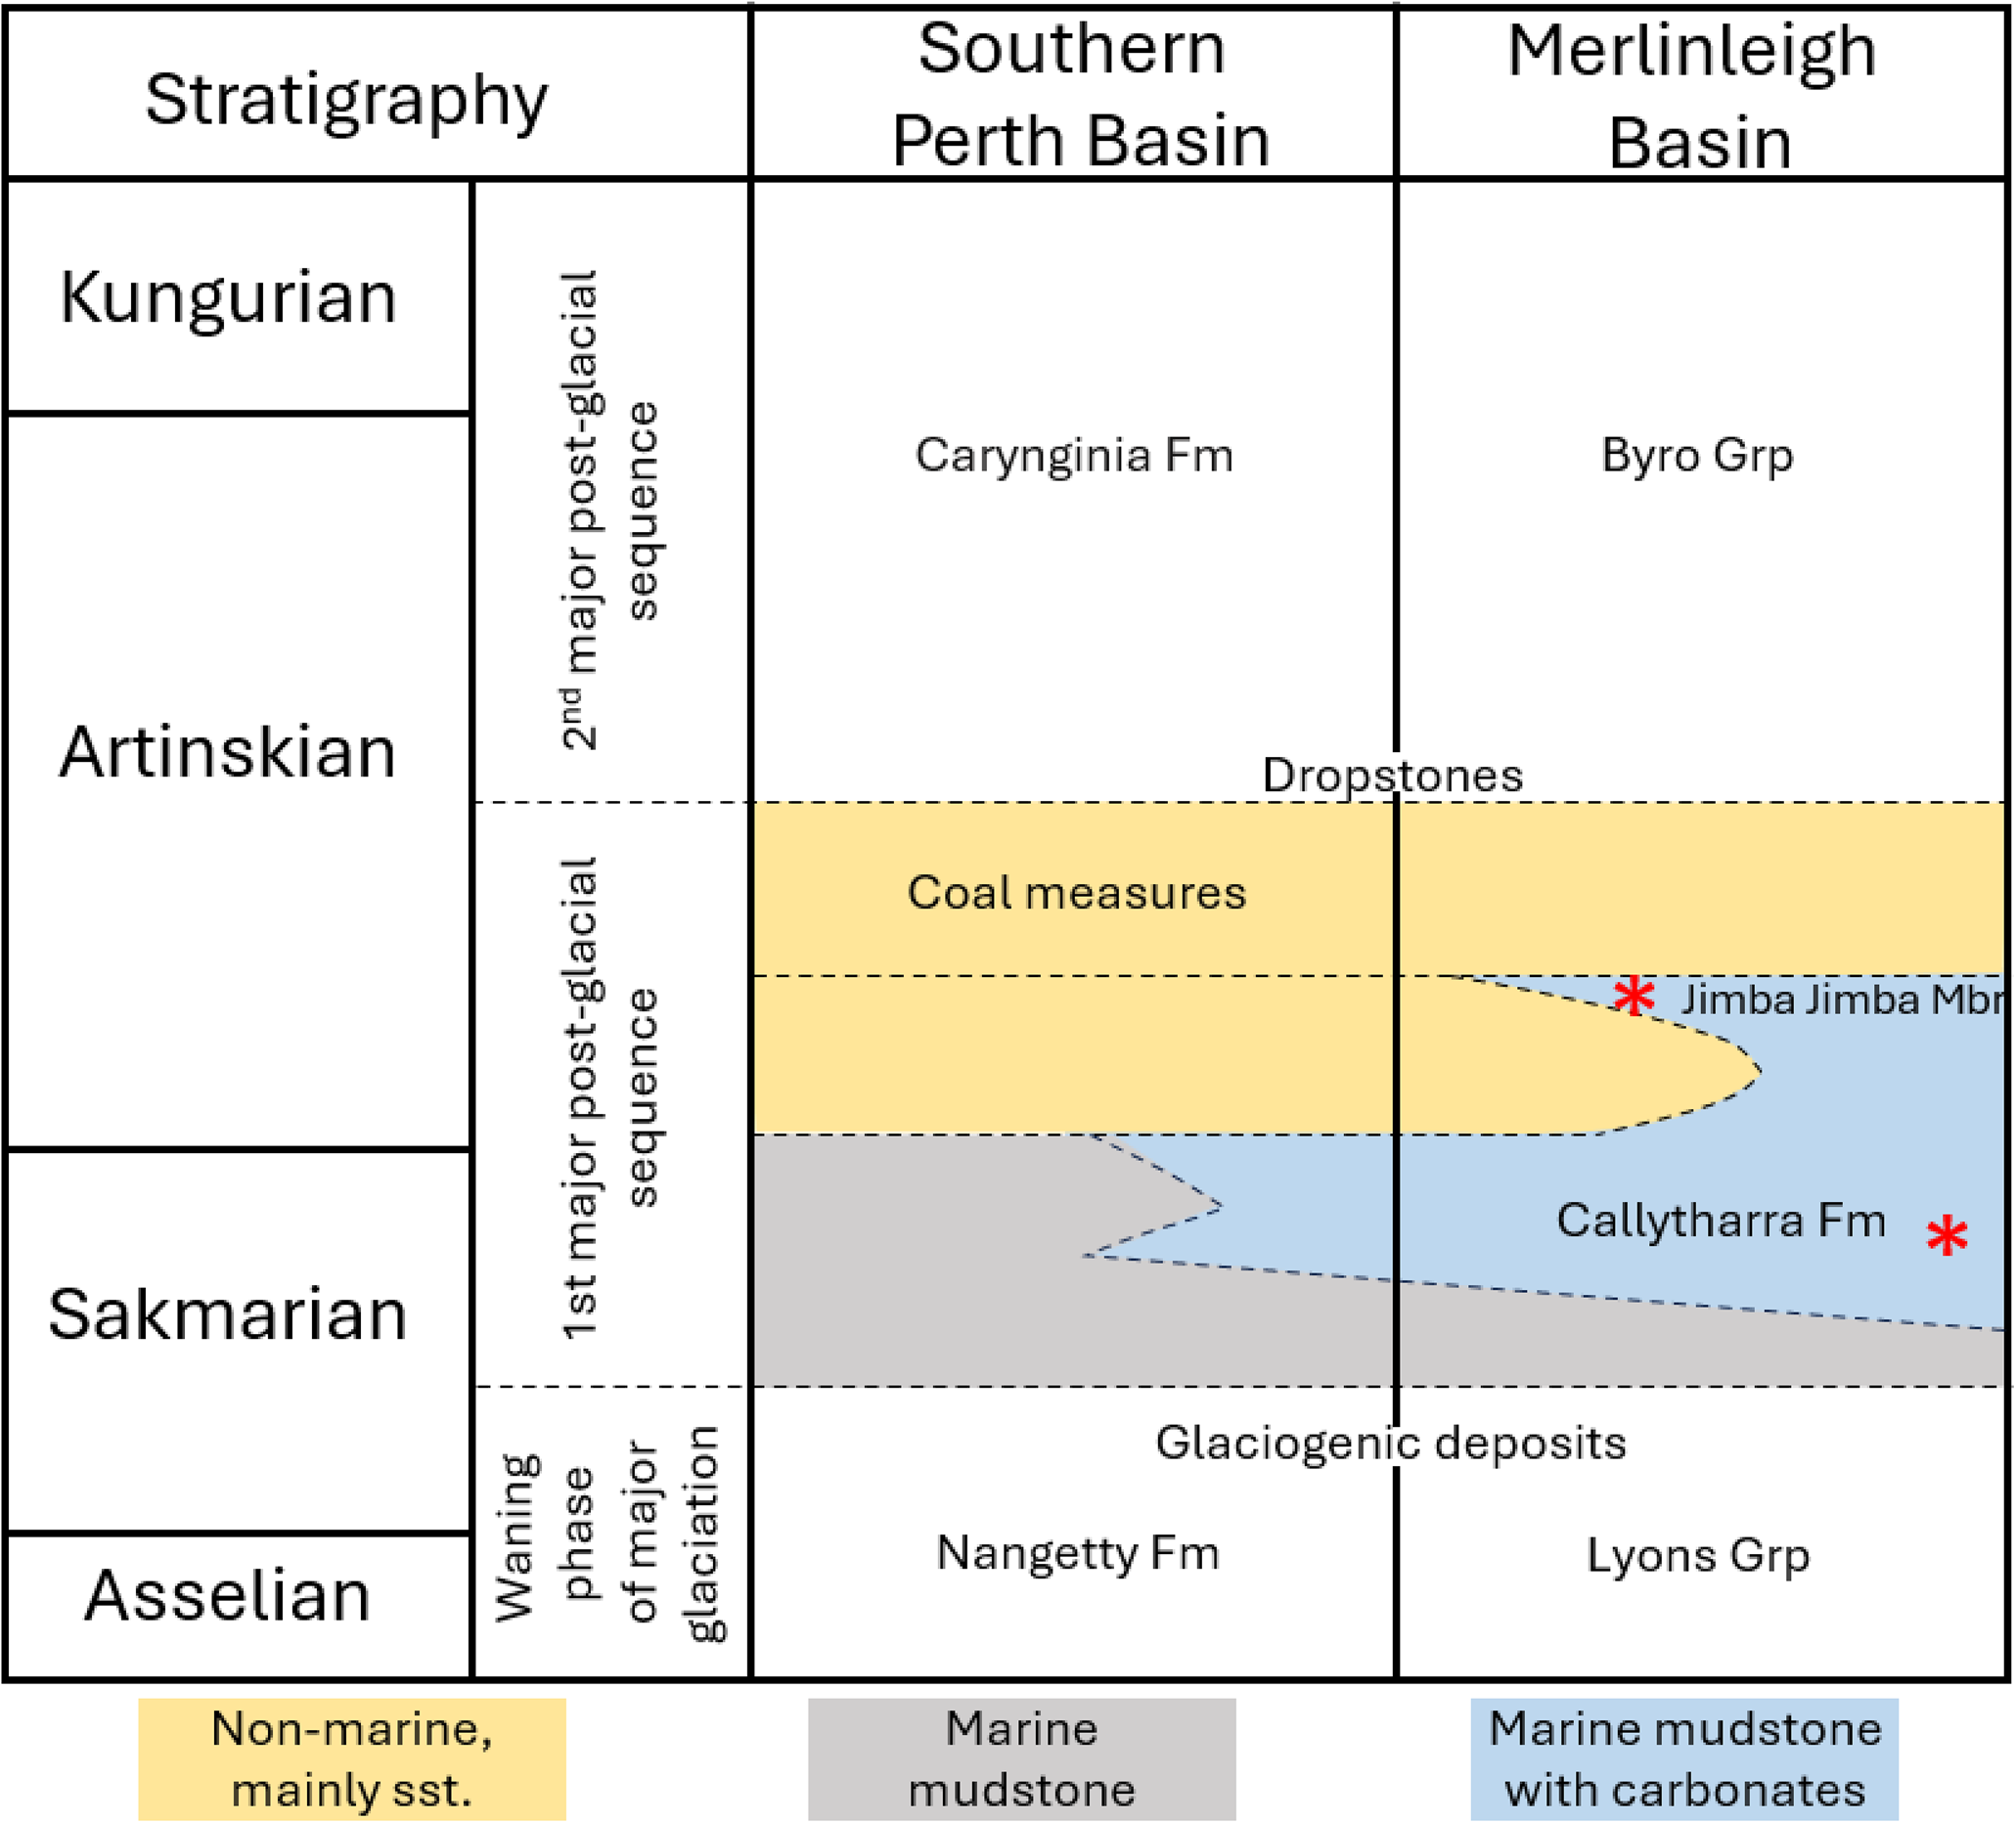
This study is based on colonies of two species of Permian stenolaemate bryozoans. Evactinostella crucialis (Hudleston, Reference Hudleston1883) is a cystoporate stenolaemate bryozoan (Yancey et al., Reference Yancey, Wyse Jackson, Sutton and Gottfried2019). This species forms erect four-vaned colonies (Håkansson et al., Reference Håkansson, Key and Ernst2016). The bifoliate vertical vanes are very elliptical in cross section, up to 1 cm thick, less than 10 cm wide, with heights reaching more than 25 cm (Crockford, Reference Crockford1957). For this study, 17 colonies of E. crucialis were selected from Cisuralian strata in the East Gondwana Rift Zone in Western Australia. Of these, four specimens were selected from the Jimba Jimba Member of the Callytharra Formation exposed northwest of Jimba Jimba Station at 25.0239°S, 115.0717°E, and 13 colonies were selected from the Callytharra Formation exposed in the Lyndon River gully at 23.8600°S, 114.4792°E (Fig. 4). Both sections are in the Merlingleigh Subbasin at the southern end of the onshore Southern Carnarvon Basin, Western Australia (Haig et al., Reference Haig, McCartain, Mory, Borges and Davydov2014) (Fig. 5). Specimen numbers and collection information are available in Table 1. Stratigraphically following the International Chronostratigraphic Chart v2023/09, these colonies lived during the Artinskian Age of the Cisuralian Epoch of the Permian Period (Haig et al., Reference Haig, McCartain, Mory, Borges and Davydov2014; Henderson et al., Reference Henderson, Shen, Gradstein, Agterberg, Gradstein, Ogg, Schmitz and Ogg2020). Paleogeographically, they were deposited toward the southernmost marine strata in the East Gondwana Rift Zone at ~50°S paleolatitude (van Hinsbergen et al., Reference van Hinsbergen, de Groot, van Schaik, Spakman, Bijl, Sluijs, Langereis and Brinkhuis2015; Haig et al., Reference Haig, Mory, McCartain, Backhouse and Håkansson2017).
Sequence stratigraphy of the first major post-glacial sequence in the Merlinleigh and Southern Perth basins (simplified from Haig et al., Reference Haig, McCartain, Mory, Borges and Davydov2014). The positions of the two Evactinostella crucialis (Hudleston, Reference Hudleston1883) populations in this study are indicated by red asterisks.
(1) Early Permian paleogeographic map of Western Australia. The main position of the fluctuating marine/terrestrial fluvial depositional boundary indicated by blue line. (2) Sediment isopach map relative to the positions of the two Evactinostella crucialis (Hudleston, Reference Hudleston1883) populations investigated indicated by red asterisks: Lyndon River to the north and Jimba Jimba Station to the south. The distance between the two sample sites is approximately 220 km. Modified from Mory and Haines (Reference Mory, Haines, Moss and Keep2015, fig. 11a).

Sample, locality, and stratigraphic information for colonies of Evactinostella crucialis (Hudleston, Reference Hudleston1883) used in this study from the Merlingleigh Subbasin at the southern end of the onshore Southern Carnarvon Basin, Western Australia.

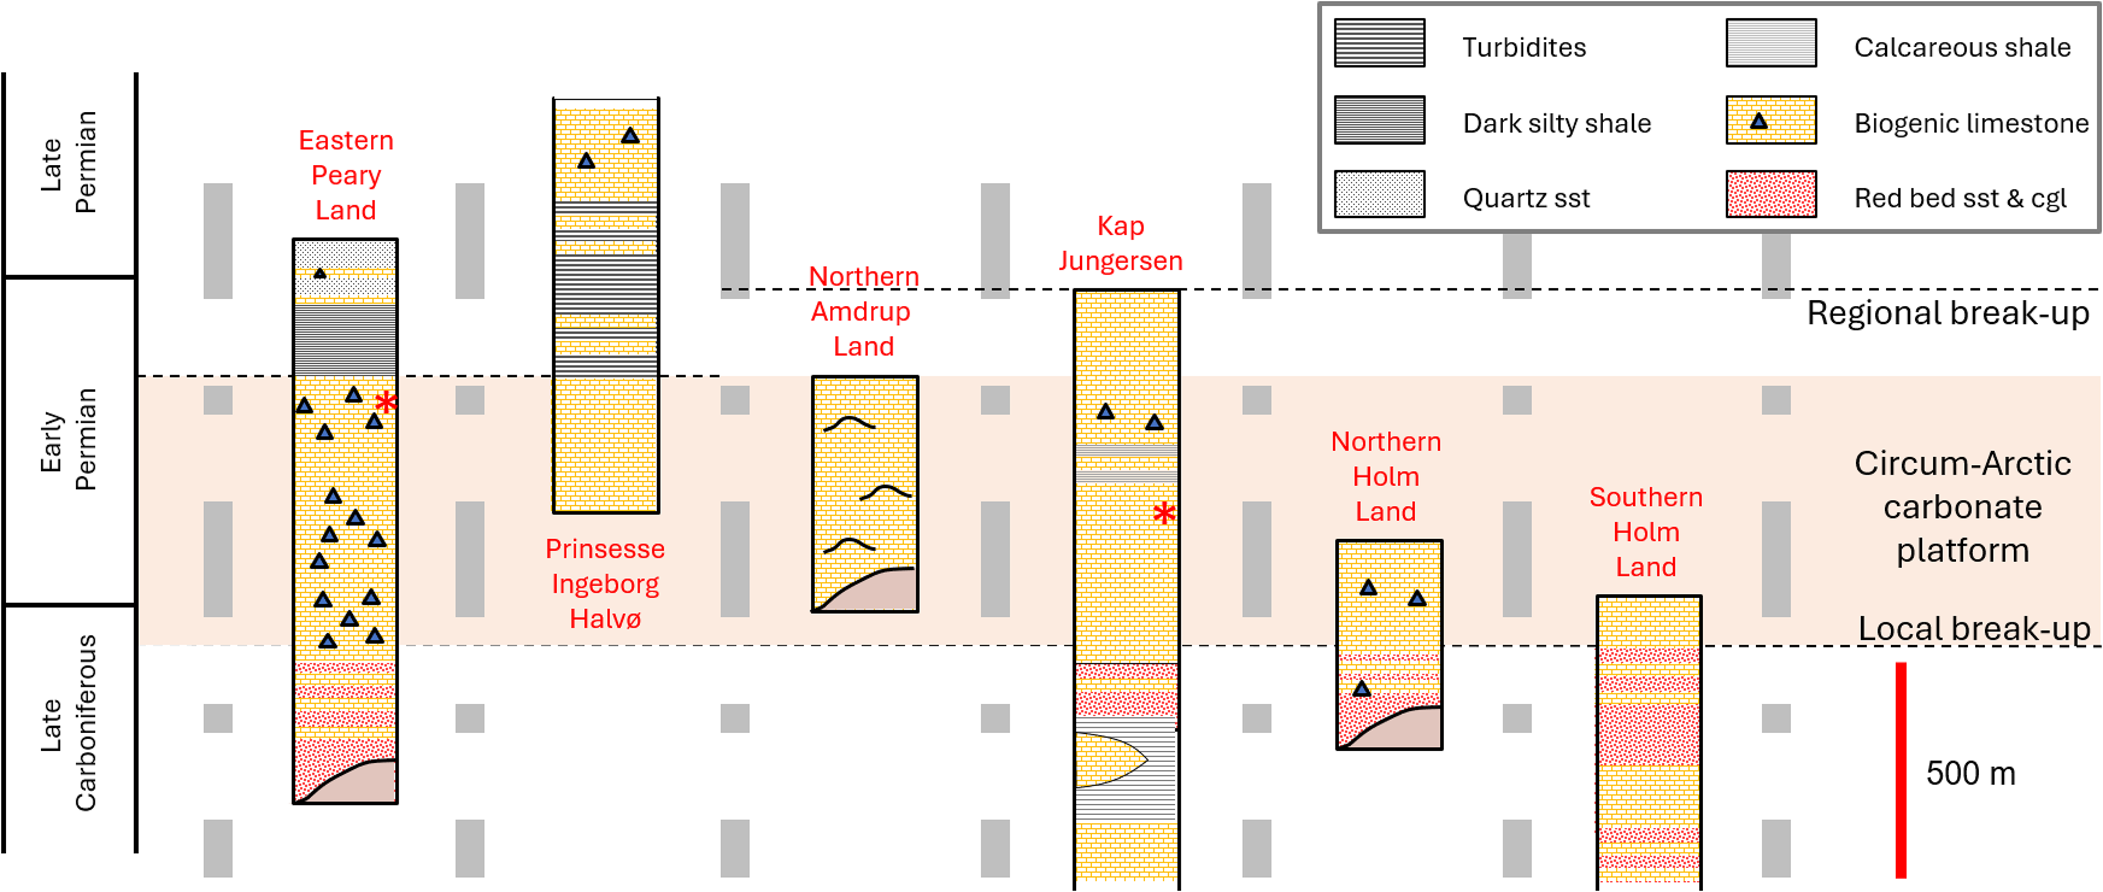
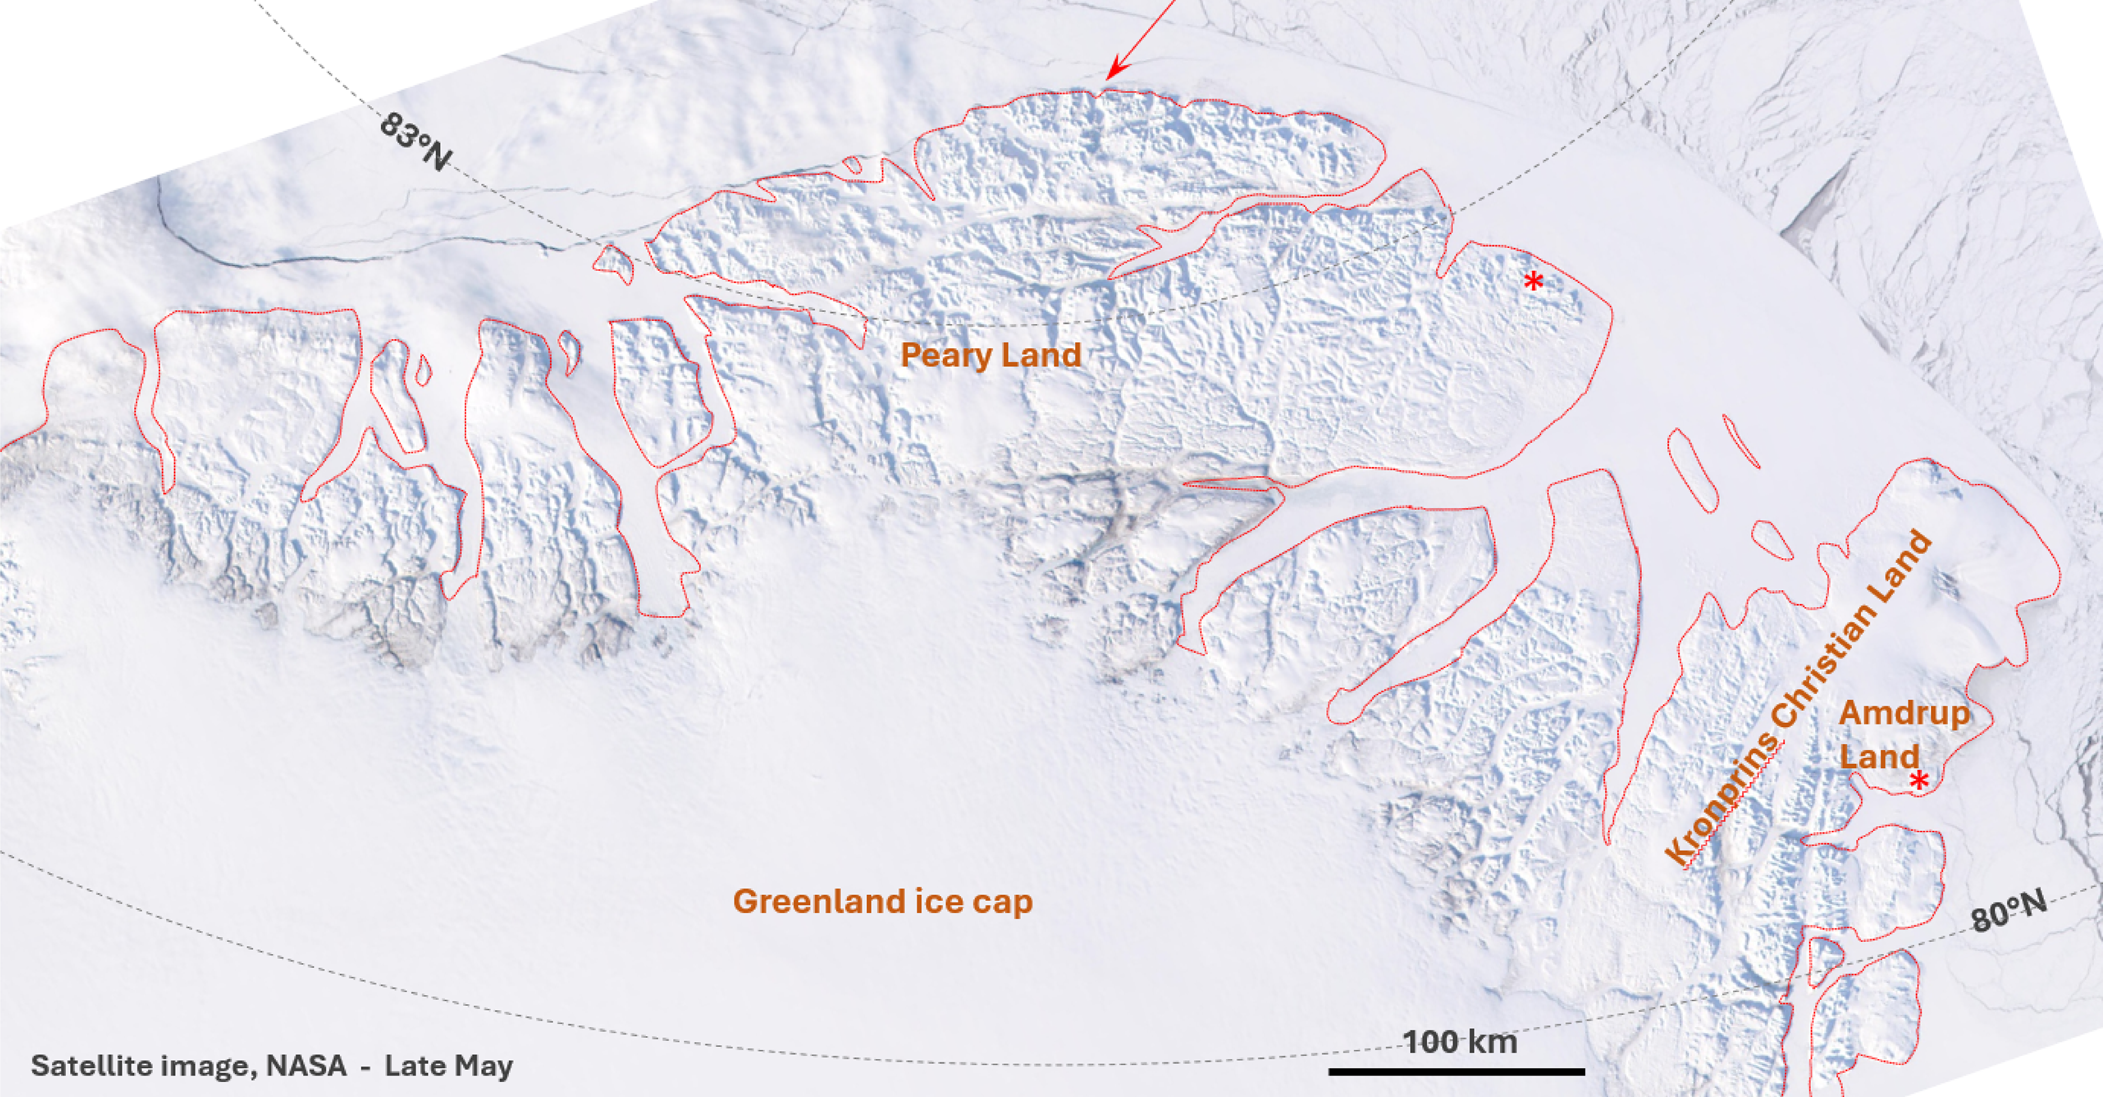
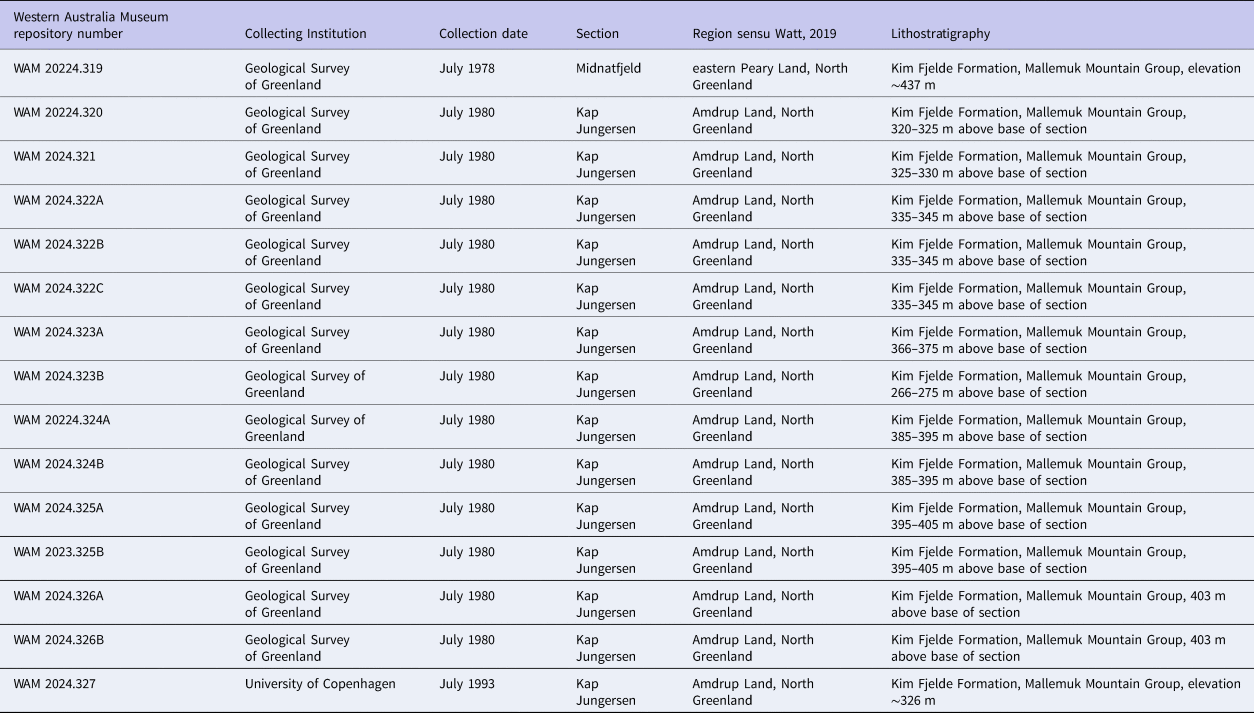
Tabulipora sp. is a trepostomate stenolaemate bryozoan (Taylor, Reference Taylor2020; Bock, Reference Bock2023). Our specimens were originally assigned to Amphiporella (Madsen and Håkansson, Reference Madsen and Håkansson.1989; Madsen, Reference Madsen1994). But since Boardman and Buttler's forthcoming Treatise on Invertebrate Paleontology (Part G, Bryozoa, Revised, Volume 2) subsumes Amphiporella into Tabulipora in keeping with Astrova's (Reference Astrova1978) classification, we here refer to them as Tabulipora sp. Our species forms erect frondose colonies. The bifoliate, platy fronds are up to 1 cm thick, reaching over 20 cm wide (Madsen and Håkansson, Reference Madsen and Håkansson.1989; Madsen, Reference Madsen1994). For this study, 15 colonies of Tabulipora sp. were selected from the series of samples collected from the Kim Fjelde Formation, Mallemuk Mountain Group, Wandel Sea Basin in North Greenland (Fig. 6) (Stemmerik and Håkansson, Reference Stemmerik and Håkansson1991; Watt, Reference Watt2019). One colony came from the Midnatfjeld section in eastern Peary Land at 82.7592°N, 22.1356°W, and 14 colonies came from the Kap Jungersen section in Amdrup Land 80.6283°N, 15.7489°W (Madsen, Reference Madsen1994) (Fig. 7). Specimen numbers and collection information are available in Table 2. Stratigraphically, these colonies lived during the Artinskian to Kungurian Ages of the Cisuralian Epoch of the Permian Period (Stemmerik et al., Reference Stemmerik, Håkansson, Madsen, Nilsson, Piasecki, Pinard and Rasmussen.1996, Reference Stemmerik, Larsen and Dalhoff2000; Henderson et al., Reference Henderson, Shen, Gradstein, Agterberg, Gradstein, Ogg, Schmitz and Ogg2020). Paleogeographically, they were deposited in the Wandel Sea Basin (Håkansson and Pedersen, Reference Håkansson, Pedersen, Gibson, Roure and Manatschal2015) at ~40°N paleolatitude (van Hinsbergen et al., Reference van Hinsbergen, de Groot, van Schaik, Spakman, Bijl, Sluijs, Langereis and Brinkhuis2015; Blakey, Reference Blakey2021, fig. 8).
Stratigraphy of the late Carboniferous–early Permian Circum-Arctic carbonate platform segment in eastern North Greenland. Stylized fault blocks, created by transecting complex strike-slip fault system active intermittently from the Late Permian through the Mesozoic (Håkansson and Pedersen, Reference Håkansson, Pedersen, Gibson, Roure and Manatschal2015), are separated by gray dashed lines. The positions of the two populations of Tabulipora sp. in this study are indicated by red asterisks: Midnatfjeld section in eastern Peary Land and the Kap Jungersen section in Amdrup Land.
This true-color Moderate Resolution Imaging Spectroradiometer (MODIS) satellite image from 20 May 2001 shows snow-covered North Greenland with the coastline indicated in red. The red arrow points to the northernmost point of land, and the position of the two populations of Tabulipora sp. investigated are indicated by red asterisks: Midnatfjeld to the north and Kap Jungersen to the south. Modified from Descloitres (Reference Descloitres2001).
Sample, locality, and stratigraphic information for colonies of Tabulipora sp. used in this study from the Wandel Sea Basin in North Greenland.
Methods
We measured branch width, branch thickness, and monticule height with digital calipers to the nearest 0.01 mm (Fig. 8). As discussed previously in Equation (3), curvature K was calculated as: /K/ =  ${{\rm b} \over {{\rm a}^2}}$ where a is the length of the semi-major axis (i.e., one-half branch width) and b is the length of the semi-minor axis (i.e., one-half branch thickness). Therefore, curvature in mm–1 as calculated in Equation (2) was /K/ = ${{{\rm branch\;thickness}/2} \over {{( {{\rm branch\;width}/2} ) }^2}}$. Monticule spatial density in number per mm2 was calculated as the number of monticules per branch side/area of branch side. On some more weathered branches, monticules were not well enough preserved to be counted on both sides of the branch.
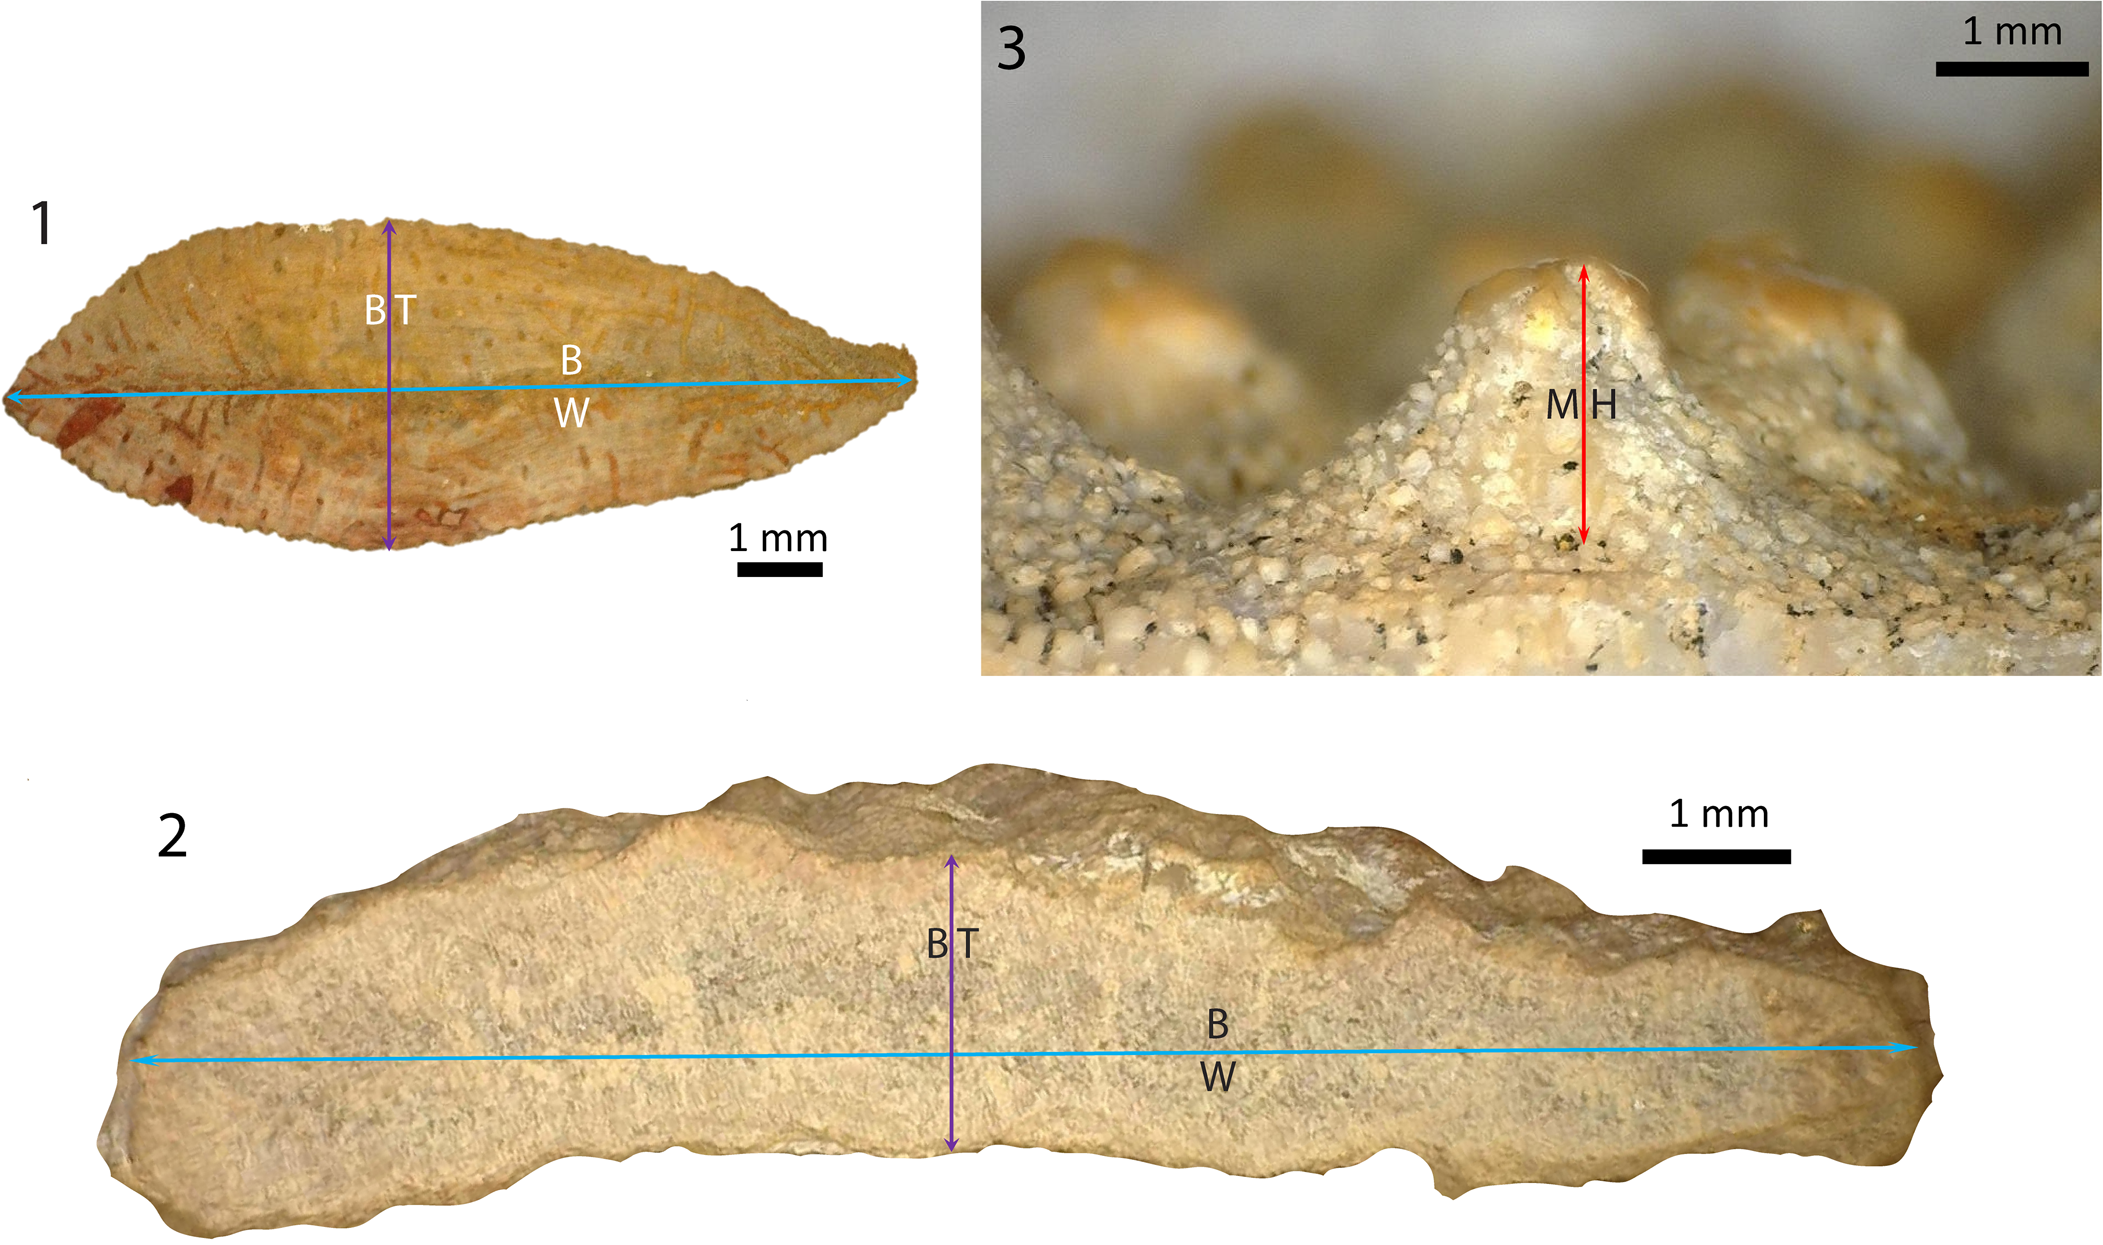
(1, 2) Caliper-based characters measured: branch thickness (BT) and branch width (BW) as shown on transverse cross-section views of (1) Evactinostella crucialis (Hudleston, Reference Hudleston1883) specimen WAM 2024.317E from the Lyndon River locality in the Merlingleigh Subbasin at the southern end of the onshore Southern Carnarvon Basin, Western Australia, in the Callytharra Formation and (2) Tabulipora sp. specimen WAM 2024.326C from the Kap Jungersen locality in Amdrup Land, North Greenland, in the Kim Fjelde Formation, Mallemuk Mountain Group. (3) Monticule height (MH) as shown on a surface view of Tabulipora sp. specimen WAM 2024.325C from the Kap Jungersen locality in Amdrup Land, North Greenland, in the Kim Fjelde Formation, Mallemuk Mountain Group.
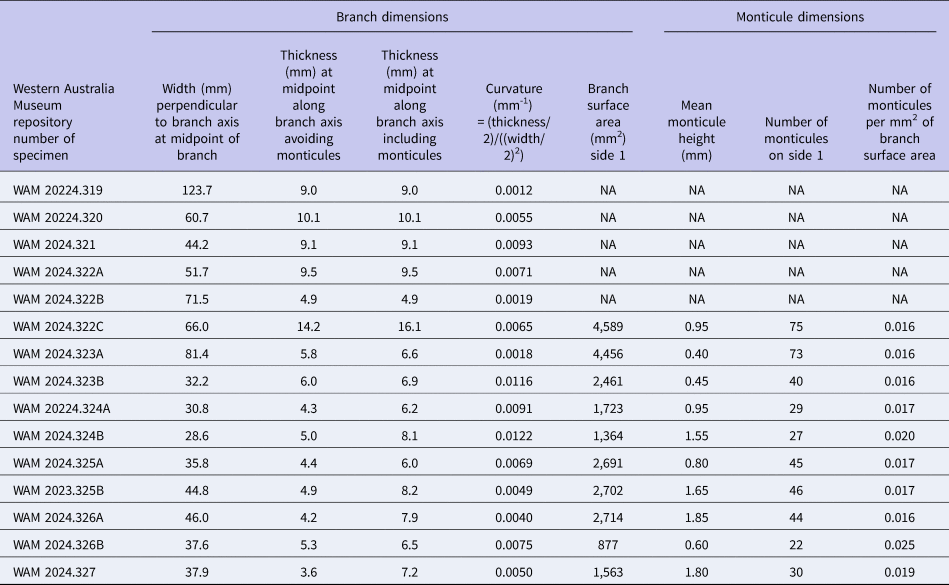
Using the structure-from-motion (SfM) method (Fonstad et al., Reference Fonstad, Dietrich, Courville, Jensen and Carbonneau2013), we built digital elevation models (DEMs) of two branch surfaces. This is the first time SfM-DEM technology has been used in bryozoology. SfM applies the principles of stereoscopic photogrammetry to a series of two-dimensional digital images to reconstruct a three-dimensional DEM of the surface of an object (Westoby et al., Reference Westoby, Brasington, Glasser, Hambrey and Reynolds2012). For creating the DEMs, we chose one side of one branch from one colony from each species that had the largest surface area (i.e., the most monticules): WAM 2024.325C for Tabulipora sp. and WAM 2024.317A for E. crucialis. The DEMs were built in Agisoft's Metashape Pro version 1.64 with 0.1 mm resolution on the x and y coordinate axes and 0.01 mm resolution on the z (vertical) axis. Topographic profiles through the colony surface were made with QGIS version 3.30 from monticule crest to monticule crest.
Results
The surfaces of the Evactinostella crucialis colonies (N = 17, curvature [mm–1] range: 0.0021–0.0441, mean = 0.0118, standard deviation = 0.0104) are more curved than those of Tabulipora sp. (N = 15, curvature [mm–1] range: 0.0012–0.0122, mean = 0.0063, standard deviation = 0.0032) (Tables 3, 4, respectively). On average, the more elliptical Evactinostella branches are significantly more (i.e., twice as) curved than those of the flatter Tabulipora branches (t-test two-sample assuming unequal variance: t-stat = 2.005, p = 0.059).
Morphometric data for 17 colonies of Evactinostella crucialis (Hudleston, Reference Hudleston1883) used in this study. Missing values are denoted by NA.
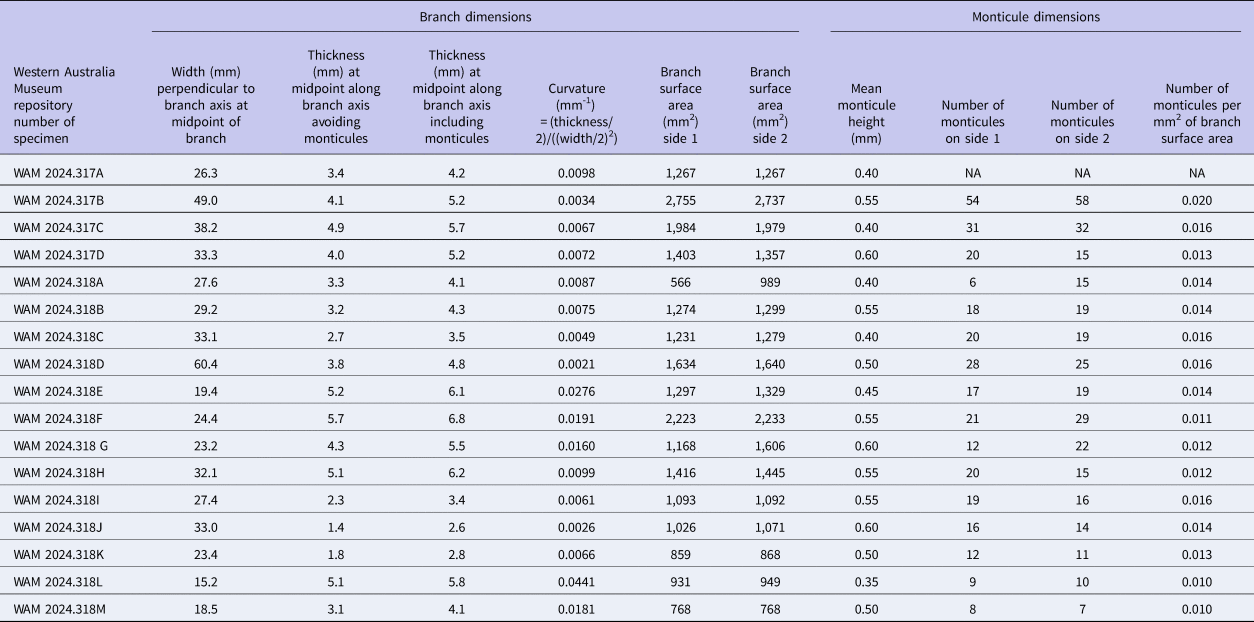
Morphometric data for 15 colonies of Tabulipora sp. used in this study. Missing values are denoted by NA.
The caliper-based heights of the monticules on the Evactinostella crucialis colonies (N = 17, height [mm] range: 0.35–0.60, mean = 0.50, standard deviation = 0.08) are shorter than those on the Tabulipora sp. colonies (N = 10, height [mm] range: 0.40–1.85, mean = 1.10, standard deviation = 0.53) (Tables 3, 4, respectively). On average, monticules on the more elliptical Evactinostella branches are significantly shorter (i.e., half as high) than those of the flatter Tabulipora branches (t-test two-sample assuming unequal variance: t-stat = –3.364, p = 0.008).
The DEM-based monticule heights yielded similar results. The monticules on Evactinostella crucialis (N = 40, height [mm] range: 0.10–2.68, mean = 0.78, standard deviation = 0.47) are shorter than those on Tabulipora sp. (N = 31, height [mm] range: 0.89–2.40, mean = 1.48, standard deviation = 0.39). On average, monticules on the more elliptical Evactinostella branches are significantly shorter (i.e., half as high) than those of the flatter Tabulipora branches (t-test two-sample assuming unequal variance: t-stat = 6.761, p < 0.001) (Fig. 9).
Graph showing relative elevations of monticules on the DEM topographic profile monticules peak to peak across colonies. Error bars are ±0.1 mm on the horizontal axis and ±0.01 mm on the vertical axis. Evactinostella crucialis (Hudleston, Reference Hudleston1883) data from specimen WAM 2024.317A and Tabulipora sp. data from specimen WAM 2024.325C.
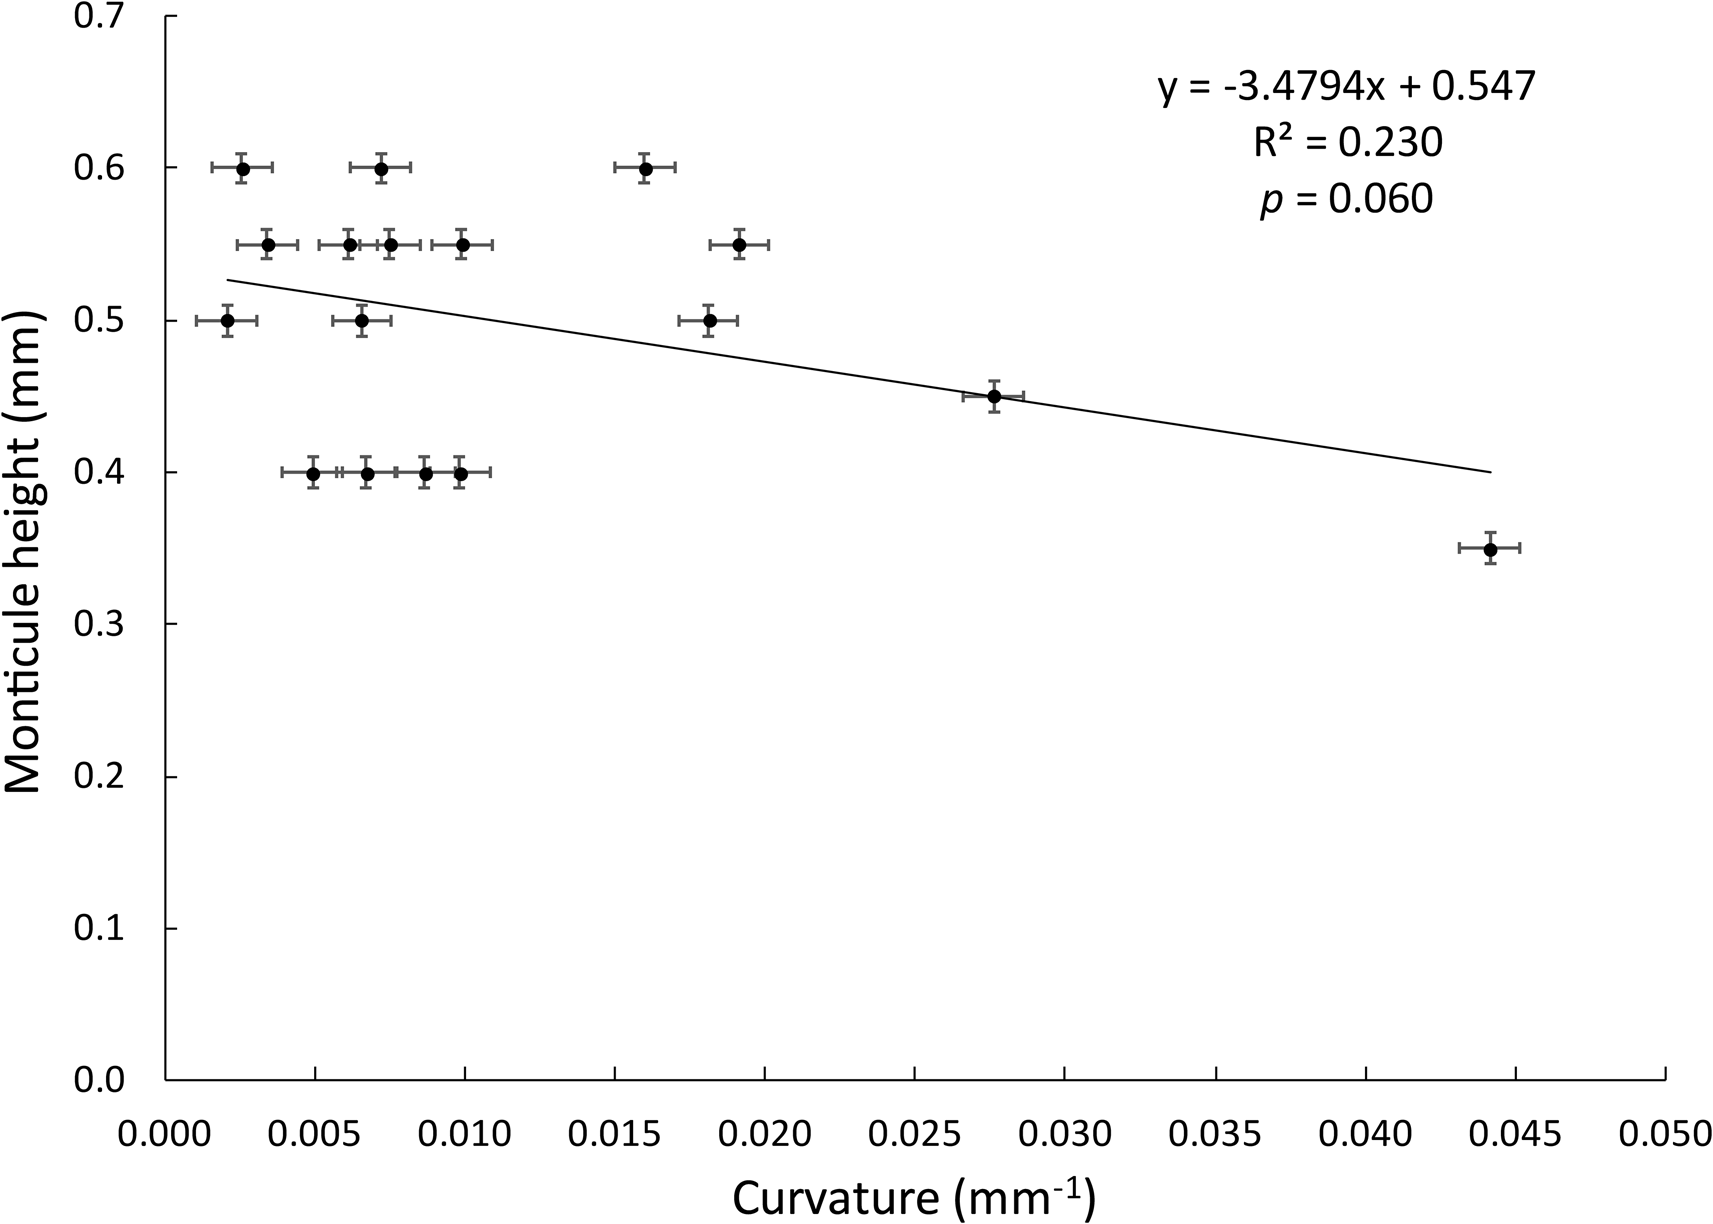
Only among the Evactinostella colonies was branch surface curvature inversely proportional to monticule height as we expected (Fig. 10). The same was not true for the flatter Tabulipora sp. branches.
Graph showing inverse linear regression relationship between branch surface curvature and monticule height among the Evactinostella crucialis (Hudleston, Reference Hudleston1883) colonies. Error bars are ±0.001 mm on the horizontal axis and ±0.01 mm on the vertical axis.
The monticules on the Evactinostella crucialis colonies (N = 16 colonies, spatial density [number/mm2] range: 0.010–0.020, mean = 0.014, standard deviation = 0.003) are less densely spaced than those of Tabulipora sp. (N = 10, spatial density [number/mm2] range: 0.016–0.025, mean = 0.018, standard deviation = 0.003) (Tables 3, 4, respectively). On average, the monticules on the more elliptical Evactinostella branches are significantly (i.e., 22%) less densely spaced as those of the flatter Tabulipora branches (t-test two-sample assuming unequal variance: t-stat = –3.746, p = 0.001).
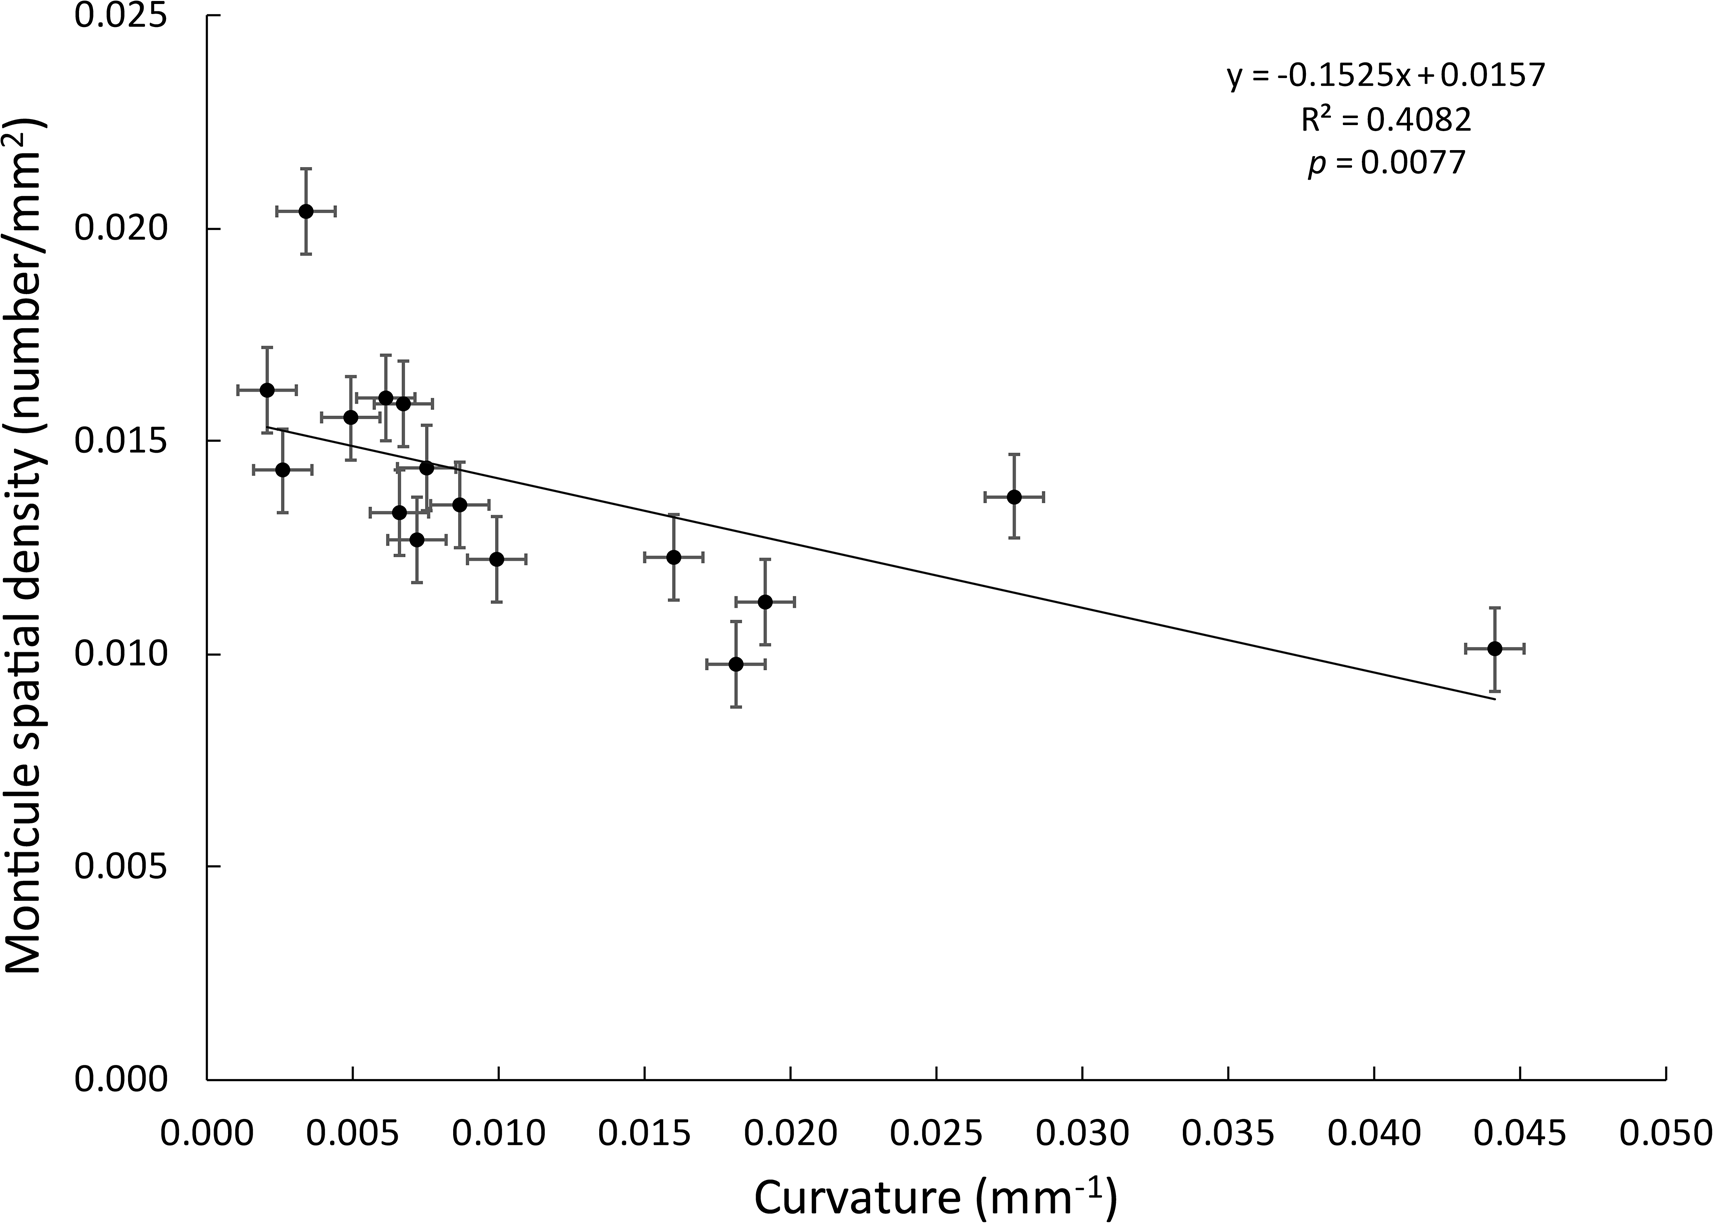
Only among the Evactinostella colonies was branch surface curvature inversely proportional to monticule spatial density as we expected (Fig. 11). The same was not true for the flatter Tabulipora sp. branches.
Graph showing inverse linear regression relationship between branch surface curvature and monticule spatial density among the Evactinostella crucialis (Hudleston, Reference Hudleston1883) colonies. Error bars are ±0.001 mm.
Discussion
This study presumes that the monticules are sites of excurrent colony-wide feeding currents as previous authors have done (e.g., Yancey et al., Reference Yancey, Wyse Jackson, Sutton and Gottfried2019). Four independent pieces of evidence support this.
One: the monticules lack incurrent-generating feeding autozooids (Fig. 12). When an area of a colony surface is devoid of functioning autozooids with enough surrounding surface area of incurrent-generating autozooids, the devoid area by default becomes an excurrent chimney (Banta et al., Reference Banta, McKinney and Zimmer1974, fig. 1; McKinney, Reference McKinney1986a, fig. 4A; von Dassow, Reference von Dassow2005a, fig. 1A). This study also assumes the monticules are the only sites of excurrent colony-wide feeding currents, and therefore, there are no non-skeletal chimneys interfering with our skeletal chimney interpretations. It is known that extant cheilostomes (e.g., Membranipora) can create excurrent chimneys simply by temporarily leaning their lophophores away from each other or retracting their polypides (Winston, Reference Winston1978; Cook and Chimonides, Reference Cook and Chimonides1980; Lidgard, Reference Lidgard, Larwood and Nielsen1981; Taylor, Reference Taylor and Savazzi1999; Shunatova and Ostrovsky, Reference Shunatova and Ostrovsky2002). Fortunately, as shown by Shunatova and Ostrovsky (Reference Shunatova and Ostrovsky2002, table 1), such non-skeletal excurrent chimneys are not known from any stenolaemate bryozoans such as those in this study.
Plan view of outlined monticules in (1) Evactinostella crucialis (Hudleston, Reference Hudleston1883) specimen WAM 2024.317E from the Jimba Jimba Station locality in the Jimba Jimba Member of the Callytharra Formation and (2) Tabulipora sp. specimen WAM 2024.326B from the Kap Jungersen locality in Amdrup Land, North Greenland, in the Kim Fjelde Formation, Mallemuk Mountain Group. Note lack of incurrent-generating feeding autozooids (A's), stellate shape, and autozooecial skeletal apertures facing away from the monticules.
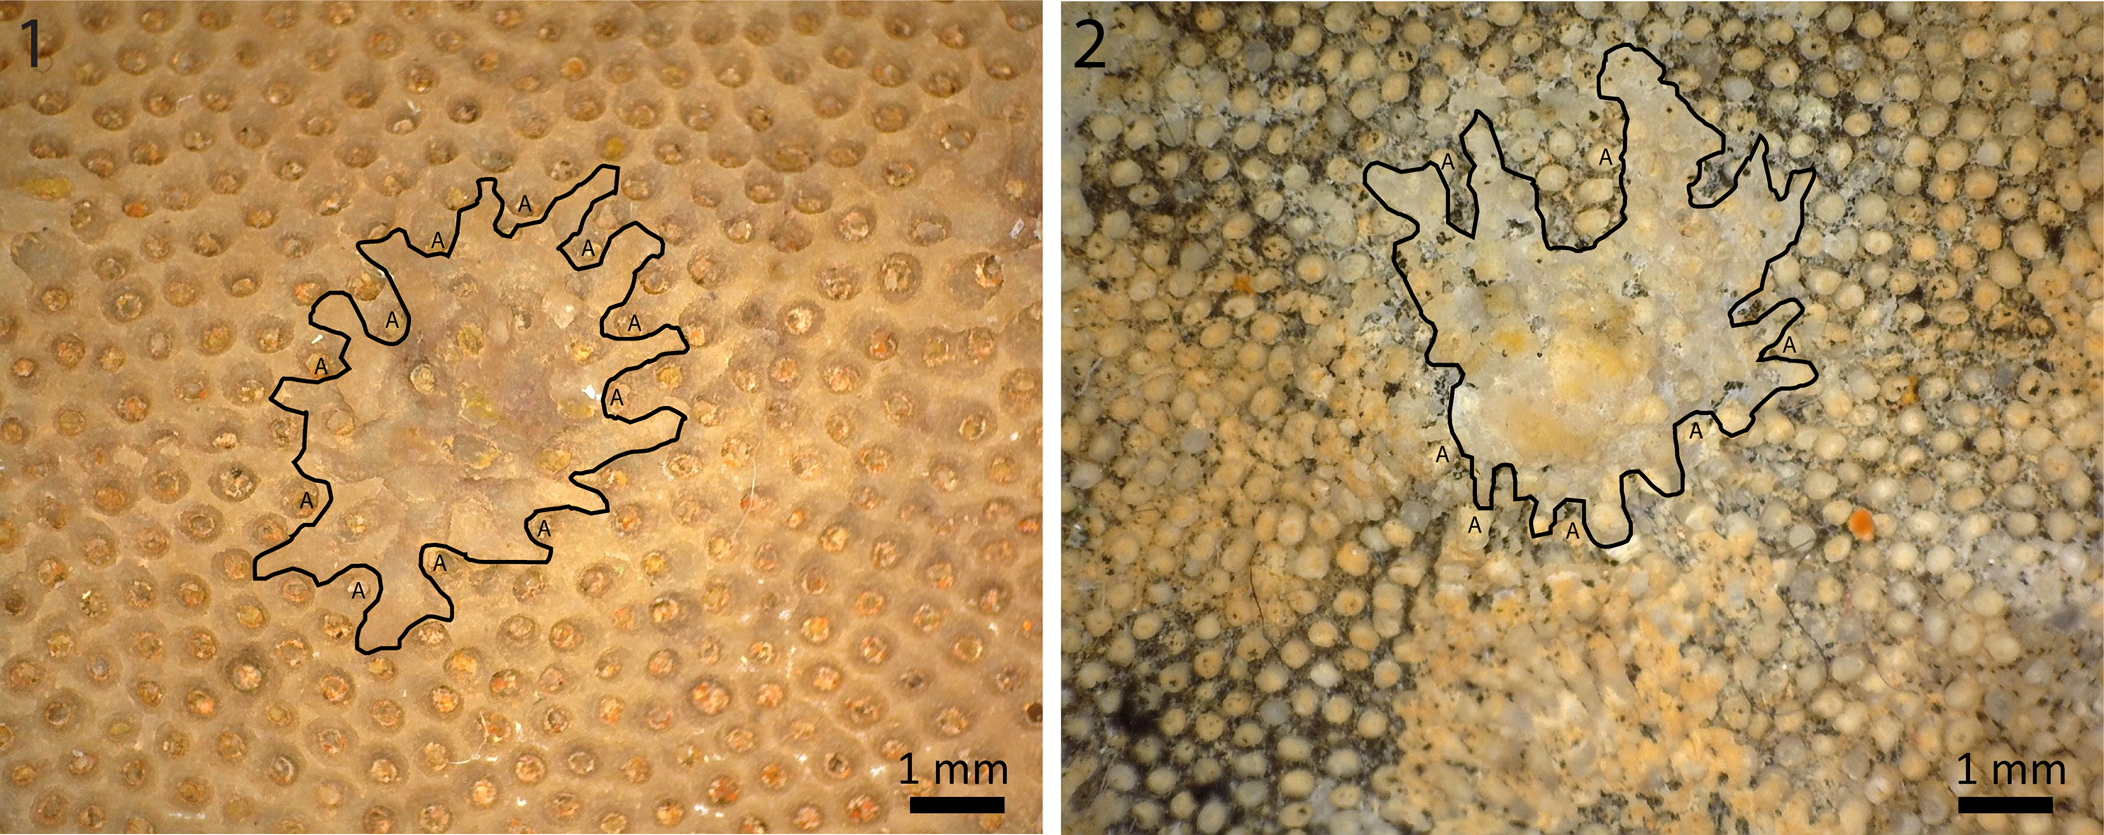
Two: the monticules have a stellate shape (Fig. 12) like other excurrent structures with centripetal flow. Many excurrent maculae are star-shaped (Anstey, Reference Anstey and Ross1987), for example, those in the cystoporate Constellaria (Boardman, Reference Boardman, Boardman, Lutaud, Wood, Karklins, Utgaard, Cheetham and Cook1983, fig. 59.1) and the trepostomes Heterotrypa (Anstey and Perry, Reference Anstey and Perry1973, pl. 17) and Tabulipora (Key et al., Reference Key, Thrane, Collins, Wyse Jackson, Buttler and Spencer Jones2002, fig. 1). Key et al. (Reference Key, Wyse Jackson and Vitiello2011) used stream channel network analysis to show that stellate maculae in Tabulipora are excurrent chimneys. As first noticed by Anstey and Pachut (Reference Anstey and Pachut1976) and Anstey et al. (Reference Anstey, Pachut and Prezbindowski1976), stellate maculae are analogous to inorganic centripetal flow structures such as star dunes (e.g., Folk, Reference Folk1971, fig. 5B; Nielson and Kocurek, Reference Nielson and Kocurek.1987, fig. 2A) and araneiform CO2 geysers on Mars (Portyankina et al., Reference Portyankina, Hansen and Aye2020, fig. 1). They are even more similar to centripetal flow structures in other organisms such as astrorhizae in living sclerosponges (e.g., Hartman and Goreau, Reference Hartman and Goreau1970, fig. 5; Boyajian and LaBarbera, Reference Boyajian and LaBarbera1987, fig. 1) and fossil stromatoporoids (e.g., LaBarbera and Boyajian, Reference LaBarbera and Boyajian1991, fig. 1). The conical mamelons with radial bands in the Eocene demosponge Pickettispongia tabelliformis (Chapman and Crespin, Reference Chapman and Crespin1934) from Australia illustrated by Pisera et al. (Reference Pisera, Bitner and Fromont2023, fig. 5C) is a stunning example of evolutionary convergence with the monticules in this study.
Three: the autozooecial skeletal apertures are radially arranged around the centers of the monticules with the apertures facing away from the monticules (Fig. 12.1). Lunaria typically develop on the side of the aperture closest to the maculum (Anstey, Reference Anstey1981, Reference Anstey and Ross1987; Patzkowsky, Reference Patzkowsky and Ross1987; Taylor, Reference Taylor and Savazzi1999). This is most evident in the cystoporate Evactinostella crucialis colonies that have lunaria on the sides of autozooecial apertures nearest the centers of the monticules (Crockford, Reference Crockford1957; Utgaard, Reference Utgaard, Boardman, Lutaud, Wood, Karklins, Utgaard, Cheetham and Cook1983). This makes the autozooecial apertures meet the colony surface very obliquely (Crockford, Reference Crockford1957) (Fig. 12.1). In extant colonies, this arrangement is associated with excurrent colony-wide feeding currents centered on maculae (Banta et al., Reference Banta, McKinney and Zimmer1974, fig. 1; Grünbaum, Reference Grünbaum1997, fig. 2a; von Dassow, Reference von Dassow2005a, fig. 1B, Reference von Dassow2005b, fig. 1B; Winston, Reference Winston2010, fig. 2).
Four: the maculae are elevated (i.e., monticulate) (Figs. 8.3, 9). Most studies have attributed monticules to sites of excurrent flow (Banta et al., Reference Banta, McKinney and Zimmer1974, fig. 1; Taylor, Reference Taylor and Savazzi1999, fig. 41.3; Shunatova and Ostrovsky, Reference Shunatova and Ostrovsky2002, fig. 7b; Winston, Reference Winston2010, fig. 2; Taylor, Reference Taylor2020, fig. 4.22). However, not all monticules are centers of excurrent flow (Shunatova and Ostrovsky, Reference Shunatova and Ostrovsky2002, fig. 7a).
Among the Evactinostella colonies, branch surface curvature was significantly inversely proportional to monticule height as we expected (Fig. 10). The same was true for the flatter Tabulipora sp. branches, but it was not significantly so (linear regression, y = –22.644x + 1.2571, R2 = 0.0176, p = 0.715). We attribute this difference between Evactinostella and Tabulipora to less branch surface curvature in the latter. Flatter colonies (e.g., Tabulipora) will have a greater need to expel filtered water so should need higher monticules producing higher excurrent velocities. This is similar to star dunes where height is proportional to wind speed (Zhang et al., Reference Zhang, Qu, Tan, Jing, Bian and Niu2016).
Among the Evactinostella colonies, branch surface curvature was inversely proportional to monticule spatial density as we expected (Fig. 11). The same was not true for the flatter Tabulipora sp. branches. We attribute this difference between Evactinostella and Tabulipora to less branch surface curvature in the latter. The magnitude of curvature in Evactinostella is more than twice as much as in Tabulipora, and the range is four times greater.
Alternatively, the weaker inverse correlation between branch surface curvature and monticule height and density in Tabulipora compared with Evactinostella may be a function of the former retaining a more constant branch cross-sectional shape through astogeny compared with Evactinostella, whose curvature changes more with colony age. This may not be the case as monticules have previously been correlated with bryozoan branch curvature. McKinney (Reference McKinney1986b) measured 914 bryozoans with cylindrical branches and showed that macular chimneys form only in branches >2 mm diameter. Key et al. (Reference Key, Thrane, Collins, Wyse Jackson, Buttler and Spencer Jones2002) measured macular size in ramose Tabulipora colonies. They showed that as branch diameter increases (i.e., substrate curvature decreases), macular size increases. Wyse Jackson et al. (Reference Wyse Jackson, Key and Coakley2014) measured monticule size in trepostomes encrusting conical nautiloids. They showed that as cone diameter increases (i.e., substrate curvature decreases), monticule size increases. Therefore, we conclude that the smaller and more curved the surface of a stenolaemate colony, the less the colony needs robust colony-wide feeding currents created by closely spaced tall monticules. Larger and flatter plate-like colonies need more robust colony-wide feeding currents created by closely spaced tall monticules.
Acknowledgments
We thank L. Madsen (University of Copenhagen), L. Stemmerik (Geological Survey of Denmark and Greenland), and C. Heinberg (Roskilde University) for help collecting the Greenland samples, and A. Ernst (University of Hamburg) for helping collect the Australian samples. We thank P. Sak (Dickinson College) for help with quantifying surface curvature. We thank P. Taylor (Natural History Museum, London) for discussion on the potential for excurrent chimneys being formed non-skeletally by lophophores leaning away from the macular centers. We thank A. Ernst and an anonymous reviewer for their positive reviews.
Competing interests
The authors declare none.


 Open access