


Statement of Research Significance
Research Question(s) or Topic(s): This study compared three ways of defining mild cognitive impairment to see which best identified early brain changes linked to dementia risk in aging Veterans. Main Findings: We found that using detailed neuropsychological testing identified Veterans with greater white matter damage in the brain and suggested a link between smaller hippocampal volume and greater white matter burden. This was especially true for Veterans with memory-focused impairment. Other commonly used diagnostic methods did not capture this relationship. Study Contributions: This study shows that neuropsychological approaches are more sensitive to detecting early and complex brain changes than traditional single-test methods. These findings highlight the value of comprehensive testing for improving early detection, risk assessment, and intervention planning for Veterans at risk of dementia.
Introduction
Mild cognitive impairment (MCI) is a highly prevalent clinical condition in aging that substantially increases the risk for progression to dementia, including Alzheimer’s disease (AD) (Albert et al., Reference Albert, DeKosky, Dickson, Dubois, Feldman, Fox, Gamst, Holtzman, Jagust, Petersen, Snyder, Carrillo, Thies and Phelps2011; Petersen et al., Reference Petersen, Smith, Waring, Ivnik, Tangalos and Kokmen1999). Accurate identification of individuals at risk is therefore essential for early detection and timely intervention. However, there are several diagnostic approaches used to define MCI, and this has led to considerable variability in its detection across both research and clinical settings (Bondi et al., Reference Bondi, Edmonds, Jak, Clark, Delano-Wood, McDonald, Nation, Libon, Au, Galasko and Salmon2014; Jak et al., Reference Jak, Bondi, Delano-Wood, Wierenga, Corey-Bloom, Salmon and Delis2009; Petersen et al., Reference Petersen, Lopez, Armstrong, Getchius, Ganguli, Gloss, Gronseth, Marson, Pringsheim, Day, Sager, Stevens and Rae-Grant2018). MCI was initially defined by the Petersen/Winblad criteria as a transitional state between normal cognition and dementia, requiring both subjective and objective evidence of decline in the context of relatively preserved everyday functioning (Petersen, Reference Petersen2004; Petersen & Morris, Reference Petersen and Morris2005; Winblad et al., Reference Winblad, Palmer, Kivipelto, Jelic, Fratiglioni, Wahlund, Nordberg, Bäckman, Albert, Almkvist, Arai, Basun, Blennow, De Leon, DeCarli, Erkinjuntti, Giacobini, Graff, Hardy and Petersen2004). Within this “typical” framework, cognitive impairment is defined as performance >1.5 standard deviations (SD) below normative means on at least one neuropsychological measure. The Alzheimer’s Disease Neuroimaging Initiative (ADNI), which built upon Petersen’s framework, implemented a stricter amnestic MCI definition based on memory complaints, impaired delayed recall on the WMS-R Logical Memory Test, a Clinical Dementia Rating (CDR) global score of 0.5, and preserved functional abilities (Petersen et al., Reference Petersen, Aisen, Beckett, Donohue, Gamst, Harvey, Jack, Jagust, Shaw, Toga, Trojanowski and Weiner2010).
Despite their utility in research, both typical and ADNI criteria for MCI have been critiqued for limited specificity and misclassification of cognitive status, particularly due to reliance on subjective memory complaints and single test cutoffs. Studies have shown that these approaches can lead to false-positive and false-negative errors, contributing to inconsistent MCI characterization across samples (Bondi et al., Reference Bondi, Edmonds, Jak, Clark, Delano-Wood, McDonald, Nation, Libon, Au, Galasko and Salmon2014; Clark et al., Reference Clark, Delano-Wood, Libon, McDonald, Nation, Bangen, Jak, Au, Salmon and Bondi2013; Edmonds et al., Reference Edmonds, Delano-Wood, Galasko, Salmon and Bondi2014, Reference Edmonds, Eppig, Bondi, Leyden, Goodwin, Delano-Wood and McDonald2016). To improve diagnostic accuracy, a more empirically grounded approach was developed using neuropsychological test data to establish more reliable and sensitive MCI criteria. These neuropsychological criteria require low performance (>1 SD below norms) on two tests within a single cognitive domain, or on one test across at least three cognitive domains (Bondi et al., Reference Bondi, Jak, Delano-Wood, Jacobson, Delis and Salmon2008; Jak et al., Reference Jak, Bondi, Delano-Wood, Wierenga, Corey-Bloom, Salmon and Delis2009). Compared to typical and ADNI criteria, this method yields more stable diagnoses, clearer cognitive phenotypes, stronger associations with AD biomarkers, and better prediction of dementia progression (Bondi et al., Reference Bondi, Edmonds, Jak, Clark, Delano-Wood, McDonald, Nation, Libon, Au, Galasko and Salmon2014; Jak et al., Reference Jak, Bondi, Delano-Wood, Wierenga, Corey-Bloom, Salmon and Delis2009a; Jak et al., Reference Jak, Urban, McCauley, Bangen, Delano-Wood, Corey-Bloom and Bondi2009b). However, prior work has focused largely on cognitive trajectories or fluid biomarkers and less is known about how different diagnostic criteria relate to structural brain changes. Neuroimaging biomarkers offer in vivo evidence of neurodegenerative and cerebrovascular disease and thus provide an important test of the sensitivity of MCI criteria to underlying neuropathology (Bondi et al., Reference Bondi, Edmonds, Jak, Clark, Delano-Wood, McDonald, Nation, Libon, Au, Galasko and Salmon2014; Edmonds et al., Reference Edmonds, Eppig, Bondi, Leyden, Goodwin, Delano-Wood and McDonald2016; Jak et al., Reference Jak, Urban, McCauley, Bangen, Delano-Wood, Corey-Bloom and Bondi2009b).
White matter hyperintensities (WMHs) and hippocampal atrophy are two key imaging markers relevant to dementia risk, particularly among aging Veterans. WMHs are associated with disrupted white matter integrity, cognitive decline, and increased risk of AD and vascular dementia (Rizvi et al., Reference Rizvi, Lao, Chesebro, Dworkin, Amarante, Beato, Gutierrez, Zahodne, Schupf, Manly, Mayeux and Brickman2021; Wang et al., Reference Wang, Yang, Wang, Nie, Yin and Liu2020). While WMHs are often interpreted as small vessel ischemic changes, emerging evidence suggests they also reflect broader AD-related pathology, including inflammation and glymphatic dysfunction (Rizvi et al., Reference Rizvi, Lao, Chesebro, Dworkin, Amarante, Beato, Gutierrez, Zahodne, Schupf, Manly, Mayeux and Brickman2021; Swardfager et al., Reference Swardfager, Cogo-Moreira, Masellis, Ramirez, Herrmann, Edwards, Saleem, Chan, Yu, Nestor, Scott, Holmes, Sahlas, Kiss, Oh, Strother, Fuqiang, Stefanovic, Keith, Keith and Black2018). Likewise, hippocampal atrophy is a hallmark of AD and strongly associated with amnestic MCI (Csukly et al., Reference Csukly, Sirály, Fodor, Horváth, Salacz, Hidasi, Csibri, Rudas and Szabó2016; Jak et al., Reference Jak, Urban, McCauley, Bangen, Delano-Wood, Corey-Bloom and Bondi2009b; Zhang et al., Reference Zhang, Sachdev, Wen, Kochan, Crawford, Brodaty, Slavin, Reppermund, Draper, Zhu, Kang and Trollor2012). Importantly, prior work has shown that MCI criteria differ in their ability to detect hippocampal atrophy and cerebrovascular burden (Jak et al., Reference Jak, Bondi, Delano-Wood, Wierenga, Corey-Bloom, Salmon and Delis2009a). Cortical thickness, especially in the frontal and temporal lobes, is another valuable neuroimaging marker, as reductions in these areas have been linked to cognitive decline and AD, particularly in individuals with vascular or psychiatric comorbidities (Desikan et al., Reference Desikan, Ségonne, Fischl, Quinn, Dickerson, Blacker, Buckner, Dale, Maguire, Hyman, Albert and Killiany2006; Swardfager et al., Reference Swardfager, Cogo-Moreira, Masellis, Ramirez, Herrmann, Edwards, Saleem, Chan, Yu, Nestor, Scott, Holmes, Sahlas, Kiss, Oh, Strother, Fuqiang, Stefanovic, Keith, Keith and Black2018). Moreover, cerebrovascular and neurodegenerative processes frequently co-occur, and their combined effects on cognition may be greater than the impact of either pathology alone (Fiford et al., Reference Fiford, Manning, Bartlett, Cash, Malone, Ridgway, Lehmann, Leung, Sudre, Ourselin, Biessels, Carmichael, Fox, Cardoso and Barnes2017; van Leijsen et al., Reference van Leijsen, Tay, van Uden, Kooijmans, Bergkamp, van der Holst, Ghafoorian, Platel, Norris, Kessels, Markus, Tuladhar and de Leeuw2019).
Including these structural markers (e.g., WMHs, hippocampal volume, and cortical thickness) offers a more comprehensive view of the brain changes associated with MCI and allows for a deeper understanding of which diagnostic approaches best identify individuals at highest risk for dementia. Structural magnetic resonance imaging (MRI) markers are widely available and can complement biomarker approaches (e.g., cerebrospinal fluid, positron emission tomography [PET]) by capturing neurodegenerative and vascular contributions to cognitive impairment in vivo. This is particularly important in Veteran populations, who present with a higher prevalence of medical and mental health comorbidities that increase the likelihood of developing MCI and dementia (Desmarais et al., Reference Desmarais, Weidman, Wassef, Bruneau, Friedland, Bajsarowicz, Thibodeau, Herrmann and Nguyen2020; Gardner et al., Reference Gardner, Bahorik, Kornblith, Allen, Plassman and Yaffe2023). Posttraumatic stress disorder (PTSD), traumatic brain injury (TBI), and vascular risk factors are more common in Veterans than in the general population and have each been linked to cognitive decline and dementia risk (Li et al., Reference Li, Li, Li, Zhang, Zhao, Zhu, Tian and Lifshitz2017; Loignon et al., Reference Loignon, Ouellet and Belleville2020). A recent study by Ly et al. (Reference Ly, Adler, Ton Loy, Edmonds, Bondi and Delano-Wood2024) found that neuropsychologically defined MCI in Veterans within the DoD-ADNI cohort was associated with differences in cerebrospinal fluid biomarkers, highlighting the potential utility of these criteria in capturing underlying disease processes in this complex population. However, whether these criteria similarly outperform other MCI definitions in detecting structural imaging markers, particularly those reflecting both neurodegeneration and vascular pathology, has not been systematically evaluated in Veterans.
The current study sought to compare the utility of three diagnostic approaches for MCI (neuropsychological, typical, and ADNI criteria) in predicting neuroimaging biomarkers of dementia risk in a large, well-characterized sample of Vietnam-era Veterans without dementia. We hypothesized that neuropsychological criteria would demonstrate greater sensitivity to imaging-based indicators of neurodegeneration and cerebrovascular disease, specifically WMH burden, hippocampal volume, and cortical thickness, compared to typical and ADNI MCI criteria. This work aims to clarify the relative value of commonly used MCI criteria in identifying early brain changes linked to dementia, with particular relevance to aging Veterans with complex medical and psychiatric profiles.
Methods
Data used in the preparation of this article were obtained from the Department of Defense–Alzheimer’s Disease Neuroimaging Initiative (DoD-ADNI) database (adni.loni.usc.edu). The ADNI was launched in 2003 as a public–private partnership, led by Principal Investigator Michael W. Weiner, MD. The primary goal of ADNI has been to test whether serial MRI, PET, other biological markers, and clinical and neuropsychological assessment can be combined to measure the progression of MCI and early AD. The DoD-ADNI is a multi-site extension of ADNI designed to investigate the effects of TBI and PTSD on AD-related pathology in Vietnam-era Veterans (Weiner et al., Reference Weiner, Veitch, Hayes, Neylan, Grafman, Aisen, Petersen, Jack, Jagust, Trojanowski, Shaw, Saykin, Green, Harvey, Toga, Friedl, Pacifico, Sheline, Yaffe and Mohlenoff2014, Reference Weiner, Harvey, Hayes, Landau, Aisen, Petersen, Tosun, Veitch, Jack, Decarli, Saykin, Grafman and Neylan2017). Comprehensive methods, including recruitment, participant selection, and exclusion criteria, have been described previously and are available online (www.adni-info.org). Briefly, participants underwent structured clinical interviews, neuropsychological assessment, MRI, and collection of genetic and biomarker data. All procedures were approved by the Committee on Human Research at the University of California, San Francisco, the San Francisco VA Medical Center Research and Development Committee, and the Department of Defense Human Research Protection Office. Written informed consent was obtained from all participants in accordance with the Declaration of Helsinki.
Participants
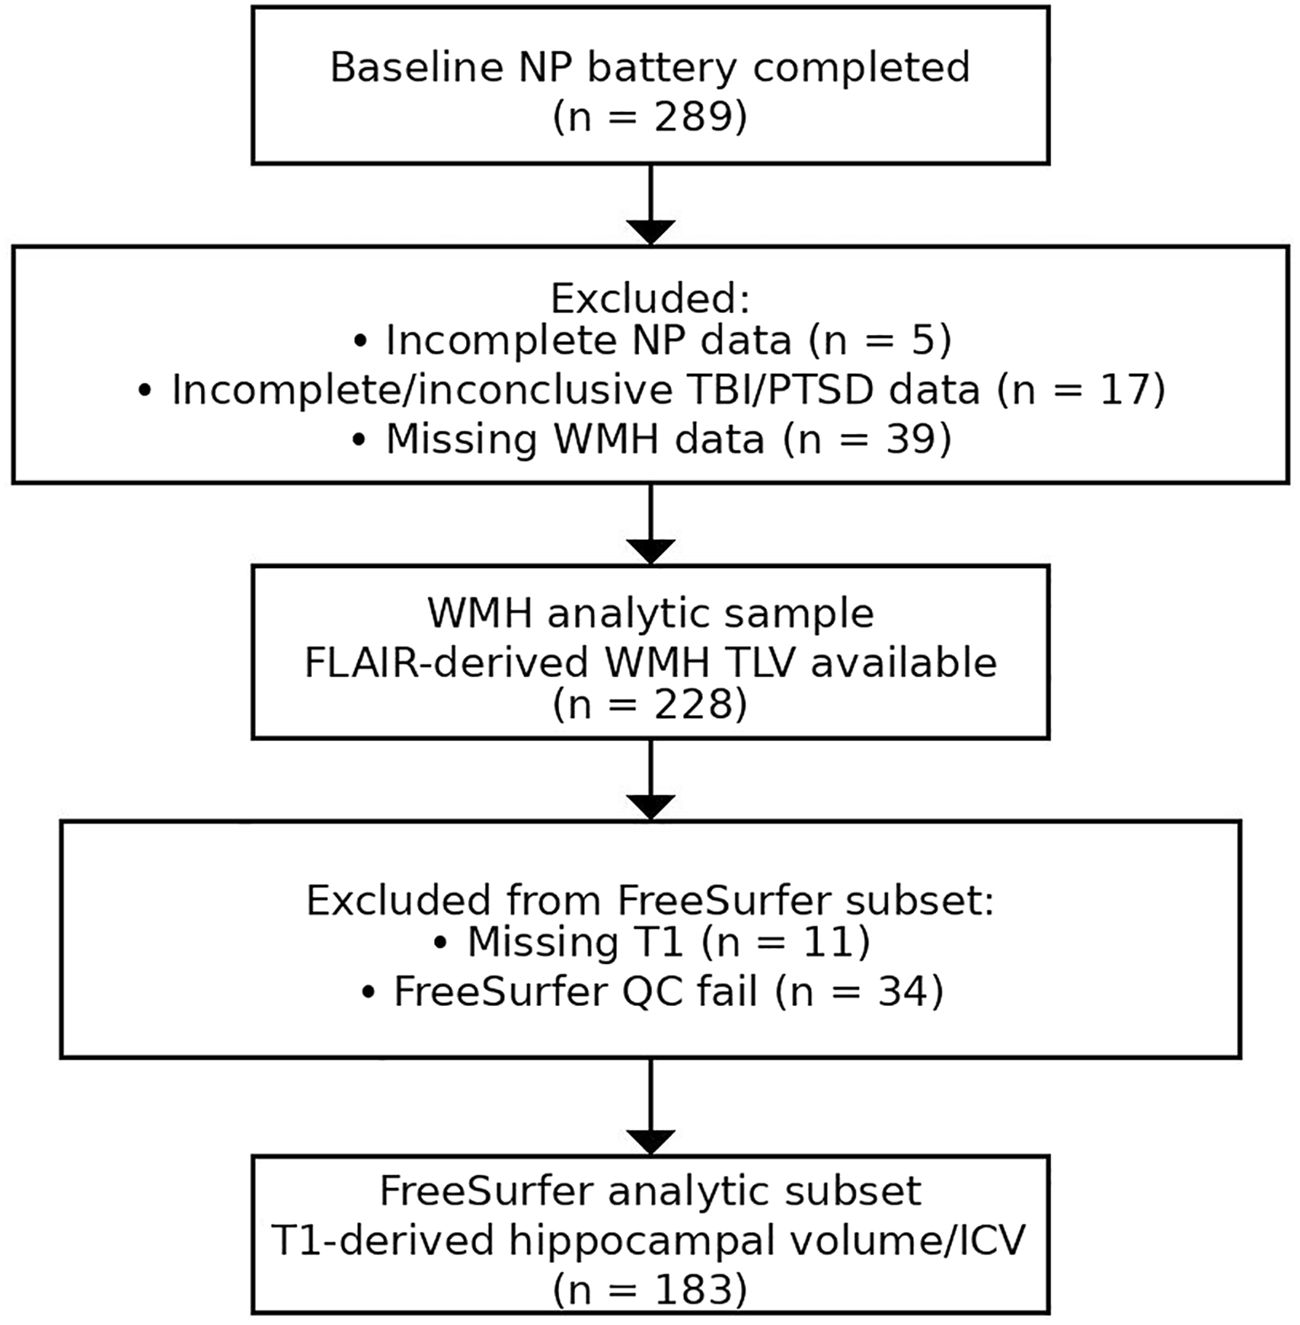
Vietnam-era veterans completed structured clinical interviews to obtain detailed TBI history and PTSD symptom severity, self-report assessments, blood draw for APOE genotyping, neuropsychological testing, and MRI. Apolipoprotein E (APOE) ϵ4 positivity was determined by the possession of at least one APOE ϵ4 allele. Neuropsychological testing and MRI were obtained at the baseline visit; TBI history, PTSD symptom severity (by the Clinician Administered PTSD Scale [CAPS]), Mini-Mental State Examination (MMSE), CDR, and subjective cognitive concerns were collected/confirmed during pre-baseline telephone screening. Participants with significant cognitive or functional impairment indicating dementia based on a CDR Global score ≥ 1 (Morris, Reference Morris1993) or an MMSE score <24 (Folstein et al., Reference Folstein, Folstein and McHugh1975) were excluded. Participant inclusion/exclusion and imaging-specific sample derivation are summarized in Figure 1. Briefly, participant flow proceeded from the full non-demented DoD-ADNI cohort with baseline neuropsychological testing (n = 289) to the analytic WMH sample (n = 228) and the FreeSurfer subset (n = 183), with participants excluded for incomplete neuropsychological data (n = 5), incomplete/inconclusive TBI/PTSD screening data (n = 17), missing WMH data (n = 39), missing T1 data (n = 11), and FreeSurfer QC failures (n = 34).
Participant flow diagram and exclusions for the analytic WMH sample and FreeSurfer subset.

Figure 1 Long description
The flowchart begins with 289 participants who completed the baseline NP battery. Five participants are excluded due to incomplete NP data, 17 due to incomplete or inconclusive TBI/PTSD data, and 39 due to missing WMH data. This results in a WMH analytic sample of 228 participants with FLAIR-derived WMH TLV available. From this sample, 11 participants are excluded due to missing T1 data, and 34 due to FreeSurfer QC failure. The final FreeSurfer analytic subset consists of 183 participants with T1-derived hippocampal volume/ICV.
TBI and PTSD
Detailed TBI history was obtained using a version of the Ohio State University TBI Identification Method-Interview form, which included information about the year of injury, whether the veteran was hospitalized, and the presence and duration of any loss of consciousness (LOC), alteration of consciousness (AOC), or post-traumatic amnesia (PTA). The severity of each injury was classified according to the Veterans Affairs/DoD 2021 Clinical Practice Guidelines (VA/DoD, 2021). An injury was classified as mild if the participant experienced LOC <30 minutes or AOC or PTA ≤24 hours, and moderate/severe if LOC ≥30 minutes or AOC or PTA >24 hours. Current PTSD symptom severity was measured using the CAPS for DSM-IV (Blake et al., Reference Blake, Weathers, Nagy, Kaloupek, Charney and Keane1998).
Neuropsychological assessment
Memory functioning for the ADNI criteria was assessed using the Wechsler Memory Scale – Revised (WMS-R) Logical Memory II subscale (Delayed Paragraph Recall, Paragraph A only). For the neuropsychological and typical criteria, two measures were used for each domain of memory, language, and processing speed/executive functioning, consistent with past literature and tests available in ADNI protocols (Bondi et al., Reference Bondi, Edmonds, Jak, Clark, Delano-Wood, McDonald, Nation, Libon, Au, Galasko and Salmon2014; Jak et al., Reference Jak, Bondi, Delano-Wood, Wierenga, Corey-Bloom, Salmon and Delis2009a). Memory measures included the Rey Auditory Verbal Learning Test (Schmidt, Reference Schmidt1996) delayed recall and recognition. Language measures included animal fluency and the 30-item Boston Naming Test (Kaplan et al., Reference Kaplan, Goodglass and Weintraub1983). Processing speed/executive functioning measures included the Trail Making Test Parts A and B (Reitan, Reference Reitan1956). Raw scores were converted to z-scores using age, sex, and education-adjusted norms (Stricker et al., Reference Stricker, Christianson, Lundt, Alden, Machulda, Fields, Kremers, Jack, Knopman, Mielke and Petersen2021; Weintraub et al., Reference Weintraub, Salmon, Mercaldo, Ferris, Graff-Radford, Chui, Cummings, DeCarli, Galasko, Peskind, Dietrich, Beekly, Kukull and Morris2009).
Criteria for MCI
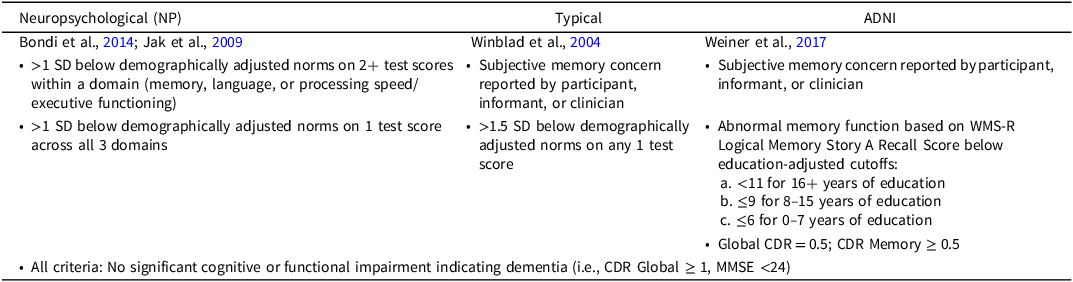
The three sets of diagnostic criteria for MCI are defined in Table 1. Subjective memory concerns were assessed from both the participant and their study partner and were coded as yes/no if either reported concerns.
Diagnostic criteria for mild cognitive impairment (MCI)

Table 1. Long description
A table comparing diagnostic criteria for mild cognitive impairment across different studies. The table has three columns labeled Neuropsychological, Typical, and ADNI, and seven rows including the header. The Neuropsychological column lists criteria from Bondi et al., 2014 and Jak et al., 2009, including scores below demographically adjusted norms in various domains. The Typical column lists criteria from Winblad et al., 2004, including subjective memory concern and specific test score thresholds. The ADNI column lists criteria from Weiner et al., 2017, including subjective memory concern, abnormal memory function based on WMS-R Logical Memory Story A Recall Score, and Global CDR criteria. All criteria emphasize no significant cognitive or functional impairment indicating dementia.
Note: SD = standard deviation; WMS-R = Wechsler Memory Scale Revised Edition; MMSE = Mini-Mental Status Examination; CDR = Clinical Dementia Rating.
MRI
Participants underwent 3D T1 (n = 183) and axial fluid attenuated inversion recovery (FLAIR; n = 228) sequences on qualified ADNI GE systems (Weiner et al., Reference Weiner, Veitch, Hayes, Neylan, Grafman, Aisen, Petersen, Jack, Jagust, Trojanowski, Shaw, Saykin, Green, Harvey, Toga, Friedl, Pacifico, Sheline, Yaffe and Mohlenoff2014). The discrepancy in available scans reflects quality control filtering, with some T1 scans excluded due to motion artifact or other image processing issues. Processed MRI summary measures were obtained from ADNI-provided downloadable datasets. WMH total lesion volume (TLV) was derived using UC Davis/UCD methodology (DeCarli laboratory), and FreeSurfer-derived cortical thickness and subcortical volumetric measures (UCSF FreeSurfer pipeline; FreeSurfer v5.1) were obtained from ADNI-provided processed datasets (Dale et al., Reference Dale, Fischl and Sereno1999; Fischl et al., Reference Fischl, Salat, Busa, Albert, Dieterich, Haselgrove, Van Der Kouwe, Killiany, Kennedy, Klaveness, Makris, Rosen and Dale2002, Reference Fischl, Salat, van der Kouwe, Makris, Ségonne, Quinn and Dale2004). Cortical thickness was calculated as the measure of the distance (in millimeters) between the gray/white matter boundary to the gray matter/cerebrospinal fluid boundary at each vertex on the cortical surface (Fischl & Dale, Reference Fischl and Dale2000). Each hemisphere was parcellated based on the Desikan-Killiany atlas (Desikan et al., Reference Desikan, Ségonne, Fischl, Quinn, Dickerson, Blacker, Buckner, Dale, Maguire, Hyman, Albert and Killiany2006). Frontal and temporal lobe composite measures were computed and then averaged across hemispheres for primary analyses. Frontal and temporal lobes were chosen based on research showing their vulnerability to damage from TBI (Stuss, Reference Stuss2011; Umile et al., 2022). Because we did not have a priori hypotheses regarding hemispheric asymmetries or diagnostic scheme × hemisphere interactions, hemisphere was not treated as a primary analytic factor. To limit the number of comparisons and reduce the likelihood of false positives, cortical thickness measures were averaged across hemispheres and hippocampal volume was operationalized as total (left + right) hippocampal volume for primary analyses. Formal laterality testing (e.g., asymmetry indices or mixed-effects models including hemisphere as a within-subject factor) was not conducted. WMHs were detected on FLAIR images using a validated, fully automated method that identifies hyperintense voxels using both voxel-wise intensities and a prior probability map of lesion distribution (Schwarz et al., Reference Schwarz, Fletcher, DeCarli and Carmichael2009; see also ADNI WMH Segmentation White Paper: https://adni.bitbucket.io/reference/docs/UCD_ADNI1_WMH). WMH TLV was log-transformed to normalize the distribution. ADNI applies standardized FreeSurfer quality control (QC) procedures based on visual inspection, and QC variables provided with the datasets indicate whether overall and regional segmentations/parcellations were rated as pass, fail, or partial (including frontal and temporal regions) (Weiner et al., Reference Weiner, Veitch, Hayes, Neylan, Grafman, Aisen, Petersen, Jack, Jagust, Trojanowski, Shaw, Saykin, Green, Harvey, Toga, Friedl, Pacifico, Sheline, Yaffe and Mohlenoff2014). Project-specific manual QC was not performed beyond these ADNI procedures; instead, participants without usable T1-weighted MRI and those failing FreeSurfer QC were excluded from FreeSurfer-based analyses, yielding the final analytic sample for FreeSurfer measures (n = 183).
Statistical analyses
Linear multiple regressions were conducted to examine the associations between MCI status (for each criterion separately) and a priori neuroimaging measures: log-TLV, hippocampal volume, and frontal and temporal cortical thickness. A data-driven covariate selection approach was used to avoid overfitting (Field-Fote, Reference Field-Fote2019). Variables significantly related (p < .05) to MCI status, or the imaging outcome of interest were retained. Age was included in all models due to its correlation with hippocampal volume (r = –.26, p < .001). CAPS score was included in ADNI models due to its association with ADNI-defined MCI. Intracranial volume (ICV) was included as a covariate in all regression models with volumetric outcomes, including hippocampal volume and WMH TLV, to account for individual differences in head size. Interaction terms between MCI status and hippocampal volume were examined to test whether the relationship between hippocampal atrophy and WMH burden differed by MCI group. Continuous predictors involved in interaction terms (e.g., total hippocampal volume) were mean centered prior to computing interaction terms so that the MCI main effect was interpretable at the mean hippocampal volume. Sensitivity analyses compared amnestic vs. non-amnestic MCI defined by neuropsychological criteria. Exploratory analyses examined associations of TBI severity and PTSD symptom severity with WMH burden (log-TLV) in separate regression models. In these models, TBI severity was dummy-coded (mild and moderate/severe, relative to no TBI) and PTSD symptom severity was represented by CAPS score; models included age and ICV as covariates. MCI diagnostic definition was not included in these exploratory models.
Results
Participant characteristics
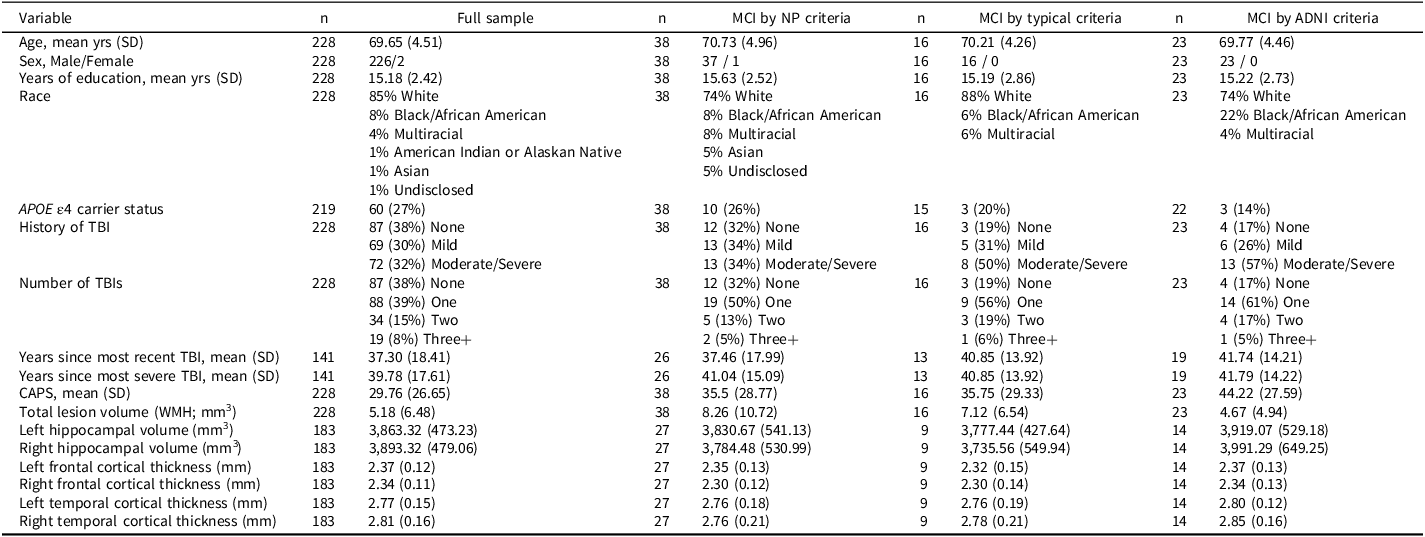
Participant characteristics by MCI status are presented in Table 2. APOE ϵ4 carrier status did not differ between MCI and cognitively normal groups across definitions (Fisher’s exact tests: NP p = .65; typical p = .44; ADNI p = .11). Diagnostic overlap across definitions in the imaging subset used for volumetric analyses (n = 183) was limited: 144 participants were classified as cognitively normal by all three definitions, whereas only 2 met all three MCI criteria; 23 met NP criteria only, 7 met ADNI criteria only, 5 met both typical and ADNI criteria without meeting NP criteria, and 2 met both NP and typical criteria without meeting ADNI criteria (see Ly et al., Reference Ly, Adler, Ton Loy, Edmonds, Bondi and Delano-Wood2024 for a comprehensive Venn diagram in a larger DoD-ADNI sample).
Participant characteristics and neuroimaging markers by MCI classification criteria. Values represent mean ± SD or N (%). FreeSurfer-derived measures (hippocampal volume and cortical thickness) are based on the subset with usable T1 and QC-passed FreeSurfer output (n = 183; NP CN n = 156, NP MCI n = 27; typical CN n = 174, typical MCI n = 9; ADNI CN n = 169, ADNI MCI n = 14)
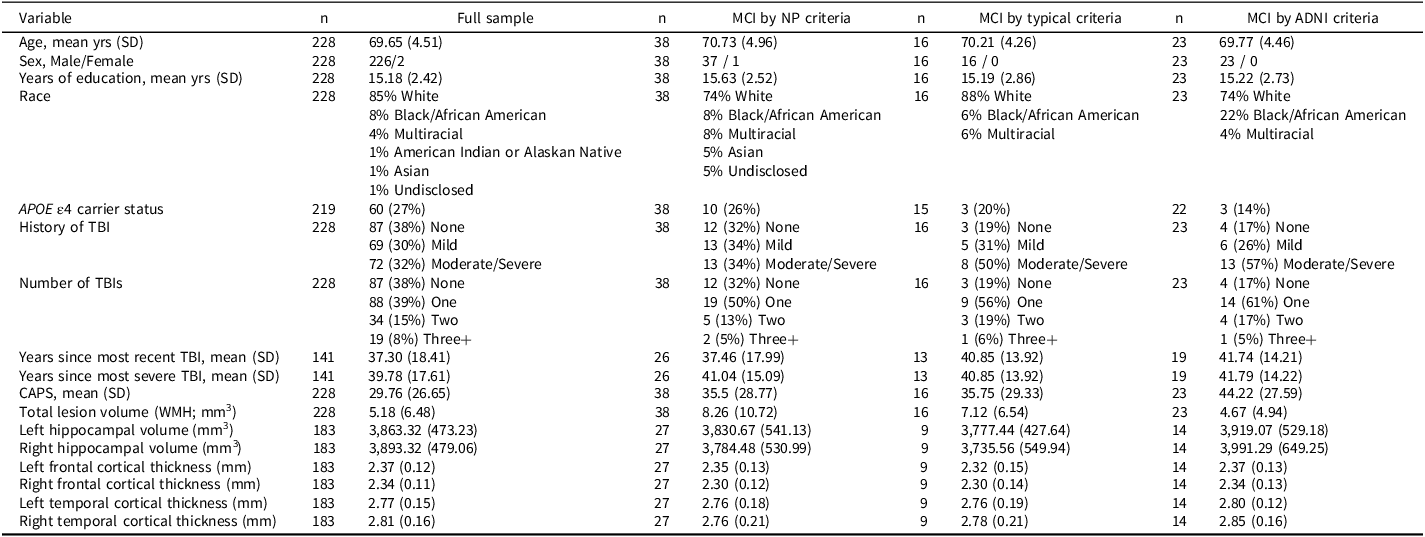
Table 2. Long description
The table presents participant characteristics by mild cognitive impairment (MCI) status, categorized by three different criteria: NP criteria, typical criteria, and ADNI criteria. The table includes various demographic and health-related variables such as age, sex, years of education, race, APOE 4 carrier status, history of traumatic brain injury (TBI), number of TBIs, years since most recent TBI, years since most severe TBI, CAPS score, total lesion volume, left and right hippocampal volumes, and cortical thickness measurements for the frontal and temporal regions. The table has 228 rows and 18 columns, with each column representing a different variable and each row representing a participant’s data. Notable trends include the distribution of age, sex, and years of education across different MCI statuses. The table also highlights the overlap and differences in MCI classification across the three criteria.
Note: SD = standard deviation; TBI = traumatic brain injury; CAPS = Clinician Administered Posttraumatic Stress Disorders Scale for Diagnostic and Statistical Manual of Mental Disorders, Fourth Edition; WMH = white matter hyperintensities.
Associations with neuroimaging measures
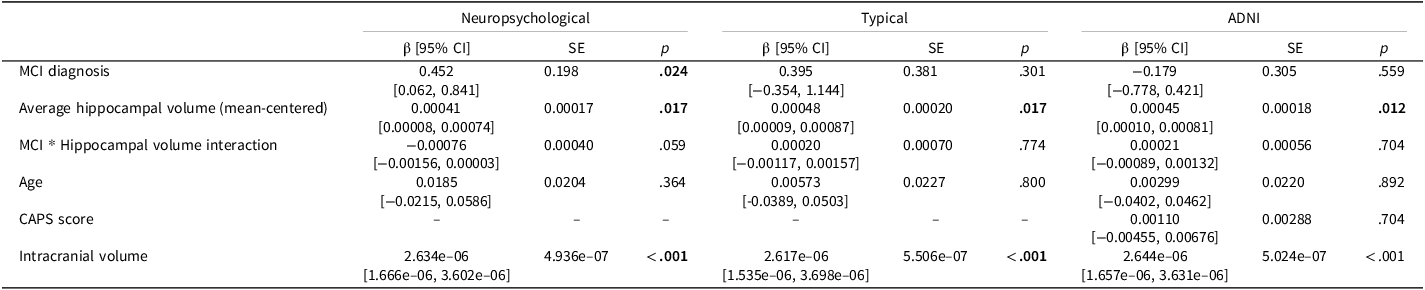
WMH models were conducted in the subset with FLAIR-derived WMH and usable T1 FreeSurfer-derived hippocampal volume/ICV (n = 183). After adjusting for age and ICV, neuropsychological MCI classification was associated with greater WMH burden (β = 0.45, 95% CI [0.06, 0.84], p = .024), whereas typical and ADNI-defined MCI were not (ps ≥.30) (Table 3). Hippocampal volume was significantly associated with WMH burden across criteria (ps ≤.017).
Multiple linear regressions showing the effect of MCI diagnosis by each criterion, bilateral average hippocampal volume (mean-centered), and the MCI × hippocampal volume interaction on log-transformed white matter hyperintensity (WMH) total lesion volume (n = 183). Models adjusted for age and intracranial volume; ADNI-based models additionally adjusted for CAPS. β values are regression coefficients with 95% confidence intervals in brackets

Table 3. Long description
The table presents results from multiple linear regressions analyzing the effect of mild cognitive impairment (MCI) diagnosis, bilateral average hippocampal volume, and the interaction between MCI and hippocampal volume on log-transformed white matter hyperintensity (WMH) total lesion volume. The table includes three models: Neuropsychological, Typical, and ADNI. Each model provides regression coefficients (beta values) with 95% confidence intervals, standard errors, and p-values for the variables MCI diagnosis, average hippocampal volume, MCI by hippocampal volume interaction, age, CAPS score, and intracranial volume. The table shows that MCI diagnosis has a significant effect in the Neuropsychological model but not in the Typical or ADNI models. Average hippocampal volume shows a significant effect across all models. The interaction between MCI and hippocampal volume is not significant in any model. Age and intracranial volume are significant in all models, while CAPS score is only included in the ADNI model and is not significant.
While MCI and hippocampal volume each predicted WMH separately for NP criteria, the interaction between the two variables did not predict WMH burden (β = −0.00076, 95% CI [−0.00156, 0.00003], p = .059) (Figure 2). Model fit indices suggested limited incremental improvement from including the interaction term (NP main-effects model: AIC = 503.59, BIC = 519.64; interaction model: AIC = 503.89, BIC = 526.36). The interaction was also not significant for typical and ADNI criteria (ps ≥.70).
Relationship between hippocampal volume and log-transformed WMH TLV in cognitively normal and MCI groups (neuropsychological criteria). Regression lines are adjusted for age; shaded areas represent 95% confidence intervals.

Figure 2 Long description
A scatter plot illustrates the relationship between hippocampal volume and log-transformed white matter hyperintensity total lesion volume (TLV) in cognitively normal (CN) and mild cognitive impairment (MCI) groups. The x-axis represents hippocampal volume in cubic millimeters, ranging from 2500 to 5500. The y-axis represents the log-transformed white matter hyperintensity TLV, ranging from -2 to 4. The data points are color-coded: red for cognitively normal individuals and blue for those with mild cognitive impairment. Regression lines for each group are adjusted for age, with shaded areas representing 95% confidence intervals. The plot shows a slight positive trend for the cognitively normal group and a slight negative trend for the MCI group. The data points are scattered with no distinct clusters or outliers. All values are approximated.
Regarding neurodegenerative markers, typical criteria were associated with smaller average hippocampal volume after adjusting for age and ICV (β = −316.14, p = .019), whereas NP and ADNI criteria were not significantly associated with hippocampal volume. No MCI definition was associated with frontal or temporal cortical thickness (all ps > .10; Table 4).
Multiple linear regressions showing the effect of mild cognitive impairment (MCI) diagnosis by each criterion on average hippocampal volume and average frontal and temporal cortical thickness (n = 183). Models adjusted for age and intracranial volume; ADNI-based models additionally adjusted for CAPS. β values are regression coefficients with 95% confidence intervals in brackets

Table 4. Long description
The table presents data from multiple linear regressions showing the effect of mild cognitive impairment (MCI) diagnosis on average hippocampal volume and average frontal and temporal cortical thickness. The table includes three main columns: Neuropsychological, Typical, and ADNI, each with sub-columns for beta values, standard errors, and p-values. The rows represent different neuroimaging markers: average hippocampal volume, average frontal cortical thickness, and average temporal cortical thickness. Notable trends include a significant association between typical criteria and smaller average hippocampal volume, with a beta value of negative 316.14 and a p-value of 0.019. No significant associations are observed for frontal or temporal cortical thickness across all criteria.
Note. Bolded items indicate p < .05, which were considered statistically significant.
In a sensitivity check for ADNI-based WMH models, removing CAPS did not change inferences (MCI coefficient with CAPS: β = −0.18, p = .519; without CAPS: β = −0.15, p = .580). ADNI-defined MCI also remained non-significant in hippocampal volume models with or without CAPS (β = −27.8, p = .805 with CAPS; β = −40.4, p = .712 without CAPS).
Sensitivity analyses: Amnestic vs. Non-amnestic MCI
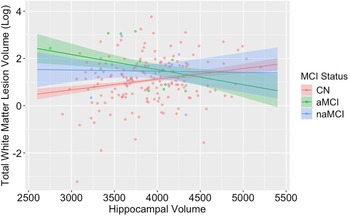
Sensitivity analyses were restricted to NP-defined MCI participants with usable FreeSurfer-derived volumetric data (n = 27), consistent with the stated FreeSurfer subset (n = 183); this subset comprised amnestic (n = 15) and non-amnestic (n = 12) subgroups. Compared to cognitively normal participants, the amnestic NP MCI subgroup showed greater WMH burden (β = 0.57, p = .027). Amnestic NP MCI and lower hippocampal volume interacted to predict greater WMH burden (β = −0.00107, p = .028), whereas the non-amnestic subgroup did not show a hippocampal volume interaction (β = −0.00030, p = .702). (Figure 3)
Relationship between hippocampal volume and log-transformed WMH TLV in cognitively normal, amnestic MCI, and non-amnestic MCI groups (neuropsychological criteria). Regression lines are adjusted for age; shaded areas represent 95% confidence intervals.

Figure 3 Long description
A scatter plot illustrates the relationship between hippocampal volume and log-transformed total white matter lesion volume in cognitively normal, amnestic MCI, and non-amnestic MCI groups. The x-axis represents hippocampal volume in cubic millimeters, ranging from 2500 to 5500. The y-axis represents the log-transformed total white matter lesion volume, ranging from negative 2 to 4. The plot includes hundreds of data points, color-coded by cognitive status: red for cognitively normal (CN), green for amnestic MCI (aMCI), and blue for non-amnestic MCI (naMCI). Regression lines for each group are adjusted for age, with shaded areas representing 95% confidence intervals. The cognitively normal group shows a slight positive trend, the amnestic MCI group shows a slight negative trend, and the non-amnestic MCI group shows a flat trend. The data points are scattered with some clustering and no significant outliers. All values are approximated.
In a separate sensitivity analysis, the interaction between NP criteria and hippocampal volume was statistically significant after adjusting for the presence of hypertension (β = −0.00080, 95% CI [−0.00159, −0.00001], p = .046).
Exploratory analyses: TBI and PTSD
Exploratory regressions examined whether worst lifetime TBI severity and PTSD symptom severity were associated with WMH burden (log TLV), adjusting for age and ICV; MCI status was not included in these models. Neither TBI severity (mild: β = −0.12, p = .46; moderate/severe: β = −0.20, p = .21) nor PTSD symptom severity (β = −0.01, p = .90) was significantly associated with WMH burden (log-TLV).
Discussion
This study compared three common MCI diagnostic frameworks in their ability to detect neuroimaging markers of dementia risk in a large, well-characterized cohort of aging Veterans. In line with our hypotheses, neuropsychological criteria were significantly associated with WMH burden in ICV-adjusted models and identified an amnestic MCI group × hippocampal volume interaction predicting WMH burden, a pattern absent in both ADNI and typical criteria. These findings indicate that neuropsychological methods may be particularly sensitive to the combined effects of gray and white matter pathology, which are increasingly recognized as synergistic drivers of cognitive decline (Fiford et al., 2016; van Leijsen et al., 2018).
The specificity of MCI group × hippocampal volume interaction predicting WMH burden in amnestic MCI suggests that hippocampal atrophy may exacerbate the impact of cerebrovascular burden on memory networks. This aligns with prior evidence linking vascular pathology and medial temporal atrophy to accelerated cognitive decline, particularly in memory-predominant presentations (Rizvi et al., Reference Rizvi, Lao, Chesebro, Dworkin, Amarante, Beato, Gutierrez, Zahodne, Schupf, Manly, Mayeux and Brickman2021; Swardfager et al., Reference Swardfager, Cogo-Moreira, Masellis, Ramirez, Herrmann, Edwards, Saleem, Chan, Yu, Nestor, Scott, Holmes, Sahlas, Kiss, Oh, Strother, Fuqiang, Stefanovic, Keith, Keith and Black2018). From a clinical standpoint, the ability of neuropsychological criteria to capture these co-occurring processes could improve early detection of high-risk cognitive phenotypes, allowing for more precise prognostic counseling and earlier intervention (Delano-Wood et al., Reference Delano-Wood, Bondi, Sacco, Abeles, Jak, Libon and Bozoki2010; Ye et al., Reference Ye, Seo, Kim, Kim, Yoon, Kim and Lee2017; Zhang et al., Reference Zhang, Katz, Derby and Lipton2015).
In ICV-adjusted models, neuropsychological criteria were associated with greater WMH burden, whereas typical and ADNI criteria were not. In contrast, typical criteria showed associations with hippocampal volume, which may reflect differences in the cognitive phenotype captured by each framework. This pattern underscores the advantage of multi-test, multi-domain assessment over single-test cutoffs or reliance on subjective memory complaints, which are susceptible to misclassification (Bondi et al., Reference Bondi, Edmonds, Jak, Clark, Delano-Wood, McDonald, Nation, Libon, Au, Galasko and Salmon2014; Edmonds et al., Reference Edmonds, Delano-Wood, Galasko, Salmon and Bondi2014, Reference Edmonds, Eppig, Bondi, Leyden, Goodwin, Delano-Wood and McDonald2016). Importantly, this advantage was observed in a Veteran cohort with high rates of psychiatric and vascular comorbidity, factors that can obscure or complicate early cognitive change (Clark et al., Reference Clark, Sorg, Schiehser, Luc, Bondi, Sanderson, Werhane and Delano-Wood2016; Desmarais et al., Reference Desmarais, Weidman, Wassef, Bruneau, Friedland, Bajsarowicz, Thibodeau, Herrmann and Nguyen2020; Gardner et al., Reference Gardner, Bahorik, Kornblith, Allen, Plassman and Yaffe2023).
In the current sample, although subjective concern was not required for NP-defined MCI, 26% (10/38) of participants classified as NP-MCI endorsed subjective memory concerns by self-or partner-report. This underscores that a subset of NP-MCI participants would also meet the subjective complaint component of typical/ADNI frameworks, while the majority would not – consistent with the possibility that complaint-based requirements may differentially influence classification in this cohort. These findings highlight that agreement across MCI operational definitions is limited in this Veteran cohort. A more comprehensive overlap comparison across the three approaches in a larger DoD-ADNI sample (including a Venn diagram) is reported in Ly et al. (Reference Ly, Adler, Ton Loy, Edmonds, Bondi and Delano-Wood2024), and readers are referred to that work for a broader depiction of diagnostic concordance/discordance.
Accordingly, the influence of PTSD and TBI on diagnostic classification may differ across MCI frameworks. In Veterans, PTSD symptoms and TBI history may differentially influence MCI classification depending on the diagnostic framework. Criteria that require subjective cognitive concern (typical and ADNI) may be more sensitive to variability in symptom reporting and perceived cognitive change in the context of PTSD-related distress and/or TBI history, which could contribute to differences in classification relative to approaches emphasizing objective performance patterns. In contrast, neuropsychological criteria focus on a consistent pattern of objective impairment across multiple tests and/or domains and may identify cognitive compromise even when subjective concerns are absent or difficult to interpret in medically and psychiatrically complex populations. This Veteran-specific issue is examined in more depth in Ly et al. (Reference Ly, Adler, Ton Loy, Edmonds, Bondi and Delano-Wood2024), which evaluated the effects of PTSD symptom severity and TBI severity on MCI classification across neuropsychological, typical, and ADNI criteria in a larger DoD-ADNI sample.
In our regression models, MCI status (across all three diagnostic schemes) was not significantly associated with frontal or temporal cortical thickness. The absence of cortical thickness differences across MCI criteria may reflect the limitations of gross morphometric measures in detecting early neurodegenerative change, particularly in the presence of mixed pathology (Kapasi et al., Reference Kapasi, DeCarli and Schneider2017). Alternatively, this null finding may be sample-specific, as Veterans in this cohort may exhibit more heterogeneous atrophy patterns due to TBI, PTSD, or vascular burden (Li et al., Reference Li, Li, Li, Zhang, Zhao, Zhu, Tian and Lifshitz2017; Loignon et al., Reference Loignon, Ouellet and Belleville2020; Umile et al., Reference Umile, Sandel, Alavi, Terry and Plotkin2002).
Notably, the three operational definitions yielded different MCI prevalence rates in this cohort (NP n = 38 vs typical n = 16 vs ADNI n = 23). These differences likely reflect the distinct requirements of each framework with the NP approach emphasizing a consistent pattern of objective impairment across multiple tests and/or domains rather than reliance on a single low score or subjective concern. Multi-test/multi-domain requirements were developed to improve diagnostic stability and reduce misclassification associated with single-test thresholds. Consistent with clinical relevance, the NP-defined MCI group also demonstrated neuroimaging associations with WMH burden in ICV-adjusted models and an MCI group × hippocampal volume interaction predicting WMH burden that was evident in sensitivity analyses.
Several limitations of the current study should be noted. Given the cross-sectional design, we cannot determine whether higher case identification reflects greater sensitivity to early impairment versus potential false positives. Longitudinal follow-up examining progression and clinical outcomes will be important to establish predictive validity and comparative performance across operational definitions. In addition, differences in MCI group sizes across diagnostic frameworks may have influenced statistical power to detect interaction effects; therefore, nonsignificant MCI × hippocampal volume interactions for typical and ADNI criteria should not be interpreted as evidence that such effects are absent. Sensitivity analyses excluding CAPS from ADNI-based models yielded substantively unchanged results, indicating that the null ADNI-MCI associations in this sample were not driven by inclusion of PTSD symptom severity as a covariate. Additionally, future work should explore the regional distribution of WMHs (e.g., periventricular vs. deep), incorporate microstructural measures such as diffusion tensor imaging, and evaluate whether the observed hippocampal–WMH interaction extends to functional connectivity metrics. Given the overwhelmingly male composition of this sample, replication in more gender-diverse Veteran cohorts is also warranted.
Taken together, these results add to growing evidence that comprehensive neuropsychological criteria outperform more limited diagnostic frameworks in detecting clinically relevant brain changes (Bondi et al., Reference Bondi, Edmonds, Jak, Clark, Delano-Wood, McDonald, Nation, Libon, Au, Galasko and Salmon2014; Ly et al., Reference Ly, Adler, Ton Loy, Edmonds, Bondi and Delano-Wood2024). In high-comorbidity populations such as Veterans, adopting empirically derived approaches may improve diagnostic precision and risk stratification. Clinically, multi-test neuropsychological approaches may be especially informative when comprehensive assessment is available and when cognitive findings are interpreted in the context of common Veteran comorbidities (e.g., PTSD symptom burden and TBI history), which may influence both subjective concerns and cognitive performance patterns.
Acknowledgments
We thank all the veterans for their generous participation in this DOD-ADNI study.
Funding statement
Data collection and sharing for the Alzheimer’s Disease Neuroimaging Initiative (ADNI) is funded by the National Institute on Aging (National Institutes of Health Grant U19 AG024904). The grantee organization is the Northern California Institute for Research and Education. In the past, ADNI has also received funding from the National Institute of Biomedical Imaging and Bioengineering, the Canadian Institutes of Health Research, and private sector contributions through the Foundation for the National Institutes of Health (FNIH) including generous contributions from the following: AbbVie, Alzheimer’s Association; Alzheimer’s Drug Discovery Foundation; Araclon Biotech; BioClinica, Inc.; Biogen; Bristol-Myers Squibb Company; CereSpir, Inc.; Cogstate; Eisai Inc.; Elan Pharmaceuticals, Inc.; Eli Lilly and Company; EuroImmun; F. Hoffmann-La Roche Ltd. and its affiliated company Genentech, Inc.; Fujirebio; GE Healthcare; IXICO Ltd.; Janssen Alzheimer Immunotherapy Research & Development, LLC.; Johnson & Johnson Pharmaceutical Research &Development LLC.; Lumosity; Lundbeck; Merck & Co., Inc.; Meso Scale Diagnostics, LLC.; NeuroRx Research; Neurotrack Technologies; Novartis Pharmaceuticals Corporation; Pfizer Inc.; Piramal Imaging; Servier; Takeda Pharmaceutical Company; and Transition Therapeutics. The DOD-ADNI study was also funded by Department of Defense (grant numbers W81XWH-12-2-0012, W81XWH-13-1-0259, and W81XWH-14-1-0462).
Competing interests
Dr Matchanova is currently an employee of Denali Therapeutics Inc. Denali Therapeutics Inc. had no role in the study design, analysis, interpretation of data, manuscript preparation, or the decision to submit for publication. All other authors declare no conflicts of interest.



 Open access

