

INTRODUCTION
Dry forests are the most threatened tropical forest type in South America, with only 10% of their cover remaining in tropical America (Banda-R et al., Reference Banda-R, Delgado-Salinas, Dexter, Linares-Palomino, Oliveira-Filho, Prado and Pullan2016). Their threatened status is largely due to their presence on fertile soils suitable for agriculture, which has led to higher rates of deforestation and fragmentation compared with humid rainforests in South America, which tend to grow on less fertile soils (Janzen, Reference Janzen and Wilson1988; DeFries et al., Reference DeFries, Hansen, Newton and Hansen2004). Tropical dry forests are also less well studied than humid evergreen forests, such as the Amazon rainforest, perhaps due to their lower species richness (Banda-R et al., Reference Banda-R, Delgado-Salinas, Dexter, Linares-Palomino, Oliveira-Filho, Prado and Pullan2016). However, the biological significance and unique evolutionary history of the dry forest biome has become increasingly apparent in recent years, leading to greater prioritisation for conservation (Banda-R et al., Reference Banda-R, Delgado-Salinas, Dexter, Linares-Palomino, Oliveira-Filho, Prado and Pullan2016).
Dry forests occur in highly seasonal climates with a pronounced dry period where rainfall is less than 1600 mm/year with at least 5–6 months receiving less than 100 mm (Gentry, Reference Gentry, Bullock, Mooney and Medina1995). They are deciduous to semideciduous, closed-canopy ecosystems with a minor grass component in the understorey (Pennington et al., Reference Pennington, Prado and Pendry2000). The focus of this paper is on the Chiquitano dry forest of eastern Bolivia, which is located between humid evergreen Amazonian rainforests to the north, dry Chaco thorn–scrub to the south, and Pantanal seasonally flooded savannahs to the east (Killeen and Schulenberg, Reference Killeen and Schulenberg1998; Killeen et al., Reference Killeen, Chavez, Pena-Claros, Toledo, Arroyo, Caballero, Correa, Pennington, Lewis and Ratter2006). Interspersed among this dry forest are patches of upland (cerrado) savannah. The Chiquitano dry forest is the largest block of intact seasonally dry tropical forest in South America and has been identified as a priority ecoregion for conservation, due to its highly threatened status (Olson et al., Reference Olson, Dinerstein, Wikramanayake, Burgess, Powell, Underwood and D'amico2001). In addition to the pressures from deforestation and fragmentation, the dry forest may also be threatened by climate change, as most climate models predict reduced precipitation for tropical South America in the coming century (Malhi et al., Reference Malhi, Roberts, Betts, Killeen, Li and Nobre2008, Reference Malhi, Aragao, Galbraith, Huntingford, Fisher, Zelazowski, Sitch, McSweeney and Meir2009; Duffy et al., Reference Duffy, Brando, Asner and Field2015; Sánchez et al., Reference Sánchez, Solman, Remedio, Berbery, Samuelsson, Rocha and Mourão2015). In particular, in southern Amazonia, models predict a late onset of the rainy season and a longer dry season (Marengo et al., Reference Marengo, Chou, Torres, Giarolla, Alves and Lyra2014) and a 30% reduction in precipitation over the Pantanal basin (Marengo et al., Reference Marengo, Alves and Torres2016).
Dry forest and upland (cerrado) savannah grow under similar climatic conditions and typically have a mosaic distribution governed by edaphic factors. Dry forests tend to occur on calcareous soils of intermediate to high fertility (Nunes da Cunha et al., Reference Nunes da Cunha, Junk and Leitão Filho2007), whereas cerrado savannahs tend to occur on shallower soils with poor fertility (Sarmiento and Monasterio, Reference Sarmiento, Monasterio, Golley and Medina1975; Jardim et al., Reference Jardim, Killeen, Fuentes and Rumiz2003) and low calcium levels (Ratter et al., Reference Ratter, Pott, Pott, Nunes da Cunha and Haridasan1988; Dubs, Reference Dubs, Furley, Proctor and Ratter1992). However, the relationships among edaphic factors, climate change, and fire regime in controlling dry forest–savannah ecotonal dynamics are poorly understood. Drier climatic conditions may indirectly influence dry forest–savannah ecotones by driving an increase in fire frequency, in turn leading to upland savannah expansion due to the greater fire tolerance/adaptation of upland savannah tree taxa compared with dry forest tree taxa (Pennington et al., Reference Pennington, Lavin and Oliveira-Filho2009). While fire has been shown to be a persistent feature of the Chiquitano dry forest throughout the Holocene (Power et al., Reference Power, Whitney, Mayle, Neves, Boer and Maclean2016), the sensitivity of the Chiquitano dry forest–savannah ecotone to the combination of drought and fire has not been explored. Furthermore, a study by Power et al. (Reference Power, Whitney, Mayle, Neves, Boer and Maclean2016) suggests that the primary driver of floristic turnover within the Chiquitano dry forest during the Holocene may have been climate, as some taxa are better adapted to water stress than others. Therefore, it is possible that drier climatic conditions may cause floristic turnover within the forest, even if full biome turnover is not achieved (i.e., replacement of dry forest by upland savannah). However, because the Power et al. (Reference Power, Whitney, Mayle, Neves, Boer and Maclean2016) study is based on a single lake sediment core, the broader-scale implications of this study are open to question. More palaeoecological records are needed to better elucidate the long-term, potentially complex interactions among tropical dry forests, climate, fire, and edaphic factors.
During the mid-Holocene, between 9000 and 3000 cal yr BP, the Southern Hemisphere tropics of South America experienced significantly drier climatic conditions, potentially driven by a weakening of the South American summer monsoon, linked to changes in solar insolation (Cruz et al., Reference Cruz, Vuille, Burns, Wang, Cheng, Werner, Lawrence Edwards, Karmann, Auler and Nguyen2009; Prado et al., Reference Prado, Wainer, Chiessi, Ledru and Turcq2013). This drier climatic period is evident in palaeoclimate records from the Andes to the lowlands of Bolivia and Brazil. In the Andes, lake level at Laguna Titicaca dropped to 100 m below present levels between 6000 and 5000 cal yr BP (Baker et al., Reference Baker, Seltzer, Fritz, Dunbar, Grove, Tapia, Cross, Rowe and Broda2001). Dust and pollen records from ice cores from Sajama Mountain in Bolivia (Thompson, Reference Thompson1998; Reese et al., Reference Reese, Liu and Thompson2013) and oxygen isotopes from sediment records from Laguna Junin in Peru (Seltzer et al., Reference Seltzer, Rodbell and Burns2000) and from Laguna Pamachoca in Peru (Bird et al., Reference Bird, Abbott, Rodbell and Vuille2011) confirm the mid-Holocene drier period in the Andes. Pollen records from Lagunas Chaplin and Bella Vista in eastern Bolivia confirm that the mid-Holocene drier period extended to the lowlands (Burbridge et al., Reference Burbridge, Mayle and Killeen2004). In the Pantanal lowlands, this period is confirmed by a speleothem record from Jaraguá Cave (Novello et al., Reference Novello, Cruz, Vuille, Stríkis, Edwards, Cheng and Emerick2017); phytolith and sponge spicule records from Laguna Negra (Rasbold et al., Reference Rasbold, McGlue, Stevaux, Parolin, Silva and Bergier2019); and pollen, geochemical, sedimentary, and Pediastrum records from Laguna La Gaiba at the eastern margin of the Chiquitano dry forest (Whitney et al., Reference Whitney, Mayle, Punyasena, Fitzpatrick, Burn, Guillen, Chavez, Mann, Pennington and Metcalfe2011; McGlue et al., Reference McGlue, Silva, Zani, Corradini, Parolin, Abel and Cohen2012; Whitney and Mayle, Reference Whitney and Mayle2012; Metcalfe et al., Reference Metcalfe, Whitney, Fitzpatrick, Mayle, Loader, Street-Perrott and Mann2014).
Records from Laguna La Gaiba also provide evidence that the mid-Holocene drier climate probably took the form of a longer dry season rather than lower mean annual precipitation (Whitney et al., Reference Whitney, Mayle, Punyasena, Fitzpatrick, Burn, Guillen, Chavez, Mann, Pennington and Metcalfe2011). As this is the same pattern of precipitation change that is predicted for the region by climate models (Marengo et al., Reference Marengo, Chou, Torres, Giarolla, Alves and Lyra2014; Duffy et al., Reference Duffy, Brando, Asner and Field2015), it provides a potential analog for the impacts of future climate change–induced droughts in the region. The long-term impacts of the mid-Holocene drier climate on the dry forest and ecotone with upland savannah may therefore provide insights into the likely impact of a predicted future drier climate upon these threatened tropical forests.
The responses of tropical dry forests and upland savannahs to the mid-Holocene drier period are not well understood, partly due to the lack of sufficiently old, permanent lakes within the dry forest biome from which palaeo-vegetation records can be drawn. In the Chiquitano dry forest of Bolivia, there are only three lake sites for which palaeo-vegetation records for the Holocene have been published—Laguna Yuguarú in the central lowlands of Bolivia (Taylor et al., Reference Taylor, Horn, Mora, Orvis and Cooper2010) and Lagunas Negra and La Gaiba at the eastern edge of the Chiquitano forest on the Bolivian–Brazilian border (Whitney et al., Reference Whitney, Mayle, Punyasena, Fitzpatrick, Burn, Guillen, Chavez, Mann, Pennington and Metcalfe2011; Rasbold et al., Reference Rasbold, McGlue, Stevaux, Parolin, Silva and Bergier2019). As the record from Yuguarú only covers the last 6000 yr, it does not span the full duration of the mid-Holocene drier period, and therefore precludes thorough investigation of the impacts of this period on the dry forest vegetation at this site. The sponge spicule and phytolith record from Laguna Negra spans the Pleistocene to the present, providing an environmental reconstruction of flooding in the Pantanal, but not a vegetation reconstruction for the dry forest (Rasbold et al., Reference Rasbold, McGlue, Stevaux, Parolin, Silva and Bergier2019). Laguna La Gaiba is the only palaeoecological record in the Chiquitano dry forest region that spans the onset and termination of the mid-Holocene drier period. The 45,000 year Laguna La Gaiba record shows that dry forest has been present since ~19,500 cal yr BP, maintaining closed-canopy forest throughout, with some floristic shifts during the mid-Holocene drier period towards more drought-tolerant taxa (Whitney et al., Reference Whitney, Mayle, Burn, Guillén, Chavez and Pennington2014).
However, the degree to which the fossil pollen record from Laguna La Gaiba—a single core from a large lake with a complex catchment of dry forest and seasonally flooded savannah wetlands—represents a robust signature of the broader-scale vegetation history of the Chiquitano dry forest is uncertain. Furthermore, the scarcity of upland savannah in the lake catchment means that the pollen record of this site is unlikely to be sensitive to local-scale dry forest–upland savannah ecotonal dynamics. Additional palaeoecological records, closer to the forest–savannah ecotone, are therefore needed to obtain a more robust understanding of the impact of lower mid-Holocene precipitation upon this dry forest ecosystem.
The aim of this paper is to produce a Holocene palaeoecological record from Laguna Mandioré—a dry forest lake 20 km to the south of Laguna La Gaiba—to improve understanding of the long-term impacts of drier climatic conditions during the mid-Holocene upon the Bolivian Chiquitano tropical dry forest. Specifically, we will test three hypotheses. First, due to the edaphic constraints on the position of the dry forest–upland savannah ecotone, we hypothesise that the ecotone remained static during the mid-Holocene drier period. Second, we hypothesise that the dry forest maintained a closed canopy throughout the mid-Holocene drier period, with some floristic changes, as shown at Laguna La Gaiba (Whitney et al., Reference Whitney, Mayle, Punyasena, Fitzpatrick, Burn, Guillen, Chavez, Mann, Pennington and Metcalfe2011, 2014). Third, we hypothesise that the dominant control on vegetation changes in the Chiquitano dry forest during the Holocene is climate, rather than fire, as shown at Laguna La Gaiba (Power et al., Reference Power, Whitney, Mayle, Neves, Boer and Maclean2016).
STUDY AREA AND SITE SELECTION
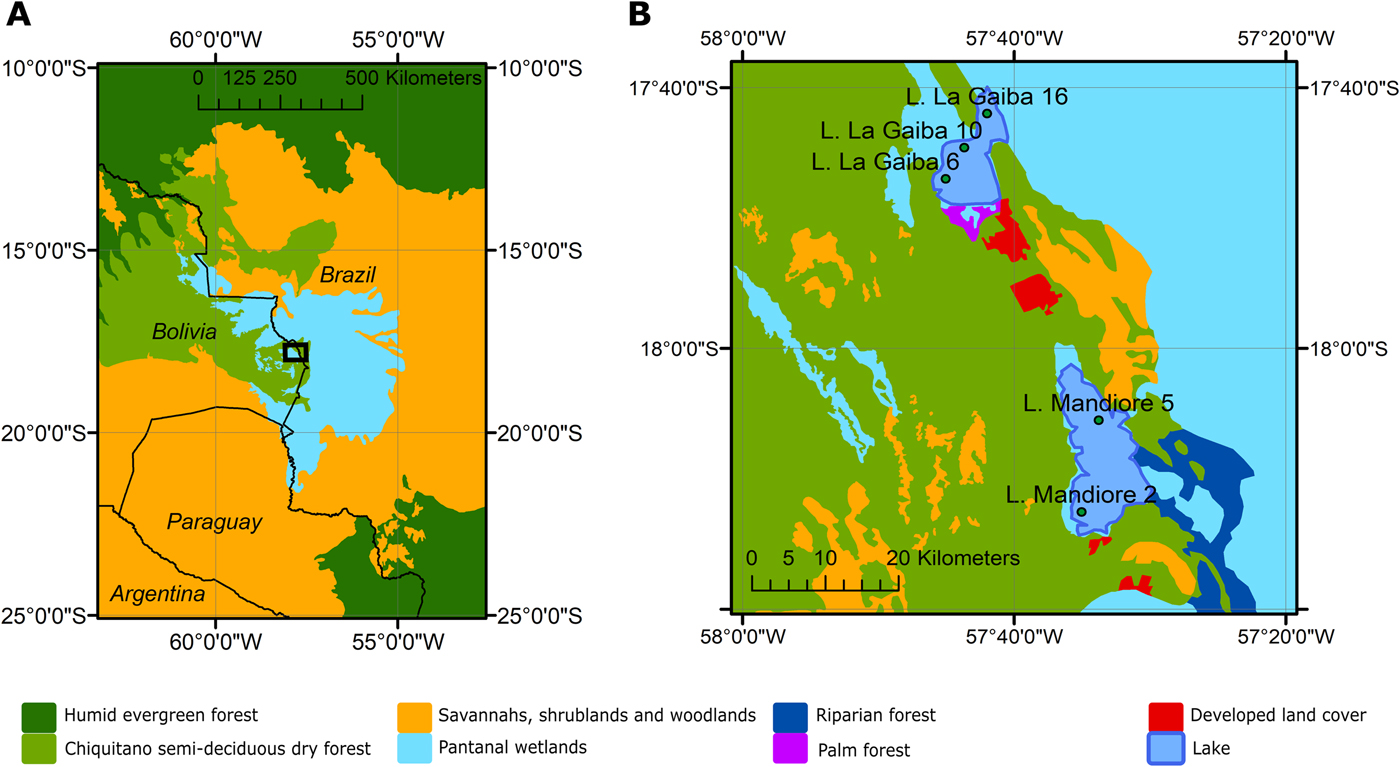
The study area of eastern lowland Bolivia is covered to a large extent by Chiquitano tropical dry forests, which occupy a transition zone between Amazonian humid evergreen forests to the north and dry Chaco thorn–scrub and savannah to the south and east, respectively (Killeen and Schulenberg, Reference Killeen and Schulenberg1998; Killeen et al., Reference Killeen, Chavez, Pena-Claros, Toledo, Arroyo, Caballero, Correa, Pennington, Lewis and Ratter2006; Fig. 1).
(color online) (A) A map of the study region with black box outlining study area. (B) Zoomed-in map of the study area with vegetation types surrounding Lagunas Mandioré and La Gaiba and the multiple surface-sample locations from each lake.
The Chiquitano dry forests are characterized by pronounced seasonality in rainfall distribution, being semideciduous during the dry season, with the degree of deciduousness increasing as rainfall declines. They are tree-dominated, closed-canopy ecosystems, with a minor grass component, tending to have a smaller size structure and thornier species than humid evergreen forests (Pennington et al., Reference Pennington, Prado and Pendry2000). The woody flora tends to be dominated by Fabaceae and Bignoniaceae (with particularly high abundances of Tabebuia), with floristic variation according to proximity to ecotones and type of geological substrate. Additional key taxa that are common across the biome include: Anacardiaceae (Spondias), Achatocarpaceae (Achatocarpus), Malvaceae (Ceiba, Chorisia), Boraginaceae (Cordia), Cactaceae (Cereus), and Cochlospermaceae (Cochlospermum) (Killeen et al., Reference Killeen, Chavez, Pena-Claros, Toledo, Arroyo, Caballero, Correa, Pennington, Lewis and Ratter2006).
The eastern limit of the Chiquitano dry forest coincides broadly with the Paraguay River and the Bolivian–Brazilian border, to the east of which lies the Pantanal—the largest tropical wetland in the world (~135,000 km2)—which is formed by flooding of the Paraguay River and its tributaries (Fig. 1). The vegetation of the Pantanal is a heterogeneous mosaic of xeric, mesic, and seasonally inundated plant communities, controlled by edaphic factors, topography, and flooding (Ratter et al., Reference Ratter, Pott, Pott, Nunes da Cunha and Haridasan1988; Dubs, Reference Dubs, Furley, Proctor and Ratter1992; Hamilton, Reference Hamilton2002; Alho, Reference Alho, Fraser and Keddy2005; Nunes da Cunha et al., Reference Nunes da Cunha, Junk and Leitão Filho2007). The species composition is a mixture of the surrounding ecosystems, with some Amazonian humid evergreen forest species occurring in gallery forests, dry forest species occurring on raised levees, cerrado savannah species occurring in higher-elevation areas, and seasonally flooded low-elevation areas containing seasonally inundated savannahs (Alho, Reference Alho, Fraser and Keddy2005)—the dominant vegetation type of the Pantanal. The upland savannah habitat of the Amolar hills (located near Laguna La Gaiba and Laguna Mandioré; Figs. 1 and 2) is typical of the Brazilian cerrado and is dominated by the following species: Caryocar brasiliense, Qualea grandiflora, Tabebuia caraiba, Diptychandra glabra, and Hymenaea stigonocarpa (Prance and Schaller, Reference Prance and Schaller1982). In flooded areas of the Pantanal and shorelines of these two lakes, key herbaceous species include: Pontederia cordata, Eichhornia crassipes, Thalia geniculata, and Cyperus giganteus (Prance and Schaller, Reference Prance and Schaller1982). The Pantanal wetlands are linked to both Laguna Mandioré and Laguna La Gaiba via the Paraguay River, which floods annually, overflowing into the surrounding wetlands (Hamilton, Reference Hamilton2002; Figs. 1 and 2).
Google Earth imagery of lake sites with core site locations shown by black markers, lake outline shown by the white line, Paraguay River shown by blue lines, and ecosystems labelled. (A) Laguna La Gaiba; (B) Laguna Mandioré. (For interpretation of the references to color in this figure legend, the reader is referred to the web version of this article.)
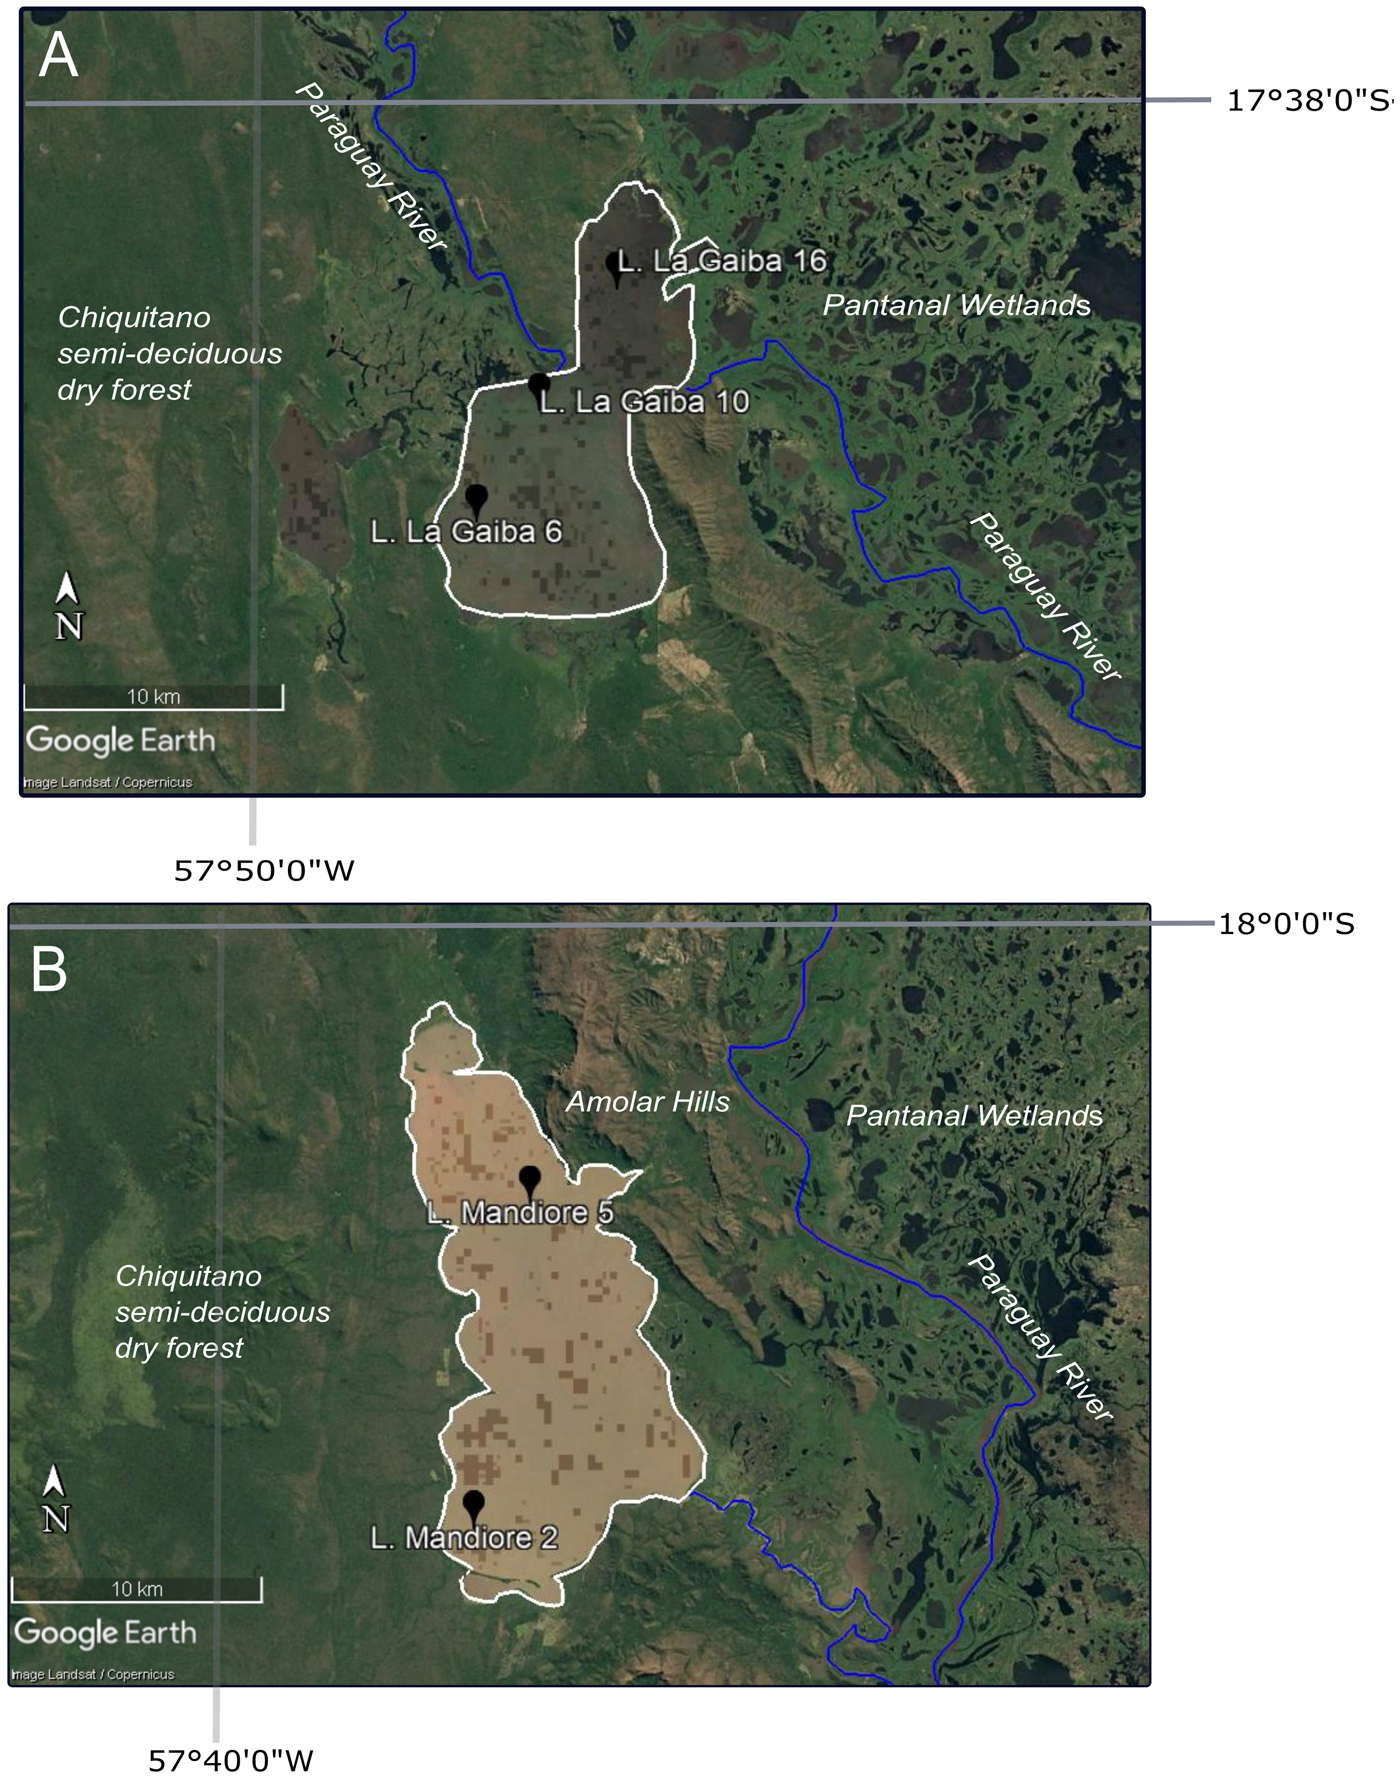
The study site is Laguna Mandioré—a large, shallow, flat-bottomed lake (~152 km2, 92 m above seal level [asl], depth of ~4–6 m), ~20 km south of the southern shore of Laguna La Gaiba—located along a fault between the Bolivian Chiquitano semideciduous dry forest to the west and the Brazilian Pantanal wetlands to the east. On the eastern shore of Laguna Mandioré, dry forest grades into cerrado upland savannah as altitude increases, and soils become thinner up a series of large hills (Amolar hills, ~900 m asl) that separate the majority of the lake margin from the Pantanal wetlands (Fig. 2). The geology of the surrounding area is a complex of coalesced alluvial fans from incoming rivers across the Pantanal, as well as outcrops of crystalline rock, limestone, and iron and manganese oxides that form the Amolar hills (~900 m asl) (Hamilton, Reference Hamilton2002). Laguna Mandioré is a high-energy lake with significant wave action and potential for resuspension of sediment. The annual flood pulse during the wet season is not over land but via channels connected to the Paraguay River, the headwaters of which are formed by seasonal rains over the Pantanal basin (Hamilton, Reference Hamilton2002). The two primary channels are located at the southeastern and northern edges of the lake. This flood pulse brings an organic-rich input to the lake. These river channels also act to drain the lake into hydrological isolation during the dry season (McGlue et al., Reference McGlue, Silva, Corradini, Zani, Trees, Ellis, Parolin, Swarzenski, Cohen and Assine2011).
Laguna La Gaiba is also a large, shallow lake (~90 km2, depth of ~4–6 m) split into two subbasins: the deeper southern basin is surrounded to the south by hills predominantly covered by Chiquitano dry forest; the shallower northern basin merges into the Pantanal wetlands (Whitney et al., Reference Whitney, Mayle, Burn, Guillén, Chavez and Pennington2014; Figs. 1 and 2). The specific site of connection to the Paraguay River is a channel at the eastern edge of the northern subbasin, which produces a large sandy fan. Biogeochemical characteristics are similar to those of Laguna Mandioré, except that Laguna La Gaiba has lower productivity with lower concentrations of organic carbon, nitrogen, and biogenic silica (McGlue et al., Reference McGlue, Silva, Corradini, Zani, Trees, Ellis, Parolin, Swarzenski, Cohen and Assine2011). In contrast to the area surrounding Laguna Mandioré, however, the hills bordering Laguna La Gaiba are of lower elevation and largely covered by dry forest.
Due to the proximity of Lagunas La Gaiba and Mandioré, a comparison of palaeoecological records from these lakes should clarify the spatial scale they represent and potentially constrain the spatial scale of any Holocene ecotonal shifts.
Approach
Lagunas Mandioré and La Gaiba are both situated within complex catchments surrounded by multiple terrestrial, aquatic, and semiaquatic ecosystems that are possible sources of the pollen and phytoliths deposited within their sediments. Therefore, we first investigate potential pollen and phytolith sources by comparing modern assemblages from multiple surface samples across both lakes. These results will inform the interpretation of the pollen and phytolith records from Laguna Mandioré, which will enable an assessment of the long-term impacts of the mid-Holocene drier climatic period on the surrounding dry forest and nearby dry forest–upland savannah ecotone. The use of phytoliths will allow the differentiation of Poaceae subfamilies (Piperno, Reference Piperno2006) at key horizons in the pollen record and will therefore assist with differentiating dry forest understorey from upland and wetland savannah signals. It will also provide a more local-scale vegetation signal than pollen (Piperno, Reference Piperno2006; Whitney et al., Reference Whitney, Dickau, Mayle, Soto and Iriarte2013; Carson et al., Reference Carson, Watling, Mayle, Whitney, Iriarte, Prumers and Soto2015).
METHODS
Field methods
A sediment core of 4.5 m consisting of overlapping 1-m sections was collected by FEM in 2001 from the northern end of Laguna Mandioré (core site 5: 18°5′30.60″S, 57°33′45.60″W), ~2 km from the Amolar hill formation (Figs. 1 and 2), using a drop-hammer, modified Livingstone piston corer from an anchored floating platform (Colinvaux et al., Reference Colinvaux, Oliveira and Patiño1999). An overlapping surface-sediment core, including the sediment–water interface, was collected using a 5-cm-diameter Perspex tube and piston. An additional surface-sediment core was collected from the southwestern portion of the lake (core site 2: 18°12′32.00″S, 57°35′2.00″W). The surface core was split in the field into 1 cm increments and placed into watertight plastic tubes. The Livingstone cores were shipped in their sealed aluminium tubes. All samples were kept in cold storage at 4°C.
Three surface-sediment samples were analysed from Laguna La Gaiba: core site 6 in the west of the south basin (17°47′0.00″S, 57°45′2.00″W), core site 10 in the north of the south basin (17°44′36.50″S, 57°43′40.00″W), and core site 16 in the north basin (17°41′60.00″S, 57°41′59.00″W) (Figs. 1 and 2). Core site numbers refer to those originally published in Whitney et al. (Reference Whitney, Mayle, Punyasena, Fitzpatrick, Burn, Guillen, Chavez, Mann, Pennington and Metcalfe2011).
Laboratory methods
Fossil pollen and phytolith analyses were undertaken to reconstruct the vegetation history of the Laguna Mandioré site. Sediment samples measuring 1 ml were processed for fossil pollen using the standard protocol (Faegri and Iversen, Reference Faegri and Iversen1989). Fossil pollen identification was conducted using the tropical pollen reference collection at the University of Reading Tropical Palaeoecology Research laboratory, which contains more than 1000 specimens and published pollen reference literature (Roubik and Moreno, Reference Roubik and Moreno1991; Colinvaux et al., Reference Colinvaux, Oliveira and Patiño1999). Terrestrial pollen counts of 300 grains were obtained for each sample, including both Poaceae and Cyperaceae. The sampling resolution for pollen varies between 150 yr during the mid-Holocene up to 1200 yr in the early Holocene (N = 26).
Sediment samples of 3 ml were processed for phytolith analysis using the standard wet-sediment technique (Piperno, Reference Piperno2006). Phytolith extraction was conducted using the wet oxidation method involving nitric acid heated to 90°C as described in Piperno (Reference Piperno2006). Wet-sediment samples of 3 ml were obtained from each horizon to allow for fractionation during processing into “A” (<53 μm) and “C” (53–250 μm) fractions (Piperno, Reference Piperno2006). A-fraction slides were counted at 400× magnification, and a minimum sum of 200 diagnostic phytoliths was counted for each sample. C-fraction slides were scanned at 100×, with identifications conducted at 400× magnification. All diagnostic phytoliths on the C-fraction slides were counted. Phytolith identification was carried out with reference to the University of Reading tropical phytolith reference collection, which contains modern specimens from 152 species, and photographs of the University of Exeter phytolith reference collection, which contains more than 500 modern neotropical species. Published phytolith reference atlases for the Neotropics, tropical Africa, Asia, and Australasia were also consulted (Kondo et al., Reference Kondo, Childs and Atkinson1994; Boyd et al., Reference Boyd, Lentfer and Torrence1998; Piperno and Pearsall, Reference Piperno and Pearsall1998b, Reference Piperno and Pearsall1998a; Runge, Reference Runge1999; Wallis, Reference Wallis2003; Lu and Liu, Reference Lu and Liu2003; Piperno, Reference Piperno2006; Iriarte and Paz, Reference Iriarte and Paz2009; Mercader et al., Reference Mercader, Bennett, Esselmont, Simpson and Walde2009, Reference Mercader, Bennett, Esselmont, Simpson and Walde2011; Dickau et al., Reference Dickau, Whitney, Iriarte, Mayle, Soto, Metcalfe, Street-Perrott, Loader, Ficken and Killeen2013; Watling and Iriarte, Reference Watling and Iriarte2013; Watling et al., Reference Watling, Iriarte, Whitney, Consuelo, Mayle, Castro, Schaan and Feldpausch2016). The sampling resolution for phytoliths varies from 1000 yr in the mid-Holocene up to 2000 yr in the early and late Holocene (N = 7).
To reconstruct past changes in fire regime, macroscopic charcoal was analysed from 1 ml of wet sediment (N = 37), treated with hot sodium hexmetaphosphate and sodium hydroxide, and sieved into >100 μm and >180 μm fractions. All charcoal particles were counted for both fractions and identified as being from herbaceous or woody taxa under a stereo microscope (Whitlock and Larsen, Reference Whitlock, Larsen, Smol, Birks and Last2001).
Loss-on-ignition (LOI) at 550°C and 950°C was performed on 1 ml of wet sediment at 4 cm resolution (N = 79), to determine organic and carbonate content, respectively (Heiri et al., Reference Heiri, Lotter and Lemcke2001). Wet-sediment samples of 1 ml were dried and ground to a fine powder and treated with HCl to remove carbonates before measurement of C, N, and δ13C (Harris et al., Reference Harris, Horwath and Kessel2001). Total %C and %N were measured on a Flash Reference Jones, Mayle, Pennington and Killeen2000 to determine C/N ratios (N = 81). δ13C of bulk sediment was measured with a ThermoFisher Scientific Delta V Advantage mass spectrometer (N = 81). Total %C and %N were calculated relative to standard reference material, aspartic acid and laboratory soil standard QC. Replicate analysis of laboratory reference material QC yielded the following precision data (n = 14, ±σn−1): 0.13% and 0.04% for %C and %N, respectively. The δ13C/12C ratio was calculated relative to standard reference materials polyethylene (CH7), sucrose (CH6), and l-glutamic acid (USG40) and reported as per mille (‰) deviations from VPDB standard. Replicate analysis of standard reference materials CH7, CH6, and USG40 yielded the following precision data (n = 13, ±σn−1): 0.23‰, 0.01‰, and 0.04‰, respectively. C/N ratios were multiplied by 1.167 to get atomic C/N for comparison with established ratios (Meyers and Teranes, Reference Meyers and Teranes2001). X-ray fluorescence (XRF) analysis was conducted using a portable X-ray fluorescence Thermo Scientific Niton 3L3t GOLDD at 1 cm resolution on intact long sediment cores (N = 268). Analysis was not possible for the surface core (0–54 cm), as insufficient sediment was available. XRF data measured as counts per second (cps) are presented as ratios throughout this paper (Francus et al., Reference Francus, Lamb, Nakagawa, Marshall, Brown and Members2009). Lithological descriptions of the sediments were conducted using the Munsell colour chart.
Radiocarbon dates were obtained from bulk lake sediment, due to the absence of sufficient terrestrial plant macrofossils or macro-charcoal particles for dating. Two dates were obtained from Beta Analytic and five further Holocene dates were granted by the Natural Environment Research Council radiocarbon facility (allocation number 2038.1016).
Numerical analyses
Frequency and stratigraphic plots for pollen, phytoliths, and charcoal were created using version 1.7 of the C2 software (Juggins, Reference Juggins2016) and edited in Inkscape 0.92.3. Stratigraphic diagrams for geochemical data were created in the rioja 0.9-15.1 package in R v. 3.4.1 and edited in Inkscape 0.92.3. The age-depth model was built using Bacon 2.3.4 package in R v. 3.4.1 (Blaauw and Christen, Reference Blaauw and Christen2011) and the IntCal13 calibration curve (Reimer et al., Reference Reimer, Bard, Bayliss, Beck, Blackwell, Ramsey and Buck2013), due to the strong influence of the South American summer monsoon and Northern Hemisphere air masses on atmospheric circulation in our study region (Marsh et al., Reference Marsh, Bruno, Fritz, Baker, Capriles and Hastorf2018).
A constrained clustering analysis (CONISS) with Euclidean distances (Grimm, Reference Grimm1987) was carried out on the pollen data, and statistically significant pollen zones were determined using the broken stick model (Bennett, Reference Bennett1996) in the rioja 0.9-15.1 package (Juggins, Reference Juggins2017) in R v. 3.4.1. Palynological richness was determined using rarefaction analyses to control for the influence of count size on pollen sums (Birks and Line, Reference Birks and Line1992) using the vegan 2.5-2 package (Oksanen et al., Reference Oksanen, Blanchet, Friendly, Kindt, Legendre, McGlinn and Minchin2018) in R v. 3.4.1.
Map production
Maps of the ecosystems surrounding the lake site were created using ArcGIS 10.4 (Fig. 1). A vegetation classification of our study area, based on Landsat imagery, was provided by the Museo de Historia Natural Noel Kempff Mercado, Santa Cruz, Bolivia, in 2015. This map is overlaid on the WWF terrestrial ecoregions of the world, adapted from Olson et al. (Reference Olson, Dinerstein, Wikramanayake, Burgess, Powell, Underwood and D'amico2001). Additional maps of the lake sites (Fig. 2) were created using Google Earth Pro imagery and Inkscape 0.92.3.
RESULTS
Modern pollen and phytoliths at Lagunas Mandioré and La Gaiba
Modern pollen
The two surface samples from Laguna Mandioré (2 and 5) contain similar pollen assemblages, dominated by Poaceae pollen at 48%–56% with pollen richness of 24 (Fig. 3). Both samples contain consistent levels of Anadenanthera (4%), Alchornea (3%), Arecaceae (2%), and Curatella americana (1%) pollen. Cyperaceae and total Moraceae/Urticaceae pollen abundances are higher at Mandioré 2 (19% and 11%, respectively) than at Mandioré 5 (9% and 5%, respectively), whereas Astronium and Celtis pollen abundances are higher at Mandioré 5 (3% and 5%, respectively) than at Mandioré 2 (1% and 1%, respectively) (Fig. 3).
Summary pollen diagram from two Laguna Mandioré surface samples and three Laguna La Gaiba surface samples. Pollen presented as percentage of terrestrial sum.
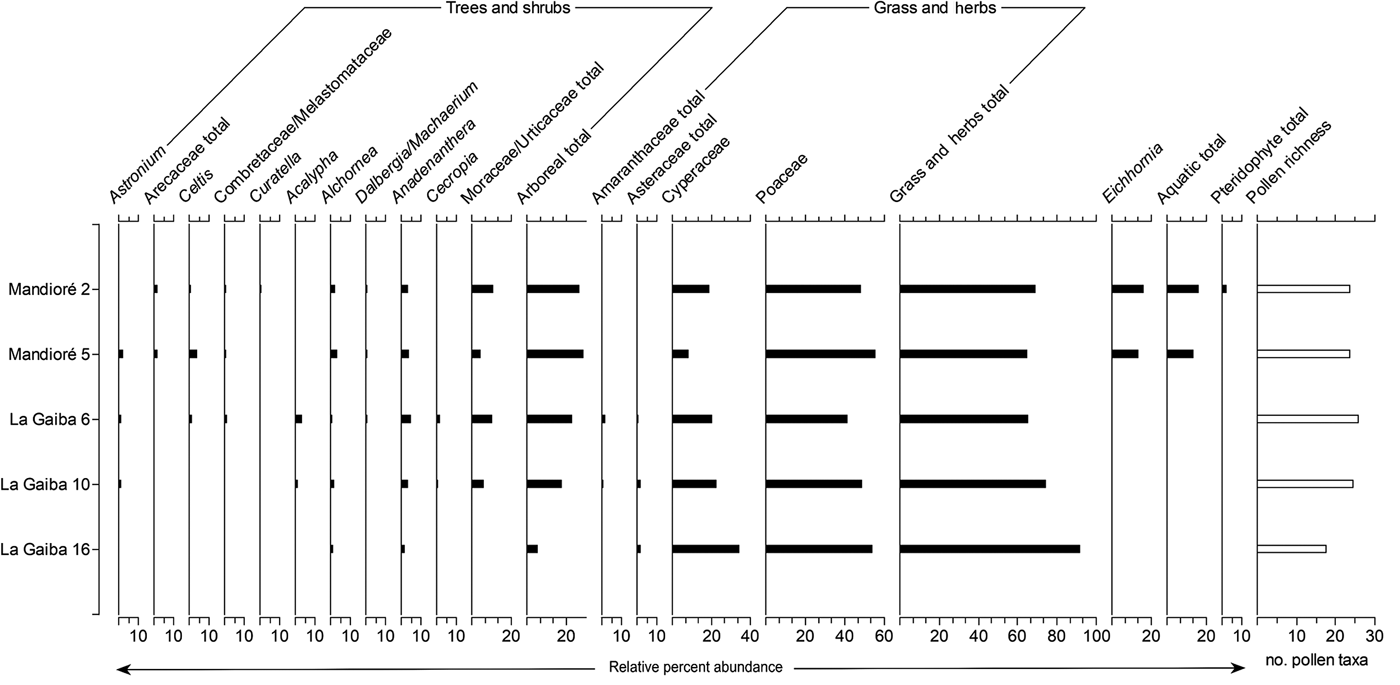
The relative abundances of pollen types were more variable between the surface samples from Laguna La Gaiba (6, 10, and 16) than between the Laguna Mandioré surface samples. La Gaiba 6 and 10 are more similar to each other than La Gaiba 16 (Fig. 3). Pollen richness at La Gaiba 6 and 10 is similar to that at the Mandioré sites (26 and 25, respectively), while richness at La Gaiba 16 is considerably lower at 18. La Gaiba 16 shows higher abundance of Cyperaceae pollen (34% compared with 21%–23% at La Gaiba 6 and 10, respectively) and lower abundance of arboreal pollen (6% compared with 18%–23% at La Gaiba 6 and 10, respectively), with both Astronium and Acalypha pollen absent.
Overall, the modern pollen assemblages are similar across the surface samples from the two lakes, except for La Gaiba 16. Mandioré 2 and 5 and La Gaiba 6 and 10 all show similar total arboreal pollen abundances (18%–29%) including Astronium, Anadenanthera, Moraceae/Urticaceae, Alchornea, and Celtis pollen, whereas La Gaiba 16 only contains pollen of Alchornea and Anadenanthera as arboreal taxa. La Gaiba 16 also contains higher Cyperaceae and Poaceae pollen abundances than the other four surface samples. Pollen of Curatella americana and the aquatic plant Eichhornia are only present in the Mandioré samples.
Modern phytoliths
The phytolith assemblages from the surface samples at Mandioré 2 and 5 are broadly consistent with each other, with grass and herb total ranges from 73% to 77% and arboreal totals from 22% to 26% (Fig. 4). However, woody eudicot–type and Bambusoideae-type phytoliths are higher in abundance at Mandioré 2, while Panicoideae type and Celtis phytoliths are higher at Mandioré 5. Phytolith richness is higher at Mandioré 5 (33) than at Mandioré 2 (24).
Summary phytolith diagram for two Laguna Mandioré surface samples and three Laguna La Gaiba surface samples. Phytoliths presented as percentage of diagnostic total.
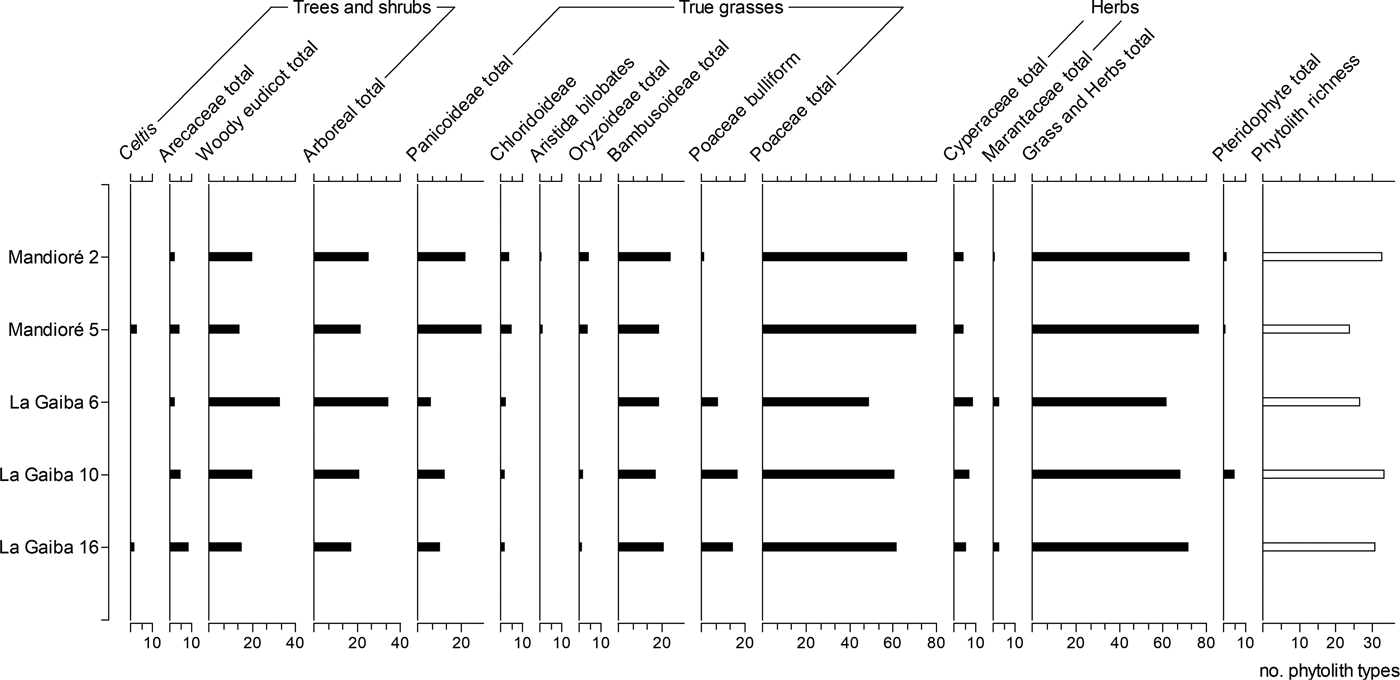
The relative abundance of phytolith types was more variable between Laguna La Gaiba surface samples than between Laguna Mandioré surface samples, with La Gaiba 10 and 16 more similar to each other than to La Gaiba 6. Phytolith richness at La Gaiba 6 (27) is lower than richness at La Gaiba 10 and 16 (34 and 30, respectively). Woody eudicot–type phytoliths are significantly higher in abundance at La Gaiba 6 (33% compared with 15%–20% at La Gaiba 10 and 16), while the total Poaceae phytolith abundance is lower, particularly Panicoideae types (6% compared with 11%–12% at La Gaiba 10 and 16).
Across all five surface samples from the two lakes, grass and herb phytolith percentages are broadly consistent, including Cyperaceae, Poaceae, and Bambusoideae phytoliths. The major differences between these phytolith samples are the higher arboreal phytolith abundance at La Gaiba 6 and the higher Panicoideae-type phytolith abundance at Mandioré, particularly Mandioré 5.
Palaeo results for Laguna Mandioré 5
Chronology
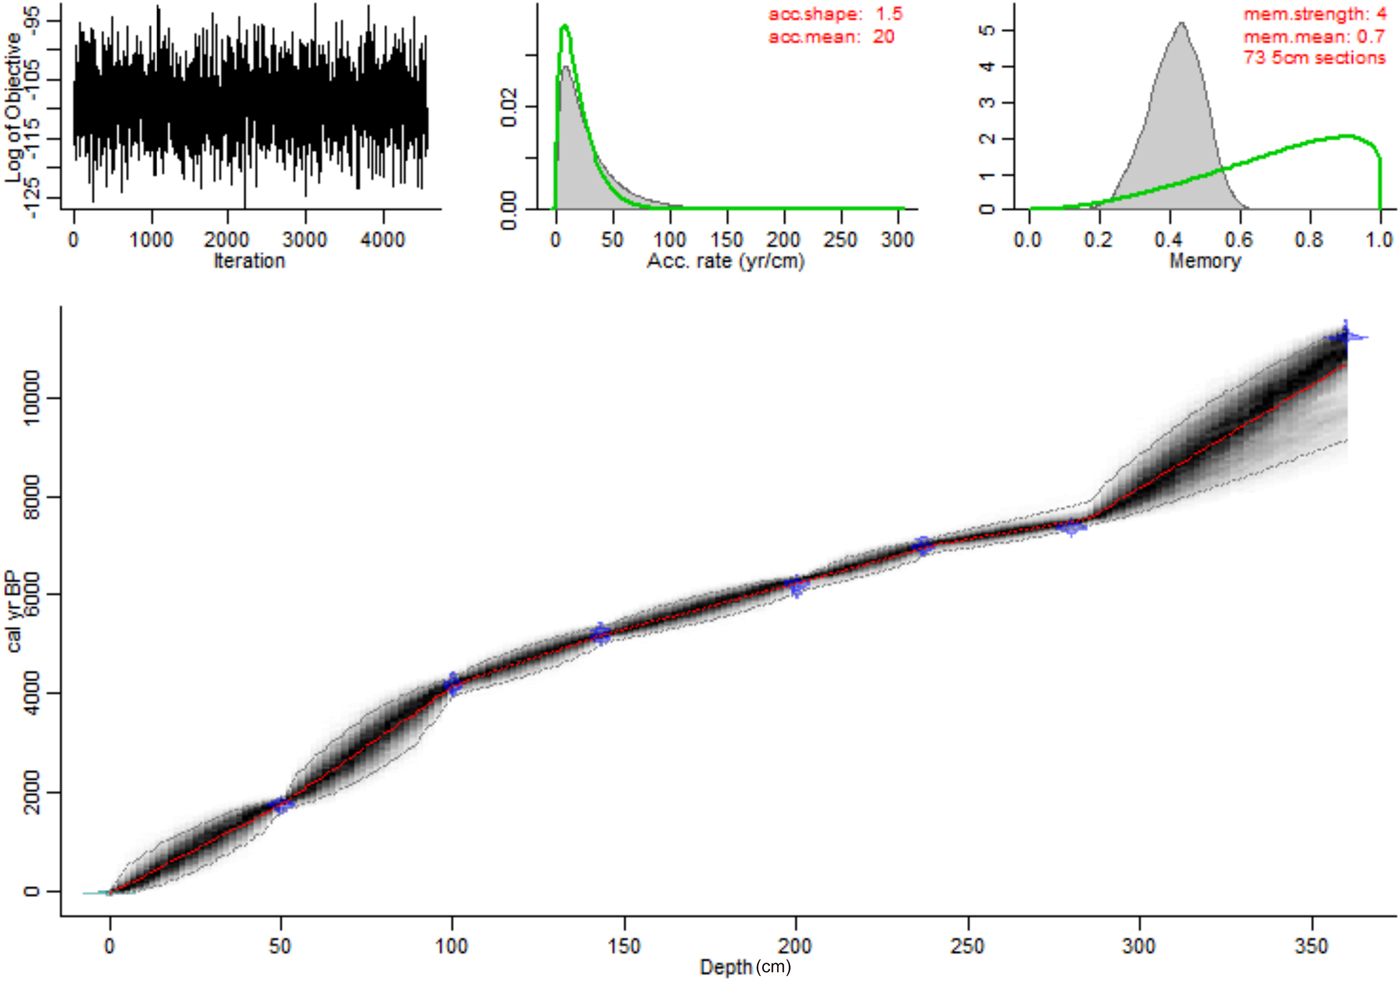
Seven Holocene accelerator mass spectrometry (AMS) 14C dates were obtained from bulk sediment, spaced evenly throughout the Holocene section of the core (0–360 cm depth) (Table 1). Because carbonate content (LOI at 950°C) was below 5% throughout the core, any “hard-water effect” is likely to be negligible. The relationship between radiocarbon dates and stratigraphic positions was modelled using Bayesian Markov chain Monte Carlo statistical modelling (Blaauw and Christen, Reference Blaauw and Christen2011) with 73 subdivisions along the sediment core (Fig. 5).
(color online) Age-depth model for Mandioré core 5 built using Bacon 2.3.4 in R 3.4.1 (Blaauw and Christen, Reference Blaauw and Christen2011). Age is plotted as calibrated years before present (cal yr BP) against depth as centimeters below the sediment–water interface. Accumulation rate is abbreviated to ‘acc.’, memory is abbreviated to ‘mem.’.
Radiocarbon dates for Mandioré core 5. The material for all samples was bulk sediment. Dates were calibrated using calibration curve IntCal13 (Reimer et al., Reference Reimer, Bard, Bayliss, Beck, Blackwell, Ramsey and Buck2013) in Bacon 2.3.4 package in R v. 3.4.1 (Blaauw and Christen, Reference Blaauw and Christen2011).

Vegetation, fire, and geochemical proxies
Four statistically significant pollen zones (PZs 1–4) were identified based on the CONISS analysis (Grimm, Reference Grimm1987) and broken stick model (Bennett, Reference Bennett1996).
PZ1—early Holocene (10,400–7100 cal yr BP)
The pollen assemblages in the early Holocene are characterised by fluctuations in pollen of Poaceae (30%–55%) and Cyperaceae (20%–40%) and a peak in Alternanthera pollen up to 50% at 9700 cal yr BP (Fig. 6). Arecaceae pollen is present at 1%–3% throughout the pollen zone, as is Urticaceae/Moraceae pollen at 1%–7% (Fig. 6). Other taxa with pollen present at low abundance (<2%) throughout this period include Schinopsis, Spondias, Gallesia, Trema, Annonaceae, and Erythroxylum. Pollen of the herbs Amaranthus and Gomphrena appear at low abundance (<2%) around 8000 cal yr BP and afterwards towards the top of PZ1. Aquatic pollen increases up to 20% towards the top of PZ1, driven by increases in Sparganium pollen. The phytolith assemblages from this zone show the Poaceae signal is formed by equal contributions from Bambusoideae and Panicoideae-type phytoliths (Fig. 7).
Pollen plotted against age of sediment in calibrated years before present (cal yr BP) for Mandioré core 5, with pollen zones marked by grey horizontal lines (PZ = pollen zone) and dating horizons marked by black circles on secondary depth axis. Pollen presented as percentage of terrestrial sum. (A) Taxa greater than 2% abundance in more than 1 sample, displayed as percent abundance of terrestrial total. (B) Taxa with less than 2% abundance, marked by an asterisk (*), with pollen richness and pollen concentration.

Phytoliths plotted against age of sediment in calibrated years before present (cal yr BP) for Mandioré core 5, with pollen zones marked by grey horizontal lines (PZ = pollen zone) and dating horizons marked by black circles on secondary depth axis. (A) A-Fraction taxa, with taxa with less than 2% abundance marked by an asterisk (*). (B) C-Fraction taxa, presence shown by “X”.

Most charcoal particles are wood fragments between 100 and 180 μm in size, which peak in abundance just after 8000 cal yr BP (Fig. 8). C/N ratios range from 13 to 15 in this pollen zone, while δ13C ranges from −18‰ to −27‰ (Fig. 9). Rb/K, Fe/K, and Ca/Ti are low throughout. The %LOI at 550°C, %C, and %N stay low throughout this pollen zone, and the lithology of the core shows the highest clay content of the Holocene (Fig. 9).
Charcoal concentration plotted against age of sediment in calibrated years before present (cal yr BP) for Mandioré core 5, with pollen zones marked by grey horizontal lines (PZ = pollen zone) and dating horizons marked by black circles on secondary depth axis. Charcoal separated into >100 μm and >180 μm size fractions and classified as being from woody or grass plant material origin. Charcoal counts displayed as number of particles per cubic centimetre of wet sediment.

Geochemical proxies and lithology column plotted against calibrated years before present (cal yr BP) for Mandioré core 5, with pollen zones marked by grey horizontal lines (PZ = pollen zone) and dating horizons marked by black circles on secondary depth axis. %LOI at 550°C, %LOI at 950°C, %C, and %N are presented as percentages. δ13C/12C is presented as per mille (‰) deviation from VPDB standard. Atomic C/N is presented as a ratio. XRF results are presented as ratios.

PZ2—mid-Holocene phase 1 (7100–6100 cal yr BP)
Pollen of Astronium and Anadenanthera trees both reach peak abundance in this period at 9% and 11%, respectively (Fig. 6). Curatella americana pollen also reaches peak abundance at 5%. Other arboreal taxa remain at constant levels through this period, including Alchornea, Celtis, and Helicostylis. Spondias, Schinopsis, Mimosa, and Trema pollen are present at low (<2%) abundance. Pollen of the herb Alternanthera peaks twice (10%), and pollen of the aquatic plant Sparganium reaches peak abundance (32%), while Poaceae pollen declines slightly to 22%–30%. Poaceae phytolith abundance and the proportion of Bambusoideae to Panicoideae phytolith types remain constant (Fig. 7). Marantaceae phytoliths are present at low abundance (<2%), and Asteraceae platelets are present in the C-fraction (Fig. 7).
Total charcoal concentration fluctuates between 133 and 181 particles/ml wet sediment and continues to be dominated by the 100–180 μm woody pieces (Fig. 8). The %C and %N peak during PZ2 at 17% and 1.2%, respectively, while overall the C/N ratio increases, ranging from 12 to 17 (Fig. 9). δ13C also increases during this period, up to −16‰ towards the top of the zone. The %LOI at 550°C increases up to 30% during PZ2 (Fig. 9). Higher organic content coincides with an increase in Ca/Ti compared with PZ1 (Fig. 9).
PZ3—mid-Holocene phase 2 (6100–3600 cal yr BP)
Pollen from Astronium, Anadenanthera, and Curatella americana declines towards 4000 cal yr BP at the top of PZ3. Dalbergia/Machaerium and Cedrela pollen abundance peaks around 5000 cal yr BP, while total Moraceae/Urticaceae pollen remains reasonably constant throughout. Acacia, Gallesia, Trema, and Erythroxlyum pollen appears at low (<2%) abundance, particularly between 6000 and 5000 cal yr BP. Pollen of the herb Amaranthus also appears at low abundance several times through this pollen zone, while Sparganium pollen abundance declines throughout this period and is superseded by pollen of another aquatic plant, Eichhornia. Poaceae pollen increases towards the top of PZ3, with a slight increase in the proportion of Bambusoideae phytoliths to Panicoideae phytoliths, although there is no change in the overall Poaceae phytolith abundance (Fig. 7). Heliconiaceae phytoliths are present at low abundance (<2%) at 5500 cal yr BP (Fig. 7).
The charcoal record continues to be dominated by the 100–180 μm woody pieces, with a slight increase in >180 μm woody pieces during this period. Total charcoal concentration fluctuates between 87 to 197 particles/ml wet sediment (Fig. 8). The %C and %N both decrease through PZ3, with a decrease in overall C/N ratios to around 12–14 (Fig. 9). δ13C also decreases through this period, from −17‰ at 6100 cal yr BP to −27‰ at 3800 cal yr BP. Ca/Ti peaks around 6000 cal yr BP, at peak mid-Holocene drought, and then declines towards the top of PZ3. Rb/K and Fe/K increase from 4000 cal yr BP (Fig. 9).
PZ4—late Holocene (3600 cal yr BP to present)
Astronium and Anadenanthera pollen maintain a continuous presence but at lower abundances, reaching maximum levels for this pollen zone of 3% and 5%, respectively, in the present (Fig. 6). Curatella americana also declines in abundance to 0.6% at the modern day. Pollen of Alchornea, Celtis, and Helicostylis maintains constant abundance throughout PZ4. Pollen from the palm Astrocaryum peaks around 1000 cal yr BP, as does pollen from the deep-water aquatic Eichhornia. Symmeria paniculata pollen is present at low abundance throughout PZ4 (Fig. 6). Phytoliths are found from Strelitziaceae, which includes the genera Phenakospermum, and from Heliconiacaeae, Marantacaeae, and Asteraceae (Fig. 7).
There is a peak in total charcoal concentration at 2000 cal yr BP up to 280 particles/ml wet sediment, set against fluctuations from 71 to 212 particles/ml (Fig. 8). The charcoal record continues to be dominated by woody pieces between 100–180 μm with a small peak in woody pieces >180 μm around 2400 cal yr BP (Fig. 8). C/N ratios decline further throughout the late Holocene, from 13 to 9 in the present, with an increase in both %C and %N up to 6.2% and 0.8% in the present (Fig. 9). Rb/K and Fe/K are high during PZ4 (Fig. 9). δ13C also decreases slightly compared with PZ3 and fluctuates between −22‰ and −32‰ (Fig. 9).
DISCUSSION
Implications of modern pollen and phytolith data for interpretation of fossil data from Lagunas Mandioré and La Gaiba
Modern pollen and phytolith assemblages from Laguna La Gaiba confirm that the Pantanal wetlands do have an influence on the palaeo-vegetation records, particularly in the north basin (La Gaiba 16), which merges into the Pantanal wetlands (Fig. 2), where the only arboreal pollen taxa are Alchornea, which includes flood-tolerant tree species (Nunes da Cunha et al., Reference Nunes da Cunha, Junk and Leitão Filho2007), and Anadenanthera (Fig. 3). The southern end of the south basin is surrounded by dry forest with a small palm swamp, which is reflected in the abundance of pollen from key dry forest taxa Astronium and Anadenanthera (Gosling et al., Reference Gosling, Mayle, Tate and Killeen2009) and greater abundance of phytoliths from arboreal plants at La Gaiba 6. This is ~3 km west of the long-core site that Whitney et al. (Reference Whitney, Mayle, Punyasena, Fitzpatrick, Burn, Guillen, Chavez, Mann, Pennington and Metcalfe2011, Reference Whitney, Dickau, Mayle, Soto and Iriarte2013) used for the vegetation reconstruction of the past 45,000 yr of Chiquitano semideciduous dry forest. The phytolith assemblages presented here confirm that this long-core site is likely to be the most representative of the semideciduous dry forest and least influenced by the vegetation of the Pantanal wetlands.
Surface pollen assemblages from Laguna Mandioré contain key dry forest taxa Astronium and Anadenanthera (Gosling et al., Reference Gosling, Mayle, Tate and Killeen2009). Although Bambusoideae phytoliths, indicative of semideciduous dry forest (Dickau et al., Reference Dickau, Whitney, Iriarte, Mayle, Soto, Metcalfe, Street-Perrott, Loader, Ficken and Killeen2013), are high across all surface samples, Laguna Mandioré samples show a higher total Poaceae abundance than Laguna La Gaiba samples, particularly of Panicoideae types (Fig. 4). As phytoliths from lakes primarily represent local vegetation (Piperno, Reference Piperno2006), the majority of the Panicoideae inputs are likely to reflect local shoreline vegetation at both Mandioré sites (2 and 5). However, a minor component of the Panicoideae phytolith signal could be representing extra-local inputs. As the Panicoideae grass subfamily includes both wetland and upland species, this signal could be reflecting influence from the Pantanal wetlands and the upland savannahs of the Amolar hills. The southeast Laguna Mandioré basin is connected to the Pantanal wetlands via a channel to the Paraguay River that is surrounded by wetlands (McGlue et al., Reference McGlue, Silva, Zani, Corradini, Parolin, Abel and Cohen2012), which may wash pollen, phytoliths, and other materials into the south basin during the wet season. As Mandioré 2 is situated in the southern Laguna Mandioré basin, Pantanal wetland grasses are more likely to have contributed to the high Panicoid phytolith abundance at this site. Mandioré 5 is in the northern basin, just ~2 km from the base of the Amolar hills, and it is therefore more likely that contributions to the Panicoid abundance at this site are from the upland savannah atop the Amolar hills rather than the Pantanal wetlands.
The surface pollen assemblage from Mandioré 5 contains Curatella americana pollen at ~1%, which is comparable to abundances found in pollen traps from within terra firme (cerrado) upland savannah at Noel Kempff Mercado National Park (Jones et al., Reference Jones, Mayle, Pennington and Killeen2011). Low pollen abundance in palaeo-records is expected for Curatella americana and other savannah tree pollen, such as Brysonima or savannah shrubs such as Schefflera or Alibertia, due to their entomophilous pollination mechanism (Jones et al., Reference Jones, Mayle, Pennington and Killeen2011; Hilje et al., Reference Hilje, Calvo-Alvarado, Jiménez-Rodríguez and Sánchez-Azofeifa2015). The low abundance or absence of these key savannah pollen tree taxa in the present is therefore unsurprising despite the close proximity of Mandioré 5 to the Amolar hills upland savannah. Any increase in the abundance of pollen from these savannah taxa in the fossil record would suggest an increase in upland savannah extent (i.e., downslope expansion) compared with the present day.
Holocene vegetation reconstruction at Laguna Mandioré 5
PZ1—early Holocene (10,400–7100 cal yr BP)
This pollen zone is suggestive of a semideciduous dry forest community occupying the hillslopes around Laguna Mandioré in the early Holocene, with a significant herbaceous component. Key dry forest taxa such as Anadenanthera (3%) and Astronium (4%) are present (Gosling et al., Reference Gosling, Mayle, Tate and Killeen2009; Fig. 6). The abundance of Urticaceae/Moracaceae pollen in this zone at 1%–7% is well below the 40% level expected for closed-canopy humid evergreen forest (Gosling et al., Reference Gosling, Mayle, Tate and Killeen2009). The most abundant Moraceae genus in the assemblage is Helicostylis, which has moisture-dependent species in evergreen and liana forests (Burn and Mayle, Reference Burn and Mayle2008), and therefore probably represents gallery and riparian evergreen forest along lakeshores and rivers around Laguna Mandioré. Pollen of other arboreal taxa present throughout this period include Schinopsis, Spondias, Gallesia, Trema, Annonaceae, and Erythroxylum, suggesting the presence of a closed-canopy forest. The herbaceous component of the vegetation is characterised by fluctuation in Poaceae and Alternanthera pollen (Fig. 6). Phytolith assemblages show that the Poaceae signal is characterised by equal contributions from Bambusoideae- and Panicoideae-type phytoliths (Fig. 7). High Bambusoideae phytolith abundance is indicative of understorey bamboo in semideciduous dry forest (Dickau et al., Reference Dickau, Whitney, Iriarte, Mayle, Soto, Metcalfe, Street-Perrott, Loader, Ficken and Killeen2013), whereas Panicoideae phytoliths are generally indicative of open-savannah habitats, either wetland or upland (Piperno, Reference Piperno2006; Dickau et al., Reference Dickau, Whitney, Iriarte, Mayle, Soto, Metcalfe, Street-Perrott, Loader, Ficken and Killeen2013). The phytolith assemblage therefore confirms the presence of semideciduous dry forest local to the site during this period, while also suggesting some local savannah inputs. As phytoliths primarily represent local vegetation (Piperno, Reference Piperno2006), these Panicoideae phytolith inputs therefore most likely reflect predominantly local shoreline vegetation, with only minor inputs from the upland savannah atop the Amolar hills, which at present is ~2 km from the lakeshore.
C/N ratios (13–15) in this pollen zone indicate a mixture of algal and terrestrial inputs to the lake sediment (Fig. 8). The C/N ratio of algal material typically ranges from 4 to 10, whereas C3 terrestrial material has a C/N ratio >20 (Meyers and Teranes, Reference Meyers and Teranes2001). The C/N ratios from this pollen zone are therefore suggestive of high algal productivity in the lake, with terrestrial inputs. δ13C values indicate mixed C3/C4 vegetation inputs (C3 vegetation range is −20‰ to −35‰, compared with −9‰ to −16‰ for C4 vegetation) (Boutton, Reference Boutton, Boutton and Yamasak1996).
PZ2—mid-Holocene phase 1 (7100–6100 cal yr BP)
Astronium and Anadenanthera, two key pollen taxa indicative of semideciduous dry forest (Gosling et al., Reference Gosling, Mayle, Tate and Killeen2009), both reach peak abundance in this period at 9% and 11%, respectively (Fig. 5). Curatella americana, a savannah tree, also reaches peak abundance at 5%, much higher than the ~1% abundance found in pollen traps within upland savannah at Noel Kempff Mercado National Park (Jones et al., Reference Jones, Mayle, Pennington and Killeen2011).This combination of pollen taxa shows that the lake record is detecting the presence of the dry forest–upland savannah ecotone on the Amolar hills for the first time in the Holocene. This finding suggests that the area of upland savannah within the lake catchment has increased, likely due to a shift in the dry forest–upland savannah ecotone downslope from the neighbouring Amolar hills. The continued presence of closed-canopy forest in the catchment is demonstrated by the constant levels of pollen from other arboreal taxa such as Alchornea, Celtis, and Helicostylis. Poaceae pollen abundance declines slightly within this pollen zone (Fig. 6), while the phytolith assemblage shows a constant proportion of Bambusoideae to Panicoideae types (Fig. 7). This phytolith assemblage indicates a constant proportion of dry forest (Bamusoideae) and savannah (Panicoideae) inputs from the vegetation close to the shore, suggesting that savannah encroachment did not reach the dry forest vegetation at the base of the Amolar hills.
C/N ratios increase in PZ2 (12–17), suggesting greater terrestrial inputs to the lake sediment during this period compared with PZ1 (Fig. 9). δ13C also increases during this period, up to −16‰ towards the top of the zone. Together, the shifts in C/N and δ13C indicate greater terrestrial C4 vegetation inputs compared with PZ1, supporting the interpretation of C4 upland savannah expansion on the slopes of the Amolar hills. Organic content of the sediment increases during PZ2 with %LOI at 550°C increasing up to 30%, coinciding with an increase in the Ca/Ti ratio (Fig. 9), suggesting evaporative concentration of the lake waters (Metcalfe et al., Reference Metcalfe, Whitney, Fitzpatrick, Mayle, Loader, Street-Perrott and Mann2014), possibly due to the reduction in precipitation during the mid-Holocene drier period. This interpretation is supported by peak abundance (32%) of pollen of the aquatic plant Sparganium, a genus of floating or emergent aquatic marsh plants (Ricketson, Reference Ricketson2001), reflecting an increase in aquatic vegetation of shallow lake waters.
PZ3—mid-Holocene phase 2 (6100–3600 cal yr BP)
Pollen from key dry forest taxa Astronium and Anadenanthera and from the savannah tree Curatella americana decline towards 4000 cal yr BP at the top of PZ3, indicating a reduction in the extent of upland savannah and a shift of the dry forest–upland savannah ecotone upslope to its early Holocene position. Closed-canopy forest is maintained in the catchment, as demonstrated by pollen of Dalbergia/Machaerium, Cedrela, Acacia, Gallesia, Trema, and Erythroxlyum. Poaceae pollen increases towards the top of PZ3, with a slight increase in the proportion of Bambusoideae phytoliths to Panicoideae phytoliths, suggesting a slight increase in dry forest vegetation close to the shoreline (Fig. 6).
C/N ratios decrease slightly during this period, suggesting a slight reduction in terrestrial inputs compared with PZ2 (Fig. 8). δ13C also decreases through this period, from −17‰ to −27‰, demonstrating a return to predominantly C3 vegetation inputs from a mix of terrestrial and aquatic sources. The return to a C3-dominated signal suggests a reduction in C4 upland savannah vegetation reflecting the reduction in savannah on the slopes of the Amolar hills as the dry forest–upland savannah ecotone shifts upslope. Ca/Ti peaks around 6000 cal yr BP, at peak mid-Holocene drought, and then declines towards the top of PZ3, suggesting peak evaporative concentration of lake waters at 6000 cal yr BP (Metcalfe et al., Reference Metcalfe, Whitney, Fitzpatrick, Mayle, Loader, Street-Perrott and Mann2014). From 4000 cal yr BP Rb/K and Fe/K increase, suggesting an increase in transport of weathered material to the lake, which could indicate an increase in precipitation (McGlue et al., Reference McGlue, Silva, Zani, Corradini, Parolin, Abel and Cohen2012; Metcalfe et al., Reference Metcalfe, Whitney, Fitzpatrick, Mayle, Loader, Street-Perrott and Mann2014). Sparganium pollen abundance declines throughout this period and is superseded by an aquatic plant typical of deeper waters, Eichhornia (Hamilton, Reference Hamilton2002), supporting the interpretation of an increase in lake levels.
PZ4—late Holocene (3600 cal yr BP–present)
Pollen of key dry forest taxa Astronium and Anadenanthera maintain a continuous presence up to the modern day but at lower abundances compared with the mid-Holocene, while Curatella americana pollen declines towards the present (Fig. 6), reflecting the reduced extent of upland savannah and upslope shift of the dry forest–upland savannah ecotone to its present position on the slopes of the Amolar hills. Alchornea, Celtis, and Helicostylis all maintain constant abundance throughout PZ4, reflecting the persistence of closed-canopy forest.
There are several indicators in the vegetation that precipitation is increasing during PZ4, including the presence of pollen from inundation-tolerant tree Symmeria paniculata and peak abundance of the deep-water aquatic Eichhornia (Fig. 6). Additionally, phytoliths are found from Strelitziaceae, which includes the genera Phenakospermum, a tree common in inundated, wet environments as well as Heliconiacaeae, Marantacaeae, and Asteraceae phytoliths, which can be indicators of inundated shoreline or savannah vegetation (Dickau et al., Reference Dickau, Whitney, Iriarte, Mayle, Soto, Metcalfe, Street-Perrott, Loader, Ficken and Killeen2013; Fig. 7).
C/N ratios decline further throughout the late Holocene (Fig. 9) suggesting higher algal productivity towards the present, possibly due to increasing precipitation in the late Holocene and hence greater weathering of soils and nutrient inwash to the lake. This interpretation is supported by high Rb/K and Fe/K ratios, which have been interpreted to show an increase in transport of weathered material to lakes in this region of the Pantanal (McGlue et al., Reference McGlue, Silva, Zani, Corradini, Parolin, Abel and Cohen2012; Metcalfe et al., Reference Metcalfe, Whitney, Fitzpatrick, Mayle, Loader, Street-Perrott and Mann2014) (Fig. 9). δ13C also decreases slightly compared with PZ3 and fluctuates within the C3 vegetation range (Boutton, Reference Boutton, Boutton and Yamasak1996), reflecting the dominance of C3 forest vegetation over C4 upland savannah vegetation in the lake catchment in the present.
Impact of drier mid-Holocene climate
Dry forest biome and floristics
Key dry forest taxa in the pollen record—Anadenanthera and Astronium—reach peak abundance between 7000 and 6000 cal yr BP and maintain high abundance until ~4000 cal yr BP (Fig. 10). This fits with the timing of the mid-Holocene drier climatic period in Andean palaeoclimate records such as Laguna Titicaca (Baker et al., Reference Baker, Seltzer, Fritz, Dunbar, Grove, Tapia, Cross, Rowe and Broda2001) and Laguna Pumachoca (Bird et al., Reference Bird, Abbott, Rodbell and Vuille2011) as well as lowland Pantanal records such as Jaraguá Cave (Novello et al., Reference Novello, Cruz, Vuille, Stríkis, Edwards, Cheng and Emerick2017), Laguna Negra (Rasbold et al., Reference Rasbold, McGlue, Stevaux, Parolin, Silva and Bergier2019), and Laguna La Gaiba (Whitney et al., Reference Whitney, Mayle, Punyasena, Fitzpatrick, Burn, Guillen, Chavez, Mann, Pennington and Metcalfe2011, 2014; McGlue et al., Reference McGlue, Silva, Zani, Corradini, Parolin, Abel and Cohen2012; Whitney and Mayle, Reference Whitney and Mayle2012; Metcalfe et al., Reference Metcalfe, Whitney, Fitzpatrick, Mayle, Loader, Street-Perrott and Mann2014; Fornace et al., Reference Fornace, Whitney, Galy, Hughen and Mayle2016; Fig. 11). Additionally, peak Ca/Ti and low Rb/K and Fe/K around 6000 cal yr BP at Laguna Mandioré suggest reduced mineral wash into the lake and support the identification of a mid-Holocene drier climate between 7000 and 4000 cal yr BP (Fig. 9). These findings are consistent with peak Ca/Ti at Laguna La Gaiba from 9000 to 4000 cal yr BP (Metcalfe et al., Reference Metcalfe, Whitney, Fitzpatrick, Mayle, Loader, Street-Perrott and Mann2014), demonstrating regionally consistent geochemical changes.
Summary vegetation diagram for Mandioré core 5 plotted against calibrated years before present (cal yr BP) with pollen zones marked by grey horizontal lines (PZ = pollen zone) and dating horizons marked by black circles on secondary depth axis. Key pollen taxa presented as percentage of terrestrial total, total charcoal concentration presented as particles per cubic centimetre of wet sediment, δ13C/12C presented as per mille (‰), and C/N presented as a ratio.

Schematic diagram summarising key records of the mid-Holocene drier climatic period in the Andes (Lagunas Titicaca and Pumachoca) and Pantanal lowlands (Jaraguá Cave, Lagunas Negra, and La Gaiba) for comparison with Laguna Mandioré. Four studies have been conducted at Laguna La Gaiba; here they are differentiated by the main palaeo data set used. Time is presented on the x-axis as calibrated years BP (cal yr BP). Black bars represent period of drier climatic conditions interpreted by the authors of the relevant palaeo record (reference to original publication).

Alongside increases in Astronium and Anadenanthera, other forest pollen taxa such as Helicostylis, Melastomataceae/Combretaceae, Alchornea, and Celtis remain present and do not change in abundance through the mid-Holocene drier period (Fig. 6). These findings support the hypothesis that closed-canopy dry forest is maintained throughout the mid-Holocene drier period but that floristic changes do occur, with an increase in typical dry forest taxa that are more resilient to water stress (Reich and Borchert, Reference Reich and Borchert1984; Nunes da Cunha et al., Reference Nunes da Cunha, Junk and Leitão Filho2007) and hence outcompete more moisture-dependent taxa. The high abundance of Bamusoideae phytoliths, typical of dry forest (Dickau et al., Reference Dickau, Whitney, Iriarte, Mayle, Soto, Metcalfe, Street-Perrott, Loader, Ficken and Killeen2013), at key horizons in the pollen record further supports the interpretation that closed-canopy forest was maintained throughout the Holocene (Fig. 7). This combination of pollen and phytolith analyses strengthens the findings of Whitney et al. (Reference Whitney, Mayle, Burn, Guillén, Chavez and Pennington2014) who first identified this dry forest response at Laguna La Gaiba with increases in Astronium and Anadenanthera pollen up to 8% and 13%, respectively, during the mid-Holocene but found no evidence of opening up of the forest canopy. Despite these floristic changes, palynological richness does not decrease during the mid-Holocene drier period at Laguna Mandioré but remains constant throughout the Holocene (Fig. 6). This finding contrasts with the dry forest record from Laguna La Gaiba, where palynological richness was low from 10,000 to 3000 cal yr BP during the period of drier climatic conditions and increased from 3000 cal yr BP to the present (Whitney et al., Reference Whitney, Mayle, Burn, Guillén, Chavez and Pennington2014). As the Laguna Mandioré record reflects a mixture of dry forest and upland savannah, particularly during the mid-Holocene, the potential loss of diversity in the dry forest may be compensated for by the addition of upland savannah taxa.
This record shows no clear relationship between changes in fire regime and changes in floristic composition in the forest, thus supporting our hypothesis that climate, rather than fire, is the primary control upon floristic composition of the dry forest. Charcoal concentration does not increase during the mid-Holocene drier period, except for a peak near 8000 cal yr BP (Fig. 10). This coincides with the early phase of the mid-Holocene drier period in this region and could represent an intrusion of fire from nearby upland savannah on the Amolar hills. Otherwise, charcoal concentration remains constant throughout the Holocene, strengthening the inference from the nearby Laguna La Gaiba charcoal record (Power et al., Reference Power, Whitney, Mayle, Neves, Boer and Maclean2016) that fire has been a persistent feature of the eastern Chiquitano dry forest where it meets the Pantanal wetlands throughout the Holocene. As the charcoal record at Laguna Mandioré does not appear to be strongly correlated with climatic factors, it is possible that humans may have caused some of the burning in the catchment. No crop indicators such as Zea mays or Cucurbita were found in the Laguna Mandioré vegetation record, but this is not evidence of human absence. Indeed, FEM observed petroglyphs along the shoreline of Laguna La Gaiba that extend below the waterline during the dry season, demonstrating human presence at a time when lake level was lower than in the present day, potentially during the mid-Holocene. Additionally midden and cave sites from across the Pantanal suggest hunter–fisher–gatherer communities were present in the region from 5000 cal yr BP (Bespalez, Reference Bespalez2015). However, the paucity of charcoal records in the Chiquitano region, particularly at the local scale, precludes investigation of the role of humans in influencing the fire regime at present (Maezumi et al., Reference Maezumi, Whitney, Mayle, Gregorio de Souza and Iriarte2018).
Dry forest–upland savannah ecotone at Laguna Mandioré
The abundance of the savannah tree Curatella americana increases markedly during the mid-Holocene drier climatic period, suggesting an increase in upland savannah in the catchment of Laguna Mandioré. Although Curatella americana trees can grow on raised islands (e.g., termite mounds) within the wetlands of the Pantanal, no other taxa typical of these forested islands within the wetlands of the Pantanal (such as Vochysia [Alho, Reference Alho, Fraser and Keddy2005]) were detected in the pollen record. Furthermore, as Curatella americana pollen is poorly dispersed, it is likely to be a local signal, and given that the Mandioré 5 core site is located close to the base of the Amolar hills, the most parsimonious explanation is a downslope expansion of upland savannah on the Amolar hills during the drier period. The increase in δ13C during the mid-Holocene suggests an increase in C4 vegetation in the catchment (Meyers and Teranes, Reference Meyers and Teranes2001; Pessenda et al., Reference Pessenda, Gouveia, Aravena, Gomes, Boulet and Ribeiro1998; Fornace et al., Reference Fornace, Whitney, Galy, Hughen and Mayle2016), which supports the interpretation of increasing upland savannah during this period. This is likely to be a terrestrial signal, as there is also an increase in the C/N ratio during the mid-Holocene, indicating greater terrestrial and reduced algal inputs to the lake sediment during this time (Meyers and Teranes, Reference Meyers and Teranes2001; Fig. 10). This interpretation is supported by climate and vegetation modelling of the mid-Holocene period, which suggests a weaker South American summer monsoon and drier climate during the mid-Holocene leading to a shift in species composition and increase in fragmentation of the forest at ecotones (Maksic et al., Reference Maksic, Shimizu, Oliveira, Venancio, Cardoso and Ferreira2019).
The peak in charcoal concentration around 8000 cal yr BP occurs just before the increase in Curatella americana pollen and the shift in δ13C (Fig. 10). This charcoal peak could indicate an increase in fire in the upland savannah that could have reinforced the climate-driven expansion of upland savannah at the expense of dry forest and a shift in the ecotone. The charcoal could also have been transported from fires within the semideciduous dry forest or dried-out areas of the Pantanal, where occasional fires are known to occur (Oliveira et al., Reference Oliveira, Damasceno-Junior, Pott, Paranhos Filho, Suarez and Parolin2014). As the majority of the particles were between 100 and 180 μm, they are likely to have been transported by wind from the same catchment as the wind-dispersed pollen found in the lake sediment. The pollen record predominantly reflects the dry forest and upland savannah at the Amolar hills ecotone, so it is therefore likely that the charcoal record largely represents fire within these ecosystems.
The expansion of upland savannah at the expense of dry forest would have shifted the ecotone between upland savannah and dry forest down the slopes of the Amolar hills towards lower-elevation areas previously covered by dry forest. This ecotone shift disproves our hypothesis that dry forest–upland savannah ecotones would be static in the face of climatic changes due to their overriding edaphic controls. At Laguna Mandioré, as precipitation decreases during the mid-Holocene, the interaction between drought and fire overrides the edaphic constraints on dry forest distribution and allows the expansion of the upland savannah into deeper, more fertile soils. The mechanism for the shifting of the ecotone and encroachment of upland savannah into dry forest may involve fire as an initial disturbance agent, opening up the canopy and allowing upland savannah to establish and then preventing the reestablishment of closed-canopy forest (Oliveras and Malhi, Reference Oliveras and Malhi2016; Cardoso et al., Reference Cardoso, Oliveras, Abernethy, Jeffery, Lehmann, Edzang Ndong, McGregor, Belcher, Bond and Malhi2018). This suggests that both climate and fire are important drivers of vegetation change at the dry forest–upland savannah ecotone, which indicates that while climate is the primary driver of floristic change within the dry forest, this relationship does not apply to biome turnover at the dry forest–upland savannah ecotone.
The decrease in Curatella americana pollen and δ13C from 3600 cal yr BP (Fig. 10) reflect the reduced extent of upland savannah and upslope shift of the dry forest–upland savannah ecotone to its present position on the slopes of the Amolar hills (Fig. 2). This fits with the timing of precipitation increase in the late Holocene suggested by regional palaeoclimate records, including lake levels at Laguna Titicaca (Baker et al., Reference Baker, Seltzer, Fritz, Dunbar, Grove, Tapia, Cross, Rowe and Broda2001), δ18O records from the Andes (Bird et al., Reference Bird, Abbott, Rodbell and Vuille2011), and sponge and diatom records from the Pantanal (Guerreiro et al., Reference Guerreiro, McGlue, Stone, Bergier, Parolin, Silva Caminha, Warren and Assine2017). This precipitation increase is also reflected in the vegetation at Laguna Mandioré by peak aquatic plant pollen abundance (Fig. 6), the decline in C/N, and high Rb/K and Re/K ratios (Fig. 9). These vegetation changes fit with the regional pattern of forest expansion at the southwestern edge of the Amazon during the late Holocene, as shown by palaeo-vegetation records from Lagunas Chaplin and Bella Vista (Mayle et al., Reference Mayle, Burbridge and Killeen2000; Burbridge et al., Reference Burbridge, Mayle and Killeen2004) to the north and Laguna Yaguarú (Taylor et al., Reference Taylor, Horn, Mora, Orvis and Cooper2010) to the west of Laguna Mandioré.
Implications for future climate change
Climate models predict reduced precipitation for tropical South America in the coming century, with a longer dry season over much of southern Amazonia and up to 30% reduction in precipitation over the Pantanal basin (Marengo et al., Reference Marengo, Chou, Torres, Giarolla, Alves and Lyra2014, Reference Marengo, Alves and Torres2016; Boisier et al., Reference Boisier, Ciais, Ducharne and Guimberteau2015; Duffy et al., Reference Duffy, Brando, Asner and Field2015; Sánchez et al., Reference Sánchez, Solman, Remedio, Berbery, Samuelsson, Rocha and Mourão2015). The long-term implications of reduced precipitation in the Chiquitano dry forest that we have observed from the mid-Holocene record at Laguna Mandioré are threefold.
First, the dry forest is vulnerable to the impact of drought at its ecotones with upland savannah. Reduction in precipitation at these ecotones can lead to an encroachment of upland savannah at the expense of dry forest, potentially through the interacting effects of reduced precipitation and fire. However, the encroachment of upland savannah is likely to be locally restricted to the forest edges, as the ecotone shift was not detected in the pollen record at Laguna La Gaiba 20 km to the north, and the majority of the Laguna Mandioré pollen catchment is still dominated by dry forest during the mid-Holocene. Therefore, the level of precipitation reduction during the mid-Holocene only instigated local-scale biome turnover at the ecotone, not a regional-scale replacement of dry forest by savannah.
Second, the dry forest still dominates the majority of the Laguna Mandioré catchment during the mid-Holocene drier period and maintains closed-canopy forest away from the ecotone with upland savannah. However, there are floristic changes within the dry forest, with a shift towards more drought-tolerant tree taxa such as Anadenanthera and Astronium. The implications of this shift for conservation of the dry forest under climate change depend on the objective of the conservation strategy. If the objective is to preserve the forest biome, for carbon stocks or otherwise, then the results of this study bode well for the future, in that a future drier climate will not cause a regional-scale biome shift to a savannah ecosystem. However, if the conservation of particular taxa is a key goal, then conservation strategies may need to be targeted towards managing their likely changes in distribution and abundance expected under a future drier climate; for example, connectivity measures, such as the maintenance of corridors and buffer zones to allow for future climate-induced range shifts in these taxa, may be needed.
Third, the Mandioré charcoal record strengthens the evidence that fire has been a persistent feature of the eastern edge of the Chiquitano dry forest, where it meets the Pantanal wetlands, throughout the Holocene (Power et al., Reference Power, Whitney, Mayle, Neves, Boer and Maclean2016). This challenges the widely held assumption among many ecologists (e.g., Pennington et al., Reference Pennington, Lavin and Oliveira-Filho2009), based on presence of fire-susceptible taxa such as Cereus (Cactaceae), that this ecosystem is inherently susceptible to fire. However, it is possible that the frequency of fires observed today, most of which are caused by humans clearing land for agriculture, significantly exceeds the fire frequency through most of the Holocene (Power et al., Reference Power, Whitney, Mayle, Neves, Boer and Maclean2016). If so, despite its resilience to Holocene fires, this threatened forest may be especially susceptible to future burning if increased fragmentation of the forest and anthropogenic ignitions are coupled with increased drought and higher temperatures, which would be expected to lead to future fires of significantly greater magnitude and/or frequency than Holocene baseline conditions.
CONCLUSIONS
The long-term impacts of drier climatic conditions during the mid-Holocene on the Bolivian tropical dry forest did not entail large-scale dieback of the forest and replacement by upland savannah. The first hypothesis, that the dry forest–upland savannah ecotone would not shift during the mid-Holocene drier period due to overriding edaphic controls, was not supported. A local-scale shift in the position of the forest–savannah ecotone was found, whereby upland savannah expanded downslope at the expense of the dry forest. This demonstrates that climatic changes can override edaphic constraints at dry forest–upland savannah ecotones. The second hypothesis, that the dry forest would maintain a closed canopy throughout the mid-Holocene drier period with some floristic changes, was supported in the forest away from the ecotone, where floristic composition shifted towards more drought-tolerant tree taxa such as Anadenanthera and Astronium. The third hypothesis, that the root cause of vegetation changes in the dry forest during the Holocene is climate rather than fire, was supported, as there was no clear interaction between the fire regime and the shift in floristic composition within the dry forest. However, at the dry forest–upland savannah ecotone, the proximate (rather than root) cause may have been fire, whereby a drier climate increased flammability, leading to localised upland savannah expansion.
These findings have implications for the conservation of tropical dry forest in South America under future climate change. While there was no evidence for large-scale dieback of the dry forest under mid-Holocene levels of drought, there was a shift in floristic composition, with some taxa increasing significantly at the expense of others. This implies that conservation policy involving corridors and buffer zones will be needed to enable movement of species under future climate change. Furthermore, the dry forest has been shown to be vulnerable to upland savannah encroachment at its ecotones under past drier climatic conditions, with fire potentially reinforcing the expansion of savannah. This finding may have particularly important implications for the cerrado biome, which encompasses a range of savannah physiognomies, including mosaics of dry forest and terra firme savannah (Oliveira Filho and Ratter, Reference Oliveira Filho, Ratter, Oliveira and Marquis2002). In these landscapes, dry forest islands provide habitat heterogeneity both structurally and taxonomically, including supporting mammal populations that are mostly associated with or restricted to forest patches (Klink and Machado, Reference Klink and Machado2005). Under drier climatic conditions, these small islands of dry forest could be under threat from savannah encroachment. As precipitation is reduced with future climate change, the impacts of human land use such as forest fragmentation and use of fires may exacerbate the encroachment of savannah. These complex interactions will be important in determining the vulnerability of the tropical dry forest under future climate change.
ACKNOWLEDGMENTS
We thank José Iriarte from the Department of Archaeology, University of Exeter, UK, for providing training in phytolith preparation and identification and contributing herbarium material to begin the University of Reading tropical phytolith reference collection. We thank the authorities of San Matias National Park and Otuquis National Park for permission to core Laguna Mandioré and Timothy J. Killeen and the Muséo de Historia Natural Noel Kempff Mercado (MHNNKM), Santa Cruz, Bolivia, for logistical support. Rene Guilllen, William Gosling, and Phil Metcalfe assisted with the fieldwork. We acknowledge the Royal Botanic Gardens Edinburgh and the MHNNKM for herbarium material to build up the pollen reference collection. Funding was provided by the University of Reading for a PhD studentship (HJP), the National Geographic Society and the Royal Society for fieldwork funding (FEM), and the Natural Environment Research Council (NERC) Radiocarbon Facility for 6 AMS 14C dates (allocation number 2038.1016) (FEM and HJP). We would also like the thank the editors and reviewers for many useful and thoughtful comments which helped greatly improve this manuscript.


 Open access