


Introduction
Independently designed health warnings have long been used in public health, most notably tobacco. In many countries, governments and independent bodies, rather than the tobacco industry, design and mandate health warnings on cigarette packs, and there is evidence that these warnings increase awareness of smoking risks and promote quitting behaviour (Farrelly et al., Reference Farrelly, Healton, Davis, Messeri, Hersey and Haviland2002, Reference Farrelly, Davis, Haviland, Messeri and Healton2005). In gambling, policymakers are increasingly turning towards population-wide preventive measures, as evidence has accumulated that harms are not confined to a small segment of high-risk gamblers (van Schalkwyk et al., Reference van Schalkwyk, Petticrew, Cassidy, Adams, McKee, Reynolds and Orford2021; Browne et al., Reference Browne, Newall, Rawat, Tulloch, Rockloff, Li, Hing, Russell and Begg2023; Wardle et al., Reference Wardle, Degenhardt, Marionneau, Reith, Livingstone, Sparrow, Tran, Biggar, Bunn, Farrell, Kesaite, Poznyak, Quan, Rehm, Rintoul, Sharma, Shiffman, Siste, Ukhova and Saxena2024). Population-wide measures can include advertising restrictions (McGrane et al., Reference McGrane, Pryce, Wilson, Field and Goyder2024) and restrictions on harmful product design features (Newall, Reference Newall2023). Given this evidence, the UK government recently announced that, from 2026, it will also introduce independently designed messages, developed specifically to replace industry-designed slogans across England, Scotland and Wales (Peacock, Reference Peacock2025).
In 2023, the Australian government also implemented independently designed harm prevention messages for gambling advertising and websites (Chapman and Priestly, Reference Chapman and Priestly2022). This is consistent with evidence that, for example, ‘gamble responsibly’ reminders are routinely ignored by sports bettors (Lole et al., Reference Lole, Li, Russell, Greer, Thorne and Hing2019) and that other industry slogans like ‘when the fun stops, stop’ or ‘take time to think’ have no positive behavioural impacts (Newall et al., Reference Newall, Weiss-Cohen, Singmann, Walasek and Ludvig2022, Reference Newall, Hayes, Singmann, Weiss-Cohen, Ludvig and Walasek2023a). The seven Australian messages use different communication strategies, such as helping gamblers to self-appraise their behaviours (Gaudett et al., Reference Gaudett, Pellizzari, Wood and Wohl2025); highlighting the likelihood of losing money (Newall et al., Reference Newall, Weiss-Cohen, van Baal, Torrance, Andrade, Spicer and Xiao2025b); or highlighting the positive emotional benefits of not gambling (Newall, Weiss-Cohen, Van Baal et al., Reference Van Baal, Bogdanski, Daryanani, Walasek and Newall2025). However, harm prevention messages have also been designed to counter industry narratives that gambling harm is solely a matter of personal responsibility (Mills et al., Reference Mills, Grimes, Caddick, Jenkins, Evans, Moss, Wills and Sykes2023), an approach which has seen success elsewhere in public health.
Counter-industry campaigns have shown demonstrable utility. Products like ultra-processed food, tobacco and alcohol are all promoted by commercial interests despite their potential harms (Kickbusch et al., Reference Kickbusch, Allen and Franz2016). These interests tend to, much like the gambling industry, frame potential harms as issues of personal or individual consumer responsibility, rather than commercial or industry responsibility (Hancock and Smith, Reference Hancock and Smith2017; Chater and Loewenstein, Reference Chater and Loewenstein2023). Counter-industry campaigns aim to disrupt this framing. Counter-industry alcohol advertisements have led to increased perceived awareness of alcohol harms (Dixon et al., Reference Dixon, Scully, Niederdeppe, Brennan, O’Brien, Vandenberg, Pettigrew and Wakefield2023). Framing healthier eating as an adolescent rebellion against food industry advertising led to a reduced consumption of sugary drinks and food (Bryan et al., Reference Bryan, Yeager, Hinojosa, Chabot, Bergen, Kawamura and Steubing2016, Reference Bryan, Yeager and Hinojosa2019). The United States ‘Truth’ campaign demonstrated the effectiveness of counter-industry approaches by exposing tobacco advertising strategies targeting youth, coinciding with a 22% decrease in youth smoking rates between 1999 and 2002 (Farrelly et al., Reference Farrelly, Healton, Davis, Messeri, Hersey and Haviland2002, Reference Farrelly, Davis, Haviland, Messeri and Healton2005).
A local UK government group, Greater Manchester Combined Authority, ran a localized counter-industry gambling campaign called ‘Odds are: they win’ (Mills et al., Reference Mills, Grimes, Caddick, Jenkins, Evans, Moss, Wills and Sykes2023). This campaign featured adverts on public transport and public places, e.g., ‘Gambling harm is not only financial, it can impact your health, wellbeing and relationships’, and ‘The main purpose of gambling companies is to maximise profit, generated through customer losses.’ Peer-reviewed research on this campaign described its co-creative design involving academics and people with lived-experience (Mills et al., Reference Mills, Grimes, Caddick, Jenkins, Evans, Moss, Wills and Sykes2023), but the campaign’s effects have not been studied quantitatively. One experiment which focused just on the campaign’s title found that compared to ‘odds are: they win’, that an alternative framing of ‘odds are: you lose’ appeared more relevant to participants, showing that small word changes can shift perceived relevance (Newall et al., Reference Newall, Weiss-Cohen, van Baal, Torrance, Andrade, Spicer and Xiao2025b). Such effects bear similarities to framing effects, such as in the rare disease problem’s mortality/survival framing difference (Tversky and Kahneman, Reference Tversky and Kahneman1981), or it may instead be perceived as a manifestation of loss aversion (Tversky and Kahneman, Reference Tversky and Kahneman1992). To address this issue, verbal reports from participants exposed to different versions of the ‘odds are’ campaign could improve understanding of the public’s reception of these messages, and how different individuals interpret and reason about them (Ericsson and Simon, Reference Ericsson and Simon1980). This suggests that counter-industry message design and implementation should involve a range of message options/wordings, methodologies and stakeholders both prior to, and following implementation, to ensure independently designed harm prevention messages are both research-informed and empirically effective.
We consulted various sources to better understand how to design counter-industry messages, including harm-prevention information already available to the public. Chapter-one.org is a counter-industry public information webpage developed by people with lived experience of gambling harms. The website contains lay summaries of academic evidence such as Schüll’s (Reference Schüll2012) research on land-based casino and electronic gambling machine design, and information on gambling stigma and the population burden of gambling harms (Browne et al., Reference Browne, Langham, Rawat, Greer, Li, Rose, Rockloff, Donaldson, Thorne, Goodwin, Bryden and Best2016; Langham et al., Reference Langham, Thorne, Browne, Donaldson, Rose and Rockloff2016; Quigley, Reference Quigley2022). Gamblingunderstood.co.uk was developed by the Association of Directors of Public Health Yorkshire and Humber and has similar information as well as a page for members of the public to add their own descriptions of gambling harms anonymously. A wealth of counter-industry information (including from people with lived experience) therefore exists that potential messages could be derived from.
Counter-industry messages could also be derived from research. Gambling advertising tactics, such as those showing gambling in a positive light and offering ‘free bets’ with confusing terms-and-conditions, were highlighted in one counter-industry inoculative video (Torrance et al., Reference Torrance, Russell, Heath and Newall2025). At one-month follow-up, this led to significant increases in knowledge of persuasive industry strategies and a significant decrease in the uptake of ‘free bets’. Additionally, gambling advertising’s use of celebrities (Han and Saunak, Reference Han and Saunak2025) could be particularly memorable or persuasive due to their widespread appeal and perceived credibility (Lamont et al., Reference Lamont, Hing and Vitartas2016). The gambling industry has been estimated to make between 79–88% of its profit from just 10% of people who gamble (Forrest et al., Reference Forrest, McHale, Dinos, Ashford, Wilson, Toomse-Smith and Martin2022; Zendle and Newall, Reference Zendle and Newall2024). Statistics like this could be framed either as an issue of personal responsibility, or a failing of corporate responsibility via the provision of immersive and always-available gambling products (James et al., Reference James, O’Malley and Tunney2019). This non-systematic summary suggests that novel counter-industry messages are worth testing alongside messages derived from existing counter-industry campaigns and websites.
Harm prevention messages can be tested by multiple methodologies that differ in how closely they approximate real gambling behaviour. Randomized controlled trials (RCTs) looking at messages’ effects on behavioural outcomes might produce the most robust evidence. For instance, in naturalistic RCTs, messages are implemented in real gambling environments and people’s own gambling accounts and money are used to assess behavioural change (Heirene and Gainsbury, Reference Heirene and Gainsbury2021). However, the small effect sizes observed in previous RCTs means that this methodology is not well-suited to testing large numbers of candidate messages (Auer and Griffiths, Reference Auer and Griffiths2015). Another approach can use incentivized experiments, in which participants’ decisions determine real monetary gains provided by the experimenter, and therefore have behavioural consequences (Newall et al., Reference Newall, Hayes, Singmann, Weiss-Cohen, Ludvig and Walasek2023a). However, these studies are costly due to the need to endow participants with monetary stakes, and given the large sample sizes needed to detect reliable behavioural effects given the small effect sizes observed from messaging.
A third, more scalable methodology, which was used to select the set of Australian messages (Chapman and Priestly, Reference Chapman and Priestly2022), involves hypothetical self-reports where participants do not gamble with real money and receive no monetary incentives. Instead, they provide self-reported ratings of their perceptions and future intentions in response to messages (e.g., perceived relevance and perceived effectiveness), and no gambling behaviour is directly observed (Davies et al., Reference Davies, Collard, McNair and Leak-Smith2022; Newall et al., Reference Newall, Torrance, Russell, Rockloff, Hing and Browne2024; Rockloff et al., Reference Rockloff, Browne, Russell, Newall, Hing and Armstrong2024). We therefore decided to utilize a hypothetical self-report methodology with four measures (explained further in the Methods section): (1) ‘This message makes me want to gamble less’; (2) ‘This message is relevant to me’; (3) ‘This message is relevant to people experiencing gambling harm’ and (4) ‘I don’t believe this message’. Participants also completed the Problem Gambling Severity Index (PGSI; Ferris and Wynne, Reference Ferris and Wynne2001), to see if any outcomes were moderated by participants’ levels of gambling harm. Participants were also able to enter free-text perspectives on all tested messages, providing an outlet to perform exploratory natural language processing analyses.
The present study was designed as the next step in a broader series of studies evaluating different types of harm prevention messages, extending the knowledge of how different types of messages may potentially be more or less effective for gamblers at different risk levels. Overall, the present work’s aim is to provide timely, policy-relevant evidence on a novel class of counter-industry messages that regulators may consider for implementation, thereby adding to the limited empirical literature and informing subsequent work.
The following aims were preregistered:
1. For each of the four dependent measures, messages will be tested against each other and against the scale midpoint (i.e., 4).
2. To rank all messages based on overall performance, each message will first be ranked from best to worst on each of the four dependent measures, then by calculating each messages’ multidimensional average rank.
3. To see if message rating depends on participants’ PGSI scores, an interaction model will be run on each message and rated dimension.
4. Participants’ voluntary feedback for each message will be explored using sentiment analysis and topic modelling. Additionally, interpretative qualitative analysis will be used to further explore deeper meaning and implicit attitudes within the data.
Methods
Ethical approval was obtained from The University of Bristol #27402. The full supplementary results, data, code and materials are available from: https://osf.io/q6srz. The study’s preregistration can be found at: https://osf.io/uzrvb.
Participants
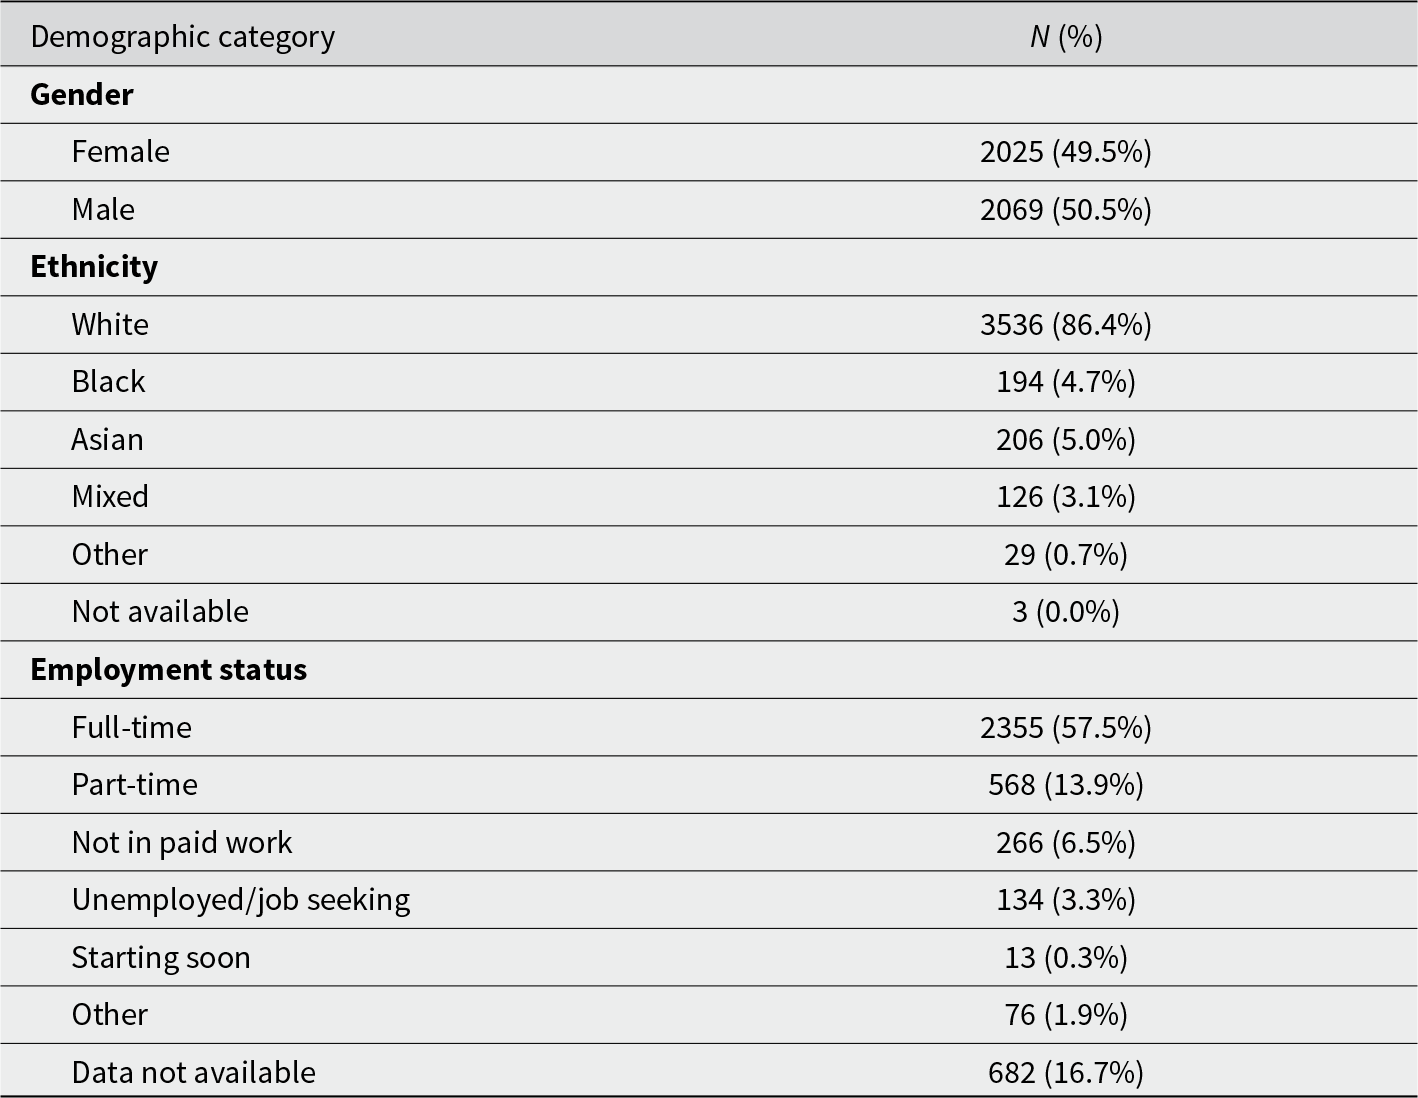
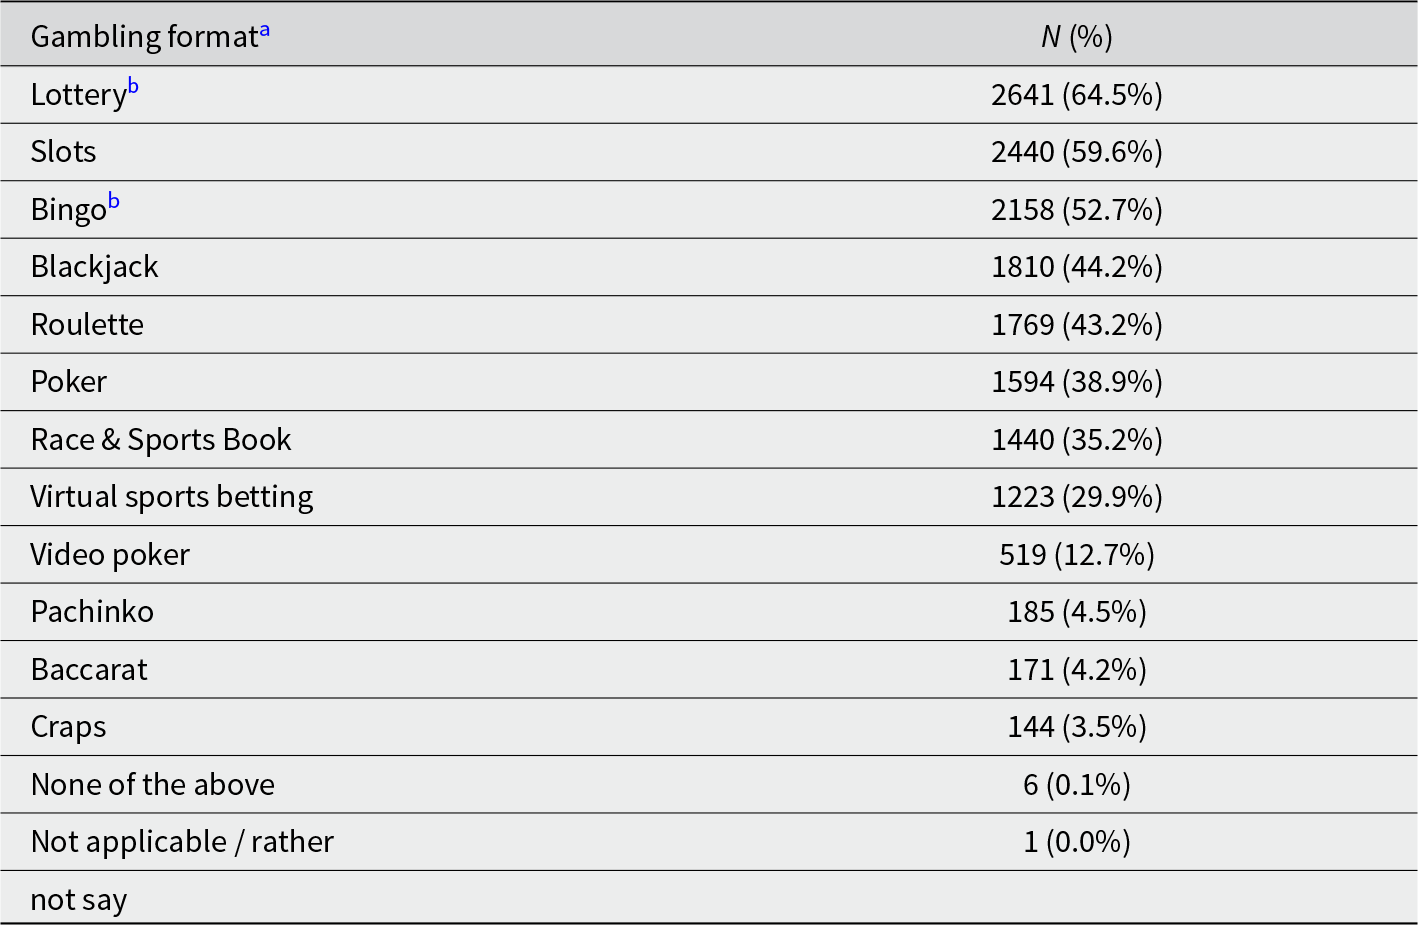
Participants (N = 4,269) were recruited online via Prolific in August 2025, and paid £1 each for their participation (£7.25 per hour pro rata). Average completion time was 8.27 minutes (SD = 7.03). Overall, 49.5% of the sample was female (see Table 1 for further demographics). Eligible participants were UK residents aged 18 or over (Age: M = 40.3, SD = 12.11), who had previously reported to Prolific that they have engaged with at least one non-lottery and non-bingo gambling format (see Table 2), as people who only gamble on these formats tend to be of lower risk of harm (Costes et al., Reference Costes, Kairouz, Monson and Eroukmanoff2018; Maltzahn et al., Reference Maltzahn, Whiteside, Lee, Cox and MacLean2022). A total of 175 participants were excluded (final sample: N = 4,094), 158 for not completing the survey, 13 for self-reported careless responding and 4 for completing the study too quickly in under 2 minutes, which were preregistered exclusion criteria. For this project, producing a precise estimate of different messages’ ranked potential effectiveness is important due to the possible policy implications. In addition, large sample sizes are key for using unsupervised natural language processing techniques. Text responses can be noisy, exhibit uncommon thoughts, and estimating topic distributions over the documents requires a large number of them. We estimated that around one-third of people would leave high-effort data in the text boxes, allowing for a large enough corpus to explore less commonly discussed topics. Due to these two considerations, we chose a relatively large sample size of 4,000 participants. We therefore also make limited inferences about effect sizes, rather than only statistical significance.
Demographic characteristics (N = 4094)

Online gambling engagement (N = 4094)

a Notes:Participants could choose more than one gambling format.
b These participants played the lottery and bingo in addition to another gambling format.
Participants’ average PGSI score was 3.4 (SD = 4.7). Overall, 33.4% of participants scored 0 (no-risk category), 26.3% scored between 1 and 2 (low-risk; M = 1.4), 25.7% scored between 3 and 7 (moderate-risk; M = 4.5), and 14.6% scored 8 or more (high-risk; M = 13.0).Footnote 1
Materials
The 10 messages assessed in the present work, and their corresponding abbreviations, can be found in Table 3. Five messages were selected from existing campaigns and research studies. ‘Gambling products are designed to be addictive’ (abbreviated to Designed Addictive) was selected from Gambling Understood (2023). Two messages were taken from Chapter One’s website: ‘Gambling is designed so there is little time to stop and reflect’ (abbreviated to Little Time). This message was adapted from a longer quote on the website from the Clinical Director of NHS Northern Gambling Service, which is available from Chapter One (2025a). The second is a direct quote from a person with lived experience of gambling harms: ‘Gambling companies make a lot of money, and they’re not doing that by making lots of winners’ (Chapter One, 2025b; abbreviated as Not Winners). The next message, ‘The main purpose of gambling companies is to maximise profit, generated through customer losses’ (abbreviated to Customer Losses), was duplicated from an ‘odds are: they win’ advert (Mills et al., Reference Mills, Grimes, Caddick, Jenkins, Evans, Moss, Wills and Sykes2023). Finally, the message ‘“Free” bets are designed to make you spend your own money’ (abbreviated to Free Bets) was taken from an experimental study testing a counter-industry intervention video on gambling advertising (Torrance et al., Reference Torrance, Russell, Heath and Newall2025).
The 10 counter-industry messages and their abbreviations as ranked by overall performance (average rank across each measure in brackets)
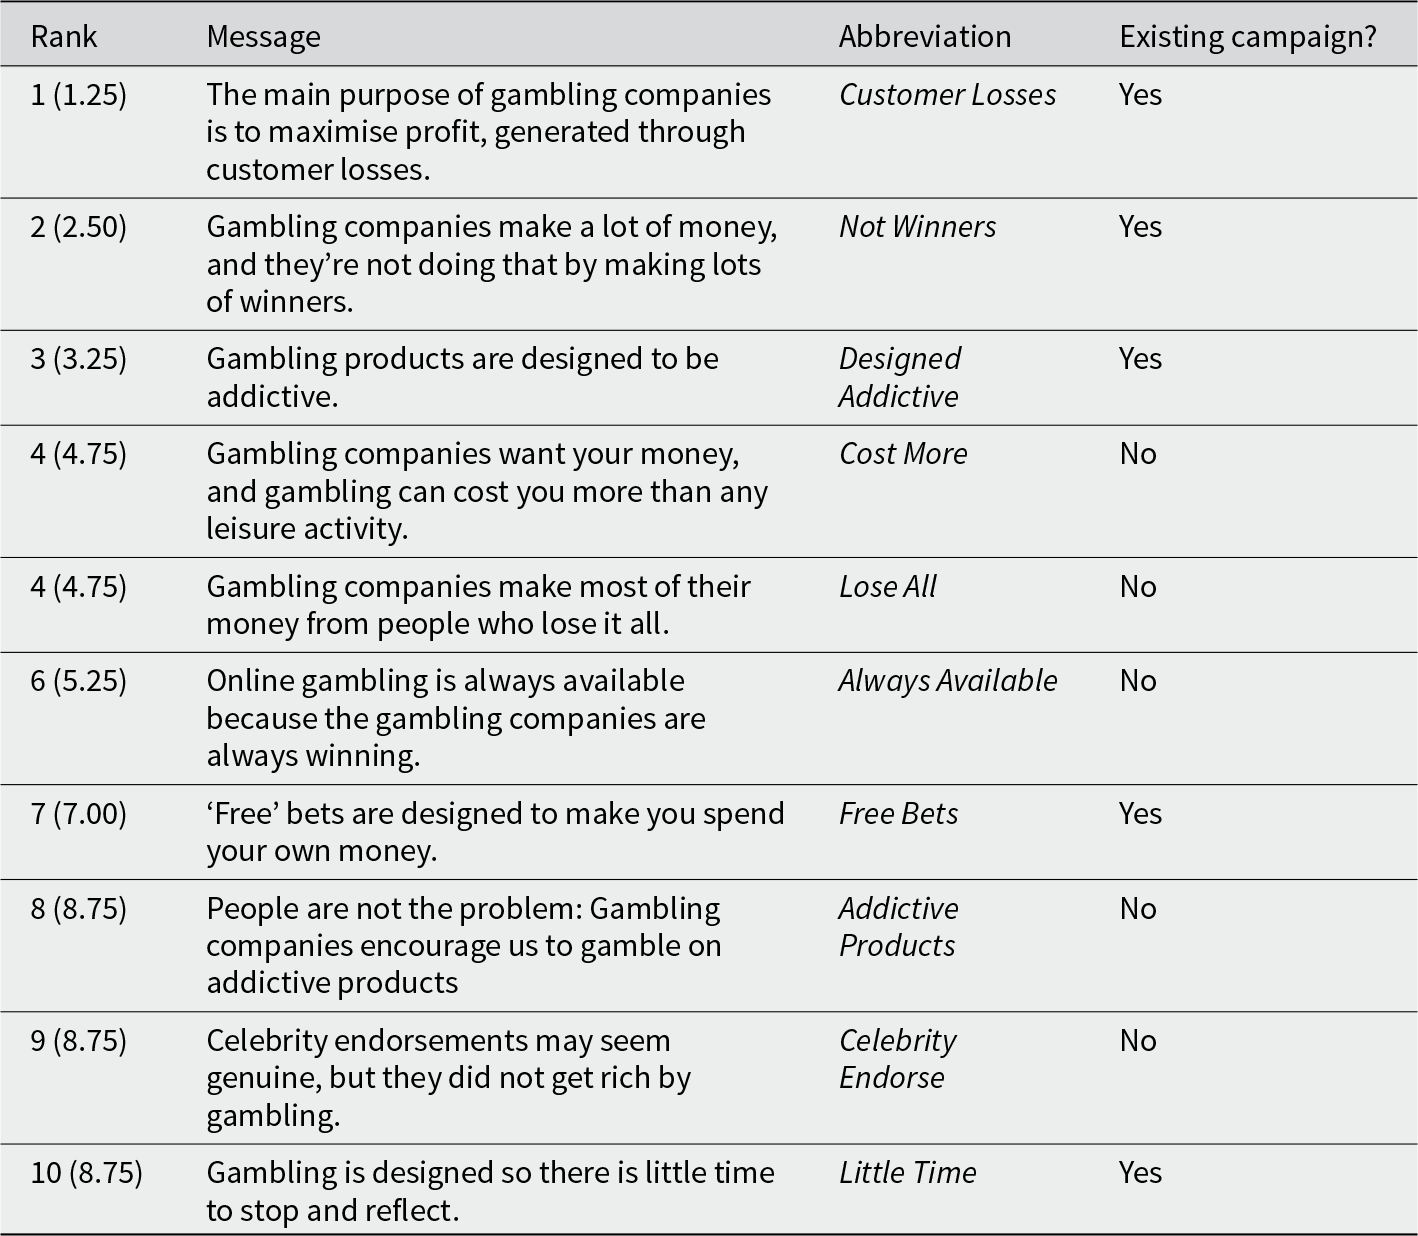
To develop the five novel messages, first, a survey was sent out to 14 gambling researchers and lived experience advocates to gather ideas for new counter-industry messages. The authors used these suggestions to help generate five novel messages. The first message attempted to build on other messages about harmful products to then further attempt to destigmatize harmful gambling ‘People are not the problem: Gambling companies encourage us to gamble on addictive products’ (abbreviated to Addictive Products). Another reads ‘Gambling companies want your money, and gambling can cost you more than any leisure activity’, which challenges the industry-favoured notion that gambling is an inherently harmless pastime (abbreviated to Cost More). Another novel message is similar in intent, ‘Gambling companies make most of their money from people who lose it all’ (abbreviated to Lose All), which is consistent with evidence on the distribution of gambling losses. One novel message reads ‘Celebrity endorsements may seem genuine, but they did not get rich by gambling’ (abbreviated to Celebrity Endorse), which attempts to counter the use of celebrities in gambling advertising. The last novel message reads, ‘Online gambling is always available because the gambling companies are always winning.’ (abbreviated to Always Available), which attempts to explain why online gambling is made so easily available.
For the present work, we chose three self-report measures that were previously used to assess other harm prevention messages: ‘This message makes me want to gamble less’; ‘This message is relevant to me’ and ‘This message is relevant to people experiencing gambling harms’ (Newall et al., Reference Newall, Weiss-Cohen, van Baal, Torrance, Andrade, Spicer and Xiao2025b; Newall, Weiss-Cohen, Van Baal et al., Reference Van Baal, Bogdanski, Daryanani, Walasek and Newall2025). We also used a self-report measure which appeared particularly relevant to counter-industry messages. Since any framing of corporate responsibility is relatively rare in gambling, participants were asked to rate their agreement with the measure, ‘I don’t believe this message.’ All measures were assessed using four 7-point Likert scales (from strongly disagree to strongly agree). For each message, the option to provide free-text feedback was given to participants using the following instruction: ‘Feel free to enter any thoughts that you might have on this message’.
Procedure
Following provision of an information sheet and participants giving consent, the order of completing the PGSI and message ratings were randomized. The order in which the messages appeared was also randomized for each participant. Additionally, the order of the four dependent measures was randomized at the start of the study for each participant, but remained the same across all 10 messages shown to that participant (e.g., if ‘relevant to me’ was the first dependent variable presented for message 1, that remained the same for all other messages for that participant). Finally, at the end of the survey, participants were given the opportunity to provide overall study feedback and answer a self-reported carelessness check. The data from those who answered ‘No, I was not paying attention, discard my data’ in the carelessness check were excluded (Brühlmann et al., Reference Brühlmann, Petralito, Aeschbach and Opwis2020).
Analytical approach
Research aim 1
Because the responses were provided on an ordinal scale, four separate cumulative-link mixed-effects models (one per DV) were run, using the R function clmm from package ordinal (Christensen, Reference Christensen2024), each with fixed effects for message (the factor identifying each message m, with a scaled zero-sum contrast coding) and message-order (zero-indexed: 0–9), as well as their interaction. Additionally, each model contained a random-intercept for each participant: DV ∼ InterceptParticipant + Messagem + Order + Messagem × Order. As per preregistration, a random slope for message-order was not included as all models either had random slope variance close to zero or did not converge. Message order was introduced as a covariate to control for order effects; all inference was conducted by calculating the estimated marginal mean responses with R function emmeans (Lenth and Piaskowski, Reference Lenth and Piaskowski2025), by setting Order = 0, which evaluates each message as the first to be presented, i.e., controlling for order effects.
To reduce the potential for Type I error inflation due to the four dependent variables being analysed, a base confidence level (α) of p < .01 was used before any adjustments for multiple-comparisons; we divided the base confidence level by a more conservative factor of 5. Moreover, this reduction was considered a necessary precaution to ensure significant effects were statistically robust in the context of our large sample size (N = 4,094), and the high number of pairwise comparisons conducted across 10 messages. Compact-letter displays (CLDs) were used to identify different groupings of similarities using pairwise comparisons across all messages, with Sidák-adjusted p-values for multiple comparisons (adjusted α threshold equivalent = .00022). The CLDs provided a visual representation of the pairwise comparisons by grouping means that were not significantly different from one another. Specifically, if two messages shared at least one letter group in the CLD, this meant they were not significantly different after adjusting for multiple comparisons. In our figures, messages that share a letter group are connected by a line. The same model was used to test if each answer was significantly different from the neutral response (i.e., 4), with a Sidák-adjusted α threshold equivalent = .001 due to the lower number of comparisons than the CLD.
Research aim 2
To rank messages by overall performance, each message was first ranked from best to worst on each dependent measure, with ‘I don’t believe this message’ reverse-scored. Each message’s multidimensional average rank was then calculated.
Research aim 3
Mean-centred PGSI scores were added as covariates to each of the four models (with two-way interactions): DV ∼ InterceptParticipant + Messagem + Order + PGSI + Messagem × Order + Messagem× PGSI + Order × PGSI. The effects of PGSI scores on the four outcomes were then tested via their main and interaction (Message × PGSI) coefficients. To assess how ratings varied with PGSI scores, the slope of the PGSI interaction for each message was tested against zero. A CLD table was used to identify the groups of messages with similar PGSI slopes, based on Sidák-adjusted comparisons, as done before.
Research aim 4
Sentiment analysis was conducted with an open source model from HuggingFace, which classifies paragraphs and sentences as negative, neutral or positive. The purpose of the neutral category is to separate sentiment-rich from sentiment-poor data, identifying feedback more likely to contain useful technical information. The present study’s preregistration contained several pre-processing steps for the sentiment analysis, including text cleaning, tokenization, lemmatization and removal of stopwords. However, it was concluded that model performance improved without the text cleaning steps, which is not unusual for sentence-transformer models. For this reason, a conservative filtering approach was used, such as variations of ‘none’ and ‘N/A’, before responses were analysed.
For the topic modelling, preprocessing steps were also left out for the same performance-related reasons stated above. However, the preregistered step of removing excessively short comments (<3 words) was kept. After character length per response was assessed, BERTopic was selected as the most appropriate model (Grootendorst, Reference Grootendorst2022). Due to its use of embeddings to represent meaning, this model tends to perform better with short documents than classical models such as Latent Dirichlet allocation, which often rely on word co-occurrence to produce coherent topics. Encoded embeddings undergo dimensionality reduction, here with the use of Uniform Manifold Approximation and Projection (UMAP; McInnes et al., Reference McInnes, Healy and Melville2020), before they are clustered. Hierarchical Density-Based Clustering for Applications with Noise (HDBSCAN) was then used for the clustering algorithm (McInnes et al., Reference McInnes, Healy and Astels2017). Finally, the BERTopic model used ‘all-MiniLM-L6-v2’ as the embedding model (Wang et al., Reference Wang, Wei, Dong, Bao, Yang and Zhou2020).
To enhance the topic modelling, a semantic thematic analysis was also conducted on the 50 most representative responses from each topic cluster (Braun and Clarke, Reference Braun and Clarke2006). This analytical approach was chosen since it is well-suited for the brief text available here, as it focuses on surface-level content rather than latent themes (Terry et al., Reference Terry, Hayfield, Clarke, Braun, Willig and Rogers2017). Based on established research investigating online communication data (Voroshilova and Pesterev, Reference Voroshilova and Pesterev2021; van den Haspel et al., Reference van den Haspel, Reddington, Healey, Li, Dior and Cheng2022; Conti et al., Reference Conti, Nikokavoura and Starr-Vaanholt2024), a deductive coding approach was used to first analyse each message as a distinct primary theme, and then to identify subthemes related to message relevance and effectiveness. To improve the accuracy and reliability of our interpretations, regular team meetings were conducted to ensure analytical consistency and alignment with the study’s aims.
Results
Research aim 1: differences between each message
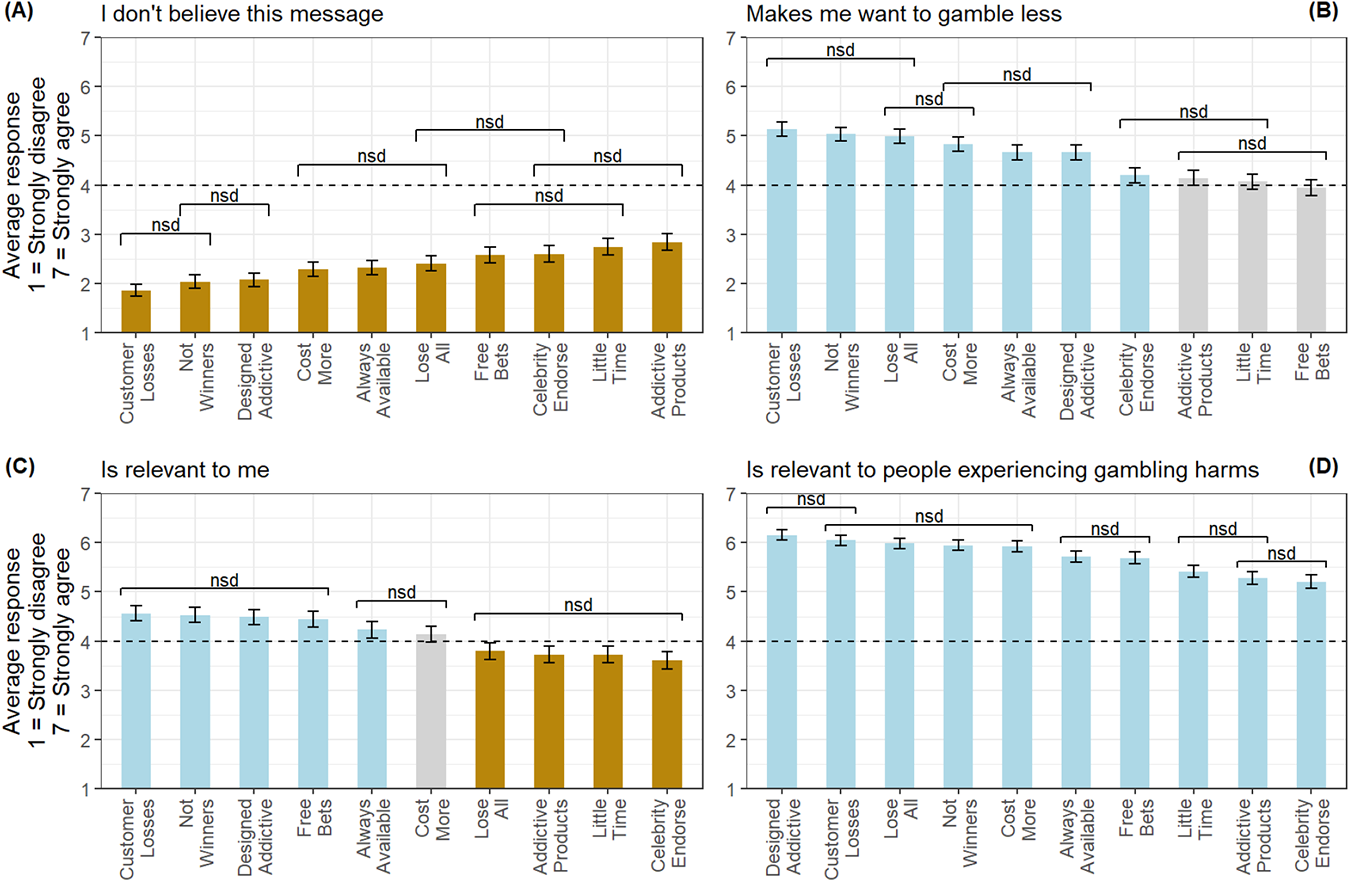
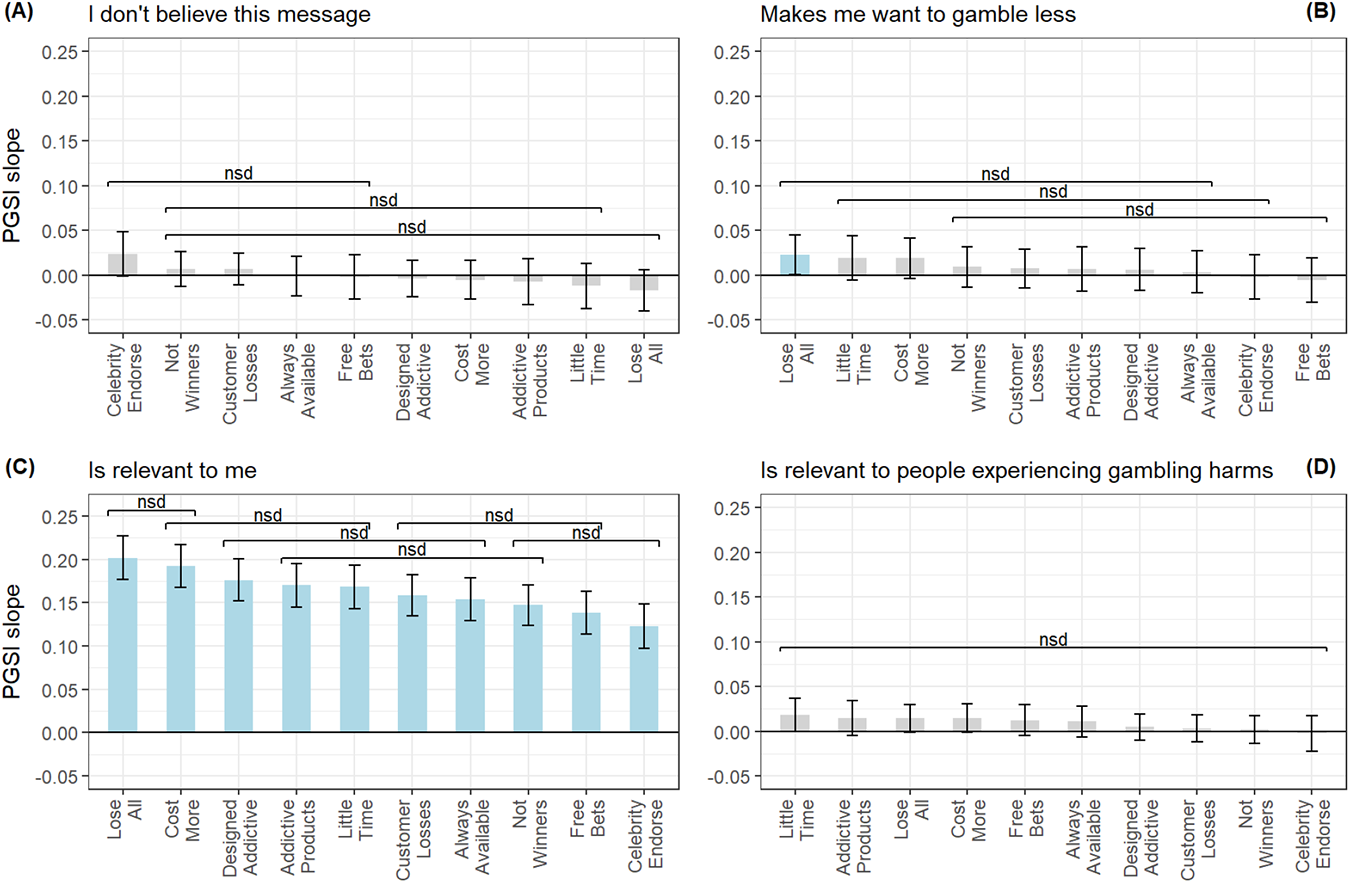
Results for all four dependent variables are shown in Figure 1 (full results are available in the online Supplementary Analysis at: https://osf.io/aqvzf?view_only=09763306726c4962b86a8ecf374b41fa). Figure 1A shows the results for the ‘I don’t believe this message’ dependent variable. All messages were significantly below the scale mid-point of 4, meaning that on average, participants believed the messages. Across all 10 messages, Customer Losses scored the best (M = 1.86, 99% CI = [1.74, 1.98]), while Addictive Products scored the worst (M = 2.84, 99% CI = [2.67, 3.02]). The CLD summarized pairwise tests into six overlapping groups, with one message placed across three separate groups (Celebrity Endorse), and several others across at least two groups. Because the variability range across messages was small (0.98 from best to worst), these results indicate that the messages were quite similar to each other.
Mean responses to the four dependent variables across the ten messages. Horizontal lines identify groups of messages that were not significantly different (nsd) from each other at p < .01 (after adjustments for multiple comparisons). Means were estimated at Order = 0, i.e., as the first message shown, adjusting for order effects. The dotted line at 4 identifies the neutral mid-point. Color-coding identifies messages above (blue), at (grey) or below (gold) this mid-point.

Figure 1B shows the results for the ‘This message makes me want to gamble less’ dependent variable. Seven messages were significantly above the scale mid-point of four (Customer Losses, Not Winners, Lose All, Cost More, Always Available, Designed Addictive, Celebrity Endorse), with Customer Losses showing best score overall (M = 5.14, 99% CI = [5.00, 5.28]). No messages scored significantly below four. The variability range was 1.18 from best to worst, with the CLD table showing several overlapping groups, including four messages placed in at least two groups (Lose All, Cost More, Addictive Products, Little Time).
The results for the dependent variable ‘This message is relevant to me’ can be found in Figure 1C. Five messages scored significantly above the scale mid-point (Customer Losses, Not Winners, Designed Addictive, Free Bets, Always Available), with Customer Losses showing the best overall score (M = 4.56, 99% CI = [4.41, 4.72]). Four messages scored significantly below the mid-point (Lose All, Addictive Products, Little Time, Celebrity Endorse), with Celebrity Endorse showing the worst score (M = 3.61, 99% CI = [3.43, 3.78]). Although the range of variation on this variable (0.95 scale points) was similar to the one on the ‘I don’t believe this message’, the CLD placed messages in three, more clearly defined, groups.
Figure 1D shows the results for the ‘This message is relevant to people experiencing gambling harms’ variable. All 10 messages scored significantly above the scale mid-point, with a variability range of 0.94 scale points. Design Addictive had the best score (M = 6.16, 99% CI = [6.06, 6.26]) and Celebrity Endorse the worst (M = 5.20, 99% CI = [5.07, 5.34]). The CLD placed the messages into five groups with some, albeit less, overlap than the first two variables, as only two messages were placed into two groups (Customer Losses and Addictive Products).
Research aim 2: overall message ranking
Table 3 shows all 10 messages ranked according to the preregistered methodology. The top three highest scoring messages were replicated from existing materials aimed at informing the public and reducing gambling-related harm: ‘The main purpose of gambling companies is to maximise profit, generated through customer losses’ (Customer Losses; Mrank = 1.25), ‘Gambling companies make a lot of money, and they’re not doing that by making lots of winners’ (Not Winners; Mrank = 2.50), and ‘Gambling products are designed to be addictive’ (Designed Addictive; Mrank = 3.25). Two of the three worst performing messages were novel (Addictive Products and Celebrity Endorse), indicating that continued testing is needed for the development of effective counter-industry messages.
Research aim 3: PGSI interactions
Figure 2 shows how responses varied with participants’ PGSI scores across all four dependent variables. Interaction effect results for the ‘I don’t believe this message’ dependent variable can be seen in Figure 2A. The CLD placed messages in three distinct groups, with several messages overlapping across them. None of the messages had a significant interaction effect, showing that the marginal effect of PGSI was not different from zero, indicating that participants did not disbelieve the messages overall at any PGSI level. Figure 2B shows the results for the ‘this message makes me want to gamble less’ variable, where no individual message saw a significant interaction effect, and the CLD placed all messages in three overlapping groups. Participants’ ratings for this measure were unrelated to their PSGI level.
PGSI interaction slopes for the responses to the four dependent variables across the ten messages. Positive slopes represent higher responses as PGSI increases. Slopes were estimated at Order = 0, i.e., as the first message shown, adjusting for order effects. Horizontal lines identify groups of messages that were not significantly different (nsd) from each other at p < .01 (after adjustments for multiple comparisons). Color-coding identifies PGSI slopes for messages above zero (blue) or at zero (grey).

The results for the ‘this message is relevant to me’ variable can be seen in Figure 2C. All 10 messages showed a significant positive PGSI interaction. This means that participants with higher PGSI scores saw all counter-industry messages as more relevant to them, indicating that these messages resonate the most with individuals experiencing higher levels of gambling-related harm. The CLD placed messages in six overlapping groups showing that interaction effects were relatively similar. The marginal effects plot in Section 3.6.3 of the Supplementary Analysis showed that, at a PGSI score of 2, participants began rating the messages as personally relevant, with agreement increasing at higher PGSI scores. This suggests that these messages were highly relevant to gamblers in higher risk categories. Figure 2D shows the results for the ‘this message is relevant to people experiencing gambling harms’. None of the messages saw a significant interaction effect, suggesting no evidence that PGSI scores were associated with people’s judgment of relevance to those experiencing gambling harms. All messages were placed in one CLD group, and participants’ ratings did not change as PGSI scores increased.
Aim 4: sentiment and topics in free-text responses
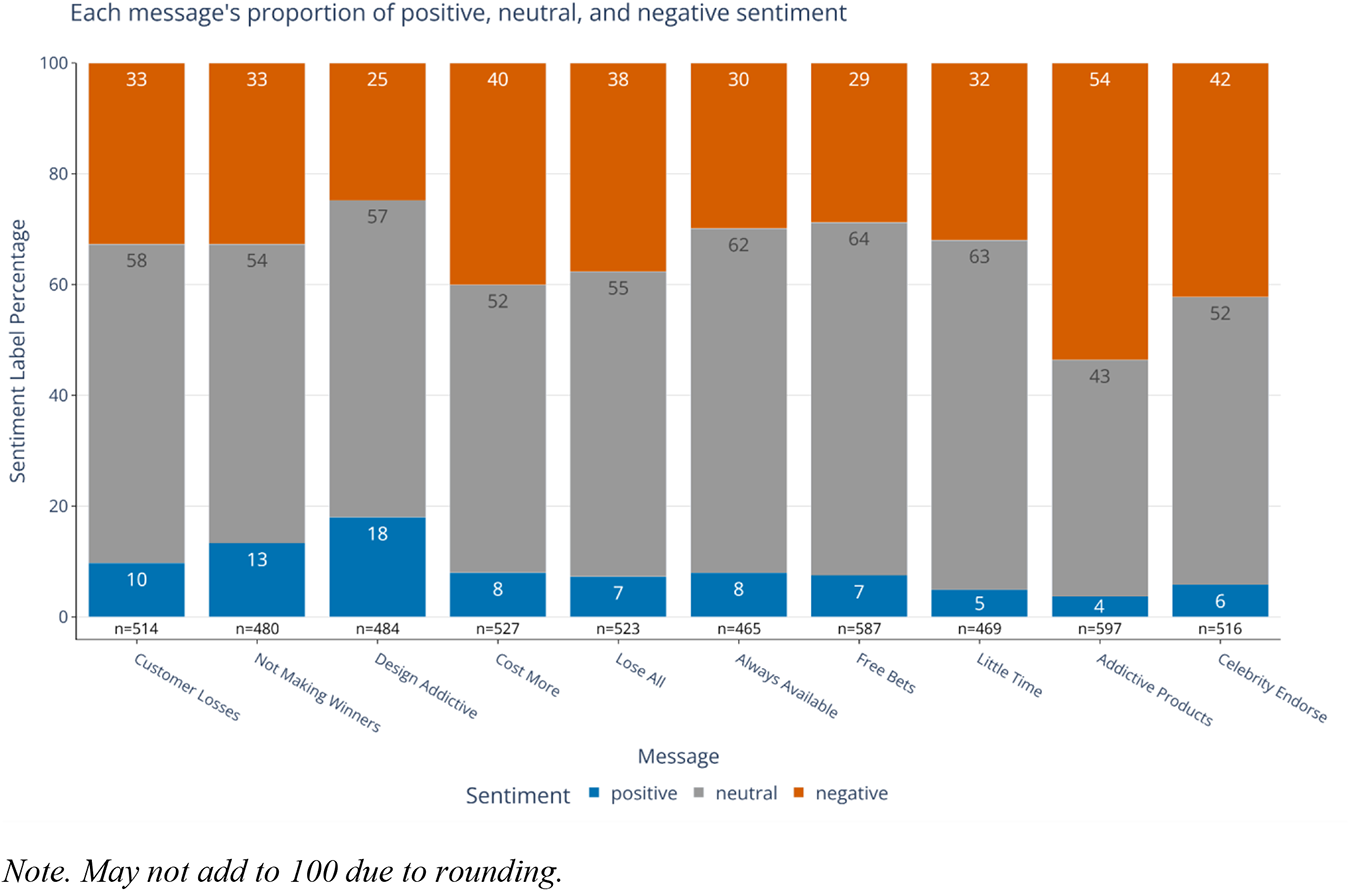
Figure 3 shows the results for the sentiment analysis, with messages in the same order as Table 3’s ranking. For all messages, participants were more likely to give negative rather than positive feedback. The mean odds of positive feedback being given over negative feedback were 0.27:1, indicating that negative responses were, on average, 3.7 times as likely. Designed Addictive was the message most likely to get positive feedback, followed by Not Winners. Addictive Products and Little Time were the messages least likely to get positive feedback relative to negative ones. These findings are broadly consistent with the results from Research Aim 2, as messages most likely to get positive feedback ranked 2nd and 3rd overall, and the ones least likely to get positive feedback were placed in 8th and 9th places. Out of the three possible categories (i.e., neutral, positive, negative), neutral was the most common sentiment for nine messages: Always Available, Celebrity Endorse, Cost More, Customer Losses, Designed Addictive, Free Bets, Little Time, Lose All and Not Winners. Negative was the top sentiment for one message (Addictive Products), while all other messages’ most common sentiment was neutral. None of the messages had positive as the most common sentiment.
Sentiment labels assigned to feedback responses per message in percentage of the number of feedback responses received for that message.

The topic modelling produced highly interpretable and well-separated topics, with high coherence across messages (C v coherence: [0.688, 0.807]; Röder et al., Reference Röder, Both and Hinneburg2015). The thematic analysis of each main topic, with the corresponding number of responses in that topic (i.e., the size of the model cluster (n)), is displayed below in the same order as Table 3’s ranking. The semantic analysis results have different Ns because of the differently sized main topics based on the best clustering solution for each statement. As per the methodology, the semantic analysis focused on the 50 most representative responses from each question’s main topic.
Customer Losses (n = 156): This message faced criticism for being ‘too wordy’ and ‘a bit long and clunky’. Despite agreeing factually, participants felt ‘it is true but doesn’t hit the emotional notes that it needs to’. Some described it as ‘too corporate’ and preferred ‘shorter and more to the point’ messaging.
Not Winners (n = 300): Participants found this logical but potentially ineffective. While acknowledging operators ‘couldn’t remain in business if more people win’, many noted operators ‘will often make lots of small winners to suck people in’. Some felt it was ‘too long’ and needed to be ‘snappier’ for greater impact.
Designed Addictive (n = 121): Overwhelming agreement characterized responses, with participants stating ‘100% true, no other way around it’ and describing it as ‘punchy and clear’. Most felt ‘this is a message that needs highlighting’ and appreciated its directness, calling it ‘straight to the point’.
Cost More (n = 255): Mixed responses emerged about gambling costs relative to other activities. While some acknowledged ‘gambling can cost you your home, loss of family, and even cost some people their lives’, others argued ‘I can think of lots of leisure activities that cost much more than gambling.’ Overall, the message divided participants based on personal gambling experiences.
Lose All (n = 96): Participants questioned this claim’s accuracy, stating they ‘don’t believe it because companies tend to make money regardless, there are many more smaller gamblers’. Many felt ‘companies make the most money from consistent gamblers’ rather than those who lose everything, viewing the statement as oversimplified.
Always Available (n = 283): Participants accepted this as factual but questioned its effectiveness. Most felt it was ‘not really a statement that would put people off from gambling, more stating facts’. Many noted that ‘the majority of people who gamble know that gambling companies always win’ but ‘it won’t stop people from gambling’.
Free Bets (n = 452): Strong recognition emerged that free bets ‘are a con so you will spend your own money’. Participants understood they ‘are designed to hook you in’ and noted ‘absolutely true, win a little in a free bet then you chase that with your own money’.
Little Time (n = 103): This received a weak response, with participants finding it ‘not powerful’ and lacking clarity. Many stated that they ‘didn’t find the message to be that obvious’ and that it was ‘not powerful to get across its meaning’. Participants also struggled with its vagueness, calling it ‘too philosophical’.
Addictive Products (n = 382): This message revealed polarized views on personal versus corporate responsibility. While participants acknowledged that operators ‘encourage addiction through freebies’, many maintained that ‘people are the problem’. Some recognized that ‘addiction is more complex’ than the message’s implication and that it may ‘give gamblers an excuse to carry on gambling’.
Celebrity Endorse (n = 182): Strong consensus emerged that celebrity endorsements are morally questionable. Participants stated ‘celebrities should not endorse gambling at all’ and that they ‘lose respect for celebrities who promote gambling’. However, some questioned the message’s relevance, arguing that ‘celebrity endorsements are not the reason for people suffering from gambling addiction’.
Exploratory analyses
To assess potential order effects, we also conducted exploratory analyses (non-preregistered), with full details in Section 3.7 of the online results document. Results showed that PGSI scores were significantly lower (M = 3.2) when the PGSI scale was given to participants after the messages (i.e., at the end of the study), and significantly higher (M = 3.6) when given before the messages (t(4078.9) = −3.09, p = .001). Responses to each dependent variable were not significantly influenced by order of blocks, meaning that showing messages before or after the PGSI did not affect participants’ ratings across all 10 messages (Sidák-adjusted α threshold of p < .01, see section 3.7.1).
Analyses were also conducted to investigate order effects across the 10 messages. Because we tested 10 messages across 4 separate dependent variables, there were 40 possible interaction terms (10 messages × 4 dependent variables). Out of the 40 possible interactions, 19 were significant. In each significant interaction, later messages tended to be appraised more positively than earlier messages: Not Winners (‘this message is relevant to people experiencing gambling harms’); Designed Addictive (‘all four dependent measures’); Free Bets (all four dependent measures); Little Time (‘this message makes me want to gamble less’, ‘this message is relevant to me’); Addictive Products (‘this message makes me want to gamble less’, ‘this message is relevant to me’, ‘this message is relevant to people experiencing gambling harms’); Celebrity Endorse (all four dependent measures); and Lose All (‘this message is relevant to me’).
The detailed analysis and results document in OSF (https://osf.io/q6srz/files/7vu2g?view_only=09763306726c4962b86a8ecf374b41fa) also shows the results of the additional exploratory investigations controlling for demographics (age and sex: see Section 3.7.2), as well as a between-subjects robustness check using only the first message seen by each participant (see Section 3.7.3).
Discussion
The gambling industry’s messaging emphasizes personal responsibility (Hancock and Smith, Reference Hancock and Smith2017), much like the messaging of other harmful industries (Kickbusch et al., Reference Kickbusch, Allen and Franz2016; Chater and Loewenstein, Reference Chater and Loewenstein2023). Given the success of counter-industry messaging in some of these other industries (Hersey et al., Reference Hersey, Niederdeppe, Ng, Mowery, Farrelly and Messeri2005; Bryan et al., Reference Bryan, Yeager, Hinojosa, Chabot, Bergen, Kawamura and Steubing2016, Reference Bryan, Yeager and Hinojosa2019; Dixon et al., Reference Dixon, Scully, Niederdeppe, Brennan, O’Brien, Vandenberg, Pettigrew and Wakefield2023), counter-industry messaging in gambling appears logical yet relatively underexplored. Among the ten tested messages, the best-performing three all came from existing campaigns or websites, suggesting that these counter-industry efforts might have validity more broadly. Participants believed the messages on average despite the novelty of this messaging approach and rated all ten messages as relevant to people experiencing gambling harm. However, only seven messages made participants want to gamble less, and five were rated as personally relevant to participants. Importantly however, personal relevancy rates did increase significantly with PGSI scores, indicating that the tested messages may be particularly relevant to high-risk gamblers. Moreover, participants displayed more negative than positive sentiment in their feedback, although neutral was the top sentiment across the vast majority of messages, with only one message showing negative sentiment as the most common. Overall, these findings suggest multiple ways in which counter-industry gambling messages can be optimized moving forward.
Findings from the topic and semantic thematic analysis highlight important recommendations for future research. Consistent with one previous study (Newall, Weiss-Cohen, Van Baal et al., Reference Van Baal, Bogdanski, Daryanani, Walasek and Newall2025), several comments emphasized preferences for shorter messages. Importantly, although Designed Addictive and Addictive Products both emphasized the link between product design and harm, the former received overwhelming agreement and was the message most likely to get positive feedback. In contrast, Addictive Products was the only message with negative sentiment as the most common, with participants also showing clear polarized views on the ‘people are not the problem’ phrase in this message. Overall, this highlights a widespread agreement with personal responsibility framing (Marko et al., Reference Marko, Thomas, Robinson and Daube2022), which can inform the design and also highlight the need for counter-industry messaging.
Two key findings from the exploratory analysis should be highlighted and may also provide important insights for future research. PGSI scores were significantly lower when participants completed the PGSI after rating the 10 counter-industry messages. One possible interpretation is that exposure to counter-industry messages was associated with a difference in participants’ sense of personal responsibility, contributing to reduced feelings of self-blame, which are often observed in individuals experiencing gambling-related harm (Marko et al., Reference Marko, Thomas, Robinson and Daube2022; Van Baal et al., Reference Van Baal, Bogdanski, Daryanani, Walasek and Newall2025). However, this interpretation is made with caution, and further research is needed to see if these results can be replicated. Secondly, all of the significant order interactions effects showed that counter-industry messages tended to be appraised more favourably after participants had rated previous messages. This suggests a ‘mere exposure effect’ (Zajonc, Reference Zajonc1968), where anti-smoking advertising has been shown to become more effective with repetition (Reinhard et al., Reference Reinhard, Schindler, Raabe, Stahlberg and Messner2014). The mere exposure effect could also partly explain why messages from existing campaigns were ranked highest here, as these were the statements that participants may have read before. Counter-industry messaging may become more effective when its core message is repeated in multiple ways and from multiple sources, which would align with evidence that repeated advertising exposure is associated with changes in consumer behaviour (Schmidt and Eisend, Reference Schmidt and Eisend2015).
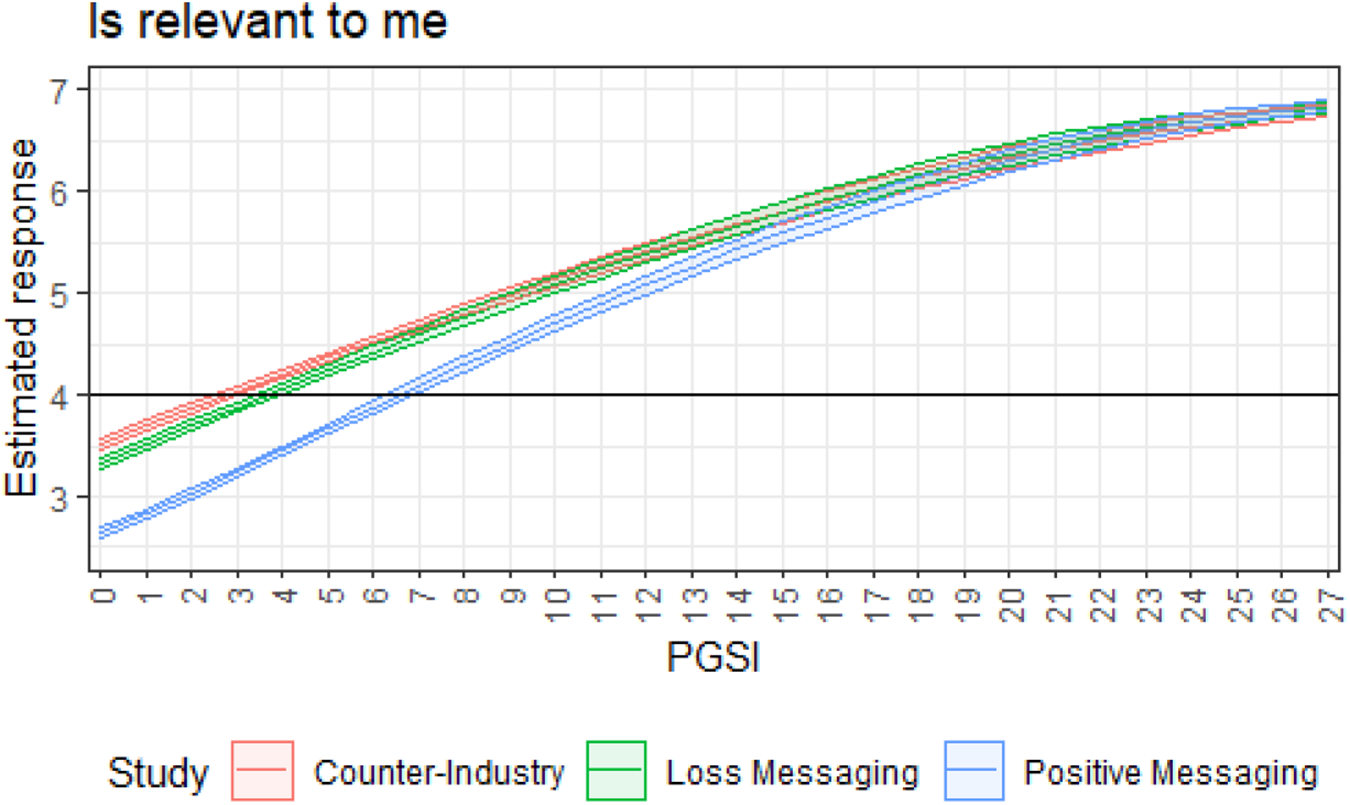
Different gambling harm prevention message types are thought to resonate best with different groups (Newall et al., Reference Newall, Rockloff, Hing, Thorne, Russell, Browne and Armstrong2023b; Ray et al., Reference Ray, Thomson, Beyer, Williams, Stoniute, Arisa, Vlaev, Oliver and Kelly2024). Previous studies have looked at likelihood of loss (Newall et al., Reference Newall, Weiss-Cohen, van Baal, Torrance, Andrade, Spicer and Xiao2025b) and positive emotional message types (Newall, Weiss-Cohen, Van Baal et al., Reference Van Baal, Bogdanski, Daryanani, Walasek and Newall2025), while using three of the same dependent measures including here and also recording participants’ PGSI scores. An exploratory re-analysis of the combined data of all three experiments (Figure 4, see OSF for full results) showed there were significant interactions between PGSI scores and message type for ‘this message is relevant to me’ (χ 2(2) = 30.31, p < .001). There were no significant interactions for the other two measures (‘this message makes me want to gamble less’, p = .19, and ‘this message is relevant to people experiencing gambling harm’, p = .078). Figure 4 shows that for the ‘relevant to me’ outcome, all three message types converged as PGSI increased. However, personal relevancy began to appear at lower PGSI scores for the counter-industry messages (counter-industry ≈ 2.5; likelihood of loss ≈ 3.3; positive emotional messaging ≈ 6.2). These preliminary findings tentatively support the implementation of counter-industry messages in campaigns targeting the wider population, while positive emotional messages could be better suited for high-risk groups (e.g., in-game pop-ups). Overall, these results provide support for more controlled future investigations comparing different harm prevention message types across different audiences.
Results of a combined ordinal analysis comparing effects of PGSI interactions between the 10 counter-industry messages in this study, the 10 positive emotional messages from Newall, Weiss-Cohen, Van Baal et al. (Reference Van Baal, Bogdanski, Daryanani, Walasek and Newall2025) and 10 loss messages from Newall et al. (Reference Newall, Weiss-Cohen, Petrovskaya, Torrance, Palmer and Xiao2025a).

Several limitations can be identified in the present work. The sample was recruited using a crowdsourcing platform, which means the findings cannot be generalized to the population of people who gamble (Pickering and Blaszczynski, Reference Pickering and Blaszczynski2021). Moreover, while hypothetical self-reporting ratings have been used in similar studies (Chapman and Priestly, Reference Chapman and Priestly2022), perceived message effectiveness may not correspond with behavioural outcomes (Noar et al., Reference Noar, Barker, Bell and Yzer2020). This intention-behaviour gap has been extensively researched and highlights the potential discrepancy between self-reported intention (e.g., wanting to gamble less) and actual behaviour change (Conner and Norman, Reference Conner and Norman2022). Future research should therefore complement self-reports with more robust naturalistic field trials that measure real world gambling behaviour (Heirene and Gainsbury, Reference Heirene and Gainsbury2021). We also identified discrepancies between Likert ratings and free-text feedback, which could have several potential explanations. First, these discrepancies could suggest that, to some extent, participants might have felt inclined to give ratings they perceived as appropriate in the Likert scales, indicating a degree of social desirability (Mensch and Kandel, Reference Mensch and Kandel1988; Fisher and Katz, Reference Fisher and Katz2000). Additionally, our Likert items focused on belief, perceived relevance and motivation to gamble less, whereas the open-text responses often emphasized different dimensions (e.g., perceived tone and message structure), which were not directly measured on the rating scales. Moreover, usable free-text comments were provided on only 5,162 of 40,940 possible message ratings (12.6%), indicating that our sentiment analysis was based on a relatively small subset of trials. Given that voluntary feedback can attract more dissatisfied respondents, negative comments might have been disproportionately represented (Poncheri et al., Reference Poncheri, Lindberg, Thompson and Surface2008). Finally, trials with usable comments displayed somewhat more critical quantitative responses than trials without comments. For example, on the reverse-scored belief item, mean scores were 5.46 vs 5.34 in non-comment and comment trials respectively, with a similar pattern for ‘this message makes me want to gamble less’ (4.60 vs 4.33), perceived personal relevance (4.21 vs 4.13) and perceived relevance to those experiencing gambling harm (5.68 vs 5.49).
Nevertheless, this study’s potential policy value lies more in relative comparisons between messages, rather than absolute estimates of attitudes and beliefs. Further, even within this commenting subset, ratings generally remained above the scale midpoint, suggesting that negative feedback may reflect more critical scrutiny rather than overall rejection of the messages. Future studies may consider making a small number of feedback prompts mandatory to reduce selection bias and potential negative skew. Because the study did not explore how message effectiveness might change with repetition (McCullock et al., Reference McCullock, Louderback and LaPlante2025), future longitudinal studies should also explore this factor. Finally, while steps to improve data quality were outlined in the preregistration (i.e., excluding participants that reported lack of attention, and those who responded in under 2 minutes), we acknowledge that our methodology was somewhat limited in its ability to effectively detect potential AI-generated and AI-assisted responses. Compared to other platforms, Prolific has been found to produce some of the highest-quality data, with robust protections against less sophisticated bot-generated data (Douglas et al., Reference Douglas, Ewell and Brauer2023; Haycraft Mee, Reference Haycraft Mee2025). However, the current evidence shows that the use of AI in online surveys is rapidly increasing, and multimodal strategies, in addition to those implemented by crowdsourcing platforms, are more effective than single methods for preventing and identifying bot-generated data (Pinzon et al., Reference Pinzon, Koundinya, Galt, Dowling, Baukloh, Taku-Forchu, Schohr, Roche, Ikendi, Cooper, Parker and Pathak2024; Asher et al., Reference Asher, Gold, Chen and Carvalho2025). Future studies should, therefore, consider several evidence-based approaches, such as keystroke tracking, which can improve the detection of AI-generated, and in particular, AI-assisted free-text responses (Asher et al., Reference Asher, Gold, Chen and Carvalho2025).
In conclusion, the present work demonstrates how counter-industry messages can be designed, evaluated and implemented as a novel approach to harm prevention messaging. As the UK government prepares to roll-out independently designed messages from 2026, continual research in this area can ensure that future campaigns are informed by evidence.
Acknowledgements
For contribution to the novel message development survey, we thank: Glen Dighton, Conor Heath, Martin Jones, Fay Laidler, Elena Petrovskaya, Martyn Quigley, Alex Russell and Simon Wright.
Disclosures
AS has no disclosures to report. MA has received travel and accommodation funding from the Society for the Study of Addiction and the Academic Forum for the Study of Gambling (AFSG). Maira has also received a postgraduate research grant from the AFSG and open access fee funding from GREO Evidence Insights. LW-C has received open access fee funding from GREO Evidence Insights. SvB has received research funding from the Academic Forum for the Study of Gambling. JT has received, in the last three years: (1) Open access publication funding from Gambling Research Exchange Ontario (GREO), (2) Conference travel and accommodation funding from the Academic Forum for the Study of Gambling (AFSG), (3) A minor exploratory research grant from the ASFG and GREO, (4) Seed Grant funding from the International Centre for Responsible Gambling (ICRG), (5) Studentship funding from the Economic and Social Research Council (ESRC).
L.Y.X. has provided paid consultancy and research services for (i) Public Group International Ltd (t/a PUBLIC) (Companies House number: 10608507), commissioned by the UK Department for Culture, Media and Sport (DCMS) to conduct independent research on understanding player experiences of loot box protections (October 2024–May 2025); (ii) the Council of Europe International Cooperation Group on Drugs and Addiction (the Pompidou Group) on a project concerning the risks of online gambling and gaming to young people co-funded by the European Union via the Technical Support Instrument and implemented by the Council of Europe, in cooperation with the European Commission (December 2024–May 2025); and (iii) the Institute of Public Health on a report concerning the advertising of harmful products to children funded by the Irish Department of Health and intended for its Online Health Taskforce (July 2025). L.Y.X. was supported by a PhD Fellowship funded by the IT University of Copenhagen [IT-Universitetet i København] (December 2021–November 2024). L.Y.X. was employed by LiveMe, then a subsidiary of Cheetah Mobile (NYSE: CMCM), as an in-house counsel intern from July to August 2019 in Beijing, China. L.Y.X. was not involved with the monetization of video games by Cheetah Mobile or its subsidiaries. L.Y.X. undertook a brief period of voluntary work experience at Wiggin LLP (Solicitors Regulation Authority number: 420659) in London, England, in August 2022. L.Y.X. has contributed to research projects enabled by data access provided by the video game industry, specifically Unity Technologies (NYSE:U) (October 2022–August 2023). L.Y.X. has been invited to provide advice to the UK Department for Digital, Culture, Media and Sport and its successor (the Department for Culture, Media and Sport; DCMS) on the technical working group for loot boxes and the Video Games Research Framework. L.Y.X. was the (co-)recipient of three Academic Forum for the Study of Gambling (AFSG) postgraduate research support grants (March 2022, January 2023 and July 2024) and a minor exploratory research grant (May 2024) derived from ‘regulatory settlements applied for socially responsible purposes’ received by the UK Gambling Commission and administered by Gambling Research Exchange Ontario (GREO) and its successor (Greo Evidence Insights; Greo). L.Y.X. accepted funding to publish open-access academic papers from GREO and the AFSG that was received by the UK Gambling Commission as above (October, November, and December 2022, November 2023, and May 2024). L.Y.X. was the recipient of an Elite Research Travel Grant 2024 [EliteForsk-rejsestipendium 2024] awarded by the Agency for Higher Education and Science of the Danish Ministry of Higher Education and Science [Uddannelses-og Forskningsstyrelsen under Uddannelses-og Forskningsministeriet] (February 2024). L.Y.X. has accepted conference travel and attendance grants from the Socio-Legal Studies Association (February 2022 and February 2023); the Current Advances in Gambling Research Conference Organising Committee with support from GREO (February 2022); the International Relations Office of The Jagiellonian University (Uniwersytet Jagielloński), the Polish National Agency for Academic Exchange (NAWA; Narodowa Agencja Wymiany Akademickiej), and the Republic of Poland (Rzeczpospolita Polska) with co-financing from the European Social Fund of the European Commission of the European Union under the Knowledge Education Development Operational Programme (May 2022); the Society for the Study of Addiction (November 2022, March 2023 and November 2024); the organizers of the 13th Nordic SNSUS (Stiftelsen Nordiska Sällskapet för Upplysning om Spelberoende; the Nordic Society Foundation for Information about Problem Gambling) Conference, which received gambling industry sponsorship (January 2023); the MiSK Foundation (Prince Mohammed bin Salman bin Abdulaziz Foundation) (November 2023); and the UK Gambling Commission (March 2024). L.Y.X. has received honoraria from the Center for Ludomani for contributing parent guides about mobile games for Tjekspillet.dk, which was funded by the Danish Ministry of Health’s gambling addiction pool (Sundhedsministeriets Ludomanipulje) (March and December 2023), the Fundació Pública Tecnocampus Mataró-Maresme (TecnoCampus Mataró-Maresme Foundation) for a guest lecture (November 2023), the Young Men’s Christian Association (YMCA) of Greater Toronto Youth Gambling Awareness Program for a presentation, which was funded by the Government of Ontario, Canada (March 2024), Lunds universitet (Lund University) for the right to translate parent guides about mobile games into Swedish for Kollaspelet.se, which was funded by Mediamyndigheten (the Swedish Agency for the Media) and Barnahus Stockholm (December 2024); Shenkar College of Engineering, Design and Art for a guest lecture (December 2024); and DiGRA Korea and the Game-n-Science Institute [게임과학연구원] under the Game Culture Foundation [게임문화재단] under the Ministry of Culture, Sports and Tourism of South Korea [문화체육관광부] for participating in an academic research survey (January 2025). L.Y.X. received royalties by virtue of the copyright subsisting in some of his publications from the Authors’ Licensing and Collecting Society (ALCS) (Companies House number: 01310636) (March 2023, 2024 and 2025). A full gifts and hospitality register-equivalent for L.Y.X. is available at: https://www.leonxiao.com/about/gifts-and-hospitality-register. The up-to-date version of L.Y.X.’s conflict-of-interest statement is available at: https://www.leonxiao.com/about/conflict-of-interest.
PN is a member of the Advisory Board for Safer Gambling – an advisory group of the Gambling Commission in Great Britain. In the last three years, PN has contributed to research projects funded by the Academic Forum for the Study of Gambling, Alberta Gambling Research Institute, BA/Leverhulme, Canadian Institute for Health Research, Clean Up Gambling, Gambling Research Australia, and the Victorian Responsible Gambling Foundation. PN has received honoraria for reviewing from the Academic Forum for the Study of Gambling and the Belgium Ministry of Justice, travel and accommodation funding from the Alberta Gambling Research Institute and the Economic and Social Research Institute, and open access fee funding from the Academic Forum for the Study of Gambling and Greo Evidence Insights.


 Open access