Introduction
A pancheloniid sea turtle, Carolinochelys wilsoni, was first described from the Oligocene of the Charleston, South Carolina (S.C.) region by Hay (Reference Hay1923a, Reference Hay1923b) based on a well-preserved skull and a humerus that he presumed represented the same species. Based on a great many specimens found in the Charleston region over the past forty years, Weems and Sanders (Reference Weems and Sanders2014) recently provided a much more complete description of C. wilsoni and named two more Oligocene pancheloniid species (Ashleychelys palmeri and Procolpochelys charlestonensis). Both Carolinochelys and Ashleychelys were represented by enough material to establish most of their skeletal anatomy, but the third species (Procolpochelys charlestonensis) was largely based on a single specimen that included good carapace material, but only a scattering of other elements. Fortunately this associated material included the humerus, which shows that the humerus Hay (Reference Hay1923b) ascribed to Carolinochelys actually pertains to P. charlestonensis Weems and Sanders, Reference Weems and Sanders2014. Recently, much more complete material of P. charlestonensis has been discovered in the Charleston, S.C. region (Fig. 1) and placed in the Mace Brown Museum of Natural History at the College of Charleston. This material is described here to largely complete documentation of the axial skeleton of this turtle, which now can be compared in much greater detail to the skeletons of the other two South Carolina Oligocene pancheloniid species. A pair of fused dentaries, referable to the pancheloniid genus Euclastes, also recently came to light, which appears to document the persistence of this turtle throughout most or all of the Eocene.
(Top) Regional map showing the Charleston, South Carolina region and the approximate areas where the specimens discussed here were found. Exact locality data is available from College of Charleston Natural History Museum. P=Procolpochelys localities, E=Euclastes locality. (Bottom) Upper Eocene and Oligocene stratigraphic units known from the Charleston region.

Materials and methods
Repositories and institutional abbreviations
The material examined for this study is housed in the College of Charleston Natural History Museum (CCNHM) and in the vertebrate paleontology collections of the Charleston Museum (ChM PV). Anatomical nomenclature used in the descriptions provided herein follows Gaffney (Reference Gaffney1979), especially his fig. 9.
Systematic paleontology
Class Reptilia Laurenti, Reference Laurenti1768
Order Testudines Linnaeus, Reference Linnaeus1758
Suborder Eucryptodira Gaffney, Reference Gaffney1975
Family Pancheloniidae Joyce, Parham, and Gauthier, Reference Joyce, Parham and Gauthier2004
Genus Procolpochelys Hay, Reference Hay1908
Procolpochelys grandaeva (Leidy, Reference Leidy1851)
Skull of Procolpochelys charlestonensis (CCNHM 893). (Left) unretouched photos, (right) photos with skull element boundaries marked for clarity.

Lower jaws of Procolpochelys charlestonensis (CCNMH 893) in (1) dorsal, (2, 3) ventral, (4, 5) right lateral, and (6) posterior views. Ang=angular, art=articular, cor=coronoid, dent=dentary, sur=surangular.

Materials
CCNHM 893, associated skull and lower jaws; CCNHM 300.1, associated carapace and plastron.
Occurrence
These specimens were collected from the Chandler Bridge Formation (upper Oligocene, mid-Chattian) in Charleston County, South Carolina. More specific locality data is available at the Mace Brown Museum of Natural History at the College of Charleston.
Expanded description
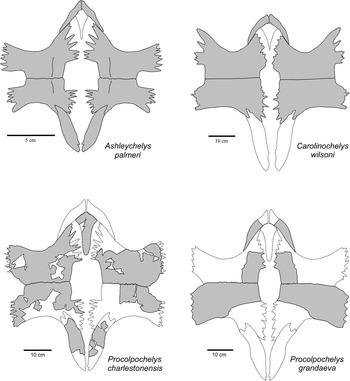
One of the two new specimens (CCNHM 893) consists of an associated skull and lower jaws (Figs. 2, 3). Skull fragments associated with the type specimen of P. charlestonensis are quite similar to comparable parts of the skull described here, which also is similar to the skull of the Miocene species P. grandaeva (Weems and Sanders, Reference Weems and Sanders2014). In dorsal view, P. charlestonensis has a broad snout but otherwise a fairly standard cheloniid arrangement of skull elements, with orbits facing laterally, parietals much longer than wide, premaxillae not fused together, and weak temporal emargination. Sulci marking the borders of the dermal scutes of the skull are not preserved in this specimen. In ventral view, P. charlestonensis has a well-developed secondary palate that completely covers the vomerine pillar but does not extend quite as far back as the anterior borders of the fossae temporalis inferior openings. The antero-lateral borders of the vomer are concave, which causes the anterior end of the vomer to have somewhat restricted contact with the premaxillae. Vomer and premaxillae are nearly equal in length on the secondary palate. The pterygoids have a mid-ventral ridge and their processus pterygoideus externus are reduced and have a strongly rounded border. The skull of P. charlestonensis is distinctly different from the skulls of Carolinochelys wilsoni and Ashleychelys palmeri in a number of features (Fig. 4). The snout of P. charlestonensis (width/length ratio=0.60) is relatively shorter than the snouts of A. palmeri (0.64) and C. wilsoni (0.72). The palate of P. charlestonensis (palate length/snout length ratio=0.86) is relatively longer than the palates of C. wilsoni (0.63) and A. palmeri (0.79). Procolpochelys charlestonensis is like A. palmeri, and unlike C. wilsoni, in that the vomerine ridge is not visible in ventral view, the supraoccipital ridge is thin, the processus pterygoideus externus are well developed, the palatine is a major contributor to the antero-lateral rim of the fossa temporalis inferior, the vomer is as long or longer than the premaxilla on the surface of the secondary palate, and the parietals are longer than they are wide. Procolpochelys charlestonensis is like C. wilsoni, and unlike A. palmeri, in that the prefrontal is located on the antero-dorsal rim of the orbit rather than on the dorsal margin, the tip of the snout is angular rather than rounded, and the pterygoids are very narrow at their most constricted mid-length point. These similarities and differences demonstrate that these are three distinctly different genera of turtles.
Comparison of the skulls of Ashleychelys, Carolinochelys, and Procolpochelys. Bo=basioccipital, bs=basisphenoid, eo=exoccipital, fr=frontal, ju=jugal, mx=maxilla, op=opisthotic, pa=parietal, pal=palatine, pf=prefrontal, pm=premaxilla, po=postorbital, pt=pterygoid, qj=quadratojugal, qu=quadrate, soc=supraoccipital, sq=squamosal, v=vomer

The well-preserved lower jaws (Fig. 3) allow useful comparisons with the lower jaws of the other two pancheloniid species in this fauna (Fig. 5). In P. charlestonensis, the high coronoid ridge on the dentary, the expansion of the symphysial region of the lower jaws into a broad triturating surface, and the absence of a strongly upturned tip to the beak all indicate that this animal had a powerful, dominantly crushing bite. The Meckelian grooves on each jaw ramus also are notably short and rounded in dorsal appearance. This extends the crushing lateral edges of the lower jaws far rearward relative to most cheloniid turtles, which resulted in a greatly shortened posterior jaw region. This appears to be an adaptation for increasing the crushing force that could be generated by the jaw musculature. In sharp contrast (Fig. 5), the lower jaws of A. palmeri are relatively much narrower, the distal tip of the beak is much sharper, and the jaw rami are much straighter and far less robust. These characteristics suggest that A. palmeri was adapted to shearing food rather than crushing it (Parham and Pyenson, Reference Parham and Pyenson2010). The lower jaw of C. wilsoni is intermediate in its conformation, though somewhat closer to Procolpochelys in terms of its robustness.
Top and middle: lower jaws of Carolinochelys wilsoni (CCNHM 302.5) in (1) ventral, (2) dorsal, (3) right lateral, and (4) posterior views. Bottom: outlines of lower jaws of Ashleychelys, Carolinochelys, and Procolpochelys in ventral view.

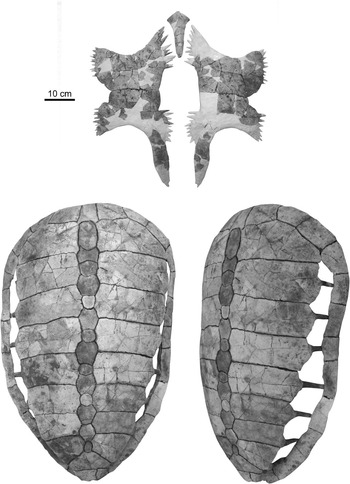
The second new specimen of Procolpochelys charlestonensis (CCNHM 300.1) includes a nearly complete carapace and plastron (Fig. 6), of which the carapace is quite comparable in its size and overall morphology to the holotype carapace of P. charlestonensis (Fig. 7) except for the much narrower costoperipheral fontanelles in the new specimen. The narrowness of these fontanelles indicates that this animal was much older and more mature than the holotype at the time of its death. Even so, the costoperipheral fontanelles remained open throughout life (Fig. 6, lower right) and did not tend to close up with age, as in C. wilsoni (Fig. 7). The new specimen unfortunately does not preserve the shallow grooves that mark the borders of the dermal scutes that overlay the bones of the carapace, but these are present in the holotype. The rib-free peripheral element in the posterior shell lies between the seventh and eighth costal ribs and not between the sixth and seventh costal ribs.
Associated plastron (top) and carapace (bottom) of Procolpochelys charlestonensis (CCNHM 300.1).
Comparison of the carapaces of Ashleychelys, Carolinochelys, and Procolpochelys. Solid gray lines represent sulcal grooves; dashed gray lines represent areas where the positions of the sulcal grooves are poorly constrained; black areas represent costoperipheral fontanelle gaps in the carapaces.

Comparative illustrations of the plastra of the three Oligocene cheloniid species from South Carolina plus the Miocene species P. grandaeva are shown in Figure 8. The most notable difference among these is that the central fontanelle of the plastron of C. wilsoni is much narrower than that of either A. palmeri or P. charlestonensis. Although the central fontanelle is about equally wide in both A. palmeri and P. charlestonensis, the length of the central fontanelle in P. charlestonensis is relatively about twice as long as the central fontanelle in A. palmeri. The mid-lateral fontanelles are much wider in A. palmeri than they are in the other two genera, so A. palmeri had a more reduced plastron than either C. wilsoni or P. charlestonensis.
Comparison of the plastra of Ashleychelys, Carolinochelys, and Procolpochelys. Ashleychelys and Carolinochelys after Weems and Sanders (Reference Weems and Sanders2014), P. grandaeva after Zangerl and Turnbull (Reference Zangerl and Turnbull1955). Gray-shaded areas are known elements; elements and portions of elements shown in white are unknown but inferred.

Expanded diagnosis
Large turtle with a deep skull and wide but angular beak; dorsal and lateral skull surface faintly ornamented by ridges, grooves, or pits in its anterior region; orbits round with prefrontals forming their antero-dorsal borders; frontals form only a small portion of the dorsal orbit border but medially project strongly forward along the midline between the prefrontals; parietals longer than wide; supraoccipital process elongate; ventral surface of skull has an elongate secondary palate with the vomerine ridge covered and thus hidden from view, premaxillae and vomer of nearly equal length on the secondary palate surface; longitudinal ridges present on the palate surface of the maxillae; palatines form the antero-medial border of the fossa temporalis inferior; pterygoids very narrow in their mid-length region, with a prominently developed processus pterygoideus externus along the antero-lateral margin of each; planar joint between the sixth and seventh cervicals; carapace moderately convex, up to 110 cm in length, markedly longer than wide with the central (neural-costal) portion of the carapace widest across the second costal region; tenth peripheral has no attachment socket to receive the rib of either the seventh or eighth costal; costoperipheral fontanelles wide and persistent throughout life; dorsal surface smooth or only very faintly sculptured; vertebral scutes hexagonal and about as wide as long; juvenile carapace with normal pancheloniid thickness, but carapace thickens rapidly with age so that adults have extremely thick costal and neural elements; neurals in the central carapace region usually split transversely into anterior and posterior pieces of unequal size, the smaller piece bearing an internal scar for attachment to the tip of an underlying neural spine; plastron reduced with typical pancheloniid conformation, central fontanelle wide and elongate anteroposteriorly, lateral fontanelles small; angle between the scapular rods is about ~120˚; humerus large and stout, shaft slightly curved, with a rather short but robust lateral tubercle that is not “V”-shaped; femur has a bony ridge fully connecting the caput with the trochanter major, but the trochanter major and trochanter minor are not fully connected by a bony ridge. Differs from P. grandaeva in that P. charlestonensis has relatively narrower parietals, relatively less-elongate squamosals, relatively narrower costals, and relatively wider vertebral scutes.
Recognition of Euclastes from the Eocene of South Carolina
Until now, the only sea turtle specimens recovered from the Eocene deposits of South Carolina were two partial carapaces of the dermochelyid turtle Psephophorus. One (ChM PV9102) is from the upper middle Eocene Cross Member of the Tupelo Bay Formation and the other (ChM PV7808) is from the overlying lower upper Eocene Harleyville Formation (Fig. 1; Weems et al., Reference Weems, Bybell, Edwards, Lewis, Self-Trail, Albright, Cicimurri, Harris, Osborn and Sanders2016). The specimen documented here (CCNHM 552) is the first pancheloniid recovered from the Eocene of South Carolina. It consists of a pair of fused dentaries (Fig. 9) that form an extensive crushing surface that complemented the expanded secondary palate present between the upper jaws of this genus. Such an extensive crushing battery has been documented in only three genera of Cenozoic pancheloniid turtles (Fig. 10): Euclastes from the Upper Cretaceous and Paleocene of the southeastern United States (Zangerl, Reference Zangerl1953; Weems, Reference Weems1988, Reference Weems2014; Parham, Reference Parham2005); Erquelinnesia from the lower Eocene of Belgium (Zangerl, Reference Zangerl1971); and Pacifichelys from the middle Miocene of the eastern Pacific coastal region of North and South America (Lynch and Parham, Reference Lynch and Parham2003; Parham and Pyenson, Reference Parham and Pyenson2010). The morphology of the specimen described here matches that of Euclastes, especially in its broadly rounded anterior border, so it can be assigned to that genus without hesitation. Because it is significantly younger than either of the two described species of Euclastes, it likely represents a new species. This single specimen, however, is insufficient to properly characterize a new species, so it is reported here only as Euclastes sp.
The fused dentaries of Euclastes sp. from the upper Eocene of South Carolina (CCNHM 552) in (1) dorsal, (2) ventral, (3) lateral, and (4) posterior views.

Comparison of the lower jaws of Erquelinnesia, Euclastes, and Pacifichelys. Erquelinnesia after Zangerl, Reference Zangerl1971; Euclastes after Hirayama and Tong, Reference Hirayama and Tong2003; Pacifichelys after Lynch and Parham, Reference Lynch and Parham2003.

This specimen of Euclastes was found by divers searching for fossils in the Cooper River north of Charleston (Fig. 1). Associated with this specimen were bones referable to the basilosaurid whale Dorudon serratus Gibbes, Reference Gibbes1845. The Pregnall Member of the Tupelo Bay Formation is the oldest stratigraphic unit that has produced any whales referable to the family Basilosauridae; the slightly older Cross Member of the Tupelo Bay Formation has produced abundant whale remains, but those are referable only to the more basal family Protocetidae (Geisler et al., Reference Geisler, Sanders and Luo2005). Therefore, the holotype of Dorudon almost certainly did not come from any unit older than the Pregnall Member (Fig. 1). The highest Eocene unit in South Carolina that produces basilosaurids, the Harleyville Formation, is exposed in quarries to the northwest of the Wando River region near Harleyville, South Carolina, near Interstate 26 (northwest of the inset area shown in Fig. 1). The Harleyville Formation has been extensively collected in these quarries, but no remains referable either to Dorudon or Euclastes have been found. Therefore, the Harleyville Formation also is an unlikely source for the Cooper River specimens discussed here. Between these two units (Fig. 1) lies the Parkers Ferry Formation, which is very poorly exposed in the Charleston region and so far has yielded no identifiable vertebrate remains. This is, however, the only upper Eocene unit that has been identified from anywhere near the upper Cooper River area (Weems and Lemon, Reference Weems and Lemon1985, Reference Weems and Lemon1989, Reference Weems and Lemon1993; Weems et al., Reference Weems, Lemon and Cron1985), and thus it is the most plausible source unit for the Eocene specimens discussed here.
The Euclastes dentaries were picked for any possible matrix preserved in their nutrient foramina, but only a few grains were recovered and no identifiable nannofossils were found within them (J.M. Self-Trail, personal communication, 2016). This also indirectly suggests that the specimen came from the soft and easily eroded Parkers Ferry Formation and not from the much more compact and semi-lithified Pregnall Member.
Until now, Euclastes has been reported only from Upper Cretaceous (Campanian/Maastrichtian) and Paleocene strata (Zangerl, Reference Zangerl1953; Weems, Reference Weems1988, Reference Weems2014; Hirayama and Tong, Reference Hirayama and Tong2003; Parham, Reference Parham2005; Parham et al., Reference Parham, Otero and Suárez2014; Schwimmer et al., Reference Schwimmer, Sanders, Erickson and Weems2015). In Upper Cretaceous strata, Euclastes has been found in North America, South America, and Africa, but in the Paleocene it is only known from North America and Africa (Parham et al., Reference Parham, Otero and Suárez2014). The presently reported occurrence extends the range of this genus upward through most of the Eocene, but only in the southeastern United States. This temporal and geographic distribution indicates that, after a strong initial expansion of its range in the Late Cretaceous, the range of Euclastes steadily dwindled until its extinction at or near the end of the Eocene. Its extinction likely was related to the dramatic earliest Oligocene cooling event that caused widespread extinctions and transformed marine vertebrate communities worldwide (e.g., Prothero et al., Reference Prothero, Ivany and Nesbitt2003).
The phylogeny of Upper Cretaceous and Cenozoic pancheloniid sea turtles
Pancheloniid sea turtle skulls and associated carapaces and plastra are well represented at a few stratigraphic levels within a few areas, such as the mid-Oligocene pancheloniid turtles from South Carolina, but many large gaps remain in the evolutionary record of this lineage. For example, little is known of the pancheloniid faunas between the relatively well-known early Eocene fauna from the London Clay in England (Moody, Reference Moody1968, Reference Moody1970, Reference Moody1974, Reference Moody1997) and the Oligocene fauna from South Carolina. Although the skull, carapace, plastron, and limb features of the pancheloniids are distinctive collectively, many of these same features are very stable within the group and thus of limited use for discerning evolutionary lineages within it. Even so, many phylogenetically useful characters have been documented among pancheloniid turtles, a detailed list of which has been compiled by Parham and Pyenson (Reference Parham and Pyenson2010), who used these characters to create a phylogeny for the sea turtles they studied.
To expand upon the phylogeny that they created, we have performed a phylogenetic analysis to investigate the relationships of the pancheloniid marine turtles from the Oligocene of South Carolina with other relatively well-known pancheloniid turtles, including those studied by Parham and Pyenson (Reference Parham and Pyenson2010). To this end, we expanded the taxa included in the comprehensive cheloniid sea turtle matrix of Parham and Pyenson (Reference Parham and Pyenson2010) through the inclusion of Tasbacka, based on Tasbacka aldabergeni Nessov, Reference Nessov1987 and Tasbacka ruhoffi (Weems, Reference Weems1988) (Weems, Reference Weems2014), and Euclastes, based on Euclastes wielandi (Hay, Reference Hay1908) (Parham, Reference Parham2005) and Euclastes roundsi (Weems, Reference Weems1988), as well as through addition of Ashleychelys palmeri, Procolpochelys charlestonensis, Procolpochelys grandaeva, and Carolinochelys wilsoni based on personal observations of the specimens described in Weems and Sanders (Reference Weems and Sanders2014) and herein. The resultant character/taxon matrix consists of the original 35 characters developed by Parham and Pyenson (Reference Parham and Pyenson2010), and the expanded taxon sample consists of 19 ingroup taxa and one outgroup taxon.
A phylogenetic analysis was performed using TNT (Goloboff et al., Reference Goloboff, Farris and Nixon2008) consisting of 1,000 Wagner tree replicates, followed by a TBR cycle of all trees retained in the buffer. In contrast to Parham and Pyenson (Reference Parham and Pyenson2010), all multistate characters that form morphoclines were ordered, in particular characters 6 and 29. The search resulted in eight equally parsimonious trees with 76 steps. A search using TNT’s pruned tree function, combined with observation of all eight trees, reveals that all taxa are retrieved in the same arrangement in all trees with the exception of Euclastes, which holds a different position in each tree (all indicated by asterisks on the time-calibrated phylogeny shown in Fig. 11). Bremer and bootstrap support values are provided to the left and right of each clade, respectively, when applicable. Implementation of a backbone constraint that enforces a sister group relationship between Chelonia mydas (Linnaeus, Reference Linnaeus1758) and Natator depressus (Garman, Reference Garman1880), which has been suggested by recent molecular data (Naro-Maciel et al., Reference Naro-Maciel, Le, Fitzsimmons and Amato2008), does not change the results of the analysis.
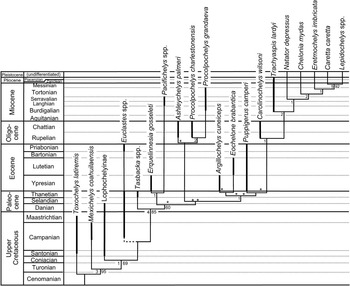
Evolutionary radiation of better-known pancheloniid sea turtles from the Late Cretaceous to the present, as retrieved by phylogenetic analysis using TNT. The portions of lineages in this phylogeny actually represented in the fossil record are indicated by thick lines. Other portions of the phylogeny are inferred from retrieved phylogenetic relationships, based on data shown in Table 1. Bremer and bootstrap support values are provided to the left and right of each clade where applicable. Euclastes plotted in eight possible positions in this tree (each location marked by an asterisk), but all other taxa consistently fell in the positions shown. Because of its mid-Campanian appearance in the fossil record, the branching point for Euclastes (shown by dashed line) must be near the base of the pancheloniid turtles below any of the other taxa shown here. Time-calibrated geologic time scale is shown to left. Sources for the indicated age range of each taxon plotted here are given in Table 2.
Taxonomically important character states of the better-known genera of Late Cretaceous and Cenozoic pancheloniid sea turtles. Data are from Parham and Pyenson (Reference Parham and Pyenson2010), with the addition of data for Tasbacka based on Tasbacka aldabergeni Nessov, Reference Nessov1987 and Tasbacka ruhoffi (Weems, Reference Weems1988) (Weems, Reference Weems2014); for Euclastes based on Euclastes wielandi (Parham, Reference Parham2005) and Euclastes roundsi (Weems, Reference Weems1988) (Weems, Reference Weems2014); and for Ashleychelys palmeri, Procolpochelys charlestonensis, Procolpochelys grandaeva, and Carolinochelys wilsoni based on personal observations of the specimens described in Weems and Sanders (Reference Weems and Sanders2014) and herein.

Sources used to establish the age ranges of the cheloniid taxa shown in Figure 11.

Euclastes is problematic for two reasons: first because there is no consistent position where it is retrieved within the phylogeny, and second because none of the places where Euclastes is retrieved is consistent with stratigraphic information. Euclastes ranges back to the middle of the Campanian stage of the Upper Cretaceous (Schwimmer et al., Reference Schwimmer, Sanders, Erickson and Weems2015), which, if incorporated within the proposed phylogeny, would pull many of the lineages of Paleogene species far back into the Upper Cretaceous through ghost lineages not known from the fossil record. The most parsimonious conclusion is that proposed by Parham and Pyenson (Reference Parham and Pyenson2010); Euclastes represents a basal pancheloniid lineage that had a skull shape convergent with, but not ancestral to, the skull shapes found in later pancheloniid forms.
Except for Euclastes, the remainder of the phylogeny is stable. The lineages for the living cheloniid turtles Caretta, Chelonia, Eretmochelys, and Lepidochelys are all extended back to the base of the Pliocene at the generic level, because they all have been documented from the lower Pliocene Bone Valley Formation of Florida (Dodd and Morgan, Reference Dodd and Morgan1992). The Plio-Pleistocene lineages leading to the modern species are not given any additional line weight in Figure 11 to indicate their fossil ranges, however, because the available Pliocene material can be confidently assigned to those genera, but not to any of the living species.
Based on several character states present in the carapace of Procolpochelys grandaeva, Zangerl and Turnbull (Reference Zangerl and Turnbull1955) concluded that it was a carettine sea turtle that belonged among the crown cheloniids. This conclusion has not been disputed by most subsequent authors who have discussed this genus (e.g., Weems, Reference Weems1974; Parham and Fastovsky, Reference Parham and Fastovsky1997; Brinkman, Reference Brinkman2009). However, in the phylogeny presented here, based in part on much more complete material of Procolpochelys than previously available, Procolpochelys lies well below and away from the living crown cheloniids plus Trachyaspis (Fig. 11). Therefore, the carettine-like features seen in the carapace of Procolpochelys appear to be yet another example of evolutionary convergence among lineages of pancheloniid sea turtles that are not very closely related.
Summary and conclusions
Notable within the retrieved phylogeny (Fig. 11) is the presence of three significant Cenozoic pancheloniid radiations during the Paleocene, early Oligocene, and late Miocene. Each of these radiations followed times of exceptional extinction within this group. The first radiation occurred in the Paleocene, and it is readily explained as the result of sea turtle survivors of the Cretaceous-Paleogene extinction event undergoing rapid evolutionary radiation to fill niches vacated by victims of that event. Similarly, the early Oligocene radiation of pancheloniid turtles likely resulted from the filling of niches vacated due to extinctions caused by the end-Eocene cooling event that accompanied the beginning of widespread Antarctic glaciation at the beginning of the Oligocene (e.g., Prothero et al., Reference Prothero, Ivany and Nesbitt2003). This extinction event affected pancheloniid turtles (e.g., Puppigerus and Euclastes) and caused extinction among many other groups of marine animals, including the paleophid sea snakes and most archaeocete whales. The cause of the late Miocene radiation of modern cheloniid sea turtles is less obvious, but it does coincide with the late Miocene global climatic deterioration that heralded the beginning of significant northern hemisphere glaciation leading up to the Pleistocene ice ages (Maslin et al., Reference Maslin, Haug, Sarnthein and Tiedermann1996).
An interesting result of this phylogeny is the close relationship indicated for Ashleychelys and Procolpochelys. This likely reflects the strong regional endemism that developed among pancheloniid turtles during the Oligocene (Weems and Sanders, Reference Weems and Sanders2014) and further supports their suggestion that the southeastern United States was an ecosystem somewhat isolated from other parts of the Oligocene coastal marine world. Although Carolinochelys is an Oligocene South Carolina taxon that shows close relationship to the living branch of cheloniid turtles, this taxon is a rather specialized form that has strongly bent humeral shafts and thus is an unlikely ancestor for any of the later or living cheloniid turtles.
This conclusion is reinforced by the fact that no close relatives of the living cheloniid lineages show up in the western Northern Atlantic region until the early Miocene with the abrupt appearance of Trachyaspis lardyi Meyer, Reference Meyer1843, a specialized pseudodont sea turtle not directly ancestral to any of the living forms. Probably the evolutionary center of living cheloniid turtles was in the Indo-Pacific region, where the oldest turtle convincingly referable to the crown cheloniids has been reported from lower Miocene strata along the eastern margin of the Pacific basin (Brinkman, Reference Brinkman2009). This conclusion also is supported by the fact that the most basal of the living cheloniid sea turtles, N. depressus, occurs only in the vicinity of Australia, and there is no evidence that it ever was present in any other part of the world ocean (Zangerl et al., Reference Zangerl, Hendrickson and Hendrickson1988).
By early in the Pliocene, four of the five living cheloniid genera (Caretta, Chelonia, Eretmochelys, and Lepidochelys) had migrated into the North Atlantic basin (Dodd and Morgan, Reference Dodd and Morgan1992). Even so, Trachyaspis lardyi continued to persist there well into the Pliocene despite the arrival of these new competitors (Zug, Reference Zug2001). It is possible that it persisted in this region entirely through the Pliocene, because T. lardyi is known to have persisted into the late Pliocene in Italy (Villa and Raineri, Reference Villa and Raineri2015). By the Pleistocene, however, T. lardyi apparently was extinct, and the sea turtle fauna of the North Atlantic basin took on its present complexion.
Acknowledgments
The authors would like to thank J. Parham and W. Joyce for their thorough review of this paper and their excellent suggestions for its improvement. A special note of thanks also is due to W. Joyce for running a phylogenetic analysis for us using TNT. Without his generous help, this paper could not have reached fruition.