

There is growing evidence to suggest that poor nutritional status is a specific cause of higher rates of ill health in low-income households. People in low-income households typically have less nutritionally adequate diets, especially those who live for long periods on low incomesReference Dowler, Turner and Dobson1.
Much of the evidence to date is based on national surveys in which the number of low-income households is few, classification of households is based either on receipt of benefit or employment status, and cooperation rates in low-income households are low. As a result their circumstances are not studied specificallyReference Dowler and Dobson2, Reference Nelson, Dick, Holmes, Thomas and Dowler3. The lack of published data and information on food and nutritional outcomes for those living on low incomes is partly attributable to the difficulties faced when identifying and accessing them for research and measuring their food and nutrient intakesReference Dowler and Dobson2.
Lower literacy, numeracy and language skills (especially among some minority ethnic groups) are more common in low-income groups. For households where English is not the first language, prospective record-keeping presents a number of problemsReference Dowler, Draper, Nelson, Thomas and Dobson4. Variations in the level of language and numeracy skills across the whole sample mediate against comparable record-keeping in all households. Those with the lowest skills may have difficulty in completing dietary records unless assistance is provided by either interviewers or other household membersReference Nelson, Dick, Holmes, Thomas and Dowler3, Reference Dowler, Draper, Nelson, Thomas and Dobson4.
Physical problems of record-keeping exist amongst some subgroups, especially the elderly and disabled. Poor eyesight, impaired hearing and other physical disabilities such as being chair- or bed-ridden make weighing and recording of diet difficult or impossibleReference Nelson, Dick, Holmes, Thomas and Dowler3.
A higher incidence of mental health problems also exists amongst individuals living on low income, particularly the elderly. Dementia creates adverse consequences for data collection, particularly when using retrospective methods of dietary assessment which are reliant on memory. Drug and alcohol abuse may create similar problems, impacting not only on the quality of the data but also on the safety and welfare of the interviewers. A higher likelihood of domestic chaos and stress factors arise among low-income households which mediate against accurate record-keeping and the ability to undertake surveysReference Nelson, Dick, Holmes, Thomas and Dowler3, Reference Dowler, Draper, Nelson, Thomas and Dobson4.
In 1997, the then Ministry of Agriculture, Fisheries and Food commissioned a critical review of dietary assessment methods for use in a study of people living on low income (‘scoping study’)Reference Dowler, Draper, Nelson, Thomas and Dobson4. Methods reviewed included the weighed inventory, household measures, semi-weighed methodReference Nelson and Nettleton5, food checklist, diet history, repeat 24-hour recall and food-frequency questionnaireReference Dowler, Draper, Nelson, Thomas and Dobson4. The recommended dietary survey methods were compared in the present study. Three 4-day test methods (multiple-pass 24-hour recall, food checklist and semi-weighed method) were compared with reference measures in a cross-section of people living on low income in London. Reference measures included a 4-day weighed inventory validated with four 24-hour urine collections using p-aminobenzoic acid as a marker of completeness, and comparisons of estimated energy intake with estimates of energy requirements based on basal metabolic rate calculations and reported physical activity levels. The aim was to achieve adequate response rates and accurate dietary data and identify a method which was both valid and acceptable across a diverse sample of low-income households. The identified method was later to be used in a national study of diet and nutrition in low-income households in the UK.
This paper compares the dietary survey methods in terms of overall acceptability and effectiveness. Subsequent publications will investigate the validation of the methods.
Methods
Identifying the sample, screening and recruitment
Full details of the methods used in the study are given in the Low Income Diet Methods Study (LIDMS) reportReference Nelson, Dick, Holmes, Thomas and Dowler3 and summarised below.
Data from the 1998 Health Survey for England (HSE) were used (by the National Centre for Social Research) to construct a deprivation index for each household that took part in that surveyReference Erens and Primatesta6. The index was used in an analysis of the HSE data and proved to be the strongest household-level predictor of poor general health. The HSE provides data which are more recent and better focused for the purpose of constructing such an index than those collected in the 1991 Census of PopulationReference Nelson, Dick, Holmes, Thomas and Dowler3. The deprivation index, based on characteristics of households that took part in the HSE, was used to rank postal sectorsFootnote * across London by the average household deprivation index of households in that postal sector (R Thomas, A deprivation index for use in the low income diet methods study, personal communication, 18 October 2000). The 10 most deprived areas, plus a further eight deprived areas to generate a geographic spread across London, were selected to facilitate concentrated geographical sampling of low-income households.
The sample was designed to include a cross-section of catering unit typesFootnote † and degrees of deprivationReference Dowler, Draper, Nelson, Thomas and Dobson4. A letter explaining the purpose of the study was hand-delivered to each address approximately 2–3 days before interviewers returned to complete a screening questionnaire on the doorstep. Contact was made with 2236 households, of whom 1204 (54%) completed the screening questionnaire. Deprivation at the household level was assessed by asking the doorstep respondent 12 questions. The items included in the doorstep screening questionnaire were based on those used in the HSE household-level deprivation index. Each appropriate response contributed one point to a deprivation score. Questions related to:
• Anyone in the household unemployed and looking for work.
• Anyone in the household in receipt of Income Support, Jobseeker’s Allowance or Incapacity Benefit.
• Anyone in the household in receipt of Working Family Tax Credit.
• Anyone in the household in receipt of Housing Benefit.
• Children (<16 years) and no one employed >16 hours per week.
• No income other than state retirement pension.
• Living in a flat or rooms with children (<16 years).
• Lone parent (one or more children <16 years).
• Renting or other (e.g. part mortgage).
• Number of people equal to or greater than the number of unshared rooms.
• No use of a car or van.
• No private fixed-line telephone.
A score of three or more qualified the household for inclusion in the study. Where possible, one adult (18 years or over) and one child (2–17 years inclusive) were selected at random to take part. If there was no child in the household but two or more adults, a second adult was randomly selected. Pregnant women and children less than 2 years of age were excluded from selection. If agreement to participate was obtained, interviewers made an appointment to return, explain the study in full and obtain consent. Each respondent who completed the study received a token of appreciation of £40. Ethical approval was granted by King’s College London Research Ethics Committee. Fieldwork was undertaken between January and December 2001 in three fieldwork waves.
Dietary methods
Each respondent was asked to complete four 4-day assessments of food consumption using different dietary methods over a period of 10–12 weeks. The order of administration of the four methods was held constant rather than randomised for all subjects for two reasons. First, the scoring system devised in the scoping studyReference Dowler, Draper, Nelson, Thomas and Dobson4 suggested that the 24-hour recall was likely to be the method of choice for the national study of diet and nutrition in low-income households. If this were the case, it was important that respondents’ first experience of dietary assessment in the present study was consistent with the experience that they were likely to encounter in the national study. Second, for pragmatic reasons relating to subject cooperation in a long and burdensome study, and on the basis that the 24-hour recall was the least burdensome of the methods and the weighed inventory the most burdensome, the 24-hour recall was completed first and the weighed inventory last. Originally, the order of the second and third methods (food checklist and semi-weighed method) was to have been randomised in subsequent waves of the study. However, after completion of wave 1 of fieldwork, it was evident the semi-weighed method was a great deal more burdensome to respondents than the food checklist. Therefore, in order to minimise respondents dropping out of the study, the order of administration of the methods throughout was: (1) 24-hour recall; (2) food checklist; (3) semi-weighed method; and (4) weighed inventory.
For each day of recording respondents were asked if their consumption of food and drink was usual, less than usual or more than usual. Respondents were also asked their opinion about each method including which method they preferred and why. Interviewers recorded any difficulties that respondents had with each method and if they felt the method reflected what the respondent had consumed. Interviewers were also asked to state their preferred method and reasons why it was preferred.
1. Repeat 24-hour recall – a multiple-pass method based on that used by the US Department of AgricultureReference Moshfegh, Borrud, Perloff and LaComb7 was used to carry out four repeat non-consecutive 24-hour recalls with each respondent, including at least one weekend day. Portion size was estimated using packet sizes, number of items, a photographic food atlasReference Nelson, Atkinson and Meyer8 or household measures. Where possible, one of the four 24-hour recalls was conducted over the telephone.
2. Food checklist – respondents were given four pre-printed lists of foods, one for each day of four consecutive days (including one weekend day). Respondents placed a tick against the food items when eaten, ideally at the time of consumption, but if not then retrospectively. A standard serving size was specified in household measures and respondents entered a tick for each serving consumed. Respondents could specify an alternative serving size. Space at the end of each day allowed respondents to record ‘other foods’ not on the list.
3. Semi-weighed method – all household members recorded everything eaten and drunk when at home over four consecutive days. The total amount of all shared food consumed at home was weighed (using calibrated digital scales; Soehnle 8038 Magnum, 0–2 kg at 2 g precision, 2–5 kg at 5 g precision). Distribution of food to household members was described in household measures. Detailed information for home-made recipes was recorded. Interviewers weighed commonly consumed foods, e.g. sugar and oil, at the start and end of the recording period. The total used in the household was divided by the number of uses not otherwise accounted for (e.g. teaspoons of sugar in tea and coffee after allowing for use of sugar in cooking). The two main respondents also recorded everything eaten and drunk while out of the home in household measures or from weights on labels in a separate, smaller diary. Because of difficulties in obtaining satisfactory completion of the semi-weighed method, it was not completed during fieldwork wave 3. The main difficulty was ensuring that everyone in the household, including visitors, cooperated. The high level of respondent and interviewer burden often resulted in poor detail being collected for the two main respondents.
4. Weighed inventory – each respondent weighed (using digital scales; see Semi-weighed method) and recorded all food and drink consumed and any leftovers. Weights of ingredients in home-made recipes were also recorded. Food or drink consumed out of the home was usually described in household measures or from weights on labels.
Interviewers reviewed the food checklist, semi-weighed method and weighed inventory, probing for missing items and further details of foods consumed and leftover. Wherever possible, interviewers made between two and three checking visits during and immediately after the period of completion of each of these three methods.
Children were interviewed on a sliding scale of age. With very young children (less than 5 years), the parent/carer provided all of the information for all four methods. With slightly older children (between 5 and 12 years) the majority of the information was provided by the parent/carer, with the child perhaps making some additions. Older children (12 years and over) were often able to provide much of the information required.
Respondents were also required to complete two questionnaires. The first (‘introductory questionnaire’) asked about household income, receipt of benefit, money spent on food and cooking and shopping practices. The second (‘eating habits questionnaire’) asked about general eating habits at the individual and household level.
Anthropometric measurements were taken at the start of the study, usually at the second appointment. They included height (measured using a Seca Leicester height portable stadiometer) and weight (using calibrated digital electronic personal weighing scales; Tanita THD305). Weight was also measured at the end of the study. In elderly or disabled respondents who had difficulty standing or had spinal curvature, demi-span was measured using a thin retractable demi-span tape calibrated in cm and mm.
Respondents aged 10 years and over were asked to collect four 24-hour urine collections for validation purposes during the weighed inventory method. Results will be presented elsewhere.
Data processing and statistical analysis
Full details of the data processing and statistical analysis used in the study are given in the LIDMS reportReference Nelson, Dick, Holmes, Thomas and Dowler3. A summary is given below.
The project administrator entered the data for the main questionnaires (screener, introductory and eating habits). The dietary data were entered by the two nutritionist researchers, one nutritionist and 10 coders working on a short-term basis who were trained by the nutritionist researchers. Coding queries were dealt with by the nutritionist researchers.
Where detail was lacking for the dietary data, information from the general eating habits questionnaire was used as a default. Where information on portion size was inadequate, previous consumption by the respondent for that method was used as a first default. Otherwise, average portion sizes were used9, taking into consideration the age and sex of the respondent. Where recipes lacked detail, closest matches were based on recipe data from McCance and Widdowson’s The Composition of Foods, fifth editionReference Holland, Welch, Unwin, Buss, Paul and Southgate10 and supplements11–Reference Holland, Unwin and Buss20, and elsewhereReference Judd, Kassam-Khamis and Thomas21. Where a particular item was not in the database, the nutritionist researchers found a close match by comparing label information from supermarkets or the World Wide Web with food composition tables.
The coding for the food checklist differed in some ways from the other methods. For instance, although the food checklist listed only one general category for certain foods e.g. normal and low-fat yoghurt, data from the eating habits questionnaire were used to code the type of food eaten most often by the respondent e.g. low-fat yoghurt. Eating habits data were also used for coding the amount and type of milk and sugar in tea and coffee. On some lines of the food checklist, more than one food was listed. In these instances one food was selected based on the most commonly consumed food listed for the purposes of coding. Information on commonly consumed foods was based on food consumption data from the National Diet and Nutrition SurveyReference Gregory, Collins, Davies, Hughes and Clarke22–Reference Finch, Doyle, Lowe, Bates, Prentice and Smithers25. Portion sizes for some foods in the food checklist were adapted at the coding stage for children under 6 years of age, where the difference in adult and child portion sizes was felt to be greatest.
Nutrient intakes for all respondents and all four dietary assessment methods were analysed using Integrated Dietary Analysis (IDA) software, version 2.03 (IDA Publications Ltd, 1997). The nutrient database linked with the IDA software is based on McCance and Widdowson’s The Composition of Foods, 5th edition and supplements. Data manipulation and statistical analysis were carried out using the SPSS statistical package, version 10.1 (SPSS Inc.) and Microsoft® Excel 1997 (Microsoft Corporation).
Dietary data were scanned for high and low nutrient values (intakes (g/mg/μg) per day and as a percentage of the relevant dietary reference value). Data with extreme high or low nutrient intakes were identified in over 300 files. All respondents with extreme values for energy or nutrients had their computer data checked against the original paper record, and any disagreements were corrected. All other data were checked for outliers and values out of range and corrected as necessary.
In a small number of cases fewer than four days of dietary recording were completed for a method: respondents were excluded with fewer than three days of weighed inventory data or fewer than two days for any other method. Of the 411 subjects whose dietary data were entered, 27 respondents (from 16 households) were excluded from the analysis after a further review of the records. Reasons for exclusions included respondents having an income higher than the LCA (low cost but acceptable) budget standardsReference Parker26, Reference Parker27, having fewer than three days of data for the weighed inventory and respondents becoming pregnant during the study.
Nutrient data for each method were analysed day-by-day and as a mean intake of the four days. This paper presents results as a mean intake of the four days. The three test methods (24-hour recall, food checklist, semi-weighed) were compared with the dietary reference method (weighed inventory). Numbers in the semi-weighed method are lower than for the other three methods because it was not completed during fieldwork wave 3. Comparisons were made within eight age–sex groups (see Table 3). A P-value of <0.05 was regarded as statistically significant. The statistical analyses presented are:
1. Comparison of mean intakes and standard deviations of energy and selected nutrients by age group and sex, including analysis of variance (ANOVA).
2. Mean within-subject differences and P-values based on two-way ANOVA and paired t-tests.
3. The number of food items reported according to each method.
Finally, method preference by respondent and interviewer is shown.
Results
Table 1 shows the total number of households at each stage of the recruitment process through to completion of the study. The percentage of households has been calculated at each stage. In households where contact was made, the main reason for not answering the screener was a personal refusal. Of those willing to answer, only a few questionnaires (n = 41) were not fully completed. Overall 829 householdsFootnote * of 1204 interviewed (69%) had a deprivation score of 3 or more and were eligible for the study. The main reason eligible households did not make an appointment to start the study was an outright refusalReference Nelson, Dick, Holmes, Thomas and Dowler3.
Percentage participation levels at different stages of recruitment and numbers of households at each stage
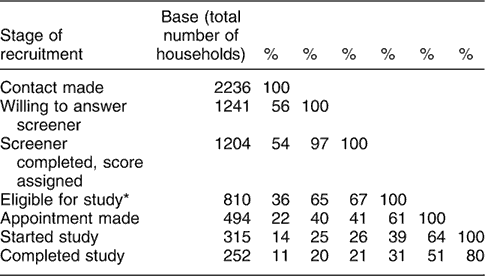
* Eligibility based on deprivation score calculated by interviewer. Numbers differ slightly from those calculated by computer on data entry (see text).
Figure 1 shows the percentage of households who scored a point for each of the deprivation factors listed. Results are given for all households for which a screening questionnaire was completed (n = 1204), eligible households (deprivation score ≥3, n = 829 households) and ineligible households (deprivation score <3, n = 375 households) based on deprivation scores calculated by computer following data entryReference Nelson, Dick, Holmes, Thomas and Dowler3.
Percentage of 1204 households answering positively to each deprivation factor by eligible and ineligible status. Eligible households had a deprivation score of 3 or more (eligibility figures are based on calculation of the deprivation score by computer, on data entry). Renting or other – renting or e.g. part mortgage; Receives HB – in receipt of Housing Benefit; Overcrowding – number of people equal to or greater than number of unshared rooms; Receives IS, JSA or IB – in receipt of Income Support, Jobseeker’s Allowance or Incapacity Benefit; Children and no one employed – children (<16 years) and no one employed (>16 hours per week); Lone parent: one adult (>16 years) and one or more children (<16 years); Receives WFTC – in receipt of Working Family Tax Credit

Table 2 shows the catering unit types of the 235 households included in the analysis. For seven households, there was insufficient data for a confident classification.
Distribution of catering unit types in 235 low-income households in London
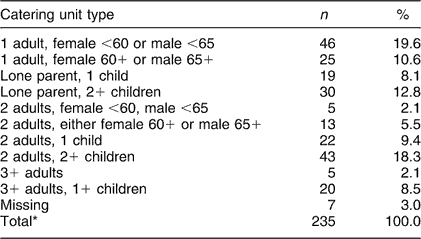
* Analysis has been carried out on the primary respondent data only (235 households); therefore data are not available for five households where only the second respondent completed the study.
Mean age, height, weight and body mass index (BMI) of respondents, by age and gender
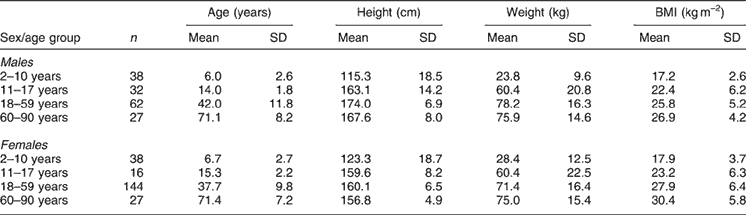
SD – standard deviation.
Respondents self-classified their ethnic group: 48% described themselves as White, 31% Black or Black British and 9% Asian or Asian British. The remainder were mixed ethnicity or from other ethnic groups.
Respondents’ mean age, height, weight and body mass index (BMI) by age group and sex are shown in Table 3. Mean BMI (kg m–2) indicates that a high proportion of males and females aged 18–59 and 60–90 years were either overweight (>25, ≤30 kg m–2) or obese (>30 kg m–2).
Table 4 shows the mean intakes of energy and selected nutrients by age and sex by method.Footnote † No data on dietary supplements have been included in the comparisons. The means are based on the data collected and are not weighted for number of weekday or weekend days.Footnote * In children aged 2–10 years, the highest mean energy intakes were reported for the food checklist followed by the 24-hour recall. In children aged 11–17 years and adults, reported mean energy intakes were highest for the 24-hour recall.
Mean energy and nutrient intakes by four dietary assessment methods for 384 respondents living in low-income households in London, by age and gender

SD – standard deviation.
The mean within-subject differences between the three test methods and the weighed inventory (reference method) are shown in Table 5. This illustrates more clearly than Table 4 the main differences between methods, as observations are matched within subjects. P-values are based on paired t-tests. Statistically significant results are shown in bold.
Mean differences in energy and nutrient intakes between estimates based on weighed inventory (WI) and 24-hour recall (24HR), food checklist (FC) and semi-weighed (SW) method for 384 respondents, by age group and gender

SD – standard deviation.
In 2–10-year-old children, the 24-hour recall and food checklist typically yielded estimates higher than the weighed inventory, especially among females. The semi-weighed method generally yielded lower results than the weighed inventory, but the differences were not statistically significant with the exception of carbohydrate in males. In 11–17-year-olds, the 24-hour recall tended to yield significantly higher values than the weighed inventory. Values for the food checklist typically were higher, and those for the semi-weighed method lower than the weighed inventory, but none of the differences reached statistical significance with the exception of vitamin C in females. In adults aged 18–59 years, the 24-hour recall typically yielded higher values than the weighed inventory, especially in males, and the semi-weighed yielded lower values, significantly so in females. In adults aged 60–90 years, the 24-hour recall typically yielded higher estimates and the semi-weighed lower values, particularly in females; however, because of small numbers and lack of power, none of the mean differences reached statistical significance except for alcohol in males for the food checklist.
The balance of these findings suggests that, in comparison with the weighed inventory, the 24-hour recall and the food checklist are more likely to yield higher estimates of energy and nutrient intake and the semi-weighed method lower estimates.
Figures 2 and 3 show the mean number of food and drink items reported by males and females by age group and method. The food checklist had fewer items reported across all of the age and sex groups, although this may in part reflect the grouping of particular food items in the food checklist and differences in approaches to coding compared with the other methods. In a univariate general linear model taking into account age and sex, the 24-hour recall was more likely to have significantly more items reported compared with the other methods (ANOVA, P < 0.001).
Mean number of food and drink items reported for males (n = 159), by age group and method

Mean number of food and drink items reported for females (n = 225), by age group and method

Table 6 shows the overall preference of the four methods by respondents and interviewers. Respondents preferred the food checklist because they felt it was easier than the other methods (49%) and because they did not have to do much writing (26%). Similar reasons were given for preferring the 24-hour recall: it was the easiest (36%) or did not require any recording by the respondents (30%). The weighed inventory was preferred by some respondents because they found it interesting (20%), enjoyed using the scales (17%) and it made them think more about what they ate and drank (17%) (this could be regarded a disadvantage if the aim is to assess ‘usual’ intake).
Overall preference of dietary assessment method by respondents (n = 309) and interviewersFootnote * (n = 8)
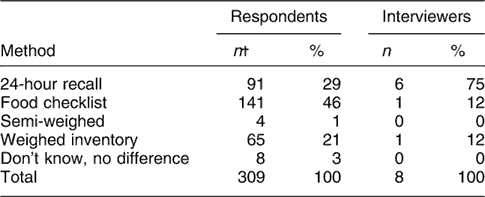
* Interviewers considered interviewer burden and most accurate method at reflecting respondents’ intake.
† Of 384 respondents, only 309 answered this question. Non-responders were younger second respondents.
Interviewers ranked the methods taking into consideration interviewer burden and most accurate method at reflecting the respondent’s intake. Six of the eight interviewers preferred the 24-hour recall. The semi-weighed method was liked least by respondents and interviewers.
Discussion
The sample in the present study is likely to be representative of households in London living in materially deprived circumstances. The selection will, of course, have been affected by the specific deprivation index used for the study. This, in turn, will have had an impact on the types of households recruited into the study and hence the types of problems encountered when completing the methods. The results are therefore biased towards households meeting the deprivation index criteria, especially living on low income, but generally suffering from cumulative material deprivationReference Holmes28.
Information obtained from the screening questionnaire allowed the comparison of deprivation characteristics of those who agreed to take part in the study and those who refused. Deprivation was not found to be associated with willingness or ability to cooperate in or to complete the study, since no difference was found in the distribution of deprivation scores between eligible households, those that made an appointment and those that finished the studyReference Nelson, Dick, Holmes, Thomas and Dowler3. However, a substantial loss of households during recruitment was due to respondents not willing to answer the screener. Since no information could be obtained on these households, it is not known in what ways they may differ from those who completed the screener and subsequently took part in the study.
Respondents who posed special problems during the collection of the data are likely to be under-represented in the sample. These include minority ethnic group households where English was not spoken by the main respondents; alcoholics and soft drugs users; those ill at home, senile or incapacitated; and those with low literacy, numeracy and language skills. Respondents not represented in the study at all include those not living in permanent accommodation, pregnant or breast-feeding women, children under 2 years of age, hard drugs users, and those who were suffering or had previously suffered from an eating disorder.
In addition, the types of households willing to accept a substantial survey burden may not be wholly typical of all deprived households, especially those whose domestic management is poor (potentially having an adverse effect on diet) and for whom an additional burden was not tolerableReference Nelson, Dick, Holmes, Thomas and Dowler3. The respondents who took part may have been interested in finding out more about their eating habits, be more health-conscious or behave in a different way from those who refused to take part in the studyReference Margetts, Nelson, Margetts and Nelson29.
The primary purpose of the sampling was to obtain a good, broad cross-section of low-income households in order to determine the types of problems likely to be encountered in the completion of a long and complex assessment of diet and related factors. On balance, it is felt that this purpose was achieved. While the sampling procedure may have resulted in some loss of representativeness regarding the entire population of low-income and deprived households in London, it is unlikely to have had a major adverse effect on the cross-section of the types of problems encountered relating to survey methodologyReference Nelson, Dick, Holmes, Thomas and Dowler3, Reference Holmes28.
The order of administration of the methods and the dropping of the semi-weighed method in wave 3 of fieldwork may have affected the dietary data in different ways. For example, there may have been an increase in the quality of the data collected for the weighed inventory since it was the last method to be completed and respondents may have benefited from a training effect (particularly as it was completed after the semi-weighed method which is similar to the weighed inventory in a number of ways). This may have been counterbalanced by respondent and interviewer survey fatigue negatively affecting the quality of the data, particularly for the weighed inventory, the last method to be completedReference Nelson, Dick, Holmes, Thomas and Dowler3, Reference Holmes28.
The dropping of the semi-weighed method may have resulted in a reduction in quality of data for the weighed inventory in wave 3 since respondents did not benefit from using the scales in the semi-weighed method as they had done in waves 1 and 2. On the other hand, respondent survey fatigue was likely to have been less in wave 3 compared with waves 1 and 2, resulting in a possible increase in the quality of the data in wave 3. The main disadvantage to the omission of the semi-weighed method in wave 3 was the reduction in sample size for comparisons between methodsReference Nelson, Dick, Holmes, Thomas and Dowler3.
The implications of the order of administration of the methods and the dropping of the semi-weighed method will be investigated in subsequent publications along with a number of other factors that may have affected the dietary data. These include:
• Distribution of days of the week across methods.
• Respondents on special diets, e.g. weight-reducing.
• Misreporting of dietary intake, e.g. underreporting levels across methods.
• Respondents who reported eating/drinking less or more than usual and differences across methods.
• Identification of respondents who were genuine low consumers rather than underreporters of intake.
Conclusion
The authors were asked by the Food Standards Agency (FSA) to recommend the method that, overall, provided the most valid data, in an acceptable way, with the fewest problems in data collection, processing and analysis for a pilot and national study of diet and nutrition in low-income households in the UK. However, all of the methods performed differently in the subgroups for analyses, and there were inconsistencies in the findings regarding which could be described as the ‘best’ overall methodReference Nelson, Dick, Holmes, Thomas and Dowler3. In addition, there were logistical problems and subjective assessments that needed to be taken into account.
The evidence presented here (which forms only part of the results from this study) suggests that in terms of acceptability and effectiveness of the methods:
• The 24-hour recall was the method most preferred by interviewers for reporting diet.
• The food checklist was the method most preferred by respondents for reporting diet.
• The semi-weighed method was least liked for reporting diet by both interviewers and respondents.
• The 24-hour recall and food checklist yielded higher estimates of energy and nutrient intake more often and the semi-weighed and weighed inventory less often.
• The 24-hour recall was more likely to have significantly more items of food reported.
• The 24-hour recall provided the most consistent results across all age and sex groups compared with the other methods.
The findings presented here (based on acceptability and effectiveness of the methods) and findings to be presented elsewhere (based on the validity of the methods and levels of misreporting) led the authors to recommend the multiple-pass repeat 24-hour recall method to the FSA for a pilot and thence national study of diet and low income in the UK.
Acknowledgements
Sources of funding: This work was funded by the FSA.
Conflict of interest declaration: The authors declare no conflicts of interests with respect to this research.
Authorship responsibilities: M.N. was involved in the conception and design, analysis and report writing. B.H. and K.D. carried out data collection, coding, analysis and report writing. B.H. and M.N. drafted the manuscript.
Acknowledgements: The authors would like to acknowledge principal investigators Elizabeth Dowler and Roger Thomas for contributing to the progress of the study throughout; the interviewers – Rosa Bonini, Angela Costetsos, Edith Matovu, Paul McGee, Martina Philips and Caireen Roberts – who, together with B.H. and K.D., gathered information from January to December 2001; Jo Francis for her administrative support; Sian Burr for her work as a reserve interviewer and food coder; the team who entered data and coded food records, in particular Oliver Redfern; Roy Sherwood for carrying out the urine analyses; members of the steering group for their advice and guidance; the FSA for funding the project; and the survey participants, without whose energy and commitment the study could not have taken place.


