





1 Introduction
Inertial confinement fusion (ICF) and other high-energy-density scientific research methods impose stringent requirements on the output energy and power of high-power laser facilities[Reference Hong, Liu, Yang, Peng, Li, Peng, Li and Li1–Reference Zhang, Fan, Wang, Wang, Lu, Huang, Xu, Zhang, Sun, Jiao, Zhou and Jiang3]. The nonlinear phase modulation effects of high-power lasers can cause rapid growth of mid-to-high-frequency modulations in the optical field, leading to wavefront distortion, near-field intensity modulation, beam quality degradation and an increased risk of optical component damage. The B-integral, which is defined as the cumulative nonlinear phase shift during beam propagation, is a critical parameter for assessing operational safety. The National Ignition Facility (NIF) has established two B-integral criteria: the inter-stage B-integral ΔB should be less than 1.8 rad, and the full-system B-integral ΣB should be less than 3.5 rad. A comprehensive consideration of the actual conditions of the current laser facility is possible, and the criteria can be appropriately relaxed[Reference Moses and Wuest4–Reference Huang, Zhang, Sun, Geng, Wang and Liu6]. Consequently, monitoring the B-integral of laser systems is imperative for determining their maximum safe output capacity. This is of utmost importance in facility design, safe operation and performance enhancement[Reference Wang, Zhao, Zhang, Wei, Wang, Yu, Petrov and Zhang7, Reference Li, Zhou, Mu, Zeng, Wu, Wang, Wang and Zuo8].
Prevailing B-integral measurement methods include temporal interferometry[Reference Bagnoud, Zimmer, Ecker and Kuehl9, Reference Bock, Herrmann, Püschel, Helbig, Gebhardt, Lötfering, Pausch, Zeil, Ziegler, Irman, Oksenhendler, Kon, Nishuishi, Kiriyama, Kondo, Toncian and Schramm10] and spectral modulation analysis[Reference Villate, Blanchot and Rouyer11–Reference Donaldson, Maywar and Kelly13]. The temporal interferometry method, as implemented in the PHELIX laser system[Reference Bagnoud, Zimmer, Ecker and Kuehl9], generates two time-delayed pulses using an interferometer and derives the B-integral from the amplitude modulation between the pulses, achieving a precision of 0.1 rad. However, this method requires a high signal-to-noise ratio and necessitates the modification of the optical path of the laser. The spectral modulation analysis method, as demonstrated in the ALISE facility[Reference Villate, Blanchot and Rouyer11], induces amplitude modulation in broadened spectra and extracts the B-integral from the Kerr-effect-induced spectral distortions. While this approach covers an energy range from 50 mJ to 50 J, it exhibits a ±20% experimental uncertainty and demands high-resolution spectrometers with substantial implementation costs.
The NIF laser facility employs a spatial intensity modulation method[Reference Erickson, Cohen, Di Nicola, Folta, Handler, Lanier, Olejniczak, Widmayer, Williams, Yang and Wegner14, Reference Caumes, Videau, Rouyer and Freysz15], in which an inverse Gaussian intensity profile is applied to measure the output wavefronts and thus achieve B-integral measurements with an approximate error of 15%. Nevertheless, this method may be susceptible to substantial shot-to-shot variations in on-axis aberrations. Inverse Gaussian intensity modulation reportedly corresponds to on-axis phase modulation. Consequently, the averaging of multiple shots cannot effectively compensate for these fluctuations. To address these limitations, we propose a novel B-integral measurement technique based on off-axis aberration tests. By introducing intensity modulation with off-axis aberration profiles and measuring the corresponding wavefront components in the output beam, this method utilizes the more stable off-axis aberrations as references, thereby enabling precise B-integral measurements while being immune to on-axis aberration variations.
2 Principle of B-integral measurement based on off-axis aberration
2.1 Definition of the B-integral
High-power-density laser beams propagating in a medium cause intensity-dependent changes in the refractive index of the medium through the optical Kerr effect:
 $$\begin{align}n\left(x,y,z,t\right)={n}_0+{n}_2I\left(x,y,z,t\right),\end{align}$$
where ${n}_0$
,
${n}_0$
, ${n}_2$
and
${n}_2$
and $I\left(x,y,z,t\right)$
represent the linear refractive index, nonlinear refractive index and beam intensity, respectively. The linear refractive index causes a linear phase shift, whereas the nonlinear refractive-index change caused by high-intensity laser irradiation produces additional nonlinear phase shifts. After passing through the optical medium, the total phase change of the laser can be expressed as follows:
$I\left(x,y,z,t\right)$
represent the linear refractive index, nonlinear refractive index and beam intensity, respectively. The linear refractive index causes a linear phase shift, whereas the nonlinear refractive-index change caused by high-intensity laser irradiation produces additional nonlinear phase shifts. After passing through the optical medium, the total phase change of the laser can be expressed as follows:
 $$\begin{align}\varDelta \phi {\left(x,y\right)}_{\mathrm{tot}}=\varDelta \phi {\left(x,y\right)}_{\mathrm{L}}+\varDelta \phi {\left(x,y\right)}_{\mathrm{NL}},\end{align}$$
where $\varDelta \phi {\left(x,y\right)}_{\mathrm{tot}}$
is the total phase shift,
$\varDelta \phi {\left(x,y\right)}_{\mathrm{tot}}$
is the total phase shift, $\varDelta \phi {\left(x,y\right)}_{\mathrm{L}}$
is the linear phase shift and
$\varDelta \phi {\left(x,y\right)}_{\mathrm{L}}$
is the linear phase shift and $\varDelta \phi {\left(x,y\right)}_{\mathrm{NL}}$
is the nonlinear phase shift. The B-integral is the total nonlinear phase shift caused by nonlinear effects, and it can be expressed as follows:
$\varDelta \phi {\left(x,y\right)}_{\mathrm{NL}}$
is the nonlinear phase shift. The B-integral is the total nonlinear phase shift caused by nonlinear effects, and it can be expressed as follows:
 $$\begin{align}B=\frac{2\pi }{\lambda }{\int}_0^L{n}_2I(z) \mathrm{d}z,\end{align}$$
where λ is the laser wavelength, ${n}_2$
is the nonlinear refractive index of the optical medium,
${n}_2$
is the nonlinear refractive index of the optical medium, $I(z)$
is the optical field intensity and
$I(z)$
is the optical field intensity and $L$
is the propagation distance (thickness of the nonlinear medium). High-power laser systems exhibit specific spatial intensity distributions. Consequently, under high-intensity laser irradiation, the spatial distribution of the nonlinear refractive index varies in large-aperture optical elements. The B-integral manifests itself in the spatial wavefront distribution variations of the laser beam.
$L$
is the propagation distance (thickness of the nonlinear medium). High-power laser systems exhibit specific spatial intensity distributions. Consequently, under high-intensity laser irradiation, the spatial distribution of the nonlinear refractive index varies in large-aperture optical elements. The B-integral manifests itself in the spatial wavefront distribution variations of the laser beam.
2.2 Factors affecting wavefront variations in high-power laser systems
Wavefront aberrations of a beam in high-power laser systems can be divided into two major categories[Reference Jiang, Yang, Guan, Zhang, Rao, Zhang, Li, Xu, Huang, Fan and Shi16]: static and dynamic. Static wavefront aberrations are primarily attributable to material inhomogeneity, machining errors, clamping stresses and optical path installation errors of optical components. In contrast, dynamic wavefront aberrations are predominantly attributed to amplifier thermal gradients, nonuniform pumping, air disturbances and mechanical vibrations[Reference Homoelle, Bowers, Budge, Haynam, Heebner, Hermann, Jancaitis, Jarboe, LaFortune, Salmon, Schindler and Shaw17–Reference Arnoux, LeTouze, Viguie, Bicrel, Grebot, Seznec, Marshall and Zapata19]. The nonlinear aberrations mainly originate from refractive-index changes in the optical components caused by high-intensity laser irradiation.
In high-power laser systems, amplifier dynamic aberrations are the primary source of image distortion, with defocusing and astigmatism being the dominant components. The Gaussian-type phase distributions correspond to defocused phases and, consequently, the origin of the defocus, that is, whether it stems from the inherent dynamic aberrations of the system or from the nonlinear modulation induced by the high-intensity laser irradiation, cannot be identified. Laser systems are defined as coaxial optical systems in which coma components constitute a relatively small proportion. The coma component remains relatively stable under both static and dynamic conditions without significant fluctuations. Furthermore, the focal spot morphology of coma aberrations is characterized by distinct features that are readily identifiable. To illustrate this point, the wavefront of the SG II-Up facility was measured by a wavefront sensor with a clear aperture of 5.2 mm × 5.2 mm and a resolution of 20 × 20. Figure 1(a) shows the wavefront distribution with a peak-to-valley (PV) value of 37.5 rad. The defocus component is illustrated in Figure 1(b) and has a PV value of 32.1 rad; the astigmatism component has a PV value of 24.1 rad and is shown in Figure 1(c); and the coma component with a PV value of 1.3 rad is displayed in Figure 1(d). The Zernike component contributions to the aberrations of the SG II-Up facility are shown in Figure 2. The seventh and eighth terms of the Zernike coefficients, representing coma, are significantly lower than the fourth term, which represents defocus, and the fifth and sixth terms, which represent astigmatism. Consequently, the coma modulation scheme was selected for the B-integral extraction.
Aberration analysis of the SG II-Up facility: (a) near-field phase distribution; (b) defocus component; (c) astigmatism component; (d) coma component.

Distribution of Zernike coefficients for SG II-Up facility aberrations.

2.3 Feasibility analysis of B-integral testing based on coma aberration
To explore the conditions required for B-integral testing based on coma aberrations, an offline test platform was built (Figure 3). A continuous laser (@1064 nm, 150 mW, $\phi 8\;\mathrm{mm}$
, Gaussian-type spatial distribution) was phase-modulated using a phase-type liquid-crystal spatial light modulator (LC-SLM), then reduced to 6 mm and attenuated before being measured by a Shack–Hartmann (SH) sensor. The wavefront sensor used in the experiment has a clear aperture of 7.5 mm × 7.5 mm, resolution of 30 × 30, single pixel size of 0.25 mm × 0.25 mm, beam position accuracy of 0.1 mm and a dynamic range PV value of up to 140 μm. The phase-type LC-SLM has a clear aperture of 22 mm × 22 mm and maximum phase modulation depth of approximately 1λ, and the modulation depth can be adjusted by changing the gray level of the loaded pattern.
$\phi 8\;\mathrm{mm}$
, Gaussian-type spatial distribution) was phase-modulated using a phase-type liquid-crystal spatial light modulator (LC-SLM), then reduced to 6 mm and attenuated before being measured by a Shack–Hartmann (SH) sensor. The wavefront sensor used in the experiment has a clear aperture of 7.5 mm × 7.5 mm, resolution of 30 × 30, single pixel size of 0.25 mm × 0.25 mm, beam position accuracy of 0.1 mm and a dynamic range PV value of up to 140 μm. The phase-type LC-SLM has a clear aperture of 22 mm × 22 mm and maximum phase modulation depth of approximately 1λ, and the modulation depth can be adjusted by changing the gray level of the loaded pattern.
Optical path for feasibility verification of spatial phase distribution analysis based on defocus and coma aberration.

The coma aberration chosen in this study is coma in the x-direction[Reference Noll20], that is
 $$\begin{align}{Z}_8\left(\rho, \theta \right)=-2\;\sqrt{2}\cdot \left(2\;\rho -3\;{\rho}^3\right)\cdot \cos \theta,\end{align}$$
where θ and ρ denote the angular and radial components of the unit circle, respectively; that is, $0\le \theta <2\pi$
,
$0\le \theta <2\pi$
, $0\le \rho \le 1$
. As seen from the definition, the angular factor is
$0\le \rho \le 1$
. As seen from the definition, the angular factor is $\cos \theta$
and the radial factor is
$\cos \theta$
and the radial factor is $2\;\rho -3\;{\rho}^3$
.
$2\;\rho -3\;{\rho}^3$
.
The period of $\cos \theta$
is
$\cos \theta$
is $2\pi$
, and its frequency is
$2\pi$
, and its frequency is $\frac{1}{2\pi }$
. Let the sampling interval be
$\frac{1}{2\pi }$
. Let the sampling interval be $\Delta \theta$
; then, the sampling frequency is
$\Delta \theta$
; then, the sampling frequency is ${f}_{\mathrm{s}}=1/\Delta \theta$
. According to the Nyquist sampling theorem, the sampling frequency must exceed twice the highest signal frequency. Therefore,
${f}_{\mathrm{s}}=1/\Delta \theta$
. According to the Nyquist sampling theorem, the sampling frequency must exceed twice the highest signal frequency. Therefore, ${f}_{\mathrm{s}}=\frac{1}{\Delta \theta }>2\times \frac{1}{2\pi }=\frac{1}{\pi} \Rightarrow \Delta \theta <\pi$
.
${f}_{\mathrm{s}}=\frac{1}{\Delta \theta }>2\times \frac{1}{2\pi }=\frac{1}{\pi} \Rightarrow \Delta \theta <\pi$
.
Thus, within the interval $0\le \theta <2\pi$
, having three or more sampling points satisfies the Nyquist criterion.
$0\le \theta <2\pi$
, having three or more sampling points satisfies the Nyquist criterion.
Here, $2\;\rho -3\;{\rho}^3$
is a non-periodic function containing infinitely many high-frequency components; however, its power spectrum in the high-frequency region tends to zero and can thus be neglected. In practice, the number of samples is therefore commonly determined based on the signal’s degrees of freedom. This expression is a cubic polynomial, with a maximum degree of three and hence four degrees of freedom (i.e., coefficients). According to polynomial interpolation theory, any polynomial of degree d is uniquely determined by its values at d + 1 distinct points. Consequently, a cubic polynomial requires at least four sampling points for exact reconstruction.
$2\;\rho -3\;{\rho}^3$
is a non-periodic function containing infinitely many high-frequency components; however, its power spectrum in the high-frequency region tends to zero and can thus be neglected. In practice, the number of samples is therefore commonly determined based on the signal’s degrees of freedom. This expression is a cubic polynomial, with a maximum degree of three and hence four degrees of freedom (i.e., coefficients). According to polynomial interpolation theory, any polynomial of degree d is uniquely determined by its values at d + 1 distinct points. Consequently, a cubic polynomial requires at least four sampling points for exact reconstruction.
In summary, on a polar-coordinate grid, the total number of sampling points equals the product of the number of angular and radial sampling points: 3 × 4 = 12.
Based on the normalized Zernike polynomial definition, the following relationship holds within the unit circle in polar coordinates:
 $$\begin{align}{\int}_0^{2\pi }{\int}_0^1{Z}_i\left(\rho, \theta \right){Z}_j\left(\rho, \theta \right)\rho \mathrm{d}\rho \mathrm{d}\theta =\left\{\!\!\!\begin{array}{l}1,\quad i=j,\\ {}0,\quad i\ne j.\end{array}\right.\end{align}$$
The integral result of the above equation demonstrates that Zernike polynomials exhibit orthogonality and normalization in analytical integration: their cross-correlation coefficients equal zero (indicating orthogonality), and their autocorrelation coefficients equal one – this constitutes the mathematical foundation for precise aberration extraction.
Since experimental data are discrete, orthogonality under finite sampling must be verified. The data listed in Figure 4 correspond to a 30×30 sampling grid (far exceeding the Nyquist sampling criterion) and represent the cross-correlation coefficients among the first 26 Zernike terms; the numbers 1–26 along the horizontal and vertical axes denote the term indices.
Cross-correlation coefficients among Zernike polynomials 1–26, sampled on a 30 × 30 grid.

As shown in Figure 4, the cross-correlation coefficients between the eighth term and all other terms are zero – that is, the eighth term is orthogonal to the others – and its autocorrelation coefficient equals one. According to the theory of orthogonal function systems, this term can thus be extracted precisely. Therefore, the eighth term is selected as the subject of study.
Based on the above analysis, the defocus (Figures 5(a) and 5(c)) and coma phases (Figures 6(a) and 6(c)) were loaded using the wavefront of the continuous light itself as a reference. The corresponding extracted phase PV values are shown in Figures 5(b), 5(d), 6(b) and 6(d), respectively. We divided the 255 gray levels into 10 equal parts, with the gray levels 0–10 increasing sequentially. When the modulator gray level PV value was 10 (maximum modulation depth), the PV values of defocus and coma were 5.98 and 6.02 rad, respectively; when the modulator gray level was 1 (minimum modulation depth), the PV values of defocus and coma were 0.56 and 0.59 rad, respectively. The phase distribution results extracted from the SH sensor were consistent with those of the phase designed by the phase-type LC-SLM, and the accuracy of the SH sensor reached 0.001 rad. The results show that the sensitivity and accuracy of the SH sensor are suitable for the measurement and extraction of the phase under this modulation condition, verifying the feasibility of using this wavefront sensor to test the spatial phase changes caused by coma aberrations.
Defocus aberration characterization using a phase-modulated LC-SLM: (a) LC-SLM loaded with gray level 10 defocus aberration pattern; (b) wavefront sensor measurement of maximum modulation defocus aberration (PV = 5.98 rad); (c) LC-SLM loaded with gray level 1 defocus aberration pattern; (d) wavefront sensor measurement of minimum modulation defocus aberration (PV = 0.56 rad).

Coma aberration characterization using a phase-modulated LC-SLM: (a) LC-SLM loaded with gray level 10 coma aberration pattern; (b) wavefront sensor measurement of maximum modulation coma aberration (PV = 6.02 rad); (c) LC-SLM loaded with gray level 1 coma aberration pattern; (d) wavefront sensor measurement of minimum modulation coma aberration (PV = 0.59 rad).

3 B-integral measurement experimental validation of a high-power laser facility based on off-axis aberration
In this study, the damage test platform of the SG-II laser facility was used for validation of the experimental results. The damage test platform provides an output of 30 J@3 ns at a wavelength of 1053 nm. The optical layout of the system is shown in Figure 7.
Optical layout of the test laser system for verifying the B-integral test method.

The laser seed source originates from an SG-II front-end seed source[Reference Zhu, Chen, Zheng, Huang, Liu, Tang, Zhang, Xu, Shen, Chen, Peng, Zhu, Zhu, Tang, Zhang, Tang, Liu, Mao, Zhu, Ma, Li, Yang, Wang, Yang, Cai, Lin, Fan, Wang, Gu and Deng21]. After beam splitting, it enters a regenerative amplifier, which boosts the energy of the nanojoule-level laser to hundreds of microjoules. The beam is then coupled via a pair of mirrors to the first spatial filter of the pre-amplification system. After filtering and beam expansion to a diameter of 12 mm, the beam is image-relayed to a rod amplifier RA1. When amplified to tens of millijoules, the beam passes through the first-stage isolator FR1 before entering the second spatial filter. Following similar secondary filtering and expansion to a diameter of 34 mm, the beam is isolated by a Faraday isolator FR2 and directed through polarization coupling mirrors into the RA2 rod amplifier. After amplification to the joule level, the beam undergoes polarization rotation for coaxial double-pass amplification before propagating further.
The double-pass output beam passes through the Faraday isolator FR3 before transmission to the third spatial filter. After tertiary filtering and expansion to a diameter of 55 mm, the beam is delivered to a final-stage annular double-pass RA3 rod amplifier in the lower stage. Following amplification to tens of joules, the beam finally enters the final transmission spatial filter and an output laser beam aperture of 25 mm before delivery to the test platform area. The energy flow distributions of the system are listed in Table 1.
Simulated energy flow distribution and B-integral calculation of the laser system (at 30 J output).

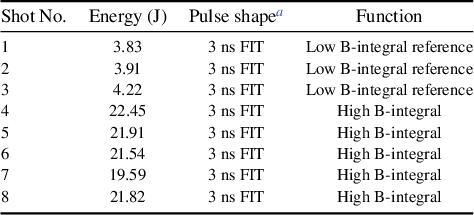
Zernike fitting analysis of three low-power beam wavefront shots (Table 2) revealed the following characteristics (Figure 8): linear refractive-index-induced optical aberrations (linear phase shifts) were dominated by defocus, astigmatism and spherical aberration, with Zernike coefficients of approximately –0.6, –0.2 and 0.14 μm, respectively. The maximum coefficients of variation across the three shots exceeded 0.1. The coma aberration components were relatively minor, showing a Zernike coefficient of approximately –0.04 μm, with only 0.01 μm variation across the three shots.
Experimental shot parameters.

a FIT, flat-in-time pulse shape.
Distribution of Zernike coefficients for the test system aberrations.

Based on these findings, a coma-shaped intensity distribution was designed. During beam propagation, nonlinear effects introduce additional coma aberration to the phase. The B-integral of the system can be calculated by extracting the variation in the coma components.
Table 1 lists the theoretical calculation results based on the actual output energy at each stage of the laser system. The measured output energies at all stages at the final output energy of 30 J are as shown in Table 1. The calculated cumulative B-integral of the system was 0.6196 rad, and predictions showed that the system would introduce a B-integral of 0.304 rad at a power density of 1 GW/cm2.
The measurement device is depicted in Figure 9. A sampling mirror with a sampling rate of 4% is used to attenuate the output beam three times before reducing it to 7.5 mm, and an SH sensor is used to measure the output wavefront.
Measurement setup.

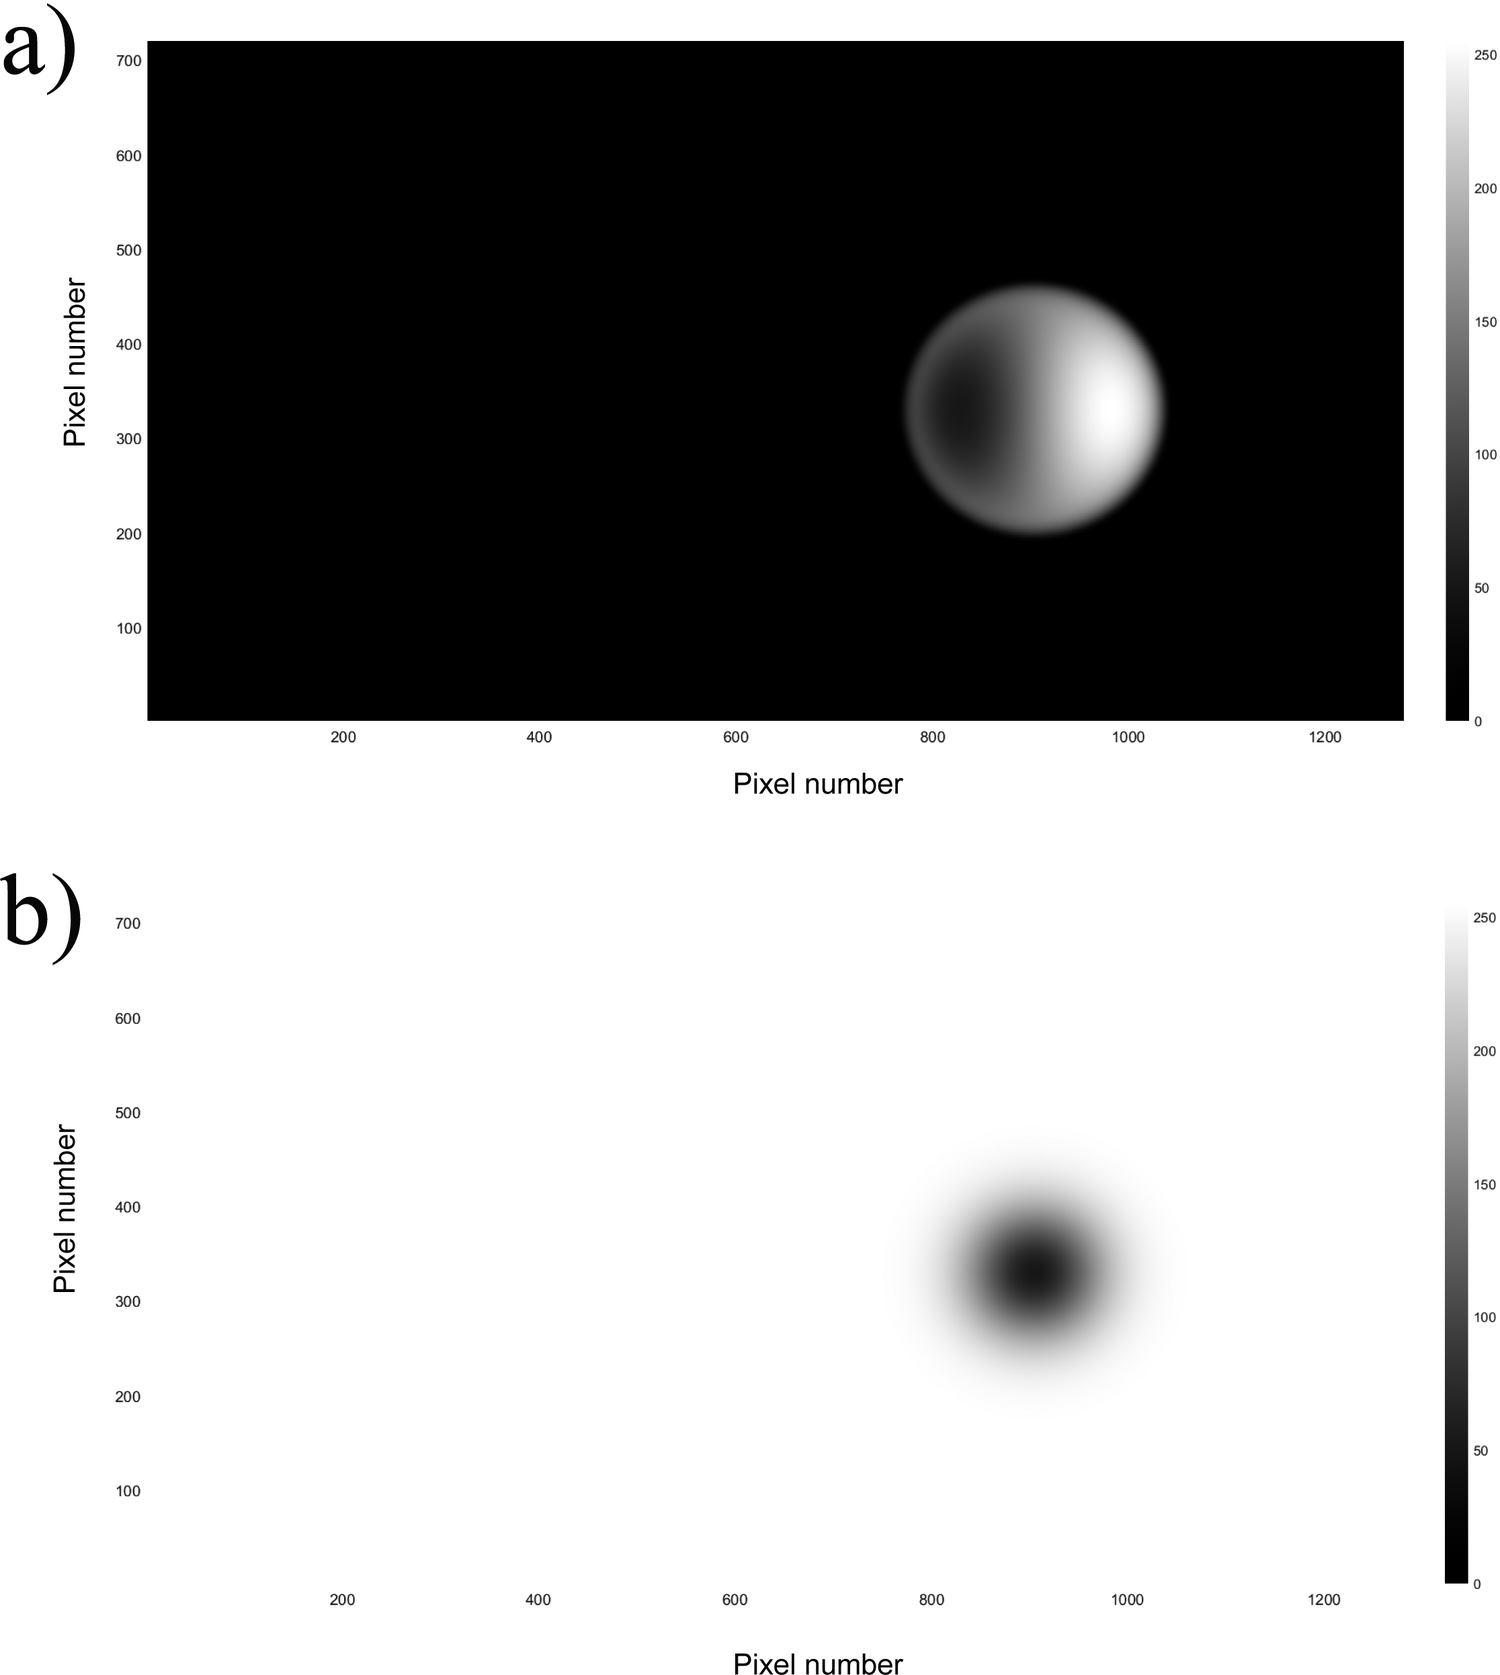
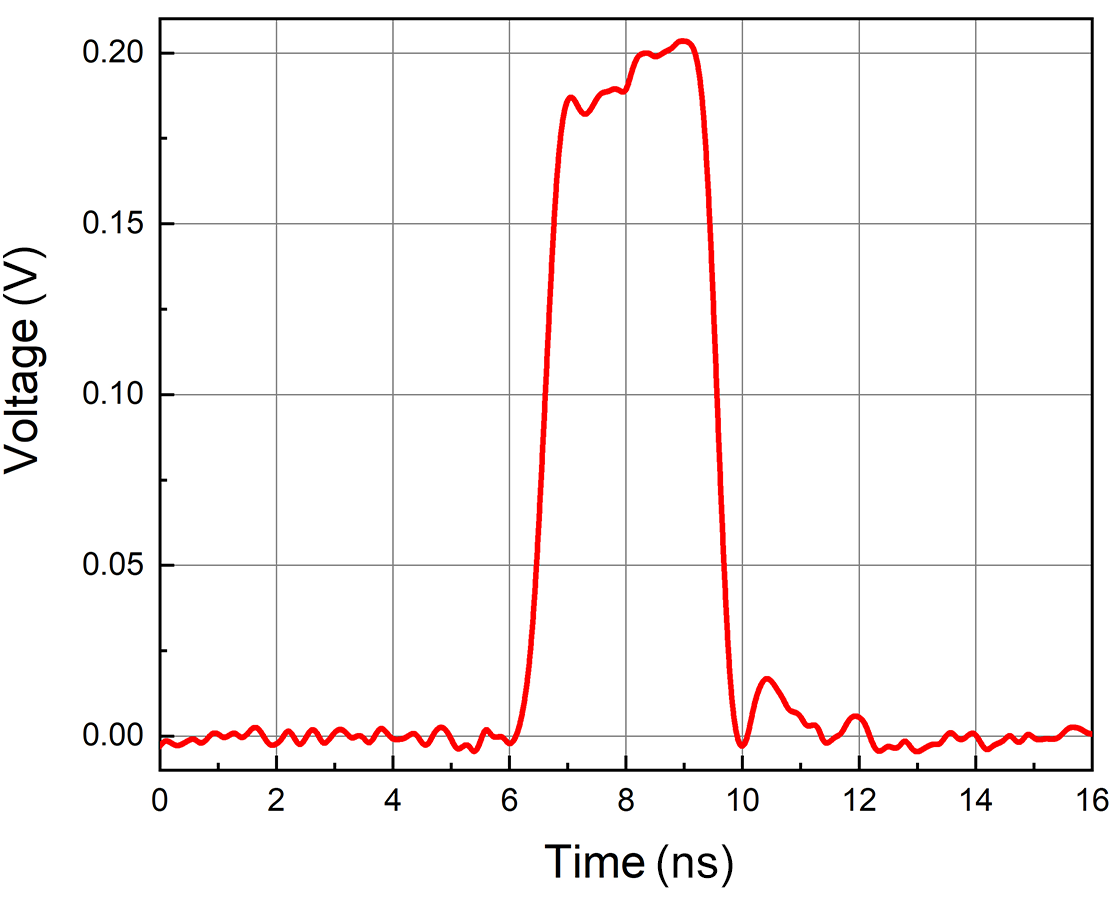
In the laser system under test (Figure 7), we installed an amplitude-type LC-SLM with a clear aperture of 22 mm × 22 mm after the regenerative amplifier to adjust the beam intensity distribution. The LC-SLM has a modulation depth (contrast ratio) of 100:1 and a response time of 51.3 ms. The intensity distributions used in the study were unobstructed, coma-obstructed and inverse-Gaussian-obstructed (Figure 10), resulting in the beam forming a slowly varying spatial intensity distribution (Figures 11(b) and 12(b)), with a minimum intensity transmittance of 10%. The data for each shot (Table 2) were obtained under flat-top temporal pulses with a width of 3 ns (Figure 13). These pulse data were selected to maximize the B-integral generated in the high-intensity region of the beam while ensuring that it remained below the established intensity limit.
Intensity modulation patterns: (a) coma-obscuration pattern; (b) inverse-Gaussian-obscuration pattern.

Near-field beam characterization with coma modulation: (a) unmodulated beam profile; (b) near-field intensity distribution after coma modulation; (c) normalized ratio of (a) and (b); (d) comparison between measured and simulated intensity profiles of the modulated beam.

Near-field beam analysis with inverse Gaussian modulation: (a) unmodulated beam profile; (b) near-field intensity after inverse-Gaussian modulation; (c) normalized ratio of (a) and (b); (d) comparison between measured and simulated intensity profiles of the modulated beam.

Temporal waveform of the laser system.

4 Results and discussion
The experimental results are shown in Figures 14 and 15. The total phase distributions of the output beam wavefront under coma aberration modulation and inverse Gaussian modulation, shown in Figures 14(a) and 15(a), respectively, include both linear and nonlinear contributions. Because of the presence of a linear component, the effect of the nonlinear contribution is insignificant. Figures 14(b) and 15(b) show the nonlinear components of the total phase extracted by subtracting the average of the three low-energy phase images. This process removes the linear component of the total phase and extracts the nonlinear contribution to the total phase, whose spatial shape is the same as that of the input intensity distribution. Three low-energy phase images are averaged to mitigate the effects of random phase variations between laser shots. Figures 14(c) and 15(c) show the coma components extracted from the coma intensity distribution and the defocus components extracted from the inverse Gaussian distribution. Figures 14(d) and 15(d) show the simulated focal spots of coma modulation and inverse Gaussian modulation under a 500 mm lens, respectively. Owing to the minimal phase modulation amplitude induced by the intensity distribution disparities under the Kerr effect, the coma-like characteristics of the focal spot depicted in Figure 14(d) are not readily discernible. However, compared with the results shown in Figure 15(d), the light spot tail of the coma modulation depicted in Figure 14(d) remains distinguishable.
Beam characterization under coma modulation: (a) raw wavefront distribution before background subtraction; (b) background-subtracted wavefront; (c) extracted coma component from (b); (d) far-field focal spot after the 500 mm lens (DL, diffraction limit).

Beam characterization under inverse Gaussian modulation: (a) raw wavefront before background subtraction; (b) background-subtracted wavefront; (c) defocus component extracted from (b); (d) far-field focal spot through the 500 mm lens (DL, diffraction limit).

A comparison of the wavefront results obtained under these two intensity distributions shows that the coma distribution introduces a B-integral of 0.355 rad at a peak power density of 1.24 GW/cm2, which is a 5.8% deviation from the simulation results.
As shown in Figure 16(a), the phase change of the wavefront exhibits an approximately linear relationship with the power density variation, enabling the extraction of the B-integral of the system at different power densities from a single-shot intensity-phase curve. In contrast, the inverse Gaussian distribution produces a B-integral of 0.581 rad at a peak power density of 1.14 GW/cm2, showing a 67.4% deviation from the simulation results. As shown in Figure 16(b), the linear fitting error between the wavefront phase change and power density variation is significantly larger, and the curvatures of the two curves differ substantially.
Intensity-phase relationship under (a) coma modulation and (b) inverse Gaussian modulation.

The common errors observed in both measurement schemes are primarily attributable to wavefront instability between shots, including turbulence in the beam path, aberrations caused by instantaneous pumping and errors resulting from the nonuniform intensity distribution of the light spot. The maximum wavefront variation between the shots during our experiment is 0.565 rad, which is even greater than the experimentally measured B-integral value. For the coma modulation scheme, because the laser system is optimized for off-axis aberrations during the design, coma fluctuations between different shots can be eliminated after background removal. Furthermore, coma is a primary aberration that is relatively straightforward to measure with high precision.
Numerical calculations of the Zernike polynomial aberration decomposition of the wavefront show that the orthogonality of the coma term is superior to that of the defocus term; supported by this orthogonality feature, we successfully obtained more accurate polynomial coefficients. In the inverse-Gaussian-modulation scheme, focus depth errors emerge between disparate laser system shots, with positional discrepancies between the intensity modulation pattern and beam center substantially influencing the extraction of the defocus components. This feature, in turn, results in increased errors in the Zernike fitting process. In addition, certain errors in the simulation results stem from the uncertainty in the value of the nonlinear refractive index n 2 experienced by the light propagating through the laser system[Reference Boling, Glass and Owyoung22].
5 Conclusion
In this study, a novel approach – B-integral measurement based on system aberration analysis – was developed. This method involves the extraction of the coma component from system aberrations, which is then utilized to derive the B-integral. This approach entails the application of a coma-patterned intensity modulation to the beam, thereby introducing coma modulation into the output phase through the Kerr effect. The B-integral of the system is then obtained by extracting the coma phase. The results show that, compared with axial aberration modulation (e.g., defocus), off-axis aberration modulation (e.g., coma) can overcome the aberration instability between disparate laser system shots, thereby facilitating a more precise extraction of the B-integral. As mentioned before, the primary error sources of this technique are the nonuniform intensity distribution of the spot and the alignment between the modulation pattern and the spot center. To mitigate these effects, we plan to further optimize the modulation pattern to maximally eliminate spikes in the intensity distribution while performing intensity modulation. This step will prevent local small-scale self-focusing from affecting the measurement results while improving the positional accuracy of the pattern. Currently, the device resolution is relatively low, and further enhancing it will pave the way toward further improving the test accuracy. These enhancement approach will eliminate all the major noise sources affecting the aforementioned results and will provide more accurate measurement results of the B-integral. The present study will facilitate real-time B-integral monitoring of the SG-II system.
Acknowledgements
This work was supported by the Strategic Priority Research Program of the Chinese Academy of Sciences (Grant No. XDA25020303).












 Open access

