


1. Background
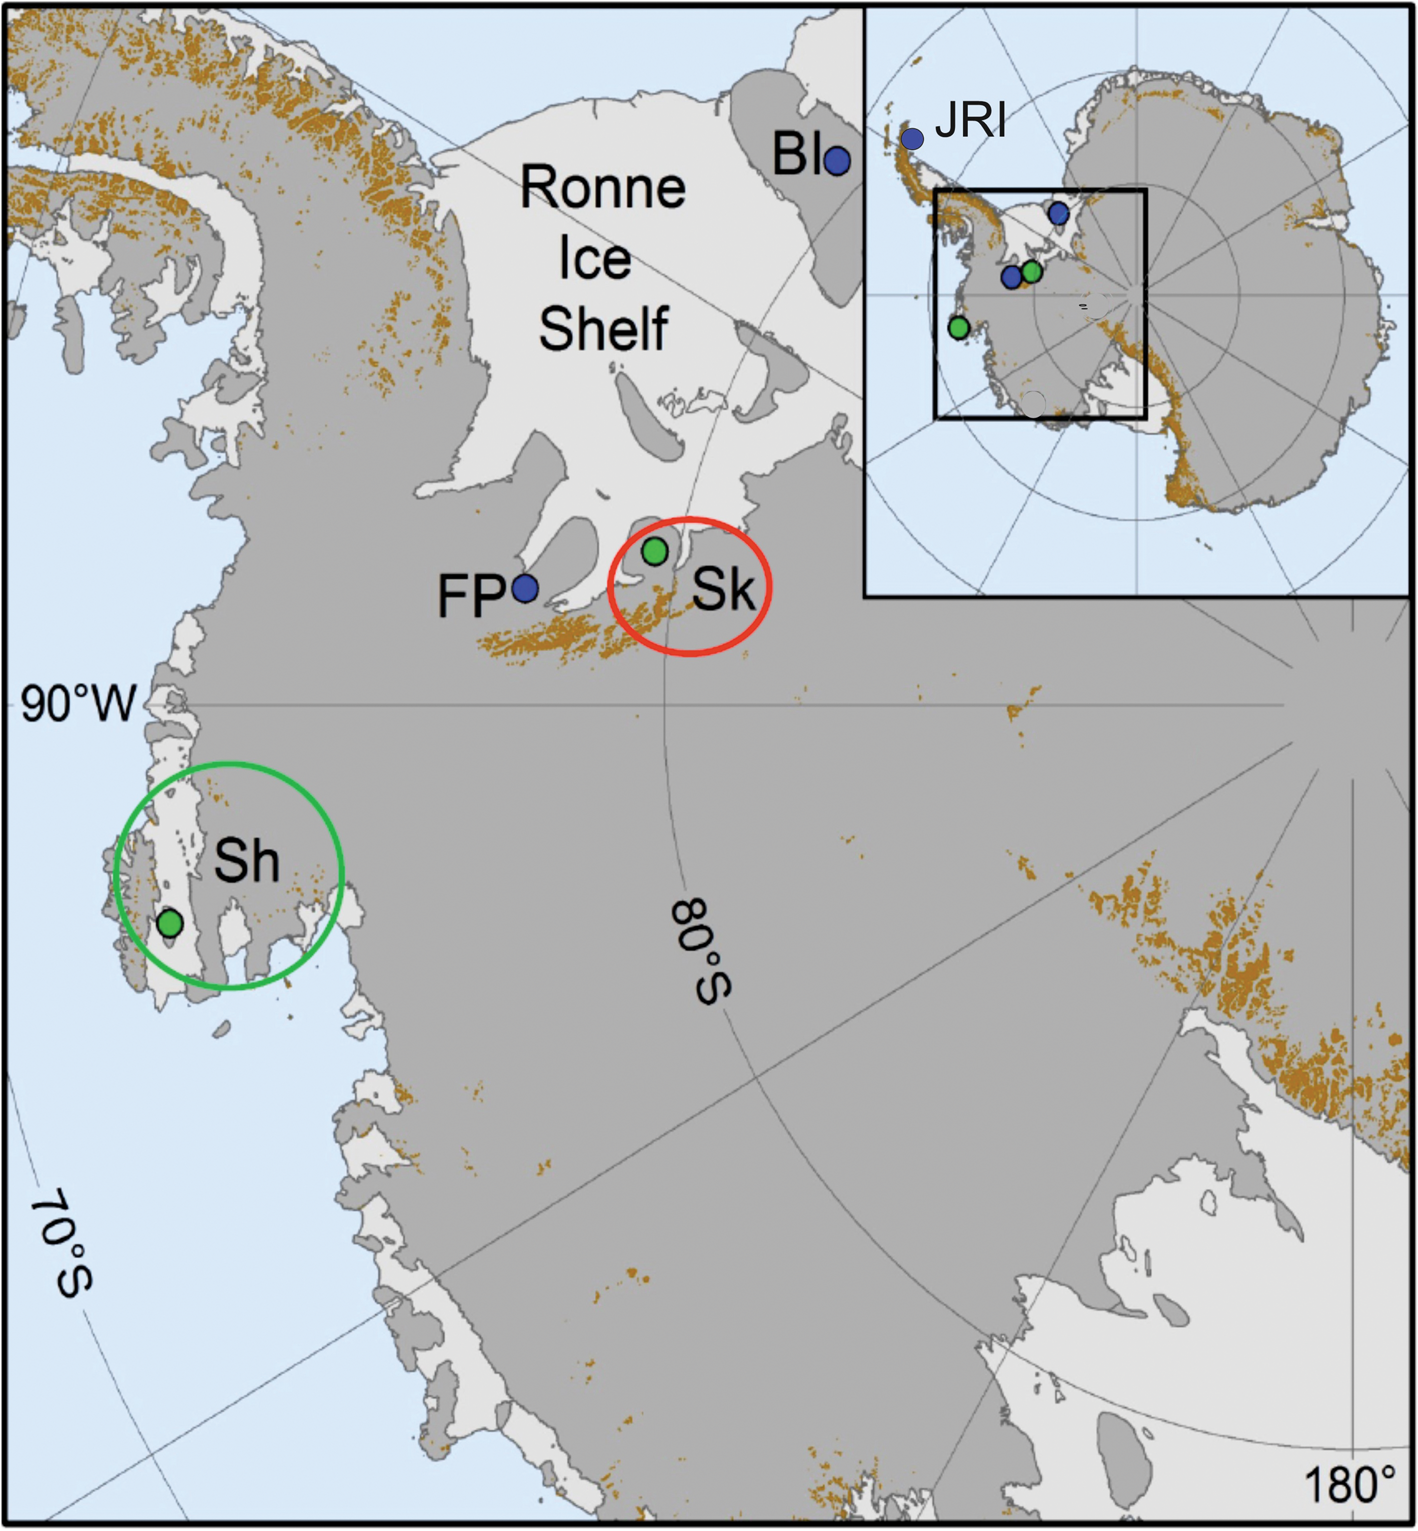
Over the past 15 years, the British Antarctic Survey (BAS), together with colleagues from the Laboratoire de Glaciologie et Gèophysique de l'Environnement (LGGE) in Grenoble (now IGE – Institut des Gèociences de l'Environnement), has completed three projects to recover continuous ice cores from the surface to the bedrock on ice rise or dome sites around the Weddell Sea region (Fig. 1, Table 1).
Location of the BAS deep ice core drilling sites Berkner Island (BI), James Ross Island (JRI) and Fletcher Promontory (FP), together with the WACSWAIN deep ice core site Skytrain Ice Rise (Sk), and the rapid access drilling site Sherman Island (Sh).
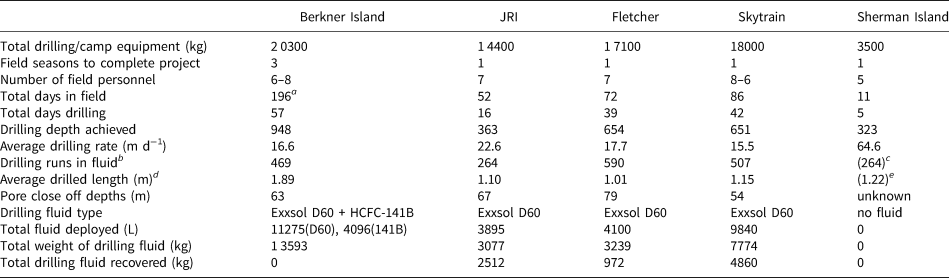
Primary characteristics of earlier BAS deep ice core sites and the two new WACSWAIN drill sites

a Initial estimate from early analysis of core.
b Measured accumulation rates for all cores, except Sherman Island which has been taken from RACMO reanalysis data.
c Generally considered to be equivalent to the current mean annual site temperature.
d Basal temperature extrapolated from measurement to 323 m only.
The first project took place on Berkner Island, which is situated in the Ronne-Filchner Ice Shelf. Three austral summer seasons were required to assemble the drilling infrastructure, and to drill an ice core to bedrock at 948 m depth (Mulvaney and others, Reference Mulvaney, Alemany and Possenti2007) in a partially cased fluid-filled borehole, with the drilling rig mounted on a rigid plywood floor in a 4 m deep pit below a 14.6 by 4.3 m tented structure. Through each intervening winter, the tent remained erected and covering the pit, before being removed at the end of the third season. One further field season was required to drill and recover 1 m of the sub-glacial sediment, and to remove all drilling and field equipment from the site. Unpublished analysis of the 948 m ice core indicates that the Last Glacial Maximum was reached at ~670 m, while 85 ka BP is at 840 m and the Last Interglacial (~120 ka BP) is centred at ~900 m (50 m above bedrock).
For the second project, a site close to the summit of Mount Haddington on James Ross Island on the northern tip of the Antarctic Peninsula was occupied for a single season to set up the drilling infrastructure, drill to bedrock at 363 m, and remove all ice cores and the drilling/field equipment (Mulvaney and others, Reference Mulvaney, Triest and Alemany2014). For this project, we drilled again from a rigid plywood platform beneath the same tent, but this time mounted the platform on the surface of the ice rather than in a deep pit. No borehole casing was used to save time needed for drilling and reaming the pilot borehole and the installation of the casing, which had effectively taken the first full season on Berkner Island. Instead the fluid was maintained at a level that was always below the pore close-off, and therefore in impermeable ice. The fluid was added to the borehole by a removable pipe that carried the fluid below the pore close off depth of ~50 m. The borehole reached bedrock, and the 363 m ice core included the full Holocene climate record, with the transition to the glacial period at 6 m above the bedrock (Mulvaney and others, Reference Mulvaney2012). The lowest 6 m appeared to include much of the recent glacial period but did not include the Last Interglacial period.
Following the ‘single season’ success of the James Ross Island project, the third project in this sequence was ambitious in its intention of drilling to bedrock at an estimated 620 m on the Fletcher Promontory in the south west of the Ronne Ice Shelf in a single season, with no pre-placement of equipment prior to the start of the season. The site was occupied for the first time in early November and all equipment was deployed to the field and the drilling infrastructure set up within 14 days. As at James Ross Island, the drilling was again carried out from a rigid plywood platform on the surface of the snow, beneath the same tented structure, in a fluid-filled borehole with no borehole casing, with the fluid delivered to the hole via a removable pipe. The final borehole reached 654 m when we hit a hard contact (presumed to be the bedrock) that could not be penetrated with a simple rock cutter head attached to the ice drill motor section (Mulvaney and others, Reference Mulvaney, Triest and Alemany2014). Unpublished analysis of the ice core shows that we reached the Last Glacial Maximum at 545 m from the surface, while the Last Interglacial appears at 648 m, or only 6 m above the bedrock.
The aim of each of these projects was to detail the long-term regional climate history and glaciological evolution of the local ice sheet, which is assumed to have been an extension of the West Antarctic Ice Sheet during the glacial period. For example, Huybrechts (Reference Huybrechts2002) modelled the ice sheet in the Weddell Sea region and showed that it was likely to have thickened substantially, reaching approximately 450 km further north than the current extent of the Ronne-Filchner Ice Shelf and probably terminating at the continental shelf break in the Weddell Sea. Loss of accumulated ice mass from the ice sheet over the Weddell Sea could have contributed about 6 m to global sea level rise during the deglaciation (Huybrechts, Reference Huybrechts2002).
The James Ross Island project was born on the implication that the ice shelves surrounding the north east part of the Antarctic Peninsula may have collapsed or retreated during the early Holocene climate optimum (Marcott and others, Reference Marcott, Shakun, Clark and Mix2013), then re-advanced during the late Holocene as the long-term climate cooled from the optimum. In recent decades, these ice shelves have suffered and catastrophic collapse purportedly due to anthropogenic climate warming. This history of ice shelf retreat then re-advance before final loss has been determined from ocean sediment cores collected by ship-borne drilling in newly accessible areas after the collapse of the north eastern Peninsula ice shelves such as Prinz Gustav Channel to Larsen B (e.g. Domack and others (Reference Domack2005); Pudsey and others (Reference Pudsey, Murray, Appleby and Evans2006)). Evidence from the James Ross Island bedrock ice core provided a climate history of the full Holocene period that supported the general assumption that climate was warmest in the early Holocene, before cooling towards the late Holocene and finally warming again in recent decades (Mulvaney and others, Reference Mulvaney2012).
The Berkner Island and Fletcher Promontory projects were specifically designed to provide a history of local climate and ice-sheet thickness during the glacial period and through the deglaciation. The hope was that they might reveal limits on the extent and timing of ice-sheet thickening during the onset of the glacial period, and the speed at which ice was lost during the deglaciation. Both ice rises were vulnerable to being over-run by the advancing WAIS during the glacial, before becoming independent ice rises, with their own ice flow regime centred on their highest points during the Holocene. Further, both sites were chosen to test whether the ice could have been completely lost from these ice rises, or drastically thinned, during the warm Last Interglacial, ~120 ka BP. Specifically, Fletcher Promontory was selected because of its proximity to the WAIS. Early ice-sheet models, such as Pollard and DeConto (Reference Pollard and DeConto2009) and Bamber and others (Reference Bamber, Gomez-Dans and Griggs2009), show the almost complete collapse of the WAIS in some interglacials. Later studies showed the vulnerability of the WAIS at the Last Interglacial (DeConto and Pollard, Reference DeConto and Pollard2016), with open ocean water extending through the current WAIS region, and across the southern part on the Antarctic Peninsula. In this scenario, the Ronne-Filchner Ice Shelf may well have been absent, which would have placed the ice rise at Fletcher Promontory close to the coast, rather than ~600 km from the ice shelf edge as at present. It was assumed prior to the project that analysis of oceanic-origin chemistry from the basal ice from Fletcher Promontory ought to be able to discriminate between a site that was proximal to the ocean and one that was distal from ocean sources.
In these earlier intermediate ice core drilling projects in the Weddell Sea region, BAS used its own ice core drill system developed in collaboration with LGGE (IGE) (Mulvaney and others, Reference Mulvaney, Alemany and Possenti2007). This is now a mature drilling system that has been used on three occasions to drill bedrock in ice up to 950 m deep without any major failures and is the ideal choice for further ice core drilling in this region, where there are other sites where bedrock can be reached by a small party in a single season. With a desire to drill ice more rapidly both to recover ice for analysis, and to provide access to boreholes for instrumentation, BAS developed its Rapid Access Isotope Drill (BAS-RAID), which is a wire hung electromechanically powered auger inside a barrel. This drill was designed to be lightweight, and to quickly drill up to 600 m (ideally in less than 10 days) in a dry borehole. It enables the full ice column to be sampled as drilling chips are brought to the surface in the correct chronological order where they may be sampled for stable water isotope and chemical analyses (chemistry is limited to those such as the major anions that are unlikely to be contaminated by the drill or drilling procedure). Without the requirement to fill the borehole with fluid, the drilling system could be significantly lighter and handled by a small team. The development of the BAS-RAID drill is described by Rix and others (Reference Rix, Mulvaney, Hong and Ashurst2019), who also detail the experience using the drill in the field. After several seasons of prototype trials, the drill was used successfully to reach 104 m in 2016/17, and 461.6 m in 2017/18, both at Little Dome C, which is 40 km from Concordia Station in East Antarctica. The final depth of 461.6 m is believed to be a record for a dry electromechanically drilled borehole in polar ice, though the drill became stuck at this depth and was not recovered. This drill system is ideal for rapidly drilling ice rises of <600 m to either access the bedrock or to recover a chronological sequence of ice samples for palaeoclimate analysis.
2. The WACSWAIN project
2.1. Motivation
The European Research Council funded the project WACSWAIN (WArm Climate Stability of the West Antarctic ice sheet in the last INterglacial – led by E. Wolff, Cambridge University) planned to make a more substantial analysis of evidence for the stability of the WAIS during the Last Interglacial period (LIG, 115–130 ka BP) using the proposed new ice cores from this region. This ambition was motivated by the prediction from recent studies that by the year 2500 CE, failure to reduce greenhouse gas emissions below ‘business as usual’ levels would likely lead to substantial losses of ice from the WAIS and cause global sea level to rise several meters (Clark and others, Reference Clark2018). One study (Golledge and others, Reference Golledge2015) suggested sea level may rise by 4–6 m by 2500 CE while another (DeConto and Pollard, Reference DeConto and Pollard2016), which introduced new physics of retreating ice shelves, predicted that ice melting from Antarctica could contribute 10 m to sea level and the WAIS was likely to collapse completely. These studies also suggested that considerable ice loss, or even total collapse of the WAIS, occurred at the LIG, when the models were simulated with a temperature regime consistent with recent temperature reconstructions for the LIG (Capron and others, Reference Capron2014). This result is consistent with the observation from a recent review of sea level data based mainly on corals (Dutton and others, Reference Dutton2015) that global sea level was in the range 6–9 m above present day level. Of this rise, about 1 m may have come from mountain glaciers and thermal expansion of the ocean, with <3.5 m contributed by the Greenland Ice Sheet (Dutton and others, Reference Dutton2015). The implication is that the balance of LIG sea level rise must have come from Antarctica, with the most likely source being the collapse of the WAIS (DeConto and Pollard, Reference DeConto and Pollard2016).
One direct way to test if the ice has been lost from the WAIS would be to drill an ice core to bedrock from a site within the WAIS and check whether ice remains from the LIG period or, if indeed, the ice near the base of the present day ice sheet is relatively young. The only contender ice core that has reached sufficient depth from within the WAIS is the US WAIS Divide core. It penetrated to within 50 m of the ice-sheet bed at 3404 m depth, at a site with an altitude of 1766 m above sea level in central West Antarctica. Even at this depth, the age of the ice was only 68 ka old (Buizert and others, Reference Buizert2015), so no evidence is available from this core about the presence of LIG ice near the base. It is likely that basal warming from the geothermal heat flow combined with the great ice-sheet thickness causes basal melting, and the oldest layers of ice have already melted away (Taylor, Reference Taylor2016). One ice core that did reach the bedrock close to the north eastern perimeter of WAIS was the Fletcher Promontory ice core, which shows ice with a water isotopic signature at about 10 m above the bed indicating it originated from the LIG (Mulvaney and others, Reference Mulvaney, Triest and Alemany2014), showing that at least some ice rises surrounding the WAIS were likely not lost. There is also ice assumed to originate from the LIG outcropping as upwelling blue ice at Mount Moulton on the western side of WAIS (Korotkikh and others, Reference Korotkikh2011).
An indirect method of testing the extent of ice loss from the WAIS region would be to look for evidence in local ice cores for proximity to open ocean water. Chemicals in the ice that originated from sea water (e.g. sea salt sodium and marine biogenic methane sulphonic acid) are likely to be found in greater concentrations when open sea water is closer to the site than when the source is at a greater distance (Minikin and others, Reference Minikin, Wagenbach, Graf and Kipfstuhl1994). Under the same scenarios of ice loss from the WAIS, it is likely that the Weddell Sea ice shelves are also likely to have been diminished in extent. This would place the ice rises at the southern margins of the Weddell Sea region on the coast of the WAIS, rather than their present situation ~600 km to the south of the current ice shelf edge. Chemical analysis of the near-basal ice should discriminate between an open sea water source that had originated from a distance of only a few km (if the Ronne Ice Shelf had been lost) with that of a source originating more than 600 km distant.
The motivation for the WACSWAIN project came from these simple assumptions that the near-basal ice from ice rises on the edges of the West Antarctic Ice Sheet could be tested for the presence of LIG ice, and for the proximity of an open ocean source. While earlier work on Fletcher Promontory has already given us an indication that these ice rises were present at the LIG, and possibly in close proximity to the open ocean at some point in the LIG, there are glaciologically better candidates for testing this hypothesis. A new core would give us new material for chemical and stable water isotope analysis, and particularly for better analysis of trapped air. As an example, one aspect we expect to test is the total enclosed air volume in the ice. The volume of trapped air is sensitive to the barometric pressure, and therefore site altitude, when pores were closed off and the air was originally trapped (Martinerie and others, Reference Martinerie, Raynaud, Etheridge, Barnola and Mazaudier1992).
The target site chosen for a new bedrock ice core was Skytrain Ice Rise in the south western corner of the Ronne Ice Shelf (Fig. 2, Table 1). The ice rise is roughly circular in shape, with a diameter of 90 km, and rises centrally to the present-day elevation of 784 m above sea level. Ice flow is independent of the main ice sheet or the ice shelf and is essentially radial from the highest point close to the centre of the ice rise. It is a peninsula, bounded to the north by the Ronne Ice Shelf, to the south west by Constellation Inlet, and to the south east by Hercules Inlet. It lies to the north of the eastern part of the Ellsworth Mountains chain, protecting the ice rise from being directly overrun by the WAIS during its advance into the Weddell Sea embayment during the last glacial period. Indeed, the LIG ice-sheet models such as DeConto and Pollard (Reference DeConto and Pollard2016) show the presence of this ice rise even during the total loss of the WAIS. Skytrain Ice Rise is well-placed to respond to any changes in ice surface altitude and atmospheric circulation due to any significant ice loss from the WAIS or to any change in the extent of the Ronne Ice Shelf. Over-snow, sledge-borne radar surveys across the Skytrain Ice Rise (J. Kingslake, pers. comm.) indicated an ice depth of ~645 m, showing that the bedrock is above sea level (subsequent drilling to bedrock found the depth to be 651 m, Table 1). Further, the radar showed the presence of a clear Raymond arch or cupola close to the present-day highest point of the ice rise (Fig. 3), indicating an ice divide with a long-term stable ice flow (Hindmarsh, Reference Hindmarsh2011). The target drill site was chosen close to the summit of the Raymond cupola because this is where we expect the oldest ice to be nearer to the surface. Bedrock beneath the chosen site is relatively flat, slightly dipping to the centre of the ice rise. The strong uplift in internal layers visible in the radar (Fig. 3) at the ice divide should act to bring the oldest ice layers nearer to the surface than sites on the flanks of the divide, implying that the ice layers from the LIG should be thicker. The thicker deep layers could thus provide a greater resolution to the palaeoclimate record than would be achieved if a core was drilled farther away from the divide location. Initial model estimates of the age/depth profile of the ice (Fig. 4) at the divide location suggested that the Last Glacial Maximum (LGM) would be at a depth of ~460 m, while ice of ~120 ka would occur ~30 m from the bed (compared to Fletcher Promontory where 120 ka is 6 m above the bed). From prior experience with the surface and basal temperatures on Fletcher Promontory, we anticipated that the basal temperature would be substantially below the pressure melting point at any realistic geothermal heat flux, negating any loss of the older ice layers through basal melting.
Local map of the Skytrain Ice Rise, showing the location of the drill site (*), and the proximity to the Ellsworth Mountains chain to the south.

Over-snow, sledge-borne, DELORES (Deep looking Radio Echo Sounder) radar profile taken across the highest point of Skytrain Ice Rise, crossing the centre of local ice rise flow regime (J. Kingslake, pers. comm.). Image shows internal layering in the ice, and the Raymond cupola at the ice divide. In red the location of the borehole is depicted. Depths are shown in meters.

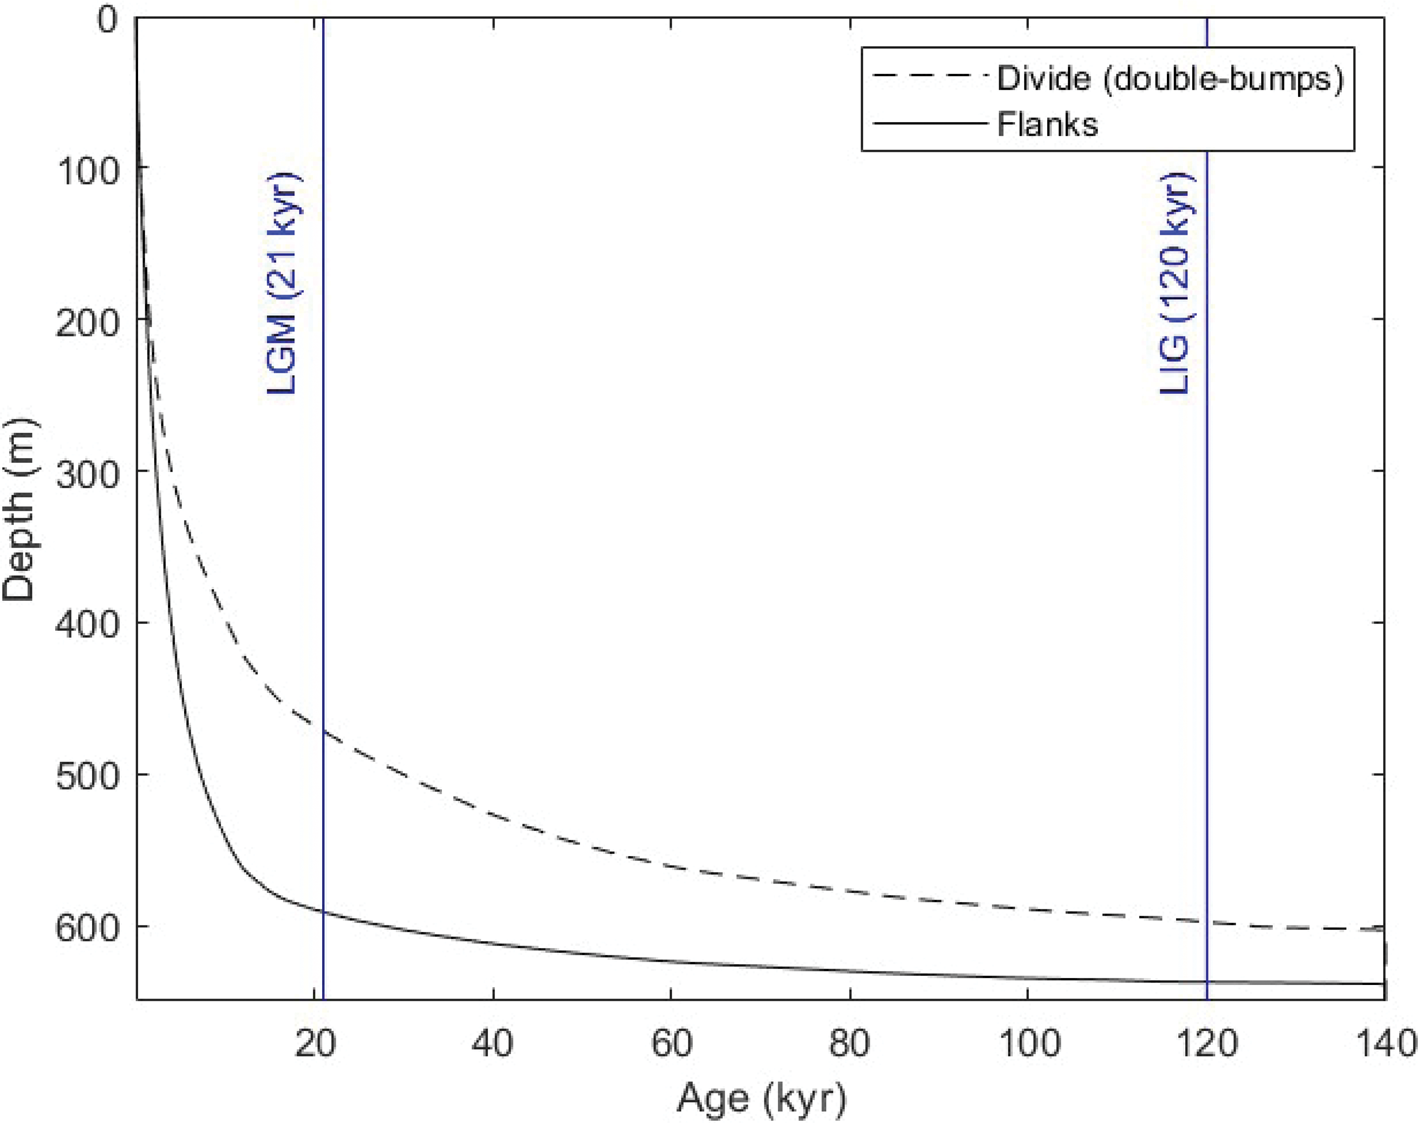
Modelled depth/age profile for Skytrain Ice Rise, based on early results from the ice core which indicate a present-day surface accumulation rate of 140 kg m−2 a−1, and the recorded depth of 651 m from the drilling. The age model differentiates between a pure divide site, and a site on the flank of the divide.
A site on the Amundsen Sea coast of West Antarctica was chosen as a second location for drilling ice to bedrock. Because accumulation close to the coast is likely to be very high we chose a small ice rise site, Sherman Island, centred in the Abbott Ice Shelf (Fig. 1, Fig. 5, Table 1). Sherman Island is protected from immediate oceanic influence by the presence of the higher mountain chain on Thurston Island to the north of the Abbott Ice Shelf, and therefore likely has a lower accumulation rate. Two airborne radar overflights of Sherman Island by the US Icebridge project (http://nsidc.org/icebridge/portal/) indicated ice ~420 m thick, and a surface elevation of 440 m, suggesting that bedrock was close to sea level. There is a clear ice divide running west to east along the main axis of Sherman Island (Fig. 5). We are not aware of any prior surface geophysical or ice core drilling projects on Sherman Island, and were therefore limited to an estimate of local accumulation of 470 kg m−2 a−1 (G. Marshall, pers. comm.) which was about half of the snowfall of other nearby unprotected coastal domes. Estimates of a likely surface temperature of ~-15°C and a likely range of geothermal heat flux indicated that the basal temperature at this location would also be below the pressure melting point. This would prevent any old ice from melting away and thus LIG ice might be obtainable close to the bed. Preliminary glaciological modelling, assuming the site chosen was at the ice divide, gave a depth/age structure (Fig. 6) that suggested we might penetrate ice from the LGM at 40 m above the bed, but that any ice remnant from the LIG would be in the bottom few meters. As discussed earlier, the presence of LIG ice at the base of the ice column would be a clear indication that even small ice rises with bedrock above sea level survived the warming of the LIG. However, we recognised a risk with this site: this low-lying ice rise could have been subject to over-riding during the LGM, which may have swept away the deepest and oldest ice layers, with the deepest layers remnant of the ice that had flowed in from an inland location, and settled when any over-riding flow regime became stagnant. For this reason, we did not drill at this location with the full ice core drilling system proposed for the Skytrain Ice Rise. We instead deployed the BAS-RAID drill in the hope of recovering a complete palaeoclimate record from the surface to the bedrock from the ice chippings produced by this system. While the record would be at lower resolution with fewer parameters able to be measured on the ice, the record would likely be the longest from this region, where few drills have penetrated more than tens of meters.
Local map of Sherman Island. An arrow points to the drill site which is located on the ice divide, and close to what appears in satellite photos as a confluence of three ridges.

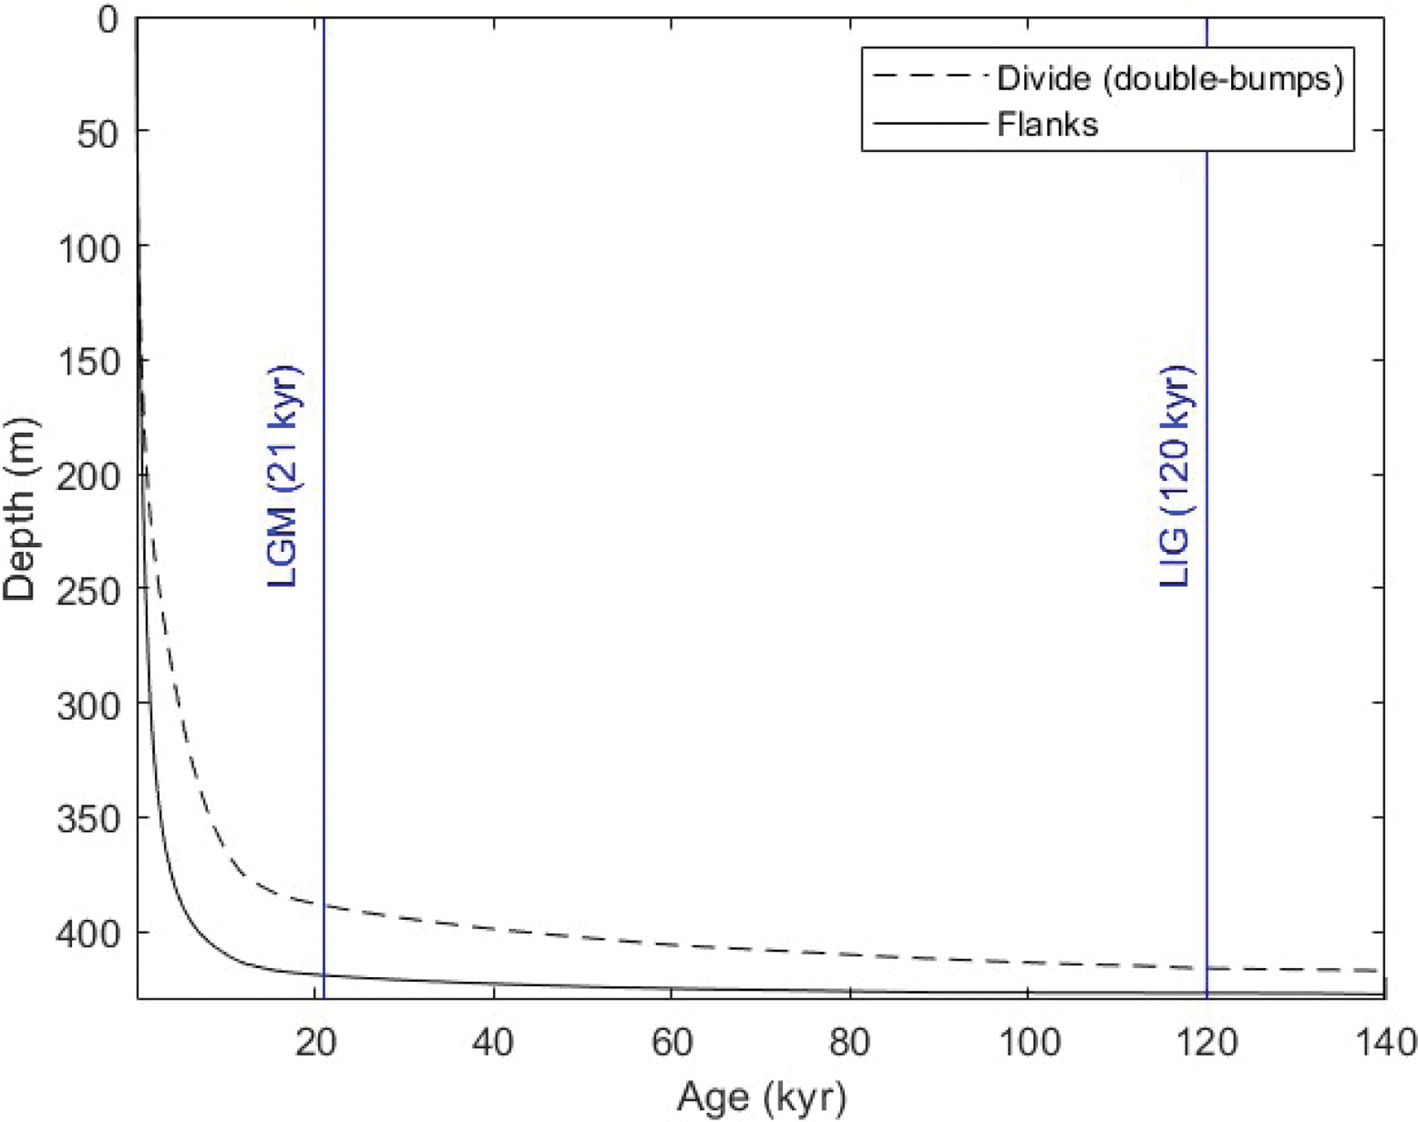
Modelled depth/age profile for Sherman Island, based on RACMO data which indicate a present day surface accumulation rate of 470 kg m−2 a−1, and a depth of 430 m measured on site by ApRES radar. The age model differentiates between a pure divide site, and a site on the flank of the divide.
3. Drilling the WACSWAIN ice rises
3.1. Skytrain ice rise
A continuous ice core was recovered from a borehole to bedrock at 651 m on Skytrain Ice Rise, drilled by a small team from the UK between November 2018 and late January 2019. The drilling operation on Skytrain Ice Rise was remarkably like that carried out by a similar-sized UK/French team on Fletcher Promontory in the 2011/2012 season. Greater detail of the earlier project can be found in Mulvaney and others (Reference Mulvaney, Triest and Alemany2014), and details of the drilling infrastructure is further explained in Mulvaney and others (Reference Mulvaney, Alemany and Possenti2007). Broadly, in a single season, the full living camp and drilling infrastructure was established by a team of eight, which reduced to six once the initial set up was complete, and a substantial part of the depth achieved. At the end of the season, 86 days after the initial input, the full drilling operation was closed, and the camp dismantled though much of the equipment was stored on the site for pick up in a later season. All ice cores were taken from the site for storage in reefer containers on the RRS Ernest Shackleton, either by flying ice core boxes to Rothera (via a temporary below-ice depot at Sky Blu) or directly to the ship when it was offloading cargo onto an ice shelf on the English Coast, and then by ocean voyage to the UK.
The UK intermediate ice core drill is designed to work in a fluid-filled borehole, with the fluid established in the hole once a dry-drill barrel and head has been used to drill substantially past the pore close-off. By measuring and weighing each core recovered, we monitor the ice density and take a bulk density of >0.82 mg m−3 to indicate pore close-off has been reached. At this site, the pore close-off was reached earlier than anticipated at 54 m (compared to 79 m at what appeared glaciologically to be a similar site on the earlier Fletcher Promontory drilling project). To provide a platform for the winch/cable drum/mast system, which weighs about 1100 kg, we built a wooden platform of cross beams and composite wood boards directly onto a levelled snow surface. A 14.6 x 4.3 m Weatherhaven Series 4 tent is mounted onto the platform and provides shelter for the drilling operation. The mast is designed to swing from horizontal (for servicing the drill and unloading ice cores from the barrel) to vertical (for drilling) in an inclined trench below the platform and through a long slot cut into the roof of the Weatherhaven (Fig. 7). The fluid/ice chip slurry is removed from the upper barrel after each run, and fluid is recovered from the slurry using a Henri Petit-Jean ECO500 centrifuge. The fluid is ‘Exxsol’ D-60 which has a bulk density of 0.79 mg m−3 – this is lower than the ideal of matching ice density, but has the advantage of both being inexpensive and relatively benign. No casing was used in the borehole to reduce the set-up time and allow single season recovery of ice to ~650 m. The fluid was again added to the hole below pore close-off by pouring it down a long tube. A longer set-up time would mean bedrock would not be reached in a single season, and to reduce borehole closure over winter for a second drilling season would require a denser drilling fluid. Power to the winch, drill, centrifuge and core cutting/logging ancillaries, together with a limited amount of power for domestics, is from a SDMO model TN16 K 16 kVA 3-phase 380VAC generating set housed in a separate small Weatherhaven; fuel consumption is ~3.2 L h−1. The ‘living’ side of the camp consists of BAS pyramid tents for sleeping, and for a toilet, and a Polarhaven tent for eating and relaxing. A further Weatherhaven Polar 4 was used for storage and for garaging a Fuji snowblower that was used most days during the site occupation to manage snow drift build up around the major tent structures. Weather through much of the season was poor, with winds of >20 knots, drifting snow and poor visibility on about 55 of the 86 days the site was occupied.
Drill infrastructure in the Weatherhaven shelter. The winch and mast dominate the foreground, with the drill operator sitting to the left. On the right is the core processing table.

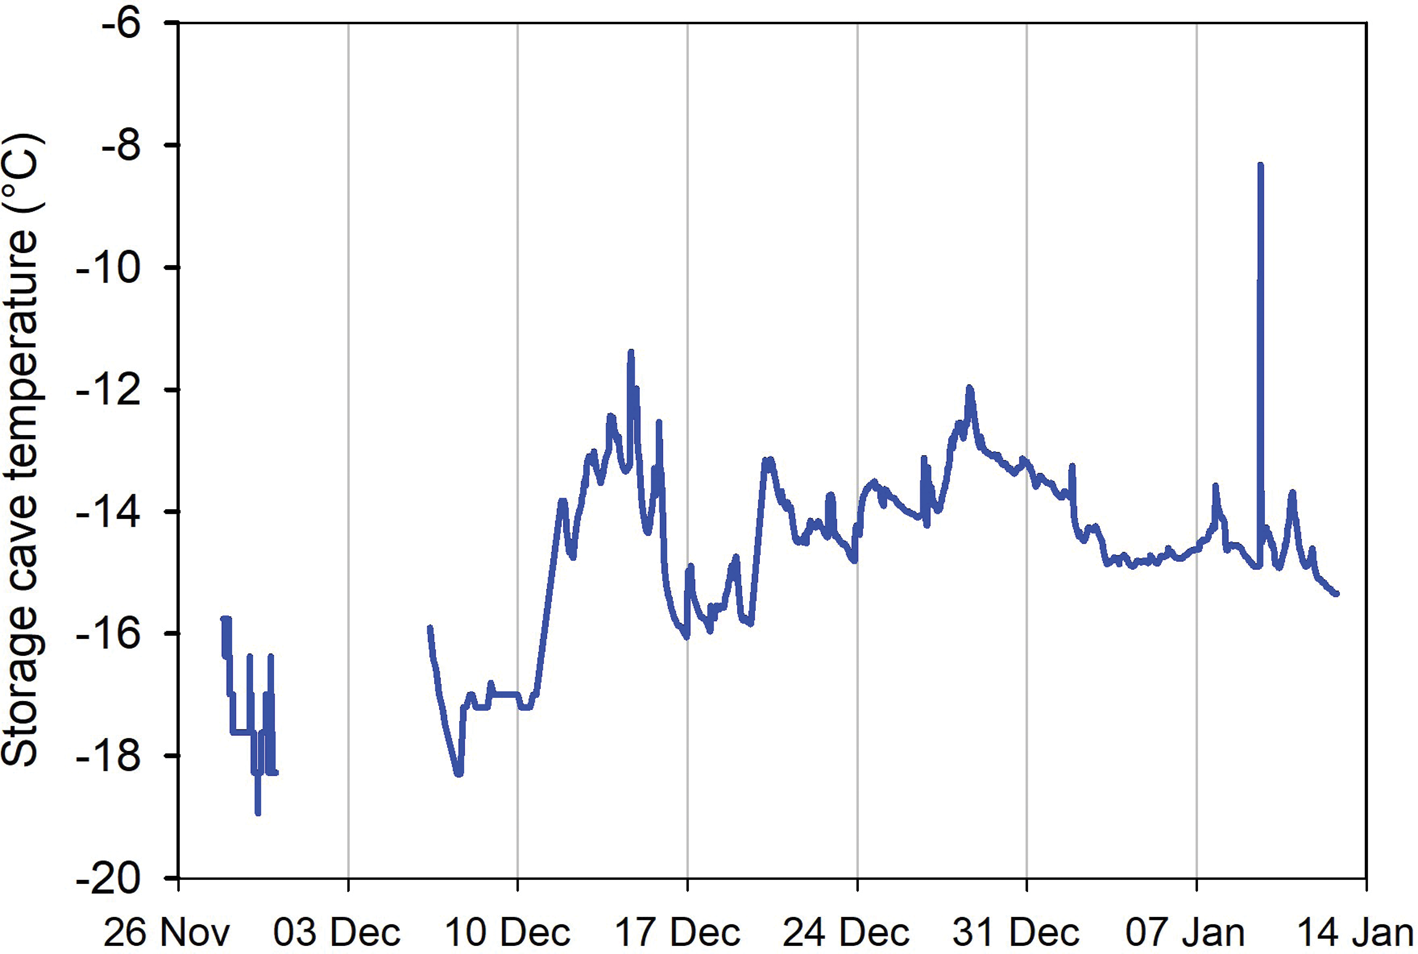
Drilling was split into two shifts of three people (driller, drillers assistant and a core logger) working for 16 h per day in shifts of 4 h on/4 h off for 6 days per week. On Saturday, we worked only 8 h, then took time to relax. Later in the season, when we were down to six in total on site, shifts were three and two people, while the sixth person managed snow drift, the site and aircraft movements. Drilling continued in this pattern for 42 days and, unlike the similar depth project on Fletcher Promontory, we did not need to move into a 24 h per day drilling operation to complete the borehole in a single season. Slightly longer core recovery (Table 2), and less time lost to drilling problems, gave us a drilling rate only slightly slower than at the similar Fletcher Promontory project, though still slower than our experience at James Ross Island with a similar drill (Fig. 8). All cores were logged immediately on recovery and cut to 0.8 m lengths before sleeving in polythene and packing in polystyrene foam trays inside foam-insulated ice core boxes, a system described by Triest and others (Reference Triest, Mulvaney and Alemany2014). Core boxes once full were moved to a below-surface ice cave that had been excavated to a depth of ~3 m and roofed with beams and composite wooden boards, then covered in snow. Early in the season, we maintained an ice cave temperature of ~ −18°C, while during the middle of the season, the temperature cycled between − 16 and − 12°C (Fig. 9). During transport to the ship, loggers placed in the transport boxes indicated the ice might have reached − 8°C for a few hours, before chilling to − 22°C in the refrigerated container, a temperature maintained all the way back to the UK.
Comparison of the drilling rate achieved at the four ice core projects, and the rapid access drilling. Berkner Island is shown only from 93 m which is drilling from the bottom of the cased fluid-filled borehole. Other ice core sites are drilled in fluid-filled but un-cased boreholes. Daily drilling time for the ice core projects was 16 h per day, which changed to 24 h per day on day 16 at Fletcher. Sherman Island was drilled un-cased and without fluid, drilling for 10–12 h per day.

Skytrain ice rise ice core storage cave temperature. Generally, the storage cave remained below − 12°C through most of the season. The temperature spike in January was a brief period of 1 h when the storage cave was opened for moving out ice core boxes to the aircraft for uplift from the field site.
Summary of deployed infrastructure, drill performance, fluid use and recovery, for each of the projects
a Over four seasons – one additional short season was used to drill the subglacial sediment and for equipment recovery.
b Drilling runs once primary dry borehole complete, fluid charged to hole and drill changed to wet drilling type.
c In a dry borehole, without drilling fluids.
d In fluid-filled hole; accounts for all drill transits of the borehole, irrespective of lost runs where no ice was recovered.
e In a dry borehole; accounts for all transits of the borehole.
The approach of bedrock was marked by inclusion of fragments of basal material visible in the ice about 1 m above the bed. The bed was reached at 651 m depth; no further penetration was possible, and the drill head and cutters were damaged by grinding on rock. Once this point was reached, our next task was to empty the drilling fluid from the borehole for removal from the site to satisfy the restrictions placed on the project by the UK in order to satisfy the Protocol on Environmental Protection to the Antarctic Treaty 1991 requirement to minimise the environmental impact on field sites. The fluid recovery involved repeatedly lowering a simple bailer tube (Triest and others, Reference Triest, Mulvaney and Alemany2014) attached to the anti-torque section of the drill. The bailer tube is 2.24 m long, 0.098 m in diameter and recovers fluid from 1.21 m of the borehole with each run. The fluid enters a slot at the top of the bailer tube and is then brought back to the surface and emptied into a drum via a tap on the sealed bottom of the tube. Bailing takes increasing time as the borehole fluid top gets deeper, due to the transit time down and up the hole. Figure 10 shows the estimated bailing time for a 651 m deep hole, with the fluid top at 90 m depth at the start of bailing: at 14 h per day, bailing could be expected to take up to 13 days to empty the borehole. We were committed to emptying the borehole to both satisfy the environmental constraints placed on the project and to access the bedrock in a dry borehole to drill with a percussion rock drill developed by our partners from Glasgow University (Timoney and others, Reference Timoney2020). The rock drill was designed to be deployed in place of the core barrel on the ice core drill to recover sub-glacial sediment. Unfortunately, a terminal failure of the main SDMO electrical generator when bailing was at a fluid depth of 120 m above the bed meant that some fluid was left in the borehole, so the percussion rock drill could not be deployed.
Predicted bailing rate to remove fluid from the borehole, based on 14 h bailing per day from a starting fluid top at 90 m, and 1.21 column meters of fluid removed per run.

Although the drilling project was carried out with few major problems, three specific issues needed to be solved. The drill supplied from Skytrain was a new build copy of the drills used in the earlier BAS projects. It proved difficult to drill the firn using the dry barrel/drill head combination as the chips were unable to transport past the barrel/chip chamber connector. By cutting large slots into the upper part of the barrel we were able to drill short cores, with the chips being captured and contained within the upper barrel itself, similar to the common method in shallow dry borehole drills. The second problem arose with adding fluid (Exxsol D-60) to the borehole below the pore close-off depth by pumping it down a pipe that was normally wound on a drum at the surface, and lowered so that its nozzle is below the close-off depth (in this case to ~60 m). Generally, we maintained a fluid top in the borehole at ~80–100 m and added fluid to the borehole each time the level dropped below 100 m. We had chosen a 25 mm internal diameter hose made of a silicone compound with fibre reinforcement, that the manufacturers had specified as compatible with D-60, with an aluminium nozzle on the end. Unfortunately, it soon became obvious that the silicone compound was softened by the D-60 fluid to the point that the pipe leaked substantially and was in danger of snapping in the borehole. We solved this problem temporarily by welding together short lengths of polythene lay-flat tubing ‘ice core bags’ that had been cut to length to package the ice cores to make a semi-continuous 55 m length of polythene tubing with an internal diameter of 110 mm, and lowering this down the borehole and pumping the fluid through it. Later we were able to replace this welded semi-continuous tube with a single 65 m continuous length of 500-gauge 110 mm internal diameter polythene layflat tubing, flown to us from Rothera. With careful handling on lowering and retrieving the polythene tubing, we found both the welded and the continuous layflat tubing was sufficiently robust to carry its own weight and that of the descending fluid in the hole. These two lengths of simple polythene tubing lasted us the whole drilling project. The third issue came at the very end of the drilling once bedrock had been reached. We were attempting to remove final chips from the base of the hole using the core drill when the inner core barrel and cutter head became detached from the motor drive connector, slipped out of the outer barrel and dropped to the bottom of the hole. The barrel had become disconnected from the ‘super-banger’ stepped connector that has its origins in the early versions of the Danish and French deep ice core drills. We were able to fashion a cone out of wood (Fig. 11) to centre the connector into the top of the drill barrel at the bottom of the hole, and with careful rotation and lowering of the drill, we were able to fully reconnect the barrel to the connector and recover the drill.
Cone fashioned out of wood attached to the ‘super-banger’ connector on the lower part of the hollow shaft section, used to centre the connector over the top of the core barrel last at the bottom of the borehole.

The partially empty borehole was then used to deploy a Distributed Temperature System (DTS; e.g Bense and others (Reference Bense2016)) to log the borehole temperature over the full 651 m depth, at a vertical resolution of 1 m. An armoured, double fibre-optic cable, with a terminal reflector at the bottom, allows the measurement of temperature in the borehole by comparing the phase of a laser light reflected from the terminal with that of the laser source. Five calibrated thermistors spaced along a second cable allow us to calibrate the DTS measurement. The DTS system was left logging over 5 days to enable us to calculate the equilibration of the borehole temperature after the disturbance of drilling and bailing. The cables were left in the hole for further measurements in subsequent seasons when the borehole would be fully equilibrated. Analysis of the borehole data allows us to measure the basal temperature, and the geothermal heat flux, which is a relatively rare direct measurement in Antarctica. Preliminary results are given in Figure 12.
Skytrain Ice Rise borehole temperature profile, and modelled estimate of geothermal heat flow. The borehole measurement is made with a Distributed Temperature System (DTS): the phase change of reflected laser light along a double fibre-optic cable lowered to the bottom of the borehole gives a temperature every 1 m depth. Symbols show the measured data at sampled 10 m intervals over a period of several days. Modelling of the data, with ice rheology following Martín and Gudmundsson (Reference Martín and Gudmundsson2012), allows an estimate of basal temperature and geothermal heat flow.

3.2. Sherman Island
Ice at Sherman Island was drilled using the BAS-RAID rapid ice drill during late January 2020. The logistics for the Sherman Island drilling site, located close to the coast in the Amundsen Sea sector of West Antarctica, was supported by aircraft working out of the UK Rothera Research Station on Adelaide Island on the west side of the Antarctic Peninsula. To access the drilling site by air, using Twin Otter aircraft carrying loads of up to ~700 – 850 kg, required ~1500 km of flying, refuelling at three sites en route (at the UK summer field support stations Fossil Bluff and Sky Blu, and remote fuel depots mid-way between Sky Blu and Sherman island). Transit to the site from Rothera took ~10 h including fuelling stops. The operation was carried out by five personnel on the ground. Ideally the number of field personnel to drill using the BAS-RAID system is three (one driller, one sampler and one Field Guide). In this operation, we had an additional student, who had an independent project, and an additional Field Guide. The two Field Guides travelled to the drill site over-snow by skidoo, bringing their own field living unit, from the Hudson Mountains, where they had been involved in the UK-USA Thwaites project prior to the Sherman Island drilling. At the end of the drilling, they travelled back over-snow to the Hudson Mountains. The full additional drilling and camping infrastructure and three drilling personnel were deployed with five input flights (~3500 kg total input for drilling equipment and fuel, food, tents and personnel), making this a relatively lightweight project for the anticipated 430 m drilling depth. On site, two tents were set up for sleeping, and one larger tent for eating. All cooking was carried out on paraffin-fuelled ‘Primus’ stoves, as is the BAS tradition. Uplift of equipment (other than that travelling back to the Hudson Mountains over-snow) was by the reverse route by air back to Rothera.
The BAS-RAID drilling rig (Rix and others, Reference Rix, Mulvaney, Hong and Ashurst2019) was set up on the surface (Fig. 13) and protected from the wind and drifting snow by three ‘pop-up’ windbreaks. The drill is an unusual design of electromechanical drill: no core is collected, but ice chips are cut by an auger mounted on the bottom of an outer drill tube which is rotated by the motor-gear section mounted above it. Ice chips enter the outer barrel and are carried upwards by a stationary spiral flight that is fixed to the motor section, which is prevented from turning in the hole by an anti-torque section above. The drill barrel is 4.48 m long and is able to drill a maximum of about 1.5 m in firn and 1.4 m in ice, though we limited the depth in deep ice to 1.3 m per run. Power to the drill motor is delivered through an armoured cable with four electrical conductors through a slip ring on a winch with 600 m of cable at the surface. The drill tower and sheave wheel are 9 m tall and are mounted on the base of the winch frame. The tower is erected by first lying the mast on the snow surface, forward of, and connected to, the winch frame, and guyed at each side. The winch cable is run out to a surface-anchored sheave wheel to the rear of the winch frame, then forward, across the winch to the sheave wheel at the top of the mast, then down to an anchor on the winch base at the foot of the mast. Winding in on the winch then shortens the cable and the mast rises as a consequence. Once vertical, cables from the upper mast and the middle of the mast are secured to anchors in the snow. The winch control panel is mounted alongside the winch, while the drill control panel is housed under the cover of a small ‘pop-up’ tent alongside the winch controller. Power to the BAS-RAID drill was supplied from two Honda EU-20i inverter-type portable generators, running on petrol, and left operating exposed to the weather. Each generator outputs ~1600W at 230 VAC; they were electrically tied together to give a single 3 kW 230 VAC supply to the winch/drill system. Fuel consumption was about 10–12 L of petrol per day, operating for about 12 h per day.
BAS-RAID drill (Rix and others, Reference Rix, Mulvaney, Hong and Ashurst2019) in action in bad weather on Sherman Island. The winch and mast are central in the picture, with the drill exiting from the borehole; only the anti-torque section and the motor-controller section are visible. To the right is the temporary pop-up shelter for the drill controls. Pop-up windbreaks protect the driller, standing in front of the winch control panel, from the wind and drifting snow. To the left, the top of the sampler tube is visible projecting from a vertical hole in the snow, designed to enable filling, and to keep the sampler chilled between runs to avoid chips sticking in its barrel.

Generally, the BAS-RAID drill was operated by one person, who stood either in the open by the winch control panel during spooling or tucked inside the pop-up tent while controlling the drill. During the spooling/drilling phase, the two people would bag and log the samples from the previous drill run using the custom-built chip sampling device while sheltering from the wind behind the windbreaks. The sampling device (Fig. 14) was filled directly from the drill auger by rotating the spiral in the opposite direction to drilling, thus pushing out the ice chips in a chronological sequence with the bottom of the sampler filled with the chips from the bottom of the drill, and hence the bottom of the borehole. A mechanism with 20 windows allowed discrete samples of the ice chips to be taken at increments along the recovered column of ice chips. Samples near the surface were taken every 0.11 m, then at a lower resolution through the 323 m (later we intended to increase sampling resolution as we approached the bed). In total, we took 1724 samples from 323 m of ice drilled, for a mean sampling resolution of 0.19 m.
The RAID chip sampler comprises an aluminium tube, 1.6 m in length, with a series of 5 cm wide slots covered by individually rotating Perspex windows. The sampler is oriented vertically and filled from the top by rotating the RAID drill auger backwards, ejecting the drill chips in a chronological sequence into the sampler chamber. Once filled, the sampler is oriented almost horizontal, and windows opened sequentially from the top to remove samples of ice into numbered bags.

Prior to the drilling operation, the depth of the ice sheet was checked using a phase-sensitive radio echo sounder (the BAS ApRES system). The overflight data from the US IceBridge radar project had indicated that the ice depth is ~420 m. We chose a drill site that we believed to be on the ice divide, close to the summit of the Sherman Island which lies towards the eastern end of the elongate island (Fig. 5). Data from the ApRES radar indicated that the bed at the drill location was at 428 m. From prior RACMO reanalysis data (G. Marshall, pers. comm.), we estimated that the mean annual surface temperature might be − 15°C (subsequent measurement of the 10 m temperature in the borehole was − 13.8°C), and we estimated the basal temperature would be ~ −5°C, assuming a common value for geothermal heat flux.
Modelling the borehole closure rate (based on Talalay and others (Reference Talalay2015)) on the 82.5 mm diameter borehole produced by the BAS-RAID drill indicated to us that we would suffer from sufficiently fast closure that we would risk trapping the drill at depth as we approached the bed. To avoid this we planned to drill in the later stages (from ~300 m) 24 h per day until completion to minimise the closure time, and to ream the borehole regularly using a reaming head which would replace the normal drilling head. There is no mechanism on our drill that would collect the ice chips reamed from the borehole wall; they would fall to the bottom of the borehole to be subsequently recovered by the normal auger head in one or two ‘drilling’ runs before further depth penetration into the ice sheet. Calculations suggested that as we neared the bed (last few tens of meters) we would need to ream every 15 to 5 m with one to two chip recovery runs.
In practice, we drilled for 5 days (~10–12 h per day) to 323 m without any major problems with the drill or winch system. From experience drilling on James Ross Island, which had a mean annual temperature of − 14.4°C (Table 1) and where we had encountered numerous ice lenses and frozen melt layers in the cores (Abram and others, Reference Abram2013), we expected to encounter an even greater number of refrozen melt layers in the warmer Sherman Island ice (mean annual temperature − 13.8°C, Table 1). However, there appeared to be no impact on the drill performance from ice lenses, and the drill ran smoothly through the whole operation until 323 m. At that point, in a storm with drifting and blowing snow battering the drilling and sampling operation, spindrift entering the drill controller shelter caused an electrical fault in the drill controller, which ended drilling late in the evening of the fifth drilling day. By the time the fault was rectified, 16 h had elapsed before the drill was next sent down the borehole. Conscious of the likelihood of borehole closure, a careful watch was made on the indicated weight of drill and cable during descent; no lightening of the total cable load, which might have indicated the drill becoming tight in the borehole, was observed. At the bottom of the borehole, the drill was touched down slowly onto the bottom to check depth, then raised slightly to rotate the drill and begin drilling. At this point, the drill became stuck in the borehole. The drill barrel and cutter head (in this drill, the auger head is mounted on the outer drill barrel which rotates, while the inner auger remains stationary) were free to rotate in either direction, indicating that the drill was stuck above the barrel at either the motor/controller section or the anti-torque section.
In order to try to free the drill, we lowered two batches of several litres of hot antifreeze (borrowed from the spares kit for the skidoos) down the borehole in an invertible polythene tube designed to discharge below the estimated firn pore close off. Tension was kept on the cable (to the maximum pull of 230 kg on the winch), but no upward movement of the drill was observed. Further large quantities of antifreeze were requested from Rothera, but aircraft operational commitments meant that it could not be delivered for 4 days. We continued to rotate the drill barrel for a further 30 h while maintaining the pull on the cable before the drill motor current began to rise, and eventually the rotation stopped. We assumed at this point the borehole closure had finally trapped the drill barrel and auger head. Concluding that the drill was lost, we cut the cable and left the drill sonde at 323 m depth in the ice sheet. Prior to cutting the cable, the DTS was used to measure the full borehole temperature, logged over 3 days, which will allow us to calculate the basal temperature and the geothermal heat flux.
4. Summary
In two Antarctic field seasons, with small teams deployed to the ice, we were able to drill an ice core 651 m to the bed of Skytrain Ice Rise and recover a chronological sequence of ice chips to a depth of 323 m on Sherman Island before the loss of the BAS-RAID drill. This will provide the resources for a wide range of laboratory analyses to understand the local glacial and climate history, and specifically to examine the hypothesis that the WAIS collapsed in the LIG. In both boreholes, temperature profiles will give us two relatively rare direct measurements of geothermal heat flux.
Acknowledgements
We thank the ever helpful and enthusiastic BAS Operations and Logistics sections, the Air Unit and all on station at Rothera for their support of the WACSWAIN project field work. The Field Guides Caspar McKeever supported us on Skytrain Ice Rise, and Sarah Crowsley and Tom King supported us on Sherman Island along with research student Dieter Tetzner. This project has received funding from the European Research Council under the Horizon 2020 research and innovation programme (grant agreement No 742224). This material reflects only the author's views and the Commission is not liable for any use that may be made of the information contained therein. E.W. is also supported by a Royal Society Fellowship.


 Open access