

The discourse on sugars (‘sugar’) in foods and diets has shifted recently in several important ways. First, the past few years have seen the emergence of global dietary intake guidelines recommending free or added sugar intakes be limited to a maximum of 5 % or 10 % of energies per day to limit the risk of associated adverse health outcomes(1–3), beginning in 2014 when the WHO proposed their free sugar intake guidelines(4). Second, sugar-related food labelling policies in Canada have also been amended(5,6) . In 2015, the government of Canada proposed sugar-related amendments to the Canadian Nutrition Facts table (NFt)(6) which were finalised in 2016 and will require a declaration for a percent daily value, or benchmark, for total sugar, as well as the grouping of sugar-based ingredients in the Ingredients List(5) to be implemented by 2022(7). The timing of these shifts in sugar-related labelling policies and intake recommendations also coincide with an increased consumer interest in reducing sugar intakes(8). According to Tracking Nutrition Trends 2018, Canada’s longest running nutrition tracking study, 79 % of Canadians reported efforts to consume less sugar and 72 % reported selecting products because they were low in sugar(8). Unfortunately, Canadian intakes of sugars have been reported to be high, with estimates of added sugars exceeding recommended maximum intakes at 11–13 % of energies from free sugars(Reference Brisbois, Marsden and Anderson9).
This changing landscape around sugar regulations and consumer behaviour has the potential to stimulate product reformulation to improve the nutritional composition of foods available in the market place(Reference Grunert, Bolton, Raats, Mick, Pettigrew and Pechman10,Reference von Tigerstrom11) . An example of this would be the voluntary removal of trans-fats from many products in the food supply after the introduction of a mandatory trans-fat declaration on the NFt in Canada(Reference Arcand, Scourboutakos and Au12,13) . Food reformulation can be described as the improvement of the nutritional composition of existing foods, either by reducing the level of nutrients to limit (e.g. sugar, Na and saturated fats) or by maintaining or increasing the level of nutrients to encourage (e.g. fibre, vitamins and minerals)(Reference van Raaij, Hendriksen and Verhagen14). The reformulation of foods and beverages has been touted as a ‘best buy’ approach to achieve desired dietary intakes at the population level(15). It can equitably benefit the population including those with low levels of income and health literacy, as it does not require major behaviour change on the part of the consumer(Reference van Raaij, Hendriksen and Verhagen14,Reference MacGregor and Hashem16) , provided that reformulated products are not higher in price. Furthermore, a recent review of the literature has suggested that sugar reformulation can reduce sugar intakes and thus improve health outcomes(Reference Hashem, He and MacGregor17). However, a notable concern regarding food and beverage reformulation is the potential for unintended consequences(Reference van Raaij, Hendriksen and Verhagen14), particularly when it comes to sugar-focused reformulation. Sugars are added to foods and beverages as an ingredient because it offers a wide variety of functional properties(Reference Schorin, Sollid and Edge18–Reference Van Horn, Johnson and Flickinger20). Sugar can be used to enhance sweetness and flavour, balance tartness, improve preservation by binding to water and retarding spoilage, improve mouth-feel and texture, contribute to bulking or volume, provide fuel for yeast growth, improve browning capabilities, control moisture, prevent crystallisation and balance freezing-points(Reference Schorin, Sollid and Edge18–Reference Van Horn, Johnson and Flickinger20). Because of these qualities, various ingredients may be needed to replace the functional properties provided by sugar during reformulation which may affect the levels of energies and other nutrients in a direction inconsistent with improving the nutritional quality of a product.
Other countries, such as the UK, are attempting to reduce the level of sugars in the food supply through formal sugar reduction strategies, which include reformulation, but also the introduction of new products(21). The UK programme aimed to reduce sugar levels in a range of products that are important contributors to children’s sugar intakes by 20 % by the year 2020. The programme aimed for a 5 % reduction in the first year, which was not met(22) and there was only an overall 2·9 % reduction in average sugar content between 2015 and 2018(23). Canada does not have a formal strategy in place to reduce the levels of sugar in the food supply. The rates of sugar-related reformulation in foods and beverages in Canada have yet to be examined, nor have the changes in nutritional composition that accompany reformulation of foods and beverages to be lower in sugar been studied. This study aimed to quantify the rates of reformulation, or changes to the composition of existing products, that result in changes to sugar contents in matched Canadian prepackaged foods and beverages appearing in both 2013 and 2017 and to identify the resultant changes in the nutritional composition of the foods and beverages that have been lowered in sugar.
Methods
Food and beverage data
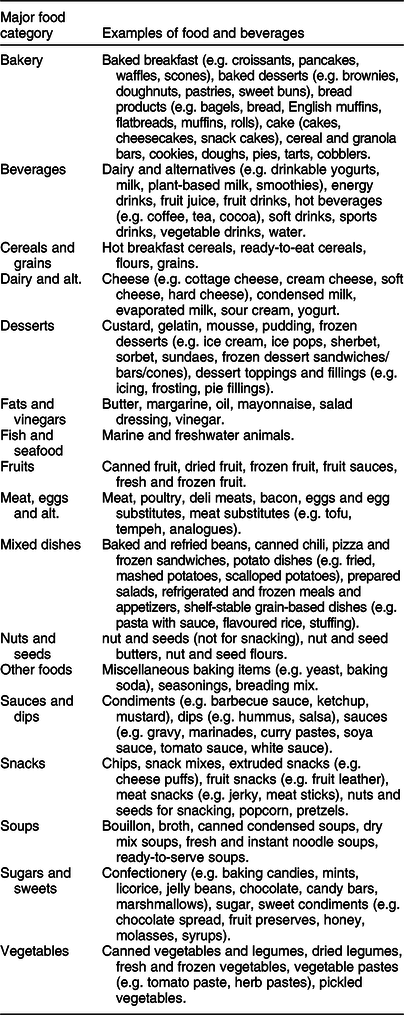
This study was a longitudinal examination of food and beverage products over time. The University of Toronto’s Food Label Information Program (FLIP) 2013 and FLIP 2017 databases were used. The FLIP database is a branded food composition database that includes information on nutrient contents, Ingredient Lists, company, brand, price, container size, nutrition marketing and Universal Product Code for prepackaged foods and beverages collected from the largest grocery retailers by market share in Canada. An existing taxonomy was used to categorise FLIP products into sugar-focused major food categories to ensure comparisons of like products (Table 1)(Reference Bernstein, Schermel and Mills24). The analyses were limited to ‘matched’ products (n 6781), meaning products that were available in both FLIP 2013 and FLIP 2017 databases. Matches were identified using Universal Product Codes and were confirmed through the product names and descriptions.
Major food and beverage categories used in this study and examples of products included in each
Nutritional composition
Nutritional composition was obtained from the NFt. Matches with missing nutritional data in one or both time points (n 44) and products in which a manufacturer error in nutrient declaration was suspected were excluded from the analyses. Errors in manufacturer nutrient declarations were identified by either comparing declared energy contents with energy contents calculated using Atwater factors (>20 % difference was considered an ‘error’) (n 94) or if the declared sugar levels exceeded the declared carbohydrate levels (n 6). In addition, there has been a notable concern that the bulk lost from sugar may result in bulk of other ingredients increasing and potentially resulting in higher levels of refined starch(Reference Buttriss25). However, there is no mandatory declaration of starch content on the NFt in Canada(26). Thus, an approximation of starch content was determined through a calculation in which total sugar and fibre were subtracted from total carbohydrates, as declared on the NFt. In cases where this resulted in a negative value (n 30), likely due to the rounding of declared values according to the regulations outlined in the Food and Drugs Regulations (26), the value was rounded to zero. If the negative value was >1 g, then the product was excluded, based on the suspicion of an error in manufacturer declaration (n 9). Overall, 6628 products were included in this analysis. Nutrient contents were analysed based on a standardised serving of 100 g or 100 ml. Conversions from weight to volume or vice versa were conducted for some products using density values from the Canadian Nutrient File to ensure that all products within a food category were analysed in the same units. Results for beverages and desserts are presented per 100 ml, the remaining categories are presented per 100 g.
Data analysis
The proportion of matched products that had no change, increases or decreases in total sugar levels (g per 100 g or 100 ml) were determined by subtracting the sugar level (per 100 g or 100 ml) of the 2013 version of a product from the 2017 version of that same product. Wilcoxon signed-rank tests, the non-parametric equivalent of paired-samples t tests, were used to determine the statistical significance of any changes over time. Items with changes in sugar levels were further subdivided into those that had an increase or a decrease in sugar between 2013 and 2017. Descriptive statistics were used to describe changes in sugar levels in absolute (g per 100 g or 100 ml) as well as relative values (% change from 2013) for these products. The relative change in sugar levels for products with increases or decreases in sugar was determined by dividing the change in sugar contents over time by the sugar levels in the 2013 version of the product. Among products with decreases in sugar levels from 2013 to 2017, changes in nutritional composition (i.e. energies, total fat, saturated fats, Na, carbohydrates, starch, fibre and protein) were examined using descriptive statistics in absolute as well as relative values (% change from 2013) and Wilcoxon signed-rank tests. These nutrients represent those that are plausible replacements for sugar either for their contribution to bulk or flavour. All analyses were conducted overall as well as stratified by major food groups. Only those food groups with significant decreases in sugar were examined for statistically significant changes in nutritional composition. P-values <0·05 were considered statistically significant. Analyses were conducted using SAS version 9.4.
Results
Changes in sugar contents
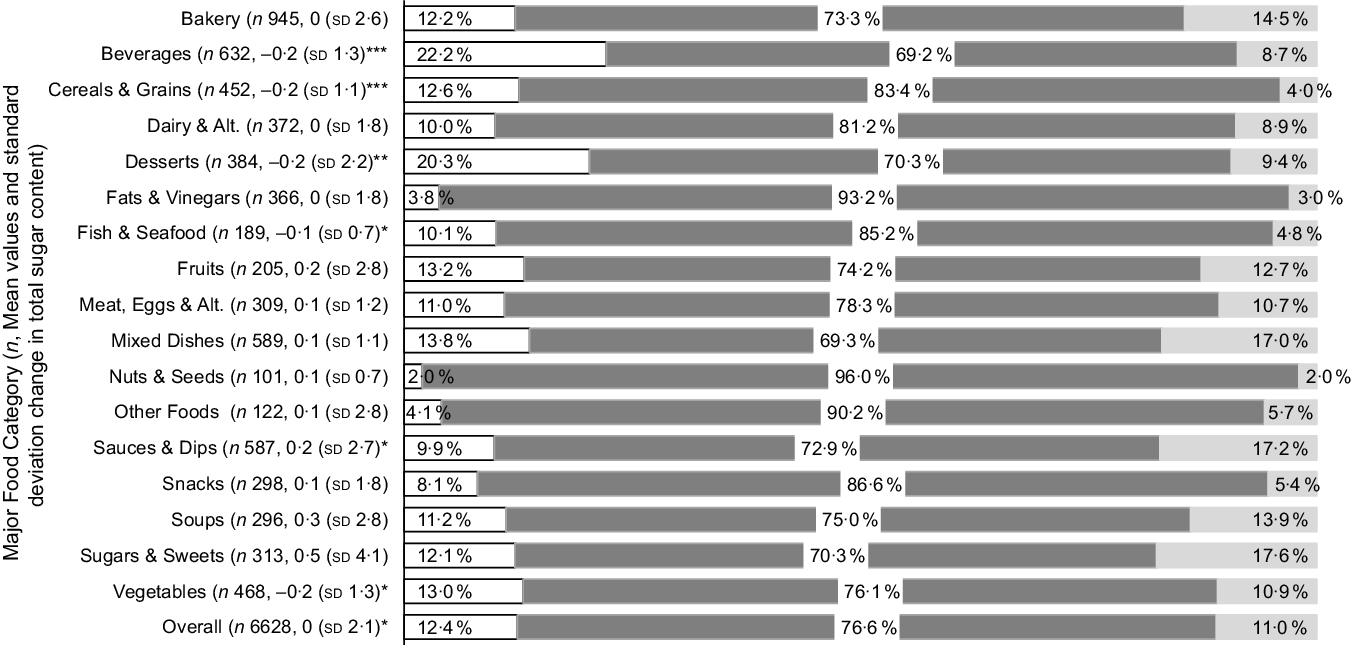
Of the products included in this analysis (n 6628), most (76·6 %) did not undergo changes in sugar levels, 12·4 % had a decrease in total sugar and 11·0 % had an increase in total sugar contents between 2013 and 2017 (Fig. 1). Overall, there was a mean change in sugar levels of 0 ± 2·1 g (Fig. 1) with a median change of 0 g per 100 g or 100 ml. Six of the seventeen major food categories had significant changes in mean sugar levels with five of them being significantly less. Beverages had the highest proportion of products with a decrease in sugar (22·2 %) followed by desserts (20·3 %) (Fig. 1). For example, the types of beverages with the highest proportion of products reduced in sugar were sports drinks (64 %), hot beverages (e.g. coffee, tea and cocoa) (38 %), vegetable drinks (27 %), soft drinks (25 %) and fruit drinks (23 %). Sugars and sweets had the highest proportion of products with an increase in sugar (17·6 %), followed by sauces and dips (17·2 %) (Fig. 1). The categories with significant decreases in mean sugar levels (i.e. beverages, cereals and grains, desserts, fish and seafood and vegetables) also had a higher proportion of products with a decrease rather than an increase in sugar contents (Fig. 1).
Mean values and standard deviations change in sugar content and proportion of products that had a decrease, no change, or increase in sugar content between 2013 and 2017, overall and by major food category (n 6628). Difference in sugar content determined by dividing the difference in sugar contents between 2013 and 2017 as a proportion of 2013 sugar levels. Significance determined with Wilcoxon signed-rank tests. *P < 0·05, **P < 0·01, ***P < 0·0001. Alt., Alternatives. ![]() , Decrease;
, Decrease; ![]() , no change;
, no change; ![]() , increase
, increase
The median decrease in sugar levels among products reformulated to be lower in sugar (n 823, 12·4 %) was 1·6 g per 100 g or 100 ml, or a median decrease of 19 % from 2013 (Table 2). The magnitude of change differed by major food category (Table 2), with some of the largest absolute decreases seen in fats and vinegars, other foods and sugars and sweets. The median increase in sugar levels among products reformulated to be higher in sugar (n 730, 11·0 %) was 1·5 g per 100 g or 100 ml or a median increase of 18 % from 2013 (Table 3). The magnitude of change differed by major food category (Table 3), with some of the largest absolute increases also seen in fats and vinegars, other foods and sugars and sweets.
Change in total sugar content (g per 100 g or 100 ml and % change) for the subgroup of products that had a decrease in sugar content between 2013 and 2017, overall and by major food category (n 823)
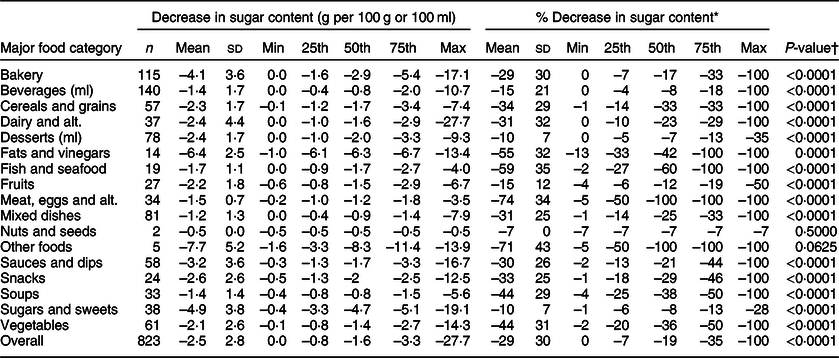
Alt., alternatives; Min, minimum; Max, maximum.
* Percent change in sugar content determined by dividing the difference in sugar contents between 2013 and 2017 as a proportion of 2013 sugar levels.
† Significance determined using Wilcoxon signed-rank tests.
Change in total sugar content (g per 100 g or 100 ml and % change) for the subgroup of products that had an increase in sugar content between 2013 and 2017, overall and by major food category (n 730)
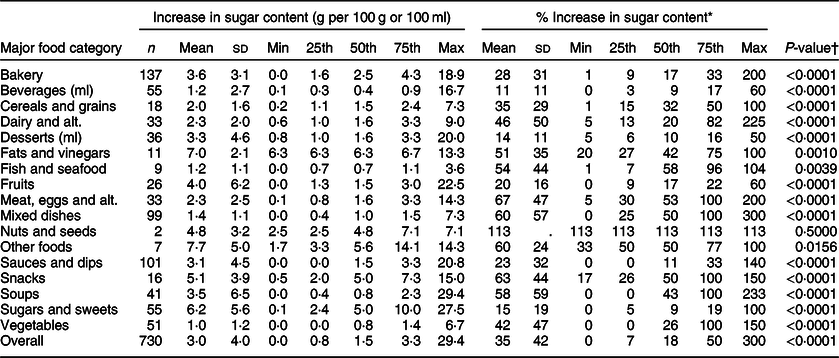
Alt., alternatives; Min, minimum; Max, maximum.
* Percent change in sugar content determined by dividing the difference in sugar content between 2013 and 2017 as a proportion of 2013 sugar levels.
† P-value determined using Wilcoxon signed-rank tests.
Changes in nutrient contents among reduced sugar products
Among the products that had decreases in sugar levels, there was a significant difference in energies, total fats, saturated fats, Na, carbohydrates and starches. There was a median change of 0 kJ or g for energies, total fats and saturated fats, a median decrease of 0·4 mg for Na, 0·4 g for carbohydrates and a median increase of 0·8 g starch per 100 g or 100 ml. No significant differences were seen in fibre and protein levels (Table 4). Changes in nutrient contents varied by major food category for all the major food categories identified in Table 2 as having a significant reduction in sugar contents (Supplemental Table 1). For all the major food categories with a significant change in energies (n 9/15), the median change was either 0 kJ or a decrease in energy levels of 2·6104 to 49·3712 kJ (0·6 to 11·8 kcal) per 100 g/ml. Most categories did not have significant changes in total fats or saturated fat levels. Eight categories had significant changes in median Na levels, of which seven were decreases ranging from 0·2 to 136·9 mg per 100 g or ml. Eight categories had significant changes in median carbohydrate levels, all of which were decreases, ranging from 0·4 to 6 g per 100 g or ml. Almost all categories (n 13/15) had significant differences in median starch levels with most being increases ranging from 0·6 to 2·9 g per 100 g or ml (Supplemental Table 1). Although there was no significant change in fibre and protein levels overall (Table 4), there were specific food categories in which there were significant changes in these nutrients, although the median change was 0 g per 100 g.
Change in nutrient contents (absolute and % change) among products with reductions in total sugar content between 2013 and 2017 (n 823)

Min, minimum; Max, maximum.
* Percent change in energy and nutrient contents determined by dividing the difference between 2013 and 2017 levels as a proportion of 2013 levels.
† Significance determined using Wilcoxon signed-rank tests.
‡ To convert energy values from kcal to kJ, multiply it by 4·184.
Discussion
This was the first study, to our knowledge, to assess the reformulation of sugar contents over time and to describe the nutritional compositional changes that accompanied decreases in sugar contents. The results suggest that there has been limited progress towards lowering sugar contents among Canadian prepackaged foods and beverages. Unfortunately, it appears that products reformulated to be lower in sugar are not consistently lower in energies due to an increase in starch.
First, the findings of this study demonstrate that little progress has been made towards lowering sugar contents in prepackaged foods and beverages between 2013 and 2017, with the majority of products having no change in sugar levels during that time. Although there were some products with reduced sugar, this reduction appeared to be offset with increased sugar contents in other products in the category. Despite the recent recommendations to limit intakes of free or added sugar(1–3) and an increased interest by Canadians to reduce their sugar consumption(8), 11·0 % of products examined in this study had increased sugar levels during this time period. As a result, the changes in sugar contents of foods and beverages available in the Canadian food supply in both 2013 and 2017 were negligible.
Results also suggest that reducing the sugar contents of foods and beverages is plausible in many circumstances, based on the changes to sugar levels observed. All major food categories had products reformulated to be lower in sugar, demonstrating that reducing sugar contents can be done without sacrificing safety or quality. Overall, a median reduction of 19 % was seen in products that were reformulated to be lower in sugar. Beverages and desserts may especially lend themselves well to having lower sugar levels, as more than 20 % of products within these categories had decreased sugar levels between 2013 and 2017. Although there are several technological issues faced during reformulation in order to reduce sugar levels, it is generally accepted that sugar can be more easily removed from liquid sources because the bulk lost from sugar can be replaced with water, which may explain why sugar reformulation was most prevalent among beverages.
On the other hand, findings also indicate that some food types were less likely to be reformulated to have lower sugar levels. Three major food categories, fats and vinegars, nuts and seeds and other foods, had a lower proportion of products with reductions in sugar (<5 %) as well as a lower proportion of products with increases in sugar, likely as a result of the limited sugar content inherent in the formulation of these products. The changes in sugar contents in these categories, when seen, were almost exclusively a result of the reformulation of salad dressings in fats and vinegars, peanut butters in nuts and seeds and seasoning mixes and bread crumbs in other foods.
Most food categories had some foods that achieved 100 % reduction in sugar content, although 84 % of them contained <1 g sugar per 100 g or 100 ml. For desserts, fruits and sugars and sweets, the maximum reductions were 35, 50 and 28 %, respectively, indicating that it was likely not feasible or possible to reduce the level of sugar by 100 %, either because naturally occurring sugar are present from fruit or dairy (in ice cream, for example), or because sugar is a major component of the product (e.g. sugars and sweets). Sugar-free products do exist in desserts and sugars and sweets categories, as identified in other analyses of the Canadian food supply(Reference Bernstein, Schermel and Mills24); however, they likely were not introduced through reformulation but rather through the introduction of new products.
As sugar-containing ingredients are removed from the product, other ingredients may be added or alternatively the proportions of the remaining ingredients can be increased to replace the volume lost. Examining this has allowed us to understand the changes in nutrient contents that accompanied actual reductions in sugar in Canadian foods. Such analyses can be informative as to the potential nutrition-related consequences that can accompany such reformulation efforts. The association between excess consumption of sugar and increased risk of obesity, diabetes and CVD is thought to be mediated at least in part through the caloric contribution of sugar(Reference Te Morenga, Mallard and Mann27–Reference Yang, Zhang and Gregg30). Thus, the reduction of sugar content should be carried out with the aim of achieving a subsequent decrease in energies, or at the least, avoiding an increase in energies whenever possible(21).
This study found that energies were lower among sugar-reduced products by an average of 21·7568 kJ (5·2 kcal) but a median of 0 kJ (0 kcal) per 100 g or 100 ml. There were also instances in which reduced sugar products had increased energy contents, which would be counter-productive to the health benefits associated with limiting energy intakes. Thus, on average, sugar were reduced by 2·5 g per 100 g or ml, the equivalent of 41·84 kJ (10 kcal) (2·5 g sugar × 16·736 kJ/g); however, this is twice the average reduction in energies seen in sugar-reduced products, indicating that reductions in sugar have been offset by increases in other energy-contributing nutrients. Analyses of the nutritional composition of the foods that were lower in sugar indicate that the reduction in sugar was at least partially being offset with an increase in starch. Starch content increased in almost all major food categories examined. Further investigation identified that for 14·7 % of the reduced-sugar products, all of the sugar taken out was replaced by starches as the starch content increased by the same amount that the sugar content decreased (data not shown). This relationship is a concern with sugar reformulation because there is no difference in energy density between sugar and refined starches(Reference Buttriss25).
Notably, an existing body of literature has examined the relationship between intakes of sugar and fats, and in general has found that decreasing intakes of fats is related to increasing intakes of sugar and vice-versa(Reference Sadler, McNulty and Gibson31). Although the current study did not look at intakes, little evidence of this ‘sugar-fat see-saw’(Reference Sadler, McNulty and Gibson31) was present at the level of the food supply. Among products with reduced sugar contents, the average and median levels of total fats were either unchanged or reduced, with only a couple categories having an average increase (e.g. fish and seafood and sugars and sweets). However, each category had examples of products in which the fat content was increased in sugar reduced products. This indicates that whether the nutrient changes are favourable or unfavourable overall, there is variation within a category which highlights the potential for changes to continue in either direction, should a greater proportion of products be reformulated. If a systematic reformulation strategy were to be adopted in Canada or elsewhere, it would therefore be important to outline how best to reformulate foods from different major food categories in a way that aligns with current public health nutrition directions (e.g. lower energies, saturated fats, sugar and higher levels of fibre). For example, as part of the UK’s sugar reduction strategy, recommendations were made to help industry achieve the 20 % sugar reduction targets with instructions that reductions to energies should be made whenever possible(21).
The ingredients used to replace sugar may at least partially explain the relationships between sugar and other nutrients in the lower sugar reformulated foods. Interestingly, the reductions in sugar seen in this analysis were not a result of replacing sugar with low/no-energy sweeteners. In fact, very few sugar-reduced products (n 4, 0·5 %) were found to have added low/no-energy sweeteners in the ingredient lists between 2013 and 2017, and in fact, four products that were reduced in sugar had low/no-energy sweeteners removed from the product during that time frame (data not shown). However, as there is no mandatory declaration of the quantity of ingredients in a food in Canada, it is virtually impossible to determine changes in the proportion of each ingredient added to a product unless the order of the ingredients listed changed as well(32). A thorough examination of the changes to the formulation of a product, beyond that which could be identified by examining the nutritional composition or Ingredient list, was not possible with the labelling information available in Canada.
This study only examined differences in total sugar, not other types of sugar. Free sugars or added sugars are the sugars that have been removed from their naturally occurring source, while intrinsic sugars remain in their naturally occurring source (e.g. in fruits, vegetables, naturally occurring in dairy)(Reference Cummings and Stephen19). Thus, unless a whole source ingredient of intrinsic sugar was removed or reduced, the reductions are likely to be a result of changes in free or added sugar.
There are several limitations of this study. First, any products that appear in both FLIP 2013 and 2017 that did not have identical Universal Product Codes were not captured in these analyses. Thus, if the manufacturer changed the Universal Product Codes for a product between 2013 and 2017, the match would not have been identified or examined in this study. Second, differences in nutrient contents for products may be magnified when standardising the nutrient contents per 100 g or 100 ml. For example, a product with a serving size of 5 g could have had a change of as little as 0·1 g of sugar (from 0·5 to 0·4 g) between 2013 and 2017, but upon rounding is presented on the NFt as 1 g of sugar in 2013 and 0 g sugar in 2017 to comply with rounding rules set out in the Canadian Food and Drug Regulations(33). Per 100 g, this is 20 and 0 g for the 2013 and 2017 versions of a product, respectively, and considered a 20 g difference rather than the actual 2 g difference. Such discrepancy is particularly exacerbated for foods with smaller serving sizes. On the other hand, for foods with large serving sizes, relatively large absolute reductions can result in a small decrease in amount of sugar when examined per 100 g or 100 ml. Third, the current study only evaluated changes in nutritional composition of products identified in both collections of the FLIP database. There may be overall changes in sugar contents in the prepackaged food supply due to the introduction of new products and removal of products from the marketplace, which were not captured in this analysis. Lastly, this analysis examined all foods and beverages that were available in both the 2013 and 2017 collections of the FLIP database, and the findings have not been weighted according to sales. It is feasible that products with different levels of sugars reformulation are purchased more or less often and therefore could have differential impacts on intakes than could be observed in this study.
Conclusion
Importantly, this study provides insights into the nature of sugar reformulation efforts in the Canadian food supply by characterising the compositional changes associated with sugar reductions. This information is critical to both informing policy efforts to reduce sugar in the prepackaged food supply and monitoring progress in this regard. These data provide the first assessment of the rates of sugar-focused reformulation that took place in the Canadian prepackaged food supply between 2013 and 2017. The results show that limited progress towards reducing sugar levels through reformulation has been made. Limited efforts to lower sugar levels in Canadian foods through industry-led voluntary reformulation suggest that there may be a need for a more systematic approach; for instance, an approach similar to the government-led Na reduction strategies in Canada(34) and other countries or the recently introduced sugar reduction strategy in the UK(35). The wide range of sugar content in any given food category, as demonstrated by earlier research evaluating the FLIP food composition database(Reference Bernstein, Schermel and Mills24), combined with the progress observed in this study, although limited, shows that foods and beverages with lower sugar levels are achievable and feasible. Future efforts to examine new product introduction, sales-weighted data and the potential to impact sugar intakes through reductions in portion sizes can further inform the introduction of a sugar reduction strategy in Canada.
Importantly, this study presents data on the compositional consequences of lowering sugar in foods as manufacturers respond to a changing landscape of consumer demand, regulations and guidelines calling for lowered sugar intakes. Unfortunately, it appears that products reformulated to be lower in sugar are not consistently lower in energies due to an increase in starch. In the future, precautions against the unintended consequences of sugar-focused reformulation should be taken to ensure that sugar reduction efforts result in overall improvements to the nutritional composition of reformulated foods and beverages and ultimately to the overall diet quality of Canadians. This study also produces a baseline measure to compare future reformulation efforts as sugar-related labelling changes come into force in Canada(5) and as dietary recommendations from authoritative health bodies are further operationalised(1–3).
Acknowledgements
Acknowledgements: None. Financial support: This work was supported by Canadian Institutes of Health Research (CIHR) Operating Grant: Sugar and Health (grant number 201701SA2-152805) and the Banting and Best Diabetes Centre – Novo Nordisk Studentship (M.W.). The funding sponsors had no role in the design, analysis or writing of this article. Conflict of interest: The authors declare no conflict of interest. Authorship: J.T.B. and M.R.L. conceived the study. J.T.B. and A.K.C. designed the experiments. J.T.B. performed the experiments, analysed data and wrote the first draft of the manuscript. M.W. assisted with data analysis and edited the manuscript. All authors were responsible for final content. Ethics of human subject participation: Not applicable.
Supplementary material
For supplementary material accompanying this paper visit https://doi.org/10.1017/S1368980020001159


