


Introduction
Weeds remain among the most consequential biotic constraints in crops, because they reduce yield and quality through resource competition and allelopathic interference. Direct competition for space, water, nutrients, light, and CO2 curtails crop growth and resource-use efficiency (Reddy Reference Reddy2018). Allelopathic signals, including root exudates, volatiles, and light-quality cues, can alter crop physiology and morphology, particularly early in the season, reducing height, leaf area, chlorophyll, and biomass (Colbach et al. Reference Colbach, Gardarin and Moreau2019; Horvath et al. Reference Horvath, Clay, Swanton, Anderson and Chao2023). Globally, potential yield losses to weeds exceed those to insects or pathogens (≈34% vs. 16% and 14%, respectively; Oerke Reference Oerke2006), and roughly 100 to 200 species drive most economic damage (Scavo and Mauromicale Reference Scavo and Mauromicale2020).
In annual staple crops (e.g., rice [Oryza sativa L.], maize [Zea mays L.], soybean [Glycine max (L.) Merr.]), weed management has traditionally emphasized the complete elimination of all non-crop vegetation to reduce competition for nutrients, water, and light (Dass et al. Reference Dass, Shekhawat, Choudhary, Sepat, Rathore, Mahajan and Chauhan2017). In perennial fruit systems, however, the orchard floor can be managed as living ground cover to suppress undesirable species, limit erosion, and enhance soil structure and biodiversity (Kraehmer and Baur Reference Kraehmer and Baur2013; Scavo and Mauromicale Reference Scavo and Mauromicale2020). Field experiments show that cover crops can suppress target weeds and build fertility when residues are returned to the soil (Tursun et al. Reference Tursun, Işık, Demir and Jabran2018). Integrated tactics such as mowing, shallow tillage, selective herbicide bands, mulches, and seasonal covers are increasingly important as herbicide-resistant populations spread and sustainability expectations rise (Atucha et al. Reference Atucha, Merwin and Brown2011; Gage et al. Reference Gage, Krausz and Walters2019; Haring and Hanson Reference Haring and Hanson2022; Moretti Reference Moretti2022).
Jackfruit (Artocarpus heterophyllus Lam.) is expanding in the Mekong Delta as smallholders pivot from low-margin annuals to high-value fruit. At the national scale, fruit–vegetable exports set a record in 2023 (∼US$5.6 billion), with jackfruit contributing ∼US$168 million; momentum continued in 2024 and into 2025 as market access deepened, led by China while diversifying to other destinations (Viet Nam News 2024). In Vinh Long Province, the Delta’s second-largest perennial crop area, the fruit tree footprint reached 60,845 ha in 2024 (+ ∼1,600 ha year-on-year) per provincial statistics, reflecting sustained conversion from low-return land uses (Vinh Long People’s Committee 2023). Provincial planning through 2030 explicitly lists jackfruit among prioritized “potential” fruit crops, signaling its importance in household income strategies and export compliance (planting area and packing codes). Farm-level economics underscore the stakes: case reports document annual gross income on the order of US$0.5 billion from mature orchards when markets are favorable and husbandry is adequate (Hanoi Times Reference Times2024). These market opportunities, coupled with tightening phytosanitary expectations in key destinations, heighten the need for robust, locally adapted weed management to stabilize yield and quality (Viet Nam News 2025).
Designing integrated weed management (IWM) for jackfruit orchards requires a quantitative baseline of local weed communities as species present, their frequency and abundance, and how composition varies with establishment history, canopy development, water regime, and understory practices (e.g., mowing, selective herbicide bands, cover crops). Dominant and management-relevant species suspected in Vinh Long include Mexican primrose-willow [Ludwigia octovalvis (Jacq.) P.H. Raven], billygoat-weed [Ageratum conyzoides L.], carpet grass [Axonopus compressus (Sw.) P. Beauv.], five-angled fimbristylis [Fimbristylis quinquangularis (Vahl) Kunth], shiny bush [Peperomia pellucida (L.) Kunth], and centella [Centella asiatica (L.) Urb.], alongside weedy rice [Oryza sativa f. spontanea]. Yet the degree to which these taxa dominate across agroecological regions and the magnitude of between-region similarity remains unclear.
Accordingly, this study surveys weed floras across jackfruit orchards in Vinh Long using replicated quadrats; quantifies α-diversity via Margalef’s richness (DMg), Shannon’s H′, Pielou’s evenness (J′), and Simpson’s λ; compares communities using Jaccard, Sørensen, and Steinhaus (quantitative Bray-Curtis) similarity; and uses ordination to visualize species clustering and ecological gradients. Abundance and cover-based metrics are synthesized into dominance and importance indices to identify high-priority weeds for IWM. We hypothesized (1) a predictable core of dominant species shared among regions, (2) high between-region similarity due to common environmental and management filters, and (3) species segregation along a principal gradient related to relative density and cover.
Materials and Methods
Study Area and Sampling Frame
We surveyed weed communities in jackfruit orchards across Vinh Long Province, Viet Nam (Mekong Delta) during the 2024 rainy season (April 4 to May 12, 2024). A total of 120 orchards grouped into 62 sampling blocks were selected from 13 communes, each corresponding to one of the province’s major jackfruit-producing agroecosystems. These subregions and their two-letter abbreviations are: Tan Quoi (TQ), Tan Luoc (TL), My Thuan (MT), Hoa Hiep (HH), Dong Thanh (DT), Binh Minh (BM), Cai Von (CV), Tam Binh (TB), Ngai Tu (NT), Song Phu (SP), Hau Loc (HL), Tra On (TO), and Tra Con (TC). Each orchard had an area ≥5,000 m2 and was under typical smallholder management.
Block centroids were georeferenced in WGS84 (EPSG:4326) using GPS-enabled smartphones and verified using Google Maps, with horizontal accuracy typically within a few meters. All coordinates were quality checked against satellite basemaps before analysis. Geographic coordinates (in DMS format) for each of the 62 sampling blocks are provided in Table 1. Where field access required adjacent blocks to share a centroid, this is noted in the table.
Geographic (GPS) coordinates of surveyed agricultural ecosystems (latitude, longitude)a

a Coordinates are reported as latitude–longitude in degrees–minutes–seconds (DMS; e.g., 10°01′01.7″N, 105°52′45.4″E) referenced to the WGS84 geodetic datum (EPSG:4326). Field positions were recorded at the time of sampling using a handheld GPS/GNSS receiver or equivalent device; device-reported horizontal accuracy was typically within a few meters. Coordinates were quality checked against satellite basemaps before analysis. Duplicate coordinates indicate adjacent blocks sharing a centroid due to field access constraints.
Field Survey Design
Within each sampling block, we established five 1 m by 1 m quadrats placed along a 50- to 100-m transect at 10- to 20-m intervals (systematic random start), avoiding tree trunks and obvious disturbance patches. In each quadrat, we recorded individual counts (plants m−2), presence/absence, and visual cover for every weed species. Fresh biomass was harvested when required for biomass metrics and transported in paper bags to the field lab the same day.
Taxonomy and Nomenclature
Species were identified from fresh material using regional floras and weed manuals (Hoang et al., Reference Hoang, Ho, Do, Tran, Nguyen, Ha, Vu, Nguyen and Nguyen2022), with names standardized to Angiosperm Phylogeny Group IV (APG IV) families and cross-checked against World Flora Online/Plant Names Index (WFO/IPNI); scientific names are italicized and authorities given at first mention.
Symbols and Indices (Notation)
i, sampling block; j, quadrat (1 m × 1 m; five per block); k, species; n, number of blocks; S, species richness; N, total individuals
Ai, sampled area in block i (= 5 m2)
Xkij, count of species k in quadrat j of block i (plants m−2)
Yki ∈ {0,1}, presence/absence of species k in block i
Zkij ∈ {0,1}, presence/absence of species k in quadrat j of block i
Semiquantitative field classes “−/+/++/+++” were coded 0/1/2/3 for quantitative analyses.
Abundance, Frequency, and Cover Metrics
We quantified the biological characteristics of weed communities in jackfruit orchards following established weed ecology protocols (Nkoa et al., Reference Nkoa, Owen and Swanton2015; Travlos et al., Reference Travlos, Cheimona, Roussis and Bilalis2018; Ho et al., Reference Ho, Nguyen, Luong, Nguyen and Tran2025), including field density (D), mean field density (MFD), mean occurrence field density (MOFD), frequency (F), field uniformity (FU), relative frequency (RF), relative field uniformity (RFU), relative mean field density (RMFD), percent cover (CR), multiplied dominance ratio (MDR), fresh and dry biomass (FW, DW) and their relative forms (RFW, RDW), and composite indices-relative abundance (RA), dominance value index (DVI), and importance value (IV). Definitions and formulae are provided here.
Field density (D) in block i (plants m−2):
 $${{\rm D}_{ki}} = {{\sum\nolimits_{i = 0}^5 X ij} \over {Ai}}$$
Mean field density (MFD) across blocks (plants m−2):
 $${\rm{MF}}{{\rm{D}}_k} = {{\sum\nolimits_{i = 0}^n {\rm{D}} ki} \over n}$$
Mean occurrence field density (MOFD) conditional on occurrence (plants m−2):
 $${\rm{MOF}}{{\rm{D}}_k} = {{\sum\nolimits_{i = 0}^n {\rm{D}} ki} \over {n - a}}$$
Frequency (F, %) across blocks:
 $${{\rm F}_k} = \left( {{{\sum\nolimits_{i = 0}^n Y i} \over n}} \right)\; \times \;100$$
Field uniformity (FU, %) across quadrats:
 $${\rm{F}}{{\rm{U}}_k} = \left( {{{\sum\nolimits_{i = 0}^n {\sum\nolimits_{j = 0}^5 X } ij} \over {n\; \times \;5}}} \right)\; \times \;100$$
Relative frequency (RF, %):
 $${\rm{R}}{{\rm{F}}_k} = \left( {{{{\rm{F}}_k} \over {\sum F }}} \right)\; \times \;100$$
Relative field uniformity (RFU, %):
 $${\rm{RF}}{{\rm{U}}_k} = \left( {{{{\rm{FU}}_k} \over {\sum F U}}} \right)\; \times \;100$$
Relative mean field density (RMFD, %):
 $${\rm{RMF}}{{\rm{D}}_k} = \left( {{{{\rm{MFD}}_k} \over {\sum {{\rm{MFD}}} }}} \right) \times \;100$$
For visual cover (CR, m2 m−2), we estimated cover (CR, %) per square as the expected area of species k divided by 1 m2, averaged by block and then by province; where nk denotes the total individuals of species k and sk denotes the total shoots of species k. We summarized an integrated representation of the tree canopy:
 $$CR_k(\%)= {{n_k \times s_k} \over {\sum_{t=1}^{S}(n_t \times s_t)}} \times 100$$
The multiplied dominance ratio (MDR, cm2 m2 m−2), as
 $${MDR}_k ({cm}^2\, {m}^2\, {m}^{-2})= {coverage} ({m}^2\, {m}^{-2})\times {height} ({cm})$$
Fresh and dry biomass were summarized as fresh weight (FW, g m−2)
 $${\rm{F}}{{\rm{W}}_k}\left( {{\rm{g }}\;{{\rm{m}}^{ - 2}}} \right) = {\rm{MFD}}^*{\rm{F}}{{\rm{W}}_k}$$
Relative fresh weight (RFW, %)
 $${\rm{RF}}{{\rm{W}}_k} = \left( {{{{\rm{FR}}_k} \over {{\rm{FR}}}}} \right) \times \;100$$
Relative dry weight (RDW, %)
 $${\rm{RD}}{{\rm{W}}_k} = \left( {{{{\rm{DR}}_k} \over {{\rm{DR}}}}} \right) \times \;100$$
Composite indices followed the agronomic literature:
Relative abundance (RA, %)
 $${\rm{R}}{{\rm{A}}_k} = {\rm{R}}{{\rm{F}}_k} + {\rm{RF}}{{\rm{U}}_k} + {\rm{RMF}}{{\rm{D}}_k}$$
Dominance value index (DVI, %)
 $${\rm{DV}}{{\rm{I}}_k} = \left( {{\rm{RMF}}{{\rm{D}}_k} + {\rm{R}}{{\rm{F}}_k}} \right) \div 2$$
Importance value (IV, %)
 $${\rm{I}}{{\rm{V}}_k} = {\rm{RMF}}{{\rm{D}}_k} + {\rm{R}}{{\rm{F}}_k} + {\rm{RD}}{{\rm{W}}_k}$$
(When semiquantitative field classes were recorded as −, +, ++, +++, these were coded 0, 1, 2, 3 for quantitative analyses.)
Alpha Diversity (within Community)
From block-level abundance we computed:
Margalef’s richness (DMg):
 $${\rm{DMg}} = \left( {S - 1} \right) \div {\rm l}{\rm{n}}N$$
Shannon-Wiener H′:
 $$H' = -\sum_{k=1}^{S} p_k \ln(p_k)$$
 $$H'_{\max} = -\sum_{k=1}^{S} p_k \ln(p_k) = \ln S$$
Pielou’s evenness (J′):
 $${\rm{J'}} = \;{{H'} \over {{{H'}_{\max }}}} = \;{{H'} \over {{\rm{ln\;S}}}}$$
Simpson’s dominance (λ):
 $${\rm \lambda }= \mathop \sum \limits_{k = 1}^n \left( {{\rm{pk}}} \right)^2$$
Where pk is the proportion of individuals belonging to species k relative to the total number of individuals in the sample.
Beta Diversity (between-Community Similarity)
Among agroecological regions we calculated:
Jaccard similarity (J) on presence/absence:
 $${{\rm S}_j} = {a \over {a + b + c}}$$
Sørensen similarity (Sø) on presence/absence:
 $${{\rm S}_s} = {{2a} \over {2a + b + c}}$$
Steinhaus (quantitative Bray-Curtis) similarity (SA) on semiquantitative or abundance data:
 $${{\rm S_A}} = {{2W} \over {A + B}}$$
Statistical Analysis
All analyses were conducted in R v. 4.4.1 (R Core Team 2024). Community indices and dissimilarities were computed with the vegan package (Oksanen et al. Reference Oksanen, Simpson, Blanchet, Kindt, Legendre, Minchin, O’Hara, Solymos, Stevens, Szoecs, Wagner, Barbour, Bedward, Bolker and Borcard2024). Presence/absence similarity used Jaccard (Reference Jaccard1901) and Sørensen (Reference Sørensen1948) indices; quantitative similarity used Bray-Curtis, equivalent to the Steinhaus coefficient (Bray and Curtis Reference Bray and Curtis1957). Before ordination, species abundance matrices were Hellinger-transformed when appropriate to respect Euclidean metrics (Legendre and Gallagher Reference Legendre and Gallagher2001) and summarized by principal component analysis (PCA) in vegan. Alpha-diversity metrics included Margalef’s richness (Margalef Reference Margalef1958), Shannon’s entropy (Shannon Reference Shannon1948), Pielou’s evenness (Pielou Reference Pielou1966), and Simpson’s dominance (Simpson Reference Simpson1949). Group differences in diversity metrics were tested by one-way ANOVA; normality and homogeneity of variance were assessed by Shapiro-Wilk and Levene’s tests, respectively (Levene Reference Levene, Olkin, Ghurye, Hoeffding, Madow and Mann1960; Shapiro and Wilk Reference Shapiro and Wilk1965). Post hoc comparisons used Tukey’s honestly significant difference (HSD) adjusted for unequal sample sizes (Kramer Reference Kramer1956) as implemented in agricolae (de Mendiburu Reference de Mendiburu2021). Figures were produced in R (base/ggplot2; Wickham Reference Wickham2016).
Data Quality and Reproducibility
GPS coordinates (Table 1) were validated visually; taxonomy was checked against WFO/IPNI; all formulae and code used to generate tables and figures will be archived with the article (data and R scripts). Raw quadrat sheets recorded date, block, orchard ID, quadrat position, and observer initials; 10% of entries were rechecked by a second observer.
Results and Discussion
Floristic Composition across Jackfruit Orchards
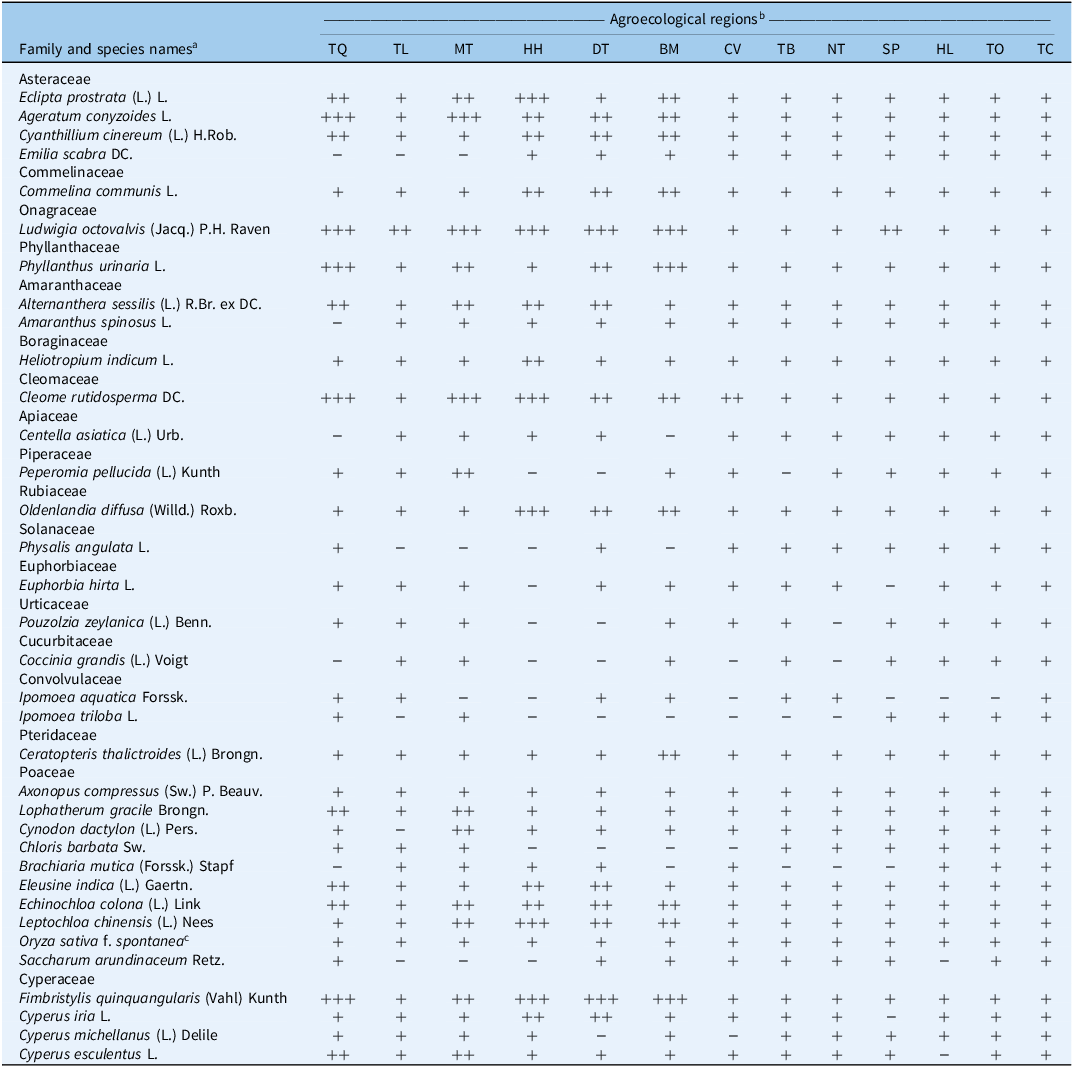
Across 62 sampling blocks (five 1 m by 1 m quadrats per block), we recorded 35 species in 18 families, dominated by Poaceae (10 species, 28.6%), followed by Asteraceae (4 species, 11.4%) and Cyperaceae (4 species, 11.4%) (Table 2). At the subregional scale, TQ, MT, HH, DT, and BM shared a core of frequent species including A. conyzoides, L. octovalvis, chamberbitter (Phyllanthus urinaria L.), fringed spiderflower (Cleome rutidosperma DC.), and F. quinquangularis. HH was a hotspot for Chinese sprangletop [Leptochloa chinensis (L.) Nees], L. octovalvis, and F. quinquangularis, whereas DT and BM were characterized mainly by L. octovalvis and F. quinquangularis. By contrast, TL, CV, and SP had broader species lists but lower encounter frequencies, and TB, NT, HL, TO, and TC showed high richness with no single dominant species, consistent with communities that are already established and patchy. The predominance of grasses in these jackfruit systems is broadly consistent with perennial orchard surveys in East Asia (Asteraceae and Poaceae dominate orchards of peach [Prunus persica (L.) Batsch], pear (Pyrus communis L.), grape (Vitis vinifera L.), and apple (Malus pumila Mill.) in Korea; Lee et al. Reference Lee, Park, Kim, Oh, Kang, Park, Cho, Moon, Kwon, Kim, Lim, Park, Song, Seong and Im2007). However, the relatively higher share of Poaceae observed here likely reflects a legacy of orchard conversion from rice and sweetpotato [Ipomoea batatas (L.) Lam.] land and repeated soil disturbance or herbicide use, which tend to favor annuals over perennials (Licznar-Malańczuk and Sygutowska Reference Licznar-Malańczuk and Sygutowska2016; Lisek and Sas-Paszt Reference Lisek and Sas-Paszt2015). This pattern is consistent with findings from a regional orchard survey in the same province, where jackfruit orchards averaged 5.7 yr of age (n = 59), indicating an early- to mid-successional stage (Thi et al. Reference Thi, Vu and Huy2025). Such developmental status plausibly explains the prevalence of annual species such as L. octovalvis, A. conyzoides, and C. rutidosperma, which are typically favored under dynamic or recently converted systems.
Although orchard age was not directly measured in our dataset, the observed weed composition—characterized by a strong Poaceae signature and dominance of fast-growing ruderal species—likely reflects historical land-use legacy and ongoing soil disturbance associated with orchard management. These factors, together with orchard age, may shape the current floristic assembly. This interpretation is consistent with previous findings that tillage and mowing can substitute for broadcast herbicides, potentially enhancing weed control and soil quality through increased populations of phosphate-solubilizing bacteria and arbuscular mycorrhizal propagules (Granatstein et al. Reference Granatstein, Andrews and Groff2014; Yang et al. Reference Yang, Wang, Tang and Chen2007). In addition, cover crop use has been recommended to manage orchard weeds effectively (Tokasi et al., Reference Tokasi, Mohasel, Moghadam, Mahalati, Zade and Monfared2009).
Classification of weeds and their frequency of occurrence among agricultural ecosystems of jackfruit orchards in Vinh Long Province, Vietnam

a Families follow APG IV; names italicized; author abbreviations per IPNI/WFO.
b Agroecological regions: TQ, Tan Quoi; TL, Tan Luoc; MT, My Thuan; HH, Hoa Hiep; DT, Dong Thanh; BM, Binh Minh; CV, Cai Von; TB, Tam Binh; NT, Ngai Tu; SP, Song Phu; HL, Hau Loc; TO, Tra On; TC, Tra Con.; blocks/coordinates in Table 1. Frequency of occurrence: – (not recorded), + (≤20%), ++ (21%–50%), +++ (>50%). Data from 1 m × 1 m quadrats (5 per block), presence/absence at survey.
c Oryza sativa f. spontanea = weedy rice.
Density and Occurrence Metrics (Linking Abundance and Spread)
Absolute density (D, plants m−2, Equation 1) highlighted C. rutidosperma, P. urinaria, A. conyzoides, F. quinquangularis, and L. octovalvis (≈133 to 195 plants m−2) as numerically dominant, followed by red spinach [Alternanthera sessilis (L.) R.Br. ex DC.] (≈100), junglerice [Echinochloa colona (L.) Link] (≈87), and L. chinensis (≈65) (Figure 1A). Mean field density (MFD, Equation 2) ranked L. octovalvis (11.19), F. quinquangularis (9.31), A. conyzoides (8.83), P. urinaria (7.73), and C. rutidosperma (7.69) as the principal competitors at the province scale (Figure 1B). When conditioning on presence (MOFD, Equation 3), shade-/moisture-preferring herbs (P. pellucida, C. asiatica, Ceylon pouzolzia [Pouzolzia zeylanica (L.) Benn.]) became top ranked (Figure 1C), implying that they can dominate locally under closed canopies or wetter microsites. Relative MFD (RMFD, Equation 8) confirmed L. octovalvis, F. quinquangularis, and A. conyzoides as core species at the provincial scale (Figure 1D).
Density characteristics of weeds in jackfruit orchards in Vinh Long Province, Vietnam: (A) density (D, plants m−2); (B) mean field density (MFD, plants m−2); (C) mean occurrence field density (MOFD, plants m−2); and (D) relative mean field density (RMFD, %). Bars show mean ± SE; species are ordered by increasing value within each panel.

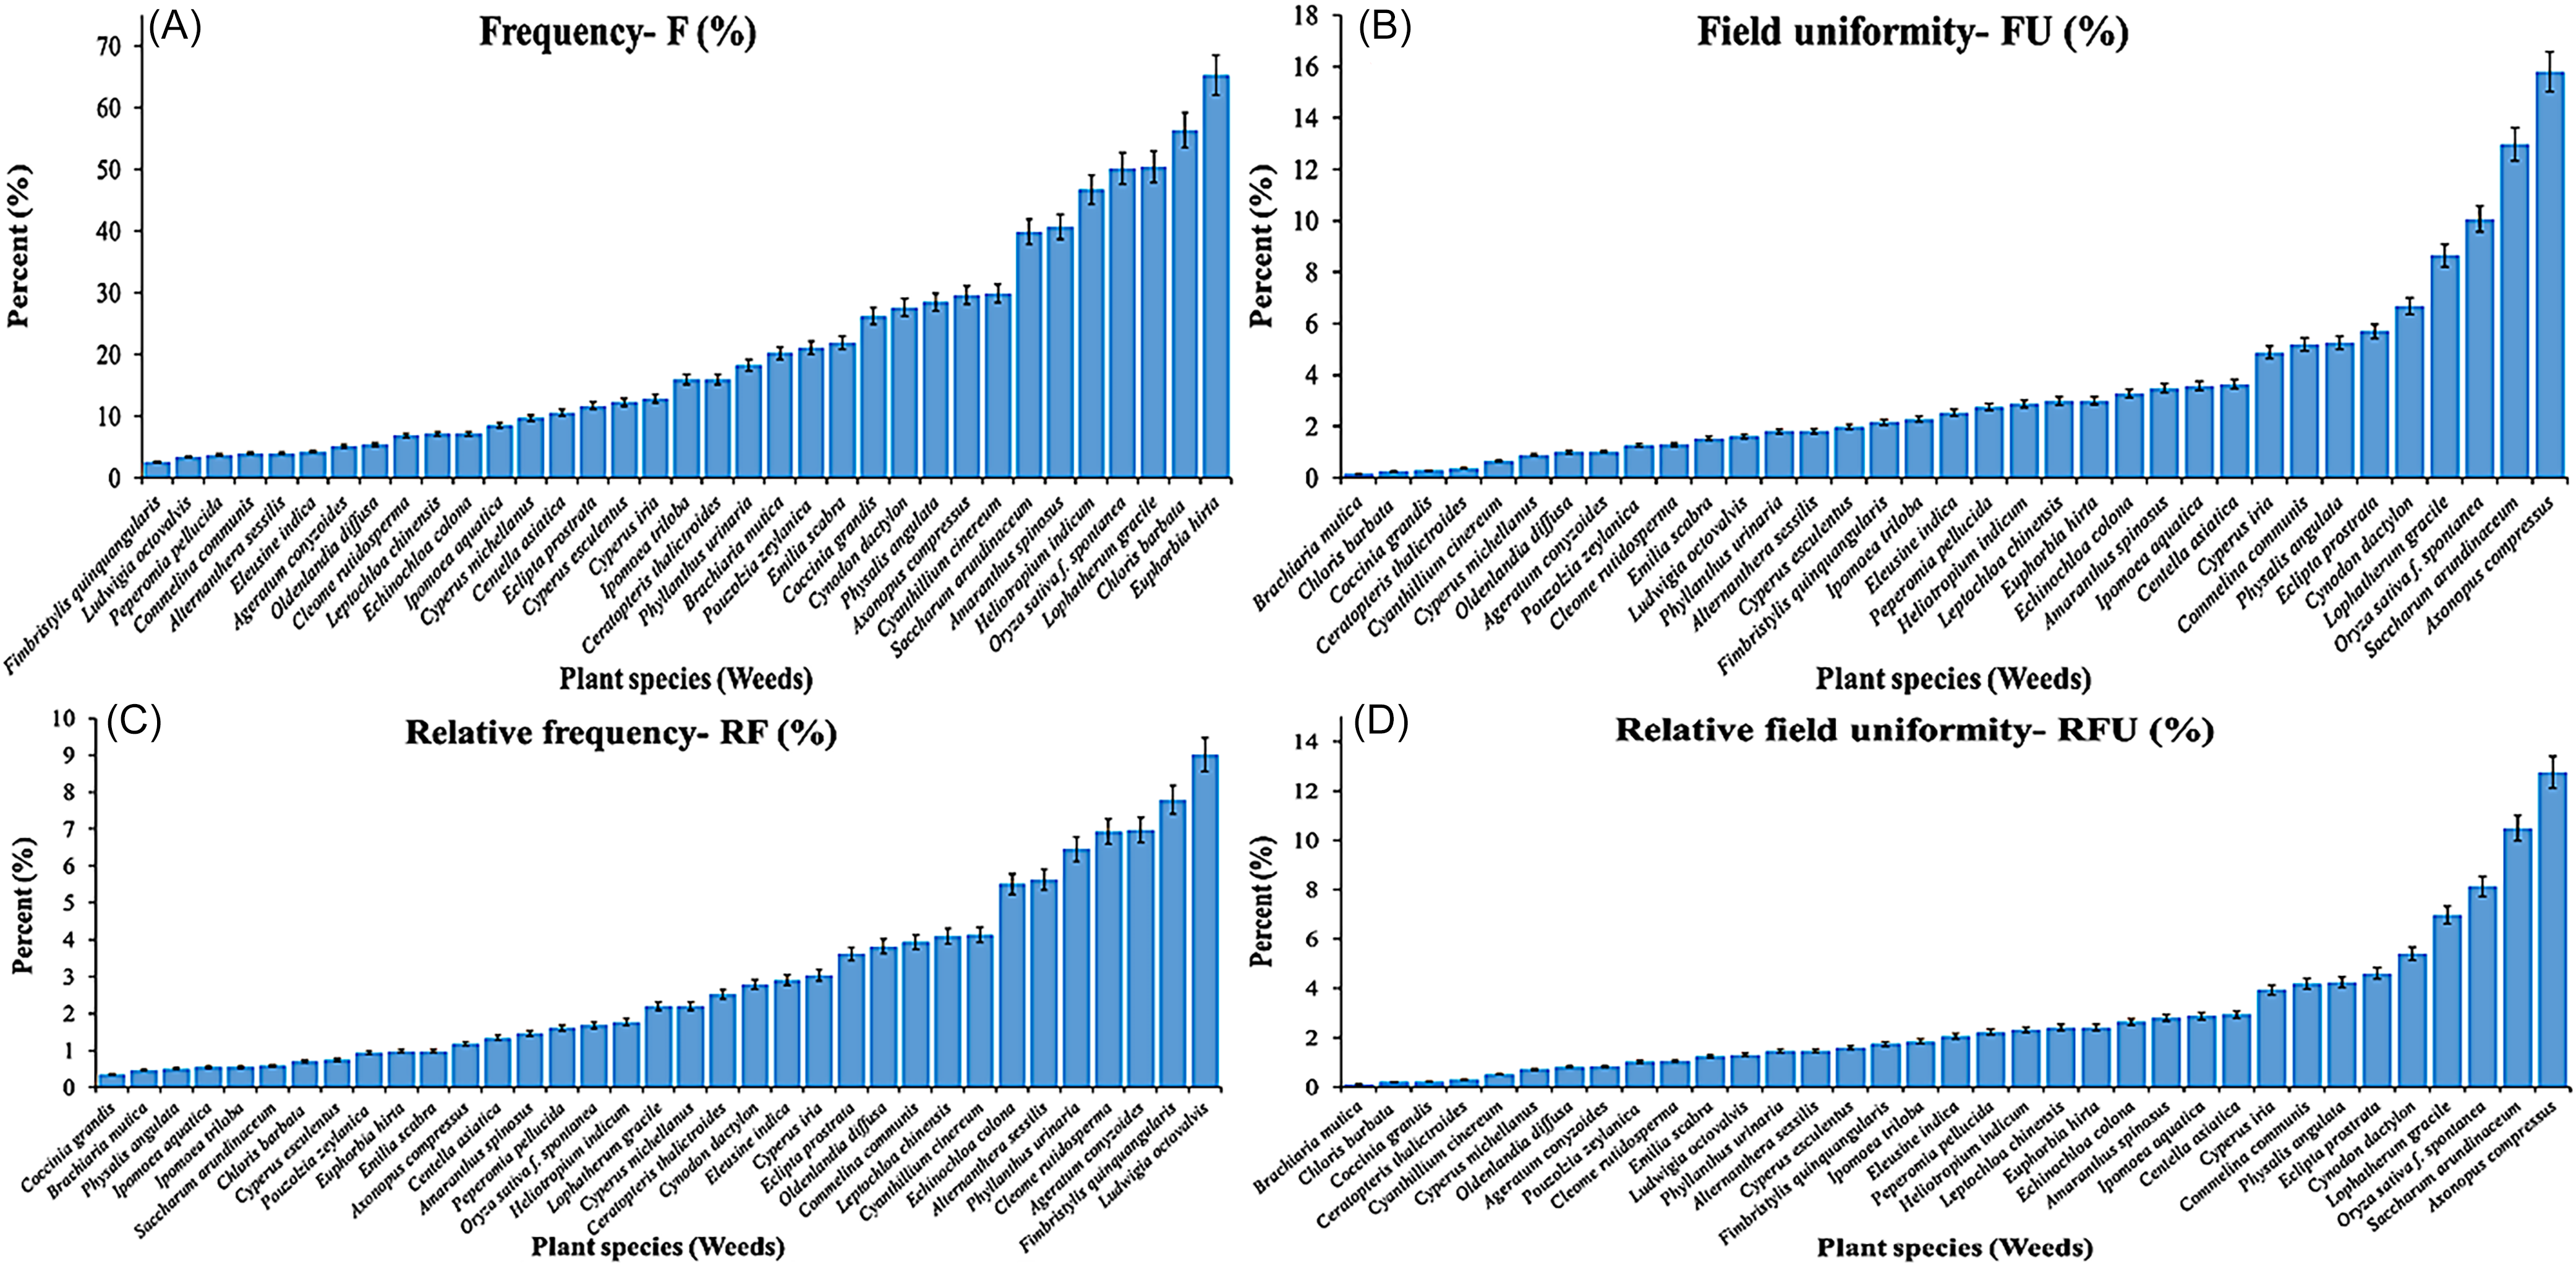
Frequency Structure and Spatial Uniformity
Species-level frequency (F, Equation 4) showed a broad but uneven community. High-F taxa included asthma-plant (Euphorbia hirta L.) (65.2%), swollen fingergrass (Chloris barbata Sw.) (56.4%), slender lophatherum (Lophatherum gracile Brongn.) (50.4%), weedy rice (50.1%), Indian heliotrope (Heliotropium indicum L.) (46.7%), and spiny amaranth (Amaranthus spinosus L.) (40.7%) (Figure 2A). Field uniformity (FU, Equation 5), which indicated the fraction of orchards where a species occurs, was greatest for A. compressus (15.8%), wild sugarcane (Saccharum arundinaceum Retz.) (13.0%), weedy rice (10.1%), and L. gracile (8.7%) (Figure 2B), indicating widespread, consistent distribution requiring area-wide measures rather than spot interventions. Relative frequency metrics (RF, RFU, Equations 6 and 7) underscored the high evenness of the flora: even L. octovalvis, the top RF species, represented only ≈9% of total RF (Figure 2C and 2D). The occurrence of weedy rice in jackfruit orchards is plausible ecologically, because its diaspores move via irrigation networks, machinery, and contaminated seed, allowing establishment outside paddies, especially along wet margins (Chauhan and Johnson Reference Chauhan and Johnson2010; Sudianto et al., Reference Sudianto, Song, Neik, Saldain, Scott and Burgos2013; Ziska et al., Reference Ziska, Gealy, Burgos, Caicedo, Gressel, Lawton-Rauh, Avila, Theisen, Norsworthy, Ferrero, Vidotto, Johnson, Ferreira, Marchesan and Menezes2015).
Frequency of occurrence of weeds in jackfruit orchards in Vinh Long Province, Vietnam: (A) frequency (F, %); (B) field uniformity (FU, %); (C) relative frequency (RF, %); and (D) relative field uniformity (RFU, %). Bars show mean ± SE; species ordered within each panel.

Cover and Competitive Architecture
Projected ground cover (CR, Equation 9) ranked L. octovalvis highest (≈19.2%), ahead of A. conyzoides (≈10.0%) and C. barbata (≈8.9%) (Figure 3, left). Weedy rice had low cover (≈1.6%) despite moderate frequency/density, illustrating that occurrence and shading impact are decoupled. The multiplied dominance ratio (MDR, Equation 10), a canopy-volume proxy (cm2 m−2), revealed a stratified light-competition structure: L. octovalvis (≈50.7) set the main shading layer; C. barbata, A. conyzoides, and little ironweed [Cyanthillium cinereum (L.) H.Rob.] formed a secondary canopy (≈10 to 14), while weedy rice exhibited low MDR (≈3.1), suggesting reliance on belowground resource capture or rapid vertical escape rather than lateral shading (Figure 3, right).
Weed cover (%) and multiplied dominance ratio (MDR) across jackfruit orchards in Vinh Long Province, Vietnam: left, coverage (CR, %); and right, multiplied dominance ratio (MDR, cm2 m−2). Bars show mean ± SE; species ordered in descending value within each panel.

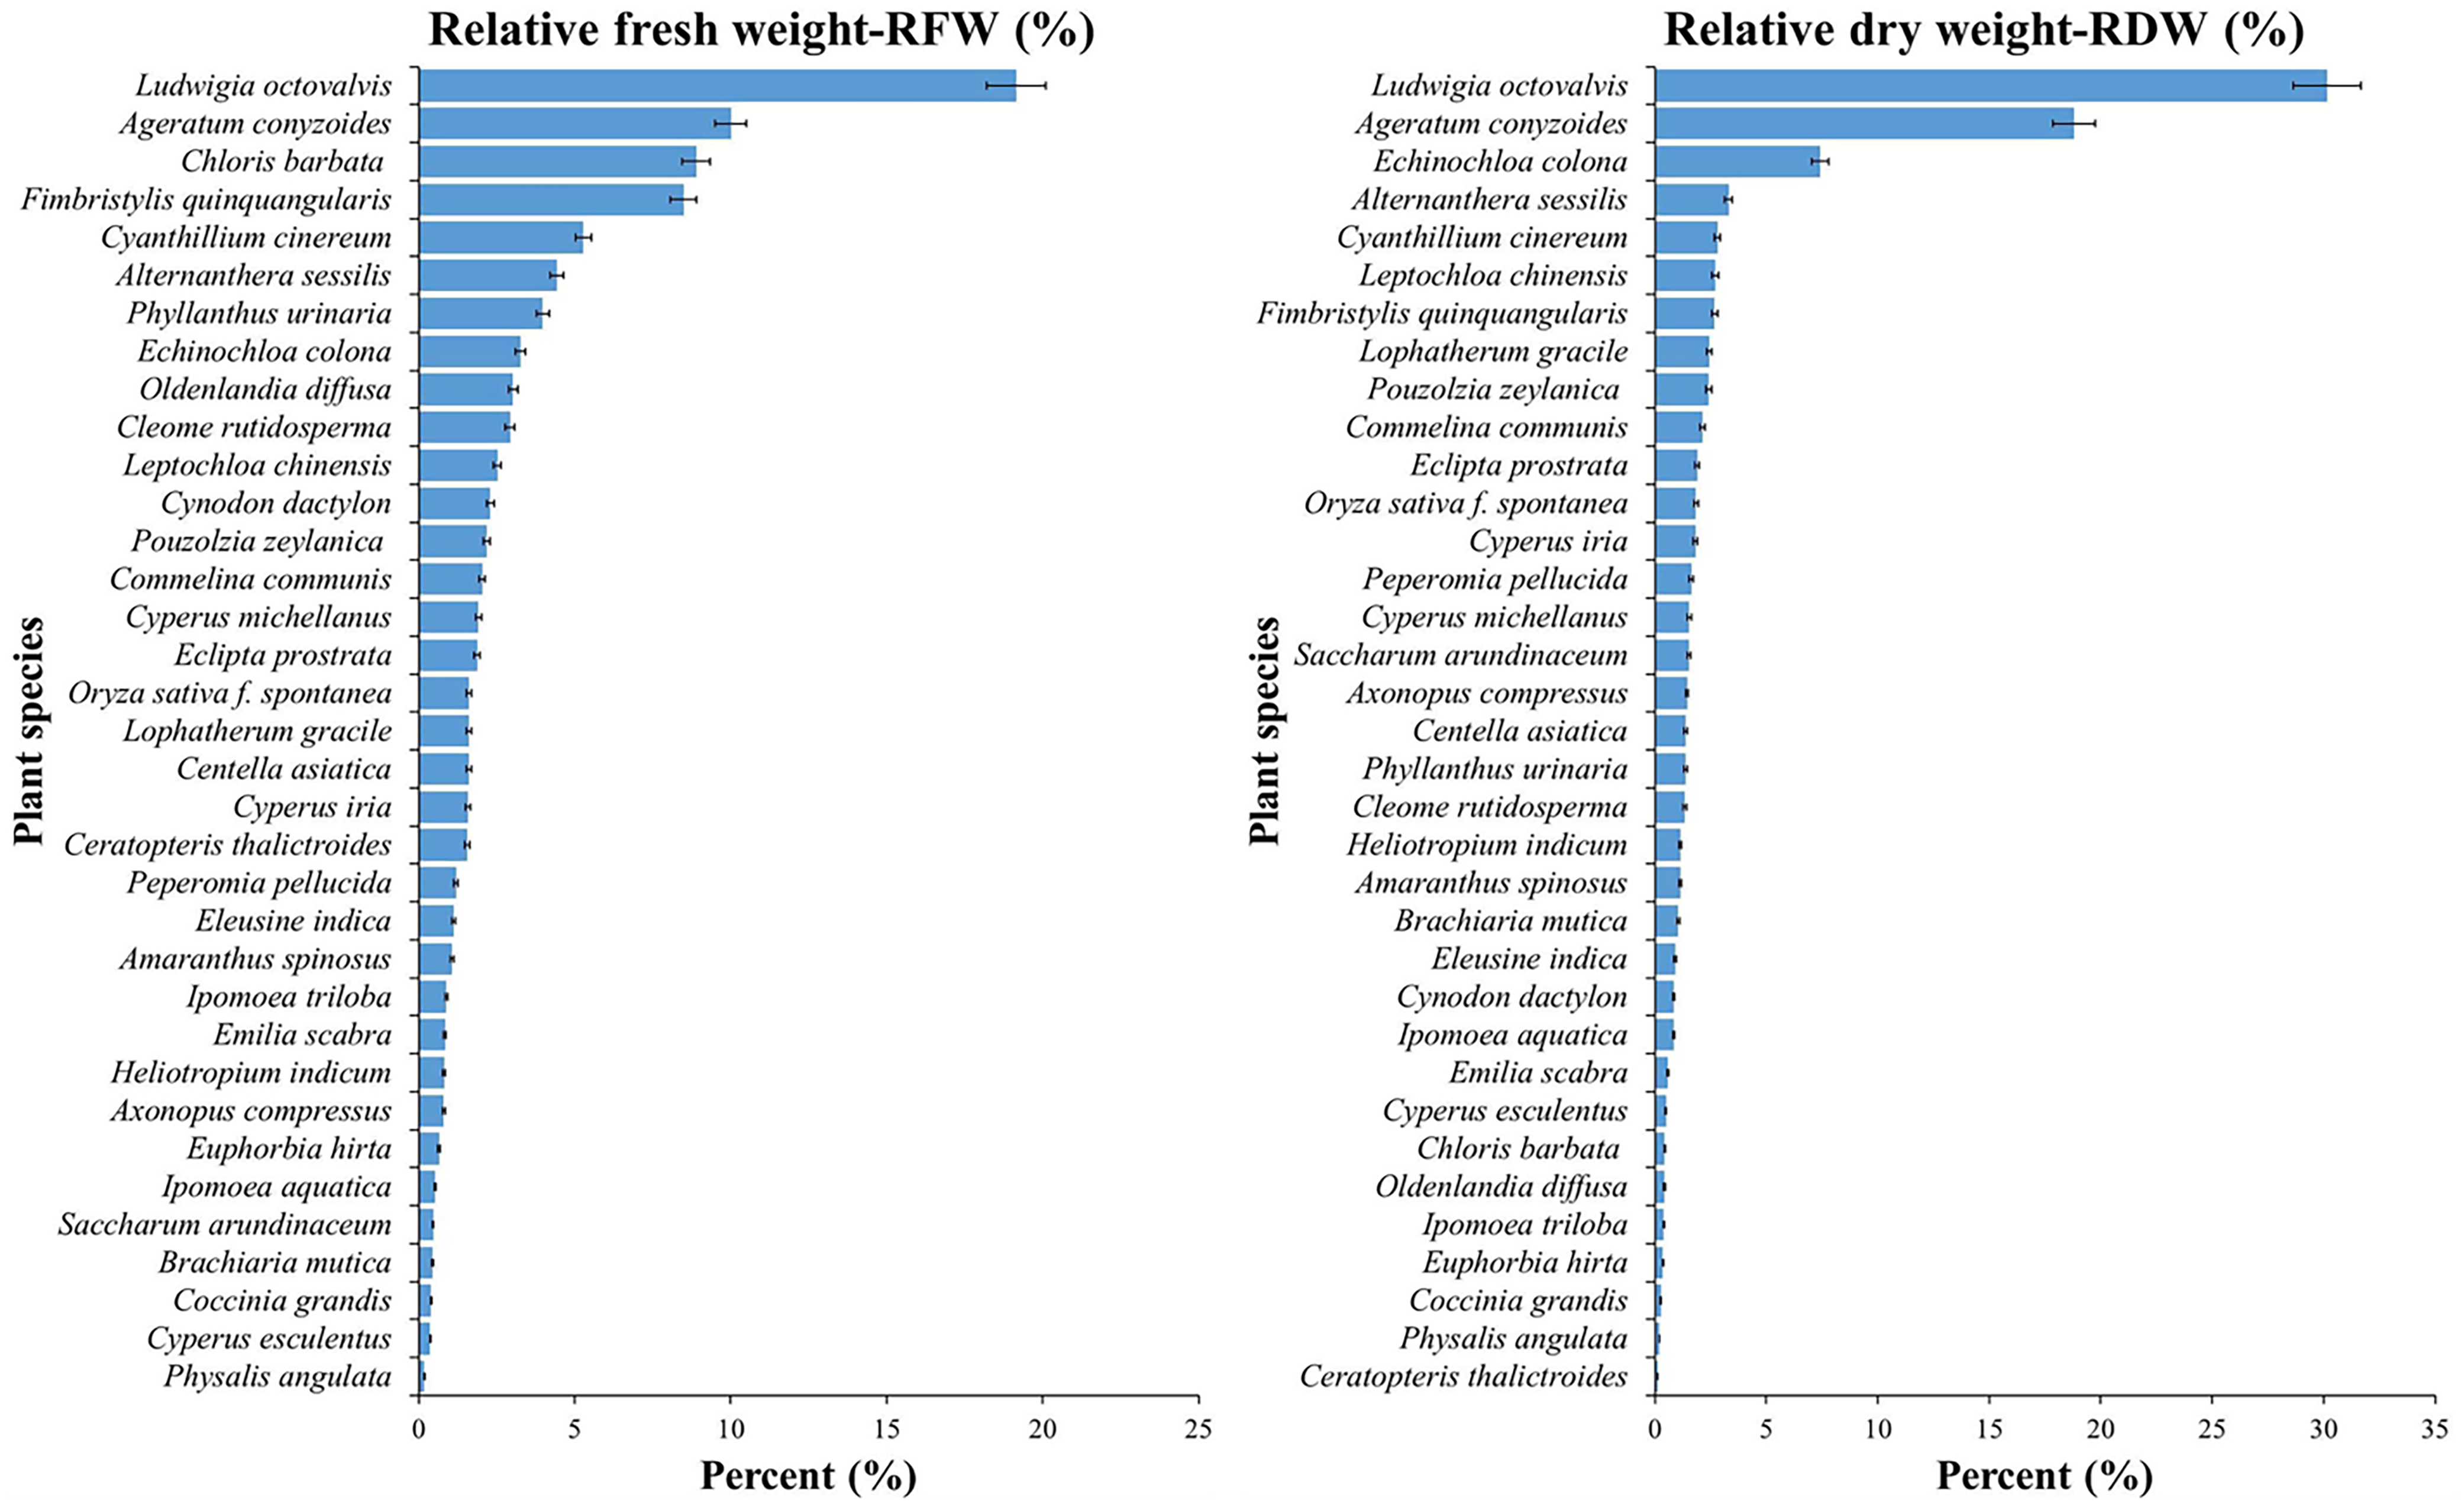
Biomass Allocation Signals
Analysis of relative fresh weight (RFW, Equation 12) and relative dry weight (RDW, Equation 13) further differentiated weed growth strategies (Figure 4). Ludwigia octovalvis paired high CR/MDR with high RFW (≈30%), whereas C. barbata contributed little fresh mass (≈0.4%) but disproportionate RDW (≈8.9%), indicating efficient dry-matter accumulation under orchard conditions. Fresh weight per area (FW, Equation 11) followed the same ordering as density where available.
Relative fresh and dry biomass (%) of weed species per square meter in jackfruit orchards, Vinh Long Province, Vietnam: left, relative fresh weight (RFW, %); and right, relative dry weight (RDW, %). Bars show mean ± SE; species ordered in descending value within each panel.

Composite Importance Metrics for Management Targeting
Integration of frequency, density, and cover (Figure 5) identified L. octovalvis (RA ≈ 21%; IV ≈ 19.7), F. quinquangularis (RA ≈ 18.4%; IV ≈ 16.7), and A. conyzoides (RA ≈ 16.2%; IV ≈ 15.4) as primary management targets. Here, RA (Equation 14), DVI (Equation 15), and IV (Equation 16) converged on the same suite of dominants. Despite noticeable abundance (RA ≈ 11%), weedy rice showed very low canopy-based indices (DVI ≈ 1.4; IV ≈ 2.8), implying agronomic risk without ecological dominance, and control tactics should therefore focus on seed-source sanitation and phenology-timed measures rather than shading competition.
Relative abundance, dominance value, and importance value of weed species in jackfruit orchards in Vinh Long Province, Vietnam: (A) relative abundance (RA, %); (B) dominance value index (DVI, %); and (C) importance value (IV, %). Bars are mean ± SE; species ordered in descending value in each panel.

Community Diversity and between-Region Similarity
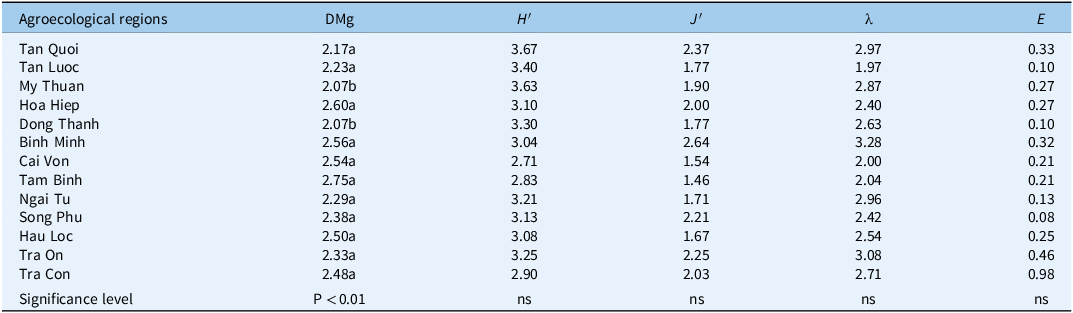
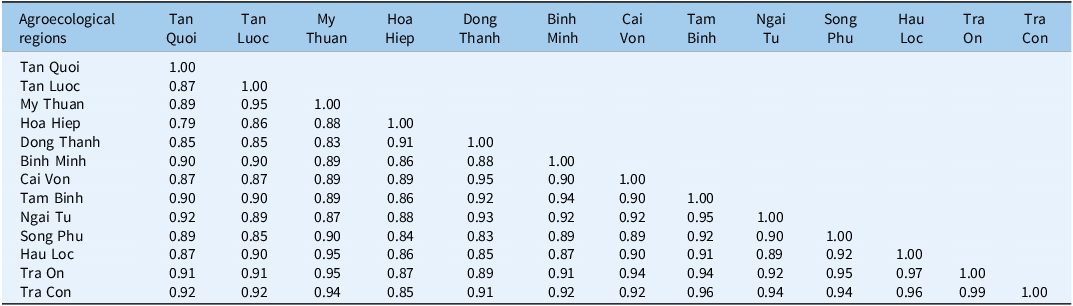
Alpha diversity differed significantly for Margalef’s richness (DMg, Equation 17 ≈ 2.07 to 2.75; P < 0.01), whereas H′ (Equation 18), J′ (Equation 20), λ (Equation 21), and E varied numerically but not statistically among regions (Table 3). Beta diversity showed high between-region similarity: pairwise Jaccard coefficients J (Equation 22) mostly >0.75 (up to 0.97 for TC–TO), Sørensen Sø (Equation 23) >0.79 (up to 0.99 for TC–TO), and Steinhaus (quantitative Bray-Curtis) commonly ≥0.90 (Tables 4–6). These concordant metrics indicate a province-wide, shared weed pool, favoring unified IWM recommendations with local fine-tuning rather than entirely bespoke programs.
Biodiversity indicators among agricultural ecosystems of jackfruit orchards in Vinh Long Province, Vietnam

DMg, Margalef’s richness; H′, Shannon–Wiener diversity (natural-log base); J′, Pielou’s evenness; λ, Simpson’s diversity; E, evenness (0–1). Indices are unitless and computed from species data pooled by agroecological region. Within a column, values sharing a letter are not significantly different; different letters differ at α = 0.01 (one-way ANOVA, Tukey’s honestly significant difference [HSD]). ns = not significant.
Similarity of weed species based on the Jaccard’s index among agricultural ecosystems of jackfruit orchards in Vinh Long Province, Vietnama

a Entries are pairwise Jaccard similarity coefficients (J) among agroecological regions, computed from presence/absence data pooled across blocks (quadrat 1 m × 1 m; 5 quadrats per block). Formula: J = a/(a + b + c), where a = shared species, b and c = species unique to each region. Range 0–1 (higher = more similar). Diagonal = 1.00; blank cells are the symmetric upper triangle. Values rounded to two decimals.
Similarity of weed species based on the Sørensen’s index among agricultural ecosystems of jackfruit orchards in Vinh Long Province, Vietnama

a Entries are pairwise Sørensen (Dice) similarity coefficients among agroecological regions, computed from presence/absence data pooled across blocks (quadrat 1 m × 1 m; 5 quadrats per block). Formula: S = 2a/(2a + b + c), where a = shared species, and b and c = species unique to each region. Range 0–1 (higher = more similar). Diagonal = 1.00; blank cells are the symmetric upper triangle. Values rounded to two decimals.
Similarity of weed species based on the Steinhaus coefficient (SA) among agricultural ecosystems of jackfruit orchards in Vinh Long Province, Vietnama

a Entries are Steinhaus (quantitative Bray-Curtis) similarity (SA) among agroecological regions. Range 0–1 (higher = more similar). Diagonal = 1.00; blank cells are the symmetric upper triangle. Values rounded to two decimals.
Ordination and Community Gradients
PCA separated species along a dominant gradient (PC1 ≈ 71.6%) structured by density/cover of A. compressus and L. octovalvis; PC2 (≈ 16.1% to 18.6%) captured secondary variation associated with substrate history and Poaceae carryover from rice or sweetpotato ground (Figure 6). Cluster structure (k-means) suggests practical grouping of species for trait-based control bundles (e.g., low-canopy annual forbs vs. tussock-forming grasses vs. sedges).
Principal component analysis (PCA) of weed species across jackfruit orchards (k-means clusters) in Vinh Long Province, Vietnam. PCA was performed on standardized species metrics (centered and scaled; correlation matrix). Points are species scores (labels = species IDs). Colors denote k-means clusters (k = 4); shaded ellipses show 95% normal data ellipses. Axes indicate variance explained: PC1 = 71.57%; PC2 = 16.05%. Data aggregated from 1 m × 1 m quadrats (5 per block; 62 blocks). Values are unitless; greater separation along PC1 reflects the dominant community gradient).

Implications and Synthesis for IWM in Jackfruit Orchards
The survey documents a grass-heavy, largely annual flora (35 species in 18 families; Table 2) dominated by C. rutidosperma, P. urinaria, A. conyzoides, F. quinquangularis, and L. octovalvis, and secondarily by A. sessilis, E. colona, and L. chinensis. PCA and density metrics indicate that A. compressus and L. octovalvis are poised to remain or become more prominent where canopy closure and moisture favor them. Despite differences in lists, densities, and encounter frequencies, α-diversity (H′, J′, λ, E) did not differ significantly among agricultural ecosystems, and pairwise similarity indices (Jaccard, Sørensen, Steinhaus) were uniformly high (Tables 3–6). This strong β-similarity supports a coordinated, province-wide IWM strategy that simultaneously targets multiple dominant species across orchards. Tactically, programs should (1) reduce recruitment and early canopy of L. octovalvis, A. conyzoides, and F. quinquangularis via timely mowing before flowering, narrow herbicide bands where permitted, and competitive seasonal cover crops (Atucha et al. Reference Atucha, Merwin and Brown2011; Haring and Hanson Reference Haring and Hanson2022; Tursun et al. Reference Tursun, Işık, Demir and Jabran2018); (2) treat sedge/grass patches and mesic associates (F. quinquangularis, L. chinensis, E. colona, P. pellucida, and C. asiatica) by alleviating wet niches (drainage/irrigation), adding organic mulches, and targeting hotspots; and (3) contain weedy rice along hydrologically connected edges through sanitation and prevention of seed rain (Chauhan and Johnson Reference Chauhan and Johnson2010; Sudianto et al., Reference Sudianto, Song, Neik, Saldain, Scott and Burgos2013; Ziska et al., Reference Ziska, Gealy, Burgos, Caicedo, Gressel, Lawton-Rauh, Avila, Theisen, Norsworthy, Ferrero, Vidotto, Johnson, Ferreira, Marchesan and Menezes2015). The orchard conversion legacy from annual crops explains the Poaceae signal and supports shifting from broadcast herbicides to diversified, disturbance-timed programs that also enhance soil biota and structure (Granatstein et al. Reference Granatstein, Andrews and Groff2014; Yang et al. Reference Yang, Wang, Tang and Chen2007). Our recent regional survey (Thi et al. Reference Thi, Vu and Huy2025) found that approximately 18.7% of jackfruit growers in Vinh Long had begun integrating economically valuable cover crops, with C. asiatica being the most widely used due to its erosion control, soil fertility enhancement, and income diversification potential. This suggests that multifunctional cover cropping may represent a promising strategy for sustainable weed management in smallholder orchard systems. More broadly, our results align with the concept that environmental and management filters govern weed assembly in managed systems (Fried et al. Reference Fried, Norton and Reboud2008; Storkey et al. Reference Storkey, Moss and Cussans2010), that a small “core” community shapes competitive outcomes (Booth et al. Reference Booth, Murphy and Swanton2003; Radosevich et al. Reference Radosevich, Holt and Ghersa2007), and that preventing seed rain and depleting seedbanks is pivotal for durable control (Legendre and Legendre 2012; Merwin and Stiles Reference Merwin and Stiles1994; Norsworthy et al. Reference Norsworthy, Ward, Shaw, Llewellyn, Nichols, Webster, Bradley, Frisvold, Powles, Burgos, Witt and Barrett2012; Teasdale and Mohler Reference Teasdale and Mohler2000; Anju et al. Reference Anju, Warrier and Kunhikannan2022).
Supplementary material
To view supplementary material for this article, please visit https://doi.org/10.1017/wsc.2025.10083
Acknowledgments
We gratefully acknowledge Can Tho University, particularly the Department of Plant Protection, School of Agriculture, for foundational support that enabled this research, including access to vehicles and sampling equipment and laboratory facilities for specimen processing and data management. We thank the Vinh Long Sub-Department of Crop Production and Plant Protection and commune agricultural officers for facilitating site access and introductions to cooperating growers. We are especially grateful to the jackfruit growers in Vinh Long Province who allowed surveys in their orchards, and to the undergraduate and graduate volunteers from Can Tho University who assisted with quadrat sampling and data entry. Any errors are the responsibility of the authors, and mention of specific methods or products does not imply endorsement by Can Tho University. Large language model tools were used only for English copyediting and caption polishing (ChatGPT, OpenAI, San Francisco, CA); the authors verified all text and take full responsibility for the content. No AI tools were used for data collection, analysis, or interpretation.
Funding statement
This research received no specific grant from any funding agency or the commercial or not-for-profit sectors.
Competing interests
The authors declare no conflicts of interest.


 Open access