

Introduction
This study describes the general characteristics and distribution of globular moss growth on the ice surface of Falljökull, a valley outlet glacier of the Vatnajökull ice cap, southern Iceland. The spatial distribution and physical characteristics of globular moss growth are described, together with an assessment of potential relationships between moss growth and supraglacial sediment characteristics and distribution. It is hypothesized that the morphology and life cycle of supraglacial globular mosses is closely linked to their action as an agent of supraglacial sediment redistribution, and evidence supporting this hypothesis is detailed. The potential importance of mosses to the ecology and nutrient cycle of the wider supraglacial ecosystem is briefly considered.
For some time, glaciers were incorrectly assumed to be largely abiotic environments, and, as a result, the nature and dynamics of glacier ecosystems received scant attention until relatively recently. Recovery of microorganisms from deep ice samples in East Antarctica (Reference Abyzov and FriedmannAbyzov, 1993) stimulated great interest in the functioning of glacial ecosystems. Published work to date includes examination of nutrient budgets (e.g. Reference Hodson, Mumford, Kohler and WynnHodson and others, 2005), microbial assemblages (e.g. Reference Skidmore, Foght and SharpSkidmore and others, 2000; Reference Säwström, Mumford, Marshall, Hodson and Laybourn-ParrySäwström and others, 2002; Reference Bhatia, Sharp and FoghtBhatia and others, 2006; Reference Buford PriceBuford Price, 2007) and micro-invertebrates (e.g. Reference De Smet and van RompuDe Smet and Van Rompu, 1994; Reference Shain, Mason, Farrell and MichalewiczShain and others, 2001). A review of microbial habitats in glacial ecosystems is provided by Reference HodsonHodson and others (in press).
However, the distribution and potential role of vegetation in glacial systems has received even less attention, presumably due to a paucity of observational evidence. This is despite the fact that cyanobacteria in glacial ecosystems fix nitrogen and furnish the organic carbon for bacterial and other microbially mediated processes in glacial environments (Reference Kaštovská, Elster, Stibal and ŠantrůčkováKaštovská and others, 2005; Reference HodsonHodson and others, in press) providing the nutrient base necessary for plant life. Morainic and other glacially transported debris is known to provide a useful substrate for such activity (e.g. Reference Sharp, Parkes, Cragg, Fairchild, Lamb and TranterSharp and others, 1999; Reference HodsonHodson, 2006), and thus also allow colonization by vegetation on the glacier surface and at its margins.
Mosses are well suited to the colonization of harsh glacial environments, and the presence of mosses in nival and ice-marginal environments is well documented (e.g. Reference Collins and CallaghanCollins and Callaghan, 1980; Reference BellandBelland, 1983; Reference Bergstrom and SelkirkBergstrom and Selkirk, 1997; Reference Hodkinson, Coulson and WebbHodkinson and others, 2003; Reference Whinam, Selkirk, Downing and HullWhinam and others, 2004; Reference Lewis SmithLewis Smith, 2005). In glacial environments the primary limiting factors for plant growth are likely to be nutrient supply, dehydration during temperature minima, and freezing during extreme low temperatures. Many moss species, however, show great tolerance to dehydration and desiccation, while the commonplace aggregation of mosses into globular or lenticular cushions increases evaporative resistance and reduces water losses (Reference LongtonLongton, 1988). Many species also have modest nutrient requirements, while aggregation into cushions disrupts airflow and may allow more effective sequestration of airborne dusts and organic matter (Reference HodsonHodson and others, in press). Finally, the ability of mosses to maintain photosynthesis and respiration under conditions of both low temperature and low light allows survival during winter snow burial and periods of sub-zero surface temperatures experienced in early spring and late autumn (Reference LongtonLongton, 1988).
It is therefore unsurprising that extensive moss growth has been observed at the margins of glaciers and ice sheets. However, although not studied in detail, moss growth has also been previously observed on the surfaces of the Icelandic glaciers Hrútárjökull, Kvíárjökull and Breiðamerkurjökull by Reference EythórssonEythórsson (1951) who named the observed supraglacial globular moss cushions ‘Jökla-mys’, which translates from the Icelandic as ‘glacier mice’. Globular moss growth has also been observed on the surface of Matanuska Glacier, Alaska, USA (Reference BenninghoffBenninghoff, 1955). Theoretically, supraglacial water and direct atmospheric deposition will provide nutrient supply during the summer months to sustain growth, while the insulating properties of many moss species, together with water and nutrients from snowpack melt, are likely to allow survival during annual winter burial (Reference LongtonLongton, 1988). This combination of factors provides the potential for moss communities to thrive where supraglacial debris and a source of colonizing material (spores and/or vegetative fragments) are both present.
Field Site
Falljökull is an outlet glacier of the Vatnajökull ice cap, southern Iceland. The glacier is fed in its upper reaches by the Öræfajökull ice dome via an extensively crevassed icefall and has a southwest orientation. For the last 5.5 km, the glacier splits into two lobes, separated by the Rauðikambur rock ridge; the western tongue becomes Virkisjökull, while the eastern tongue retains the name Falljökull (Fig. 1).
Location map of the Öræfajökull ice dome and Falljökull outlet glacier. Smaller map shows the snout area of Falljökull and approximate location of the main moss areas. The largest of the four areas shown on the map was selected for detailed investigation.

In common with other glaciers in the area, Falljökull is currently undergoing rapid retreat, together with thinning in the lower reaches of the ablation zone. The glacier surface in the study area is characterized by numerous dirt cones and an extensive network of supraglacial streams, the largest of which is deeply incised into the southeastern margin and marks the edge of a large area of debris-covered dead ice and morainic material. While not selected for detailed study, this area also exhibits extensive moss coverage and is a potential source for wind-blown spore dispersal onto the surface of the glacier.
Fieldwork was undertaken in August 2005. The annual average temperature that year at the closest meteorological station (Skaftafell, approximately 11km to the west and in a similar katabatic setting) was 5˚C, with a summer maximum of 15.1˚C recorded in late July and winter minima of –6˚C recorded in early February. In the Skaftafell/Vatnajökull area, daily mean air temperatures generally become consistently positive from mid-April and consistently negative from early October.
The geology of the Vatnajökull area comprises Tertiary basalts, Upper Pleistocene formations comprising subaerial lava flows, subglacial pillow lava, hydroclastic tuffs, breccias, basalt and andesite lava flows (Reference Thordarson and HoskuldssonThordarson and Hoskuldsson, 2002). Extensive Holocene morainic and fluvioglacial sandur deposits are a characteristic feature of the Vatnajökull area. Clastic debris on the surface of Falljökull in the study area comprises fragments of amorphous, fine-grained basaltic lava.
Methods
Four areas of moss coverage were found on the surface of Falljökull in the lower reaches of the ablation zone (Fig. 2). Sampling revealed that Racomitrium fasciculare (Hedw.) Brid., and Racomitrium ericoides (Brid.) Brid. had grown on supraglacial clastic debris. Proportionally less Racomitrium ericoides (Brid.) Brid. was observed in samples taken from the field. However, on-site species identification was not possible, so the relative abundance of these two species (which display a similar growth habit) across the study site is not discussed here. In many cases, moss coverage had completely encompassed the clast, the internal clast only being visible when deliberately teased out from within the moss cushion (Fig. 2, inset A). Fragments of moss and associated detritus were also observed in proglacial streams down-glacier of the main areas of moss coverage.
Area of moss-colonized clasts on the surface of Falljökull. Glacier flow direction is from left to right. Inset (a) shows a moss cushion that has been teased apart to reveal the internal clast around which the moss has grown. Inset (b) shows a profile view of a lenticular moss cushion. The long and short axes are visible in this photograph, the moss cushion having been deliberately placed on its side. Long axis length is approximately 0.11 m.
The largest (approximately 575m2) of the four moss areas identified was selected for preliminary study during August 2005 (Fig. 2). A transect just under 30m long was taken through the centre of this moss area, and, where a moss cushion encasing a clast abutted the transect line, its long-,intermediate- and short-axis sizes were recorded. The internal clast was then teased out and cleaned, and its long-, intermediate- and short-axis size recorded (these clasts are subsequently referred to as ‘internal clast/s’). The average surface slope of the study area was 9.6˚.
Sphericity was calculated for both moss cushions and internal clasts following the analysis of Reference KrumbeinKrumbein (1941):
where ψ is sphericity ranging from 0 to 1.0 (a true sphere having a value of 1.0), and a, b and c are long-,intermediate- and short-axis lengths respectively.
In order to calculate and identify any downslope trends in percentage cover of moss-free clasts and moss cushions, vertical digital photographs were taken of 1 m2 areas of the glacier surface at the top and bottom of the central 30m transect, and at four equidistant intermediate areas down the transect. The outlines of all moss-free clasts and moss cushions were manually digitized from these photographs using Erdas Imagine1 software, and total area of moss cushions, moss-free clasts and clear glacier ice calculated. Finally, samples of moss cushions from the top, middle and bottom of the transect were assessed for organic matter content using the loss by ignition technique.
Moss–Debris Associations on Falljökull
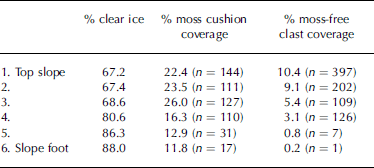
Initial visual inspection of the transect revealed a downslope increase in size of moss cushions, but a downslope decrease in the surface coverage of both moss cushions and non-colonized clasts (Fig. 3). Subsequent quantitative analysis of vertical photographs confirmed that in the downslope direction, percentage surface coverage of both moss-free clasts and moss cushions decreases, while percentage clear ice cover increases (Table 1).
Percentage coverage of clear ice, moss cushion coverage and moss-free clast coverage down the transect. n is absolute number of moss cushions and moss-free clasts within each 1 m2 sample area. Distance from top slope to slope foot is approximately 30m
(a) Glacier surface at the top of the transect. Note the relatively denser surface coverage compared with (b), and the prevalence of moss-free clasts. (b) Glacier surface at the foot of the transect. Note the almost complete absence of moss-free clasts and the relatively large area of exposed glacier ice. Each photograph shows an area approximately 1 m2.
Non-colonized clastic elements make up >10% of the surface cover at the top of the transect and only 0.2% at the foot (Table 1). Similarly, moss cushions comprise 22.4% of the surface cover at the top of the transect and 11.8% at the foot. There are in fact considerably more moss-free clasts than moss cushions at the head of the transect (Table 1), the surface cover percentages being influenced by the larger size of the moss cushions relative to moss-free clasts. However, by the foot of the transect the situation has reversed and the absolute number of moss cushions exceeds the number of moss-free clasts (Table 1). Percentage clear ice cover within each 1m2 area increases from 67.2% at the top of the transect to 88% at the base (Table 1). Although the overall trend is for percentage moss cushion coverage to reduce down-glacier, the trend is not systematic. An initial increase in coverage in the down-glacier direction is apparent, with percentage cover rising from 22.4% at the top of the transect to 26% at point three, before then showing a systematic decline to 11.8% at the base of the transect (Table 1).
Moss cushion intermediate-axis size shows an increase in the downslope direction (Fig. 4). A correlation of r = +0.70, statistically significant at 95%, exists between moss cushion intermediate-axis size and distance downslope, and although removal of the obvious outlier shown in Figure 4 reduces the correlation coefficient slightly to +0.67, the correlation remains statistically significant at 95%. This is not matched by the relationship between internal clast intermediate-axis size and distance downslope, which has a weak correlation of r = +0.2, not significant at 95%.
Plot of moss cushion intermediate axis against downslope location. A strong correlation is apparent (r = 0.7, significant at 95%). Upper and lower 95% confidence and prediction limits are denoted by the dotted and dashed lines respectively.
Although clearly there is a trend of increasing sphericity of moss cushions in the downslope direction (Fig. 5), formal statistical testing only yields a moderately strong correlation of r = +0.5, significant at the 95% level. Sphericity of internal clasts shows no relationship with distance downslope, testing yielding a very weak correlation of r = –0.1, not significant at 95%.
Plot of Krumbein sphericity against downslope location for moss cushions. A moderately strong (r = 0.5, significant at 95%) correlation is apparent. Upper and lower 95% confidence and prediction limits are denoted by the dotted and dashed lines respectively.
In order to further investigate any potential relationship between internal clast characteristics and moss cushion characteristics, a simple estimate of the thickness of the moss ‘envelope’ can be gained by subtracting moss cushion intermediate-axis size from internal clast intermediate-axis size. When this envelope thickness is correlated against internal clast intermediate-axis size, a very weak correlation of r = +0.04 is yielded, not significant at 95%. Thus, there is no relationship between internal clast size and moss envelope thickness.
Logistical constraints in the field necessitated that samples for organic matter assessment were randomly gathered from 1 m2 grids in the top, middle and slope-foot sections of the transect rather than systematically down the whole transect. Prior to ignition, the air-dried weight of samples ranged from 23.4 to 99.8 g (slope foot, n = 10), 10.7 to 39.4 g (mid-slope, n = 7) and 5.3 to 25.1 g (top slope, n = 10). In terms of absolute mass of organic matter, slope-foot moss cushions showed the highest mass, with an average of 6.2 g (range 2–10.5 g). Mid-slope samples comprised an average of 2.7 g (range 1.3–4.3 g), while top slope samples comprised an average of 1.7 g (range 0.6– 2.8 g) organic matter (Fig. 6). These values reflect the increasing size of moss envelopes with distance downslope. However, despite this trend, the downslope decrease in total cover of both clasts and moss cushions means that there is a negative trend in the total mass of both organic and inorganic material downslope.
Organic matter content by weight of moss cushion samples from the top, middle and slope-foot areas of the transect. Shaded bars indicate the range, while the black horizontal line denotes the average mass of organic matter in grams. Note the increase in both range and average organic matter content in the downslope direction.
Discussion
Qualitative observation in the field showed that many moss cushions were lenticular in shape, with a flat bottom and domed top (Fig. 2, inset B). It was also apparent that many moss cushions had ‘rolled’ into an inverted position, with the domed section lying on the ice surface and the flat section uppermost. This corresponds with observations of moss growth on glaciers elsewhere (Eythórsson, 1950; Reference BenninghoffBenninghoff, 1955). The presence of easily removed organic and inorganic detritus on the uppermost surface of some moss cushions suggests that ‘rolling’ and inversion has been relatively recent, with a lesser amount of moss growth present on the uppermost flat surface when compared to other, more spherical, cushions that had apparently rolled and experienced a longer period of growth on the exposed upper surface. Small pedestals of ice were evident beneath both larger moss-free clasts and moss cushions. It seems plausible that moss cushions shield the underlying ice from melt, with the majority of samples having an overall intermediate-axis size greater than the critical threshold of 0.005–0.01 m, below which glacier surface debris will conduct heat sufficiently rapidly to accelerate melt of the underlying ice surface (Reference ØstremØstrem, 1959).
Movement of moss cushions
Given the evidence for recent inversion of moss cushions, it is suggested that the formation of ice pedestals may be responsible for eventually ‘toppling’ moss cushions and initiating ‘rolling’, ‘sliding’ and general downslope motion (Fig. 7). This downslope movement will likely be enhanced by a greater degree of sphericity and overall mass as moss growth progresses. Larger and more spherical moss cushions may therefore experience greater degrees of net downslope movement.
Conceptual model illustrating a potential mechanism for downslope movement of moss cushions. Intermediate-axis size of sampled moss cushions ranges from 0.03 to 0.16 m. At time 1 the moss cushion rests on the glacier surface, protecting the underlying ice from melt. At time 2, this protection from melt has allowed an ice pedestal to form beneath the moss cushion. By time 3, the pedestal has reached some critical height or angle such that the moss cushion either slides or rolls from the elevated pedestal position to rest once more on the ice surface. The cycle can then begin again, the end result being a net down-glacier movement of moss cushions.
While pedestal formation does not inevitably mean a downslope movement of either clastic debris or moss cushions (upslope or cross-slope movement from a pedestal is also possible), gravity will tend to skew movements downslope. Observations in the field showed that recently exposed ice pedestals generally have an upper surface angled downslope, while upturned lenticular moss cushions were generally found on the downslope side of recently exposed ice pedestals. Furthermore, the relatively steep (average 9.6˚) angle of the glacier surface is likely to be a factor in enhancing toppling and rolling from ice pedestals in the downslope direction.
The degree to which the presence of moss acts to accelerate the speed of ice pedestal formation relative to moss-free clasts is unclear. However, moss growth clearly results in an increase in overall intermediate-axis size relative to moss-free clasts. Radiative shielding of the underlying ice is therefore likely to be increased in spatial extent where moss exists, and this will create an increased likelihood of pedestal formation and downslope movement. The increased proportion of large moss cushions lower down the slope, despite the lack of a downslope trend in internal clast size, certainly suggests that mosses are active in enhancing the general movement of supraglacial clasts downslope, although, as discussed below, other processes may contribute.
Size and sphericity variations
The increase in size and sphericity of moss cushions downslope, without a concomitant increase in the size or sphericity of the internal clasts, indicates that the morphology of the mosses is not closely controlled by clast size or shape. Indeed, as noted above, there is no apparent relationship between the size of clasts and the thickness of the moss envelope. Although no data were collected in the field on the relative proportions of the two Racomitrium species in the downslope direction, the size increase of moss cushions with downslope distance and the general similarity of growth habit of the two species argues against any systematic downslope variation in the relative proportions of the two species being a significant factor in the down-glacier size distribution of moss cushions. Furthermore, the relatively short length of the down-glacier axis of the moss patch (~30 m) and the limited change in ice surface morphology suggests microclimatic variations are an unlikely explanation for the observed down-glacier increase in size of moss cushions.
The progressive size increase of moss cushions down-slope is likely to signal an increase in moss cushion age and/ or preferential movement of the larger moss cushions. Clearly the source of supraglacial clastic debris may be significant here. If supraglacial debris is being supplied from an englacial source, any age-related trend in overall moss cushion size could be explained by earlier melt-out and colonization of clasts lower down the slope. However, such a hypothesis necessitates additional mechanisms to explain the lower concentration of clasts lower down the slope. An alternative explanation may be that the clasts are melting out of the ice and slowly moving downslope under gravity with no influence from moss cushion growth. Again, however, additional mechanisms would be required to explain the lack of any downslope trend in clast size and the lower concentration of clasts at the foot of the transect.
The observed downslope increase in moss cushion sphericity indicates that more complex processes are at work than extended growth-times downslope and, indeed, also supports the notion that simple microclimate or nutrient-controlled growth-rate variations are unlikely to offer an explanation for the down-glacier increases in size. In non-supraglacial environments, larger moss cushions tend to be lenticular in cross-profile due to a lack of movement (e.g. Reference Beck, Mägdefrau and SenserBeck and others, 1986). In contrast, on Falljökull larger moss cushions tend to be more spherical than lenticular, suggesting regular movement rather than prolonged in situ growth.
A comparison of the moss size distributions at either end of the transect might be expected to distinguish between models of development centred on age and those centred on preferential movement. For example, the presence of the largest moss cushions at the transect head might have argued against time since melt-out being important. However, here the data are inconclusive, as the largest size fraction of moss cushions is missing at the slope head and this could equally be the situation in either scenario. The downslope increase in the proportion of clasts that are moss-covered (Table 1) therefore fits more than one potential model of development. Nevertheless, while factors like melt-out and movement of moss-free clasts may have played a role in developing the observed distribution of moss cushions, the most parsimonious explanation for the evidence is that larger mosses allow for easier transport downslope. This explanation requires no complex sedimentary history and fits the observed morphology of the moss cushions well.
Clearly any form of moss growth on the glacier surface is limited by the presence and extent of supraglacial debris cover, and moss will only colonize areas where the sedimentary, structural and flow characteristics of the ice are developed to supply such material. However, even with a relatively short growing season and harsh environmental conditions it is apparent that abundant moss growth is possible on glacier surfaces where clastic debris is present and that moss growth has some capacity to enhance the transport of that debris. The dynamic nature of supraglacial mosses indicated by the results of this study also provides considerable potential for the redistribution of both organic matter and nutrients around the glacier surface. The presence of supraglacial moss coverage may enhance both the nitrogen fixing capacity of the wider supraglacial ecosystem and the production of organic carbon for heterotrophic bacterial activity. This potential capacity to enhance primary and heterotrophic production in supraglacial environments therefore demands further consideration from an ecological perspective, especially as the very presence of mosses suggests the existence of a more complex supraglacial ecosystem than hitherto appreciated.
Conclusion
Preliminary inspection of globular moss growth on the surface of Falljökull supports the notion that the downslope transfer of supraglacial debris is assisted by the presence and growth of mosses. Moss cushion growth not only shields the underlying ice surface from melt, thereby allowing pedestal formation to initiate motion, but also increases sphericity and total mass relative to non-colonized clasts, allowing more effective downslope movement. This process is embodied in a downslope increase in both intermediate-axis size and sphericity of moss cushions. The very presence of mosses in supraglacial environments points to the need for a detailed consideration of the role of vegetation in the wider glacier ecosystem.
Acknowledgements
The authors gratefully acknowledge the assistance of T. Blockeel for undertaking species identification, and T. Sands for lithological description and identification of supraglacial clasts. Meteorological data for Skaftafell were kindly supplied by G. Gísladóttir of the Icelandic Meteorological Office. Thanks are due to J. Elvy for assistance with production of figures, and A. Burton for constructive bryology and ecosystem discussions. The paper benefited significantly from constructive comments provided by D. Graham and an anonymous referee.


