

Wound healing is a complex, multi-stage process by which tissue integrity is restored following injury or infection. The process comprises a series of events, including a coagulation phase, an inflammatory phase and a final repair phase. The inflammatory phase plays an essential role in preventing infection, as also an equally essential role in aiding in the tissue repair process. This physiological repair response requires a complex and dynamic interplay of several cell types, including local tissue and recruited haematopoietic cells. Blood cell migration into the wound involves attachment to the endothelial cells and extravasation, a process which is regulated mainly by chemokines and cellular adhesion molecules (CAM). These CAM, integrins and selectins, direct leucocyte–endothelium interactions, transendothelial migration of leucocytes and leucocyte trafficking in general(Reference Gurtner, Werner and Barrandon1). Their importance in wound healing was clearly demonstrated by Cruse & Wang(Reference Cruse and Wang2) who showed that delayed healing of pressure ulcers in spinal cord injury patients could be attributed to reduced CAM expression, impaired cell–cell interaction and lack of extracellular matrix structural and functional protein.
Among other compounds, lipids, especially the n-3 longchain PUFA (n-3-LC-PUFA) have been shown to influence the immune response, and therefore have an effect on wound healing. Thus, PUFA deficiency has been shown to result in impaired wound healing in patients(Reference Hulsey, O'Neill and Neblett3), as well as in rats, who received an essential fatty acid-deficient diet(Reference Bjerve4). On the other hand, we have previously demonstrated that the administration of an enteral nutrition formula enriched in PUFA and micronutrients reduced the incidence of new pressure ulcers in patients in an intensive care unit (ICU) with acute lung injury(Reference Theilla, Singer and Cohen5). There are, however, few data regarding the possible role of immune function in the healing of pressure ulcers in critically ill patients.
The objective of the present clinical trial was to assess the impact of a fish oil- and micronutrient-enriched formula on the expression of adhesion molecules on peripheral blood leucocytes and to correlate this with the healing of pressure ulcers in critically ill patients.
Materials and methods
Patients
This prospective, controlled, randomised study was conducted according to the guidelines laid down in the Declaration of Helsinki and all procedures involving human subjects were approved by the Rabin Medical Center Review Board. Written informed consent was obtained from all patients or from a legal guardian where relevant. Adult patients admitted to the general ICU were considered eligible for enrolment if: (1) they presented with or developed greater than or equal to one grade II (or higher) pressure ulcer/s (i.e. damage to the epidermis extending at least into the dermis) according to the National Pressure Ulcer Advisory Panel classification(6) and (2) they were expected to be in need of nutritional support for at least 5 d. Patients were excluded if there was evidence of pre-existing impaired wound healing or abnormal immune status, e.g. patients receiving chemotherapy or treatment with more than 0·25 mg/kg per d prednisone (or an iso-equivalent dose of other glucocorticoids). Significant intracranial haemorrhage was also an exclusion criterion.
Nutritional support
Patients were randomly allocated to receive either fish oil- and micronutrient-enriched enteral nutrition (Oxepa; Abbott, Chicago, IL, USA – the intervention group) or an iso-nitrogenous formula (Jevity; Abbott – the control group) according to a computer-generated random list in the ratio of 1:1. The macro- and micronutrient composition of the various nutritional formulae is depicted in Table 1. There was no significant difference in the mean protein intake over the study period between the two groups (66·1 g/d for the study group v. 65·1 g/d for the control group). The study statistician was blinded to the treatment allocation, but not the ICU staff, patients or assessor of ulcer severity. The quantity of nutritional formula prescribed was determined by the measurement of resting energy expenditure as assessed by indirect calorimetry (Deltatrac II; Datex-Ohmeda, Helsinki, Finland), which is the standard of care in our ICU. Resting energy expenditure was assessed every 7 d and the energy prescription adjusted accordingly. Where patients were unable to receive the full energy prescription via the enteral route, e.g. due to gastric paresis, enteral nutrition was supplemented with parenteral nutrition. All other aspects of patient management, including local ulcer treatment were determined by the patients' attending physician.
Composition of selected nutrients in the control and study formulae per 100 ml
CHO, carbohydrates; GLA, γ-linolenic acid.
* Jevity (Abbott, Chicago, IL, USA).
† OliClinomel N-6 990 E (Baxter, Deerfield, IL, USA).
‡ Oxepa (Abbott).
§ OliClinomel N-6 990 E (Baxter) and Omegaven (Fresenius Kabi, Bad Hamburg, Germany).
∥ Supplied by 5 mg β-carotene.
Measurement of serum parameters
On admission, the following were recorded: patient age, sex, BMI, primary diagnosis (surgical, medical or trauma) and Acute Physiology and Chronic Health Evaluation II score(Reference Knaus, Draper and Wagner7). The latter provides both an estimate of ICU mortality and is inversely correlated to reactive skin hyperaemia(Reference Haisjackl, Hasibeder and Klaunzer8). Total and differential peripheral leucocyte counts were assessed as part of the routine full blood count performed daily in the ICU.
Measurement of percentage of positive adhesion molecules
Blood was drawn from an indwelling venous catheter on days 0, 7 and 14. Patients continued to receive nutritional support before blood withdrawal. Sodium heparin-preserved whole blood was stained with the following fluorescein isothiocyanate isomer 1 – or phycoerythrin – conjugated monoclonal antibodies, in preparation for flow cytometric analysis: CD11a, CD11b, CD18, CD49b, CD49d, CD54, CD8, CD44 (Table 2). Whole blood (100 μl) was combined with 20 μl of the fluorescent conjugated antibodies and incubated in the dark at room temperature for 10 min. A cell-suspension was then prepared using a Coulter Q-Prep, which contained an erythrocyte lytic agent and a leucocyte stabiliser. The samples were washed and suspended in 1 ml of formalin fixative. All samples were analysed using the Coulter Epics XL Flow Cytometer Analyzer (Beckman Coulter, Fullerton, CA, USA). Lymphocyte and granulocyte gates were set for the measurement of positively stained lymphocytes and granulocytes.
Designation(s), expression and role of cellular adhesion molecules measured

CD, cluster of differentiation; LFA, lymphocyte function associated; Mac-1, macrophage adhesion ligand-1; ICAM-1, intercellular adhesion molecule-1; CR, complement receptor; VLA, very late antigen; ECM, extracellular matrix; VCAM, vascular cell adhesion molecule; NK, natural killer; MHC, major histocompatibility complex.
Assessment of pressure ulcer severity
The diagnosis of a grade II pressure ulcer before enrolment and monitoring of changes in ulcer severity were assessed by the Pressure Ulcer Scale for Healing tool score(Reference George-Saintilus, Tommasulo and Cal9), a non-invasive clinical aid that attributes a severity score to a pressure ulcer, ranging from 0 (healed) to 17 (worst possible score). The score is a summation of three ulcer parameters, each of which is graded according to increments in severity: (1) length × width of the ulcer; (2) amount of exudate (none, light, moderate and heavy) and (3) tissue type (necrotic tissue, slough, granulation tissue, epithelial tissue and closed). Observation of the changes in the direction and magnitude of the score over time provides a validated indication regarding wound healing(Reference Thomas, Rodeheaver and Bartolucci10). In the present study, measurements were recorded on day 0 (enrolment) and on days 7, 14 and 28. All pressure ulcer scale for healing tool assessments were performed by a single investigator (M. T.).
Statistical analysis
Data were analysed utilising SPSS 17 for Windows (Chicago, IL, USA). Differences in baseline data and patient characteristics were assessed by the Wilcoxon and independent t tests for non-parametric and parametric variables, respectively. The response of percentage positive CD (cluster of differentiation) and pressure ulcer severity to treatment was analysed by repeated-measures ANOVA. A P value < 0·05 was considered significant.
Results
General characteristics
A total of forty patients (twenty in each group) were enrolled in the study. There were thirteen males and seven females in the control group and fourteen males and six females in the intervention group. There were no statistically significant differences in patient characteristics between the two groups (Table 3). In addition, there were no significant between-group differences in leucocyte counts at any time point between the two groups.
(Number of patients and mean values and standard deviations)

ICU, intensive care unit; APACHE II, Acute Physiology and Chronic Health Evaluation II.
Pressure ulcer severity
Upon enrolment, the severity of pressure ulcers was similar in the control and intervention groups (9·3 (sd 2·1) v. 9·1 (sd 2·8) points, respectively; NS). The pressure ulcer scale for healing score increased significantly over time for the control group (P < 0·05), but not for the intervention group (Fig. 1).
Changes in the Pressure Ulcer Scale for Healing (PUSH) tool total score between the intervention (![]() ) and control (
) and control (![]() ) groups over time.
) groups over time.

Measurement of percentage of positive adhesion molecules
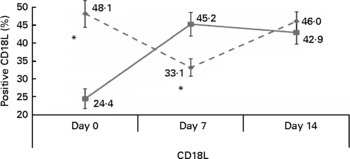
Apart from a higher percentage of positive CD18 lymphocytes in the control group (24·4 (sd 27·4) v. 48·1 (sd 38·1) % in the intervention group; P < 0·05), there were no statistically significant differences in baseline percentage of positive CD between the two groups (Fig. 2). Following 1 week of treatment, percentage of positive CD18 lymphocytes increased to 45·2 (sd 33·2) % in the intervention group, whereas the control group exhibited a decrease to 33·1 (sd 24·1) %. This change in percentage of positive CD was statistically significant (P < 0·05; Fig. 2). By day 14, the lymphocyte CD18 levels of the two groups converged. Repeated-measures ANOVA also demonstrated a statistically significant interaction between the effects of time and treatment allocation on lymphocyte CD18 (P < 0·05). The percentages of positive CD11a lymphocytes and CD49b granulocytes were similar between the two groups at baseline and increased significantly in response to treatment in the intervention, but not control group (P < 0·05, group × time interaction effect). Lymphocyte CD11a increased from 54·4 (sd 40·3) % (day 0) to 70·8 (sd 39) % (day 7) in the intervention group v. 61 (sd 43) % (day 0) to 68·7 (sd 35·6) % (day 7) in patients receiving the control formula (P < 0·05; Fig. 3). The mean percentage of positive CD49b granulocytes increased significantly in the intervention group from 48·7 (sd 45·7) % on day 0 to 83·3 (sd 34·4) % on day 14 (P < 0·05), and decreased in the control group from 47·3 (sd 46·8) % to 39·1 (sd 42·1) % (P < 0·05; Fig. 4).
Changes in percentage of positive CD18 lymphocytes (CD18L) in the control (![]() ) and intervention (
) and intervention (![]() ) groups during the study period. * Mean values were significantly different between the control and intervention groups (P < 0·05).
) groups during the study period. * Mean values were significantly different between the control and intervention groups (P < 0·05).
Percentage of positive CD11a lymphocytes (CD11aL) in the control (![]() ) and intervention (
) and intervention (![]() ) groups as a function of time. * Mean values were significantly different between day 0 and day 7 for the control and intervention groups (P < 0·05).
) groups as a function of time. * Mean values were significantly different between day 0 and day 7 for the control and intervention groups (P < 0·05).

Percentage of positive CD49b granulocytes (CD49bG) in the control (![]() ) and intervention (
) and intervention (![]() ) groups as a function of time. Mean values were significantly higher in the intervention group at day 14 and lower in control group (P < 0·05).
) groups as a function of time. Mean values were significantly higher in the intervention group at day 14 and lower in control group (P < 0·05).

The intervention group also showed a trend towards an increase in the percentage of positive CD11b lymphocytes and CD18 granulocytes over 14 d of treatment (P = 0·06 in both cases). There were no significant differences in CD44, CD54, CD49d or CD8 between the groups over the study period.
Discussion
In the present study, we have shown that patients with pressure ulcers who received an n-3-LC-PUFA- and micronutrient-enriched nutritional formula showed an increase in the percentage of positive lymphocyte and granulocyte adhesion molecules. These patients also had significantly less progression of existing pressure ulcers as compared to patients receiving an iso-nitrogenous, nutrient-sufficient formula.
Critical illness confers susceptibility to the development and persistence of pressure ulcers. Indeed, a significant proportion of ICU patients will develop pressure ulcers, in addition to those who present with these lesions on admission. A recent study which reviewed the literature for the period 2000–5, focusing on the prevalence and incidence of pressure ulcers in intensive care patients, found that while there were variations in intensive care settings ranging from 4 % in Denmark to 49 % in Germany, the overall incidence ranged from 38 to 124 %(Reference Shahin, Dassen and Halfens11). These pressure ulcers are associated with increased length of hospitalisation and healthcare costs(Reference Terekeci, Kucukardali and Top12).
The recruitment of leucocytes from the bloodstream to the tissues, a process essential for wound healing, critically requires the expression and function of CAM. The selectins are involved in the initial phase of inflammatory process, by enabling the rolling of leucocytes to resist the shear force of the blood stream. Thereafter, the activation of integrins results in increased affinity of their ligands on endothelial cells, thus ensuring tight binding of leucocytes to the vascular endothelium so that transendothelial leucocyte migration may follow(Reference Cruse and Wang2). The fact that leucocyte–endothelial adhesion supports tissue repair is evident from rare genetic disorders involving CD18 mutations (leucocyte antigen deficiency), where the lack of this essential leucocyte–endothelium adhesion molecule is associated with chronicity of wounds and impaired healing(Reference Kuijpers, van Lier and Hamann13).
CD11a, CD11b, CD18 and CD49b are transmembrane proteins expressed on granulocytes and lymphocytes that form integrin heterodimers. Flow cytometric analysis in the present study revealed an increase in the percentage positive of these adhesion molecules in patients who received the n-3 fatty acid- and micronutrient-enriched formula, indicating increased activation and function of these molecules. This increase occurred during the first 7–14 d, which coincides with the inflammatory phase of wound healing. Lymphocyte CD11a/CD18 interacts not only with intracellular adhesion molecule-1 on endothelial cells, but also with keratinocyte intracellular adhesion molecule-1, which is required in the third phase of wound healing, i.e. the repair phase(Reference Hughes, Pinder and Piper14). We have also recently shown (M Theilla, B Schwartz, J Cohen, R Anbar and P Singer, unpublished results) that patients with pressure ulcers who received the same n-3-LC-PUFA- and micronutrient-enriched nutritional formula displayed a significant decrease in C-reactive protein levels as compared to controls. This suggests that this formula may have a dampening effect on acute inflammatory processes. Thus, it is interesting to speculate that the positive effect of the n-3 fatty acid on preventing pressure ulcer progression could be the result of both an increase in the percentage of positive leucocyte adhesion molecules together with possible attenuation of an excessive inflammatory response.
There have been conflicting results in the literature regarding the effect of fish oil-based nutrition on adhesion molecule expression. n-3 has been shown to inhibit TNF-α, IL-1β and platelet-activating factor, all of which increase CAM expression/activity so that a reduction in the percentage of positive adhesion molecules would be expected, as demonstrated by Mayer et al. (Reference Mayer, Merfels and Muhly-Reinholz15) and others(Reference Schaefer, Ott and Mohr16–Reference Kaufman, Graf and Leung19). In addition, n-3-LC-PUFA have been shown to reduce the percentage of positive leucocyte adhesion molecules and impaired leucocyte–endothelial interactions(Reference Sanderson and Calder20–Reference Albina, Gladden and Walsh22). However, others have described a neutral(Reference Chiu, Wang and Chien23) or enhancing(Reference Bates, Ferrante and Harvey24) effect of fish oil on percentage of positive adhesion molecules in experimental settings. n-3 may inhibit the secretion of TNF-α-dependent proteases by circulating leucocytes. Certain proteases cleave membrane CAM, reducing their number (e.g. cleavage of neutrophil CD18 by the lysosomal cysteine proteinase, cathepsin B)(Reference Schwab, Chiang and Arita25). Neutrophil CD11b/CD18 also undergo cleavage, but only following extravasation to the skin(Reference Brooks, Milne and Yin26). Thus, even if n-3 inhibits NF-κB/platelet-activating factor/TNF-α-induced percentage positive of CAM, it may reduce their proteolysis to a greater extent, thereby increasing their number, on average. The results of our present study appear to support the positive effect of PUFA on CAM expression in ICU patients and in view of the paucity of results in these patients, additional clinical trials appear to be warranted.
An alternative interpretation of our findings is that the association between increases in the percentage of positive CAM and n-3-LC-PUFA-mediated enhancement of wound healing is not of a causative nature, i.e. was mediated by adhesion-independent mechanism(s). Thus, for example, n-3-LC-PUFA are the source of several lipid mediators (e.g. resolvins, lipoxins, epoxyeicosatetraenoic acid) that appear to switch tissue macrophage action from a pro-inflammatory and microbicidal mode to an anti-inflammatory and pro-resolution mode. Following the initial inflammatory response to tissue injury, some macrophage sub-types leave the area of tissue injury via the lymphatics while others remain in situ to continue the process of tissue repair(Reference Schwab, Chiang and Arita25). It is possible, therefore, that locally formed resolvins/protectins and n-3-derived PPAR-γ agonists may induce a ‘wound-healing’ phenotype in tissue macrophages. Resolvins such as resolvin D2 have been shown to reduce the trafficking of leucocytes to inflammatory loci and to reduce CD26L and CD18(Reference Fukuda and Schmid-Schonbein17, Reference Spite, Norling and Summers27). This further inhibits the inflammatory infiltration and initiates the transition to a reparative stage of healing (inflammation-resolving type macrophages). Finally, nutritional support with fish oil may prevent hypotension and improve oxygenation in critical illness(Reference Mancuso, Whelan and DeMichele28, Reference Singer, Theilla and Fisher29), thus maintaining cutaneous blood flow and oxygen supply and facilitating the healing of pressure ulcers.
The major limitation of the present study lies in the fact that we measured only circulating markers. However, immune cells in tissue and plasma do not necessarily reflect the same phenotype and may have differing responsiveness. Mechanistic studies that include the assessment of tissue physiology are clearly necessary in order to determine the mechanism(s) by which n-3 fish oil and micronutrients may facilitate the healing of pressure ulcers in ICU patients.
In summary, nutritional support in general may play an important role in the treatment of wound healing and pressure ulcers, and specific nutrients may further modulate the efficacy of nutrition. Our findings suggest that n-3-LC-PUFA may have a positive effect on wound healing and that this effect may be mediated by adhesion-dependent mechanisms. We believe that our findings are novel and expand the therapeutic repertoire of fish oil in the critically ill.
Acknowledgements
M. T. was responsible for the conception, design, data collection, interpretation of the results, writing and reviewing of the manuscript. B. S., H. S. and R. A. contributed to the conception and design of the research, reviewing of the manuscript and interpretation of the results. Y. Z. and E. R. were responsible for the collection and interpretation of the data. J. C. was responsible for the writing and reviewing of the manuscript and interpretation of the results. P. S. contributed to the conception and design of the research, design, writing and reviewing of the manuscript and interpretation of the results. The authors declare that there is no conflict of interests. No funding was received for this study.


