


INTRODUCTION
Glaciation of mainland Australia during the late Pleistocene was restricted to the highest elevations of the Snowy Mountains only. Ice occupied cirques briefly four times between 59–16 ka (Barrows et al., Reference Barrows, Stone, Fifield and Cresswell2001). Periglacial processes dominated at lower altitudes and produced a wide variety of landforms ranging from large-scale block fields to smaller-scale solifluction deposits at the lowest elevations (Galloway, Reference Galloway1965; Barrows et al., Reference Barrows, Stone and Fifield2004). The lower limit of periglacial activity is currently poorly known, but represents an important geomorphic and biogeographic boundary associated with landscape-scale change.
Periglacial landforms hold considerable potential to provide valuable information on past temperature during glacial periods. Galloway (Reference Galloway1965) inferred that the lower limit of periglacial solifluction in Australia was 600–1300 m lower than present during the last glaciation. From the relationship with the treeline, Galloway (Reference Galloway1965) estimated that the Southern Tablelands of southeastern Australia were ~9–11°C cooler than present. This was despite the snowline being only ~600 m lower in altitude (Galloway, Reference Galloway1963). The major limitation of Galloway's (Reference Galloway1965) study was that no low-altitude sites were described or dated, making it difficult to evaluate. It has been noted that similar slope deposits can form in non-periglacial environments (Galloway, Reference Galloway1965; Cecil, Reference Cecil1981). This observation led to skepticism of the usefulness of the climatic inferences made from these deposits (Wasson, Reference Wasson1979a). However, Galloway (Reference Galloway1965) noted that the deposits became more widespread and better developed with elevation, which strongly supports a periglacial origin. Slee and Shulmeister (Reference Slee and Shulmeister2015) supported this finding using remote sensing mapping of block deposits assuming they are periglacial.
Periglacial deposits are particularly difficult to date because of the rarity of organic material for radiocarbon dating and because they are generally unsuitable for other dating techniques. Attempts using radiocarbon have shown that periglacial deposits formed during the last glacial cycle in southeastern Australia. Caine and Jennings (Reference Caine and Jennings1968) argued, based on the formation of periglacial blockstreams, that mean temperature was 6°C colder sometime after 35,000 14C yr BP. Costin and Polach (Reference Costin and Polach1971) and Costin (Reference Costin, Mulvaney and Golson1971) provided dating on putative periglacial slope deposits and estimated that summer temperature was 8–14°C colder than present after 25,000 14C yr BP, following a similar line of reasoning to Galloway (Reference Galloway1965). Barrows et al. (Reference Barrows, Stone and Fifield2004) showed that high-elevation block deposits were active during the last glacial cycle, with a concentration of activity at 22.6 ± 0.5 ka.
Because of ambiguity introduced due to convergence in form between periglacial and non-periglacial slope deposits, there is a need to clarify which landforms characterize the lower boundary of the periglacial climate zone in Australia and in what climate they formed. This paper revises the lower periglacial limit and timing of Pleistocene periglacial activity on the Southern Tablelands in southeastern Australia. We re-examine sites with periglacial landforms at low elevations and explore their relationship with aspect, slope, wind re-distributed snow, and solar radiation. To date the deposits, we use three approaches. First, we extracted elemental carbon from detrital charcoal for radiocarbon dating. Second, we applied both single grain and single aliquot optically stimulated luminescence dating of alluvial fan and valley fill sediments associated with the periglacial deposits. Third, profile dating using the cosmogenic nuclide 10Be was applied on the oldest deposits. We propose a new relationship between the observed periglacial limit and climate. Based on the elevations of the low-altitude sites, we provide an estimate of mean winter temperature change during the last glacial maximum in inland Australia.
REGIONAL GEOMORPHOLOGY
The Southern Tablelands of southeastern Australia are characterized by high, flat country (~550–770 m above sea level [asl]) rising to the uplands of the Australian Alps (~1000–2200 m asl) (Fig. 1). Broad alluvial fans and bajadas commonly flank the foothills, which merge into wide plains, pediment basins, and valleys. The alluvial fans, and the corresponding valley-fill sediments include coarse, gravelly, inorganic units (van Dijk, Reference van Dijk1959). Often overlying the fans and valley fills, or inset within, are fine-grained, organic-rich sediments with an inception that dates to the end of the Pleistocene (Prosser et al., Reference Prosser, Chappell and Gillespie1994). These contrasting deposits indicate radically different depositional environments, reflecting significant climate change during the Pleistocene.
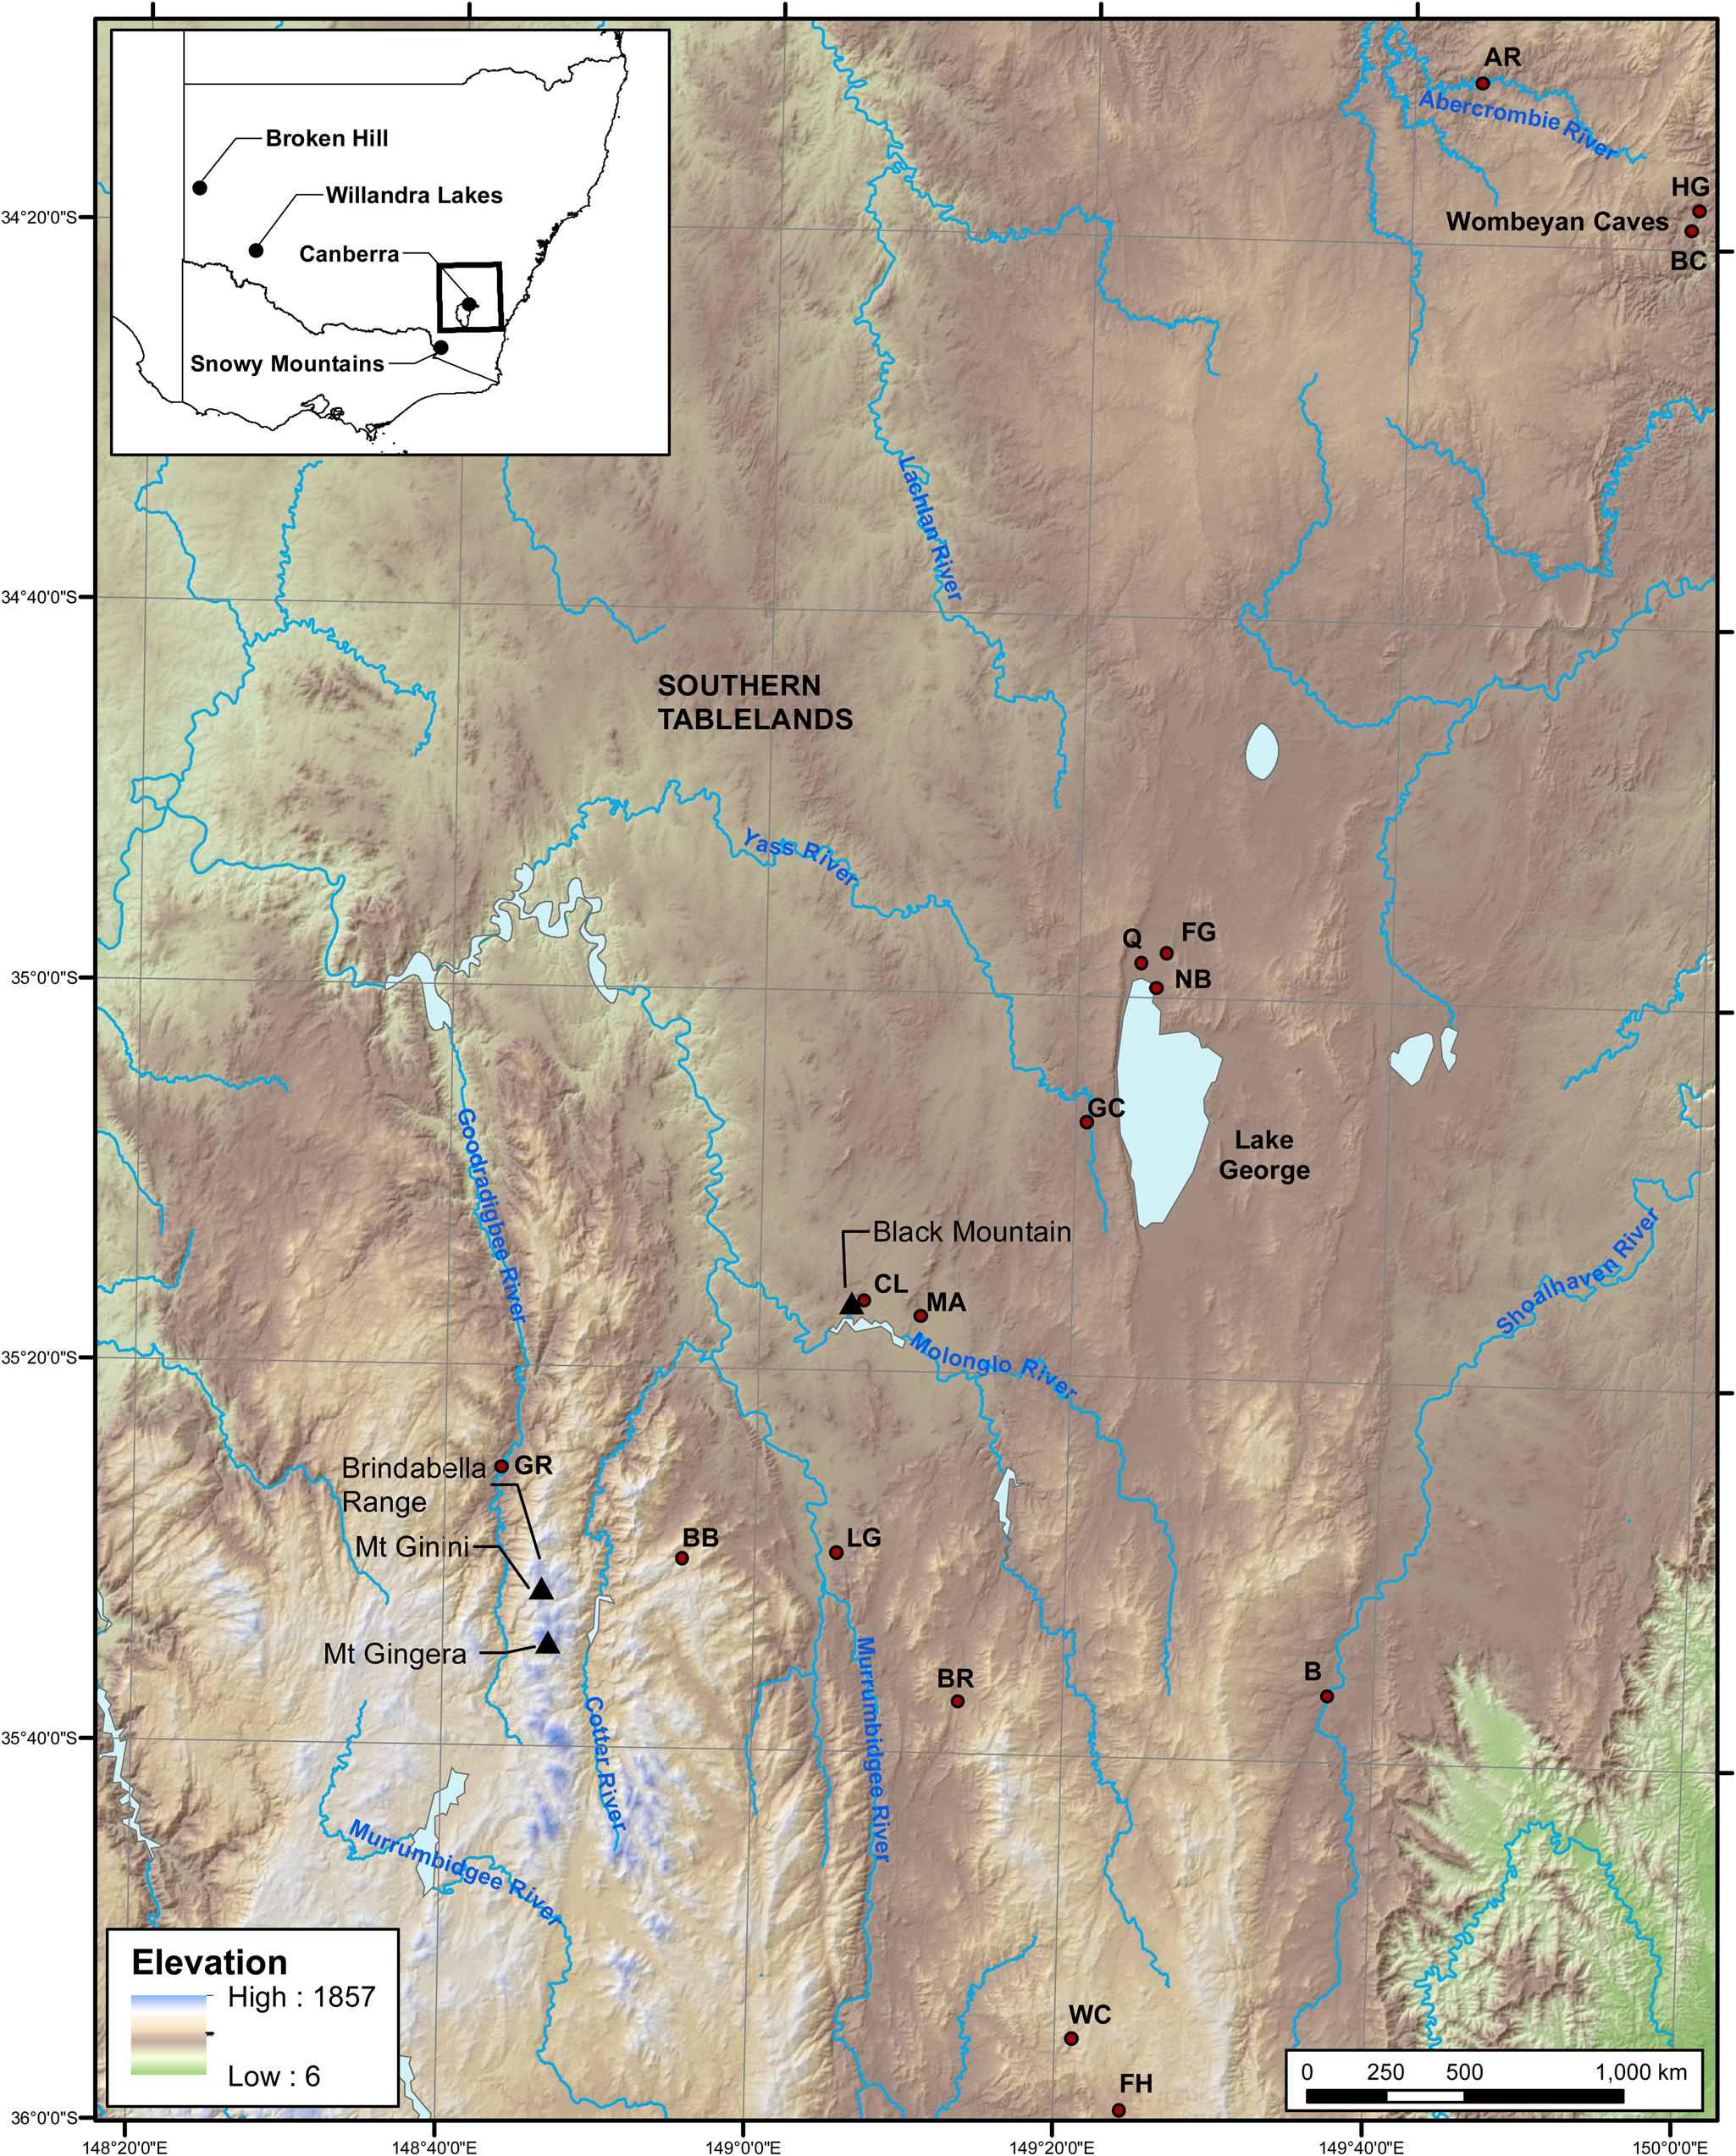
Regional map of the Southern Tablelands (AR = Abercrombie River site; B = Ballalaba); BB = Billy Billy Creek; BC = Basin Cave, Wombeyan Caves; BR = Burra; CL = CSIRO library; FG = Fern Gully; FH = Frogs Hollow; GC = Grove Creek; GR = Goodradigbee River; HG = Hockey Gully; LG = Lanyon Gully; MA = Mount Ainslie/Campbell fan; NB = North Barney Fan; Q = Lake George quarry; WC = Wangrah Creek.
Previous work mostly has focused on soils as stratigraphic units across these alluvial fans and valley fills, with secondary attention to the sedimentary features. Soils have been partially stripped from higher elevations onto the fans and fills at lower elevation. Soils have developed on the inactive fan surfaces. van Dijk (Reference van Dijk1959) recognized four major episodes and Kellett (Reference Kellett1981) described five major episodes of erosion and deposition alternating with periods of pedogenesis. These processes were widespread, especially affecting the steeper upper slopes. Sand sheets adjacent to the Murrumbidgee and Molonglo rivers (Fig. 1) indicate rivers with seasonally exposed sandy beds and low riparian vegetation. Loess was also a contributor to the soils of the region (Kellett, Reference Kellett1981). In contrast, pre-British settlement erosion was limited to slopewash because of forested upper slopes and thick vegetation cover on valley floors (Prosser et al., Reference Prosser, Chappell and Gillespie1994). In this study, we focused on reviewing landforms and their timing of development at four key locations: Black Mountain, the Brindabella Range, Wombeyan Caves, and Lake George (Fig. 1). Radiocarbon dates mentioned in the text are listed in Table 1.
Radiocarbon dates and ages. Half-life is corrected on the samples from Costin and Polach (Reference Costin and Polach1973); Median probability and the 68% confidence interval; ANUA samples are beyond the calibration range and are infinite ages.
Black Mountain
Black Mountain is a low-altitude mountain (812 m) composed of Early Silurian quartz-rich Black Mountain Sandstone (Abell, Reference Abell1991) with local relief of 300 m. The mountain has thin stony soils on the upper slopes and is flanked by broad fan complexes (Fig. 2). The modern environment is characterized by low sediment production from the hillslopes and pedogenesis. Eucalyptus grass/shrub forest and woodland stabilize the hillsides and tussock grassland (= ”swampy meadows” depositional environment of Prosser et al., Reference Prosser, Chappell and Gillespie1994) on the lower parts of fan toes and along drainage lines trap fine-grained, organic-rich sediments. There is no current aeolian activity. All streams are ephemeral and storm events are responsible for incision into the fans and valley fills. Debris flows on the Southern Tablelands are rare, except where vegetation is sparse because of bushfires, clearing, or grazing where they can be triggered by intense rainfall events (Wasson, Reference Wasson1974; Nyman et al., Reference Nyman, Sheridan, Smith and Lane2011).
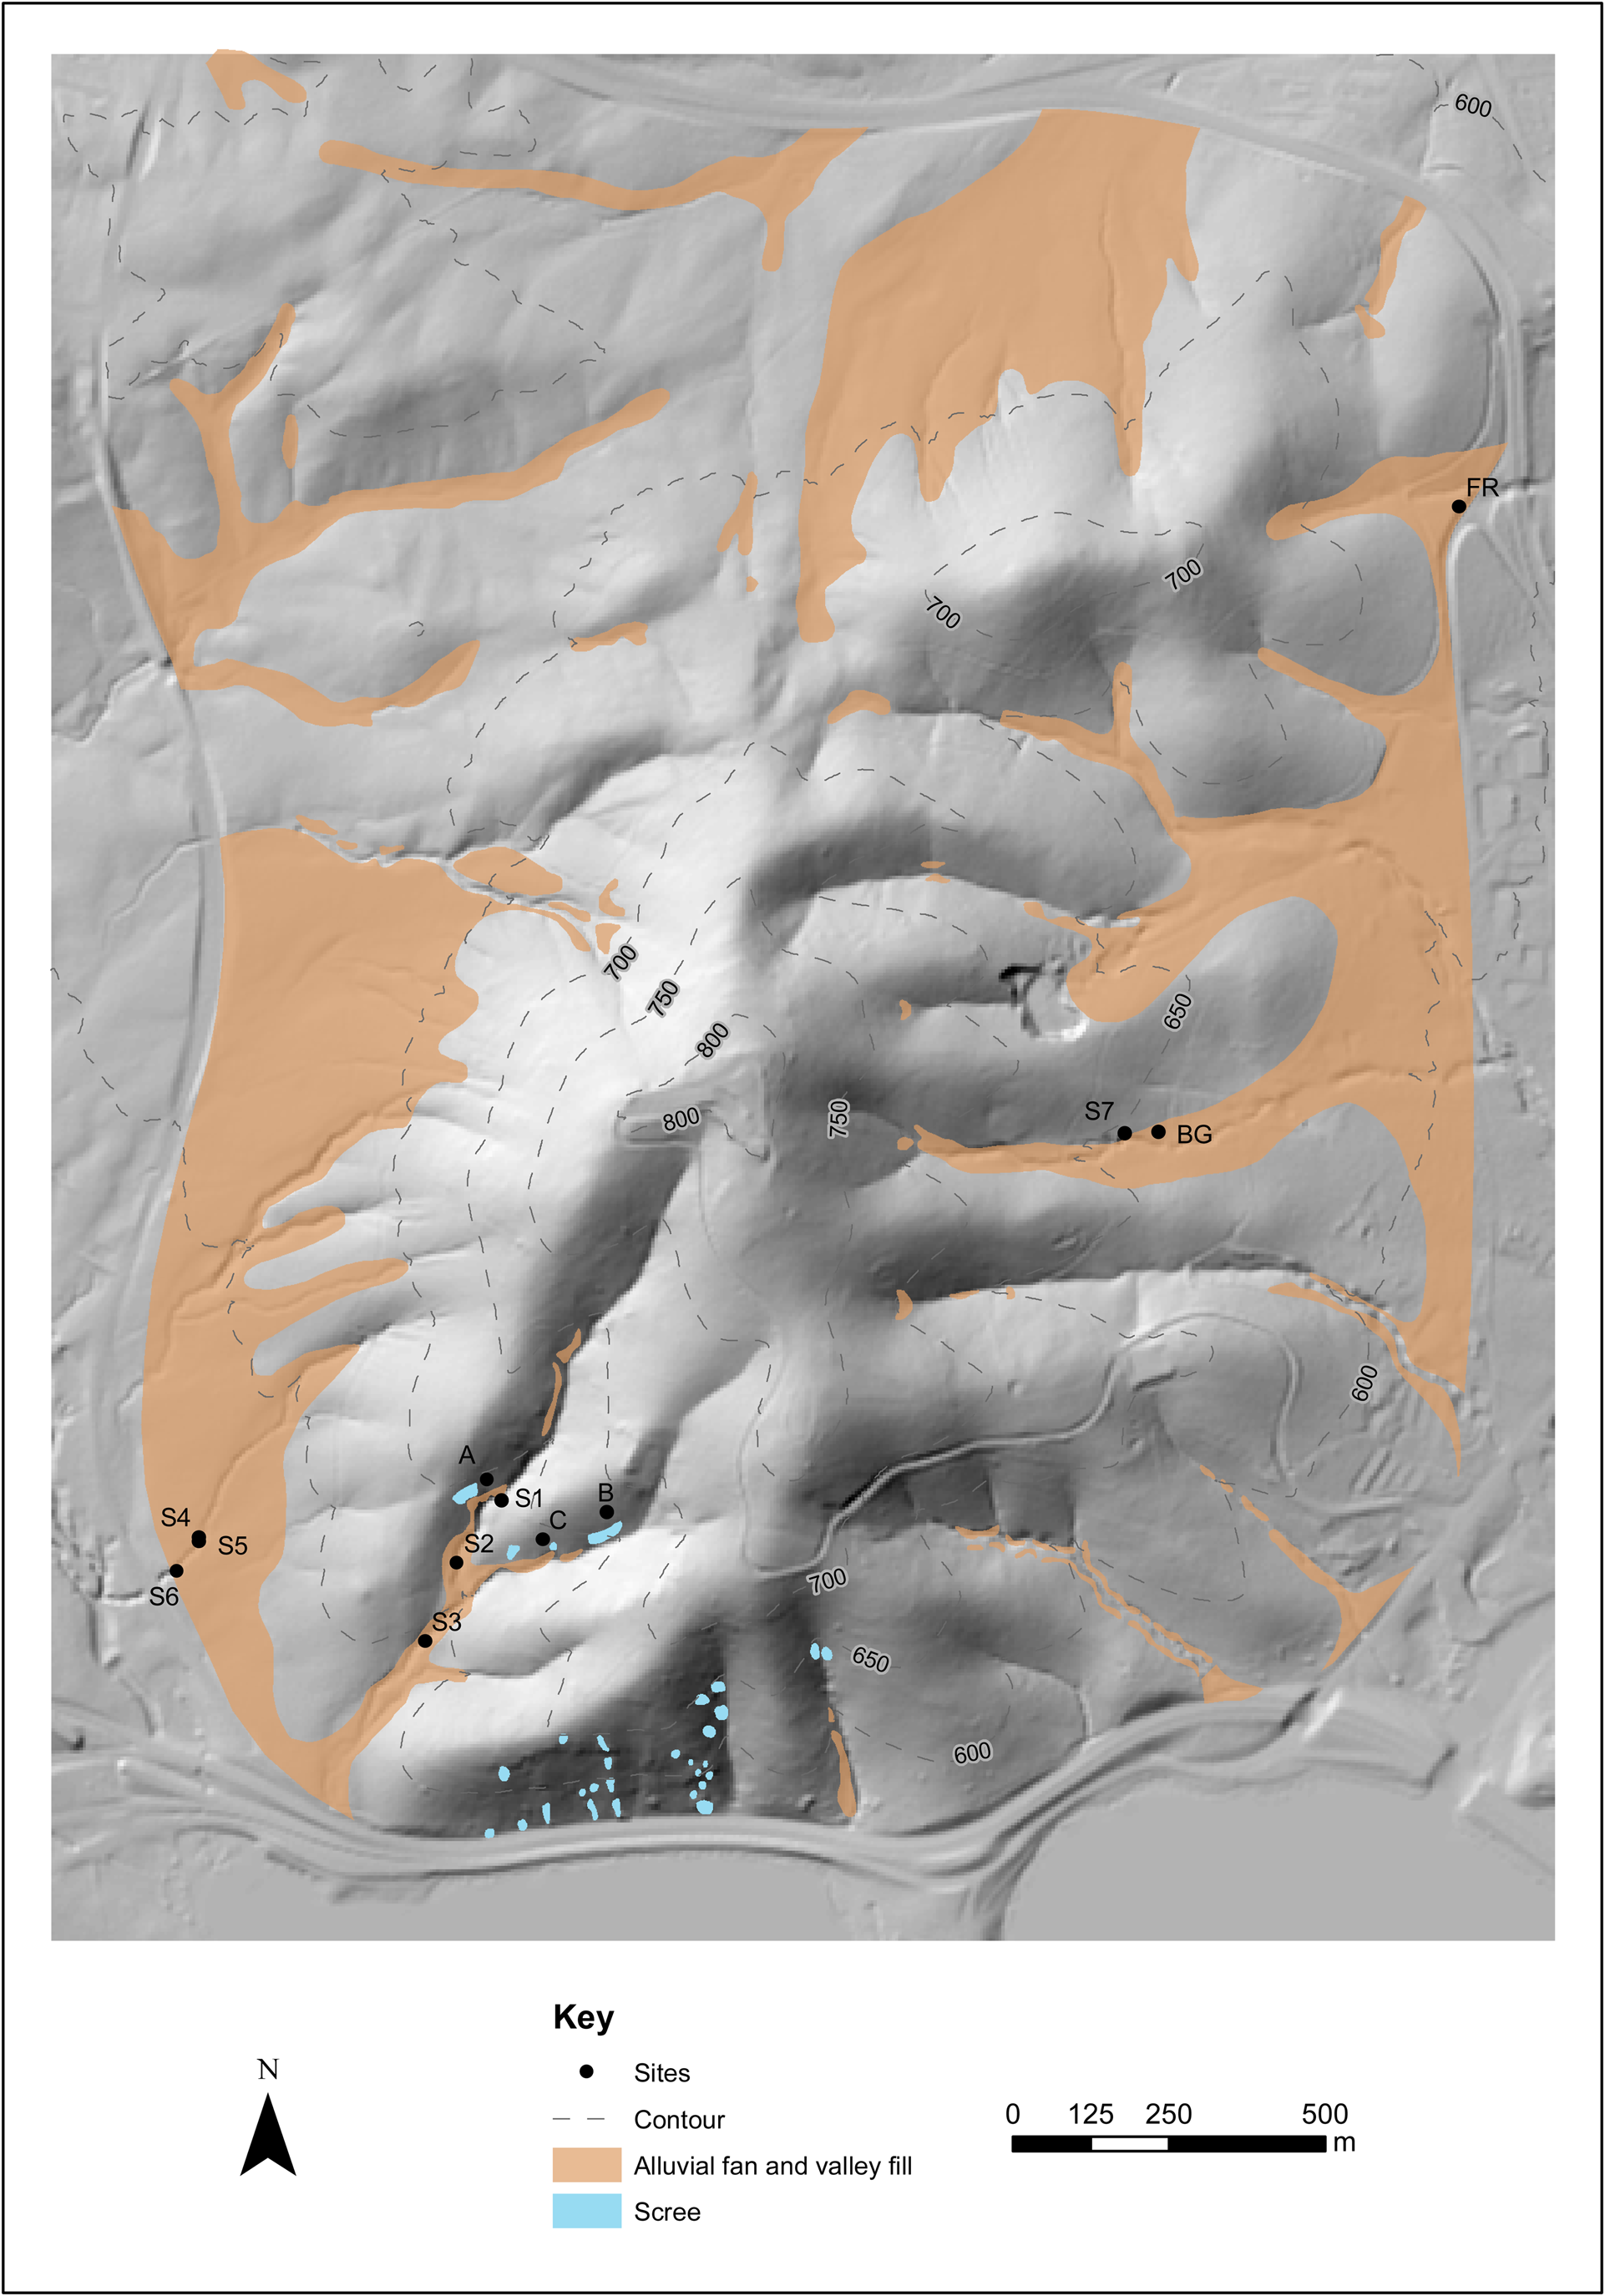
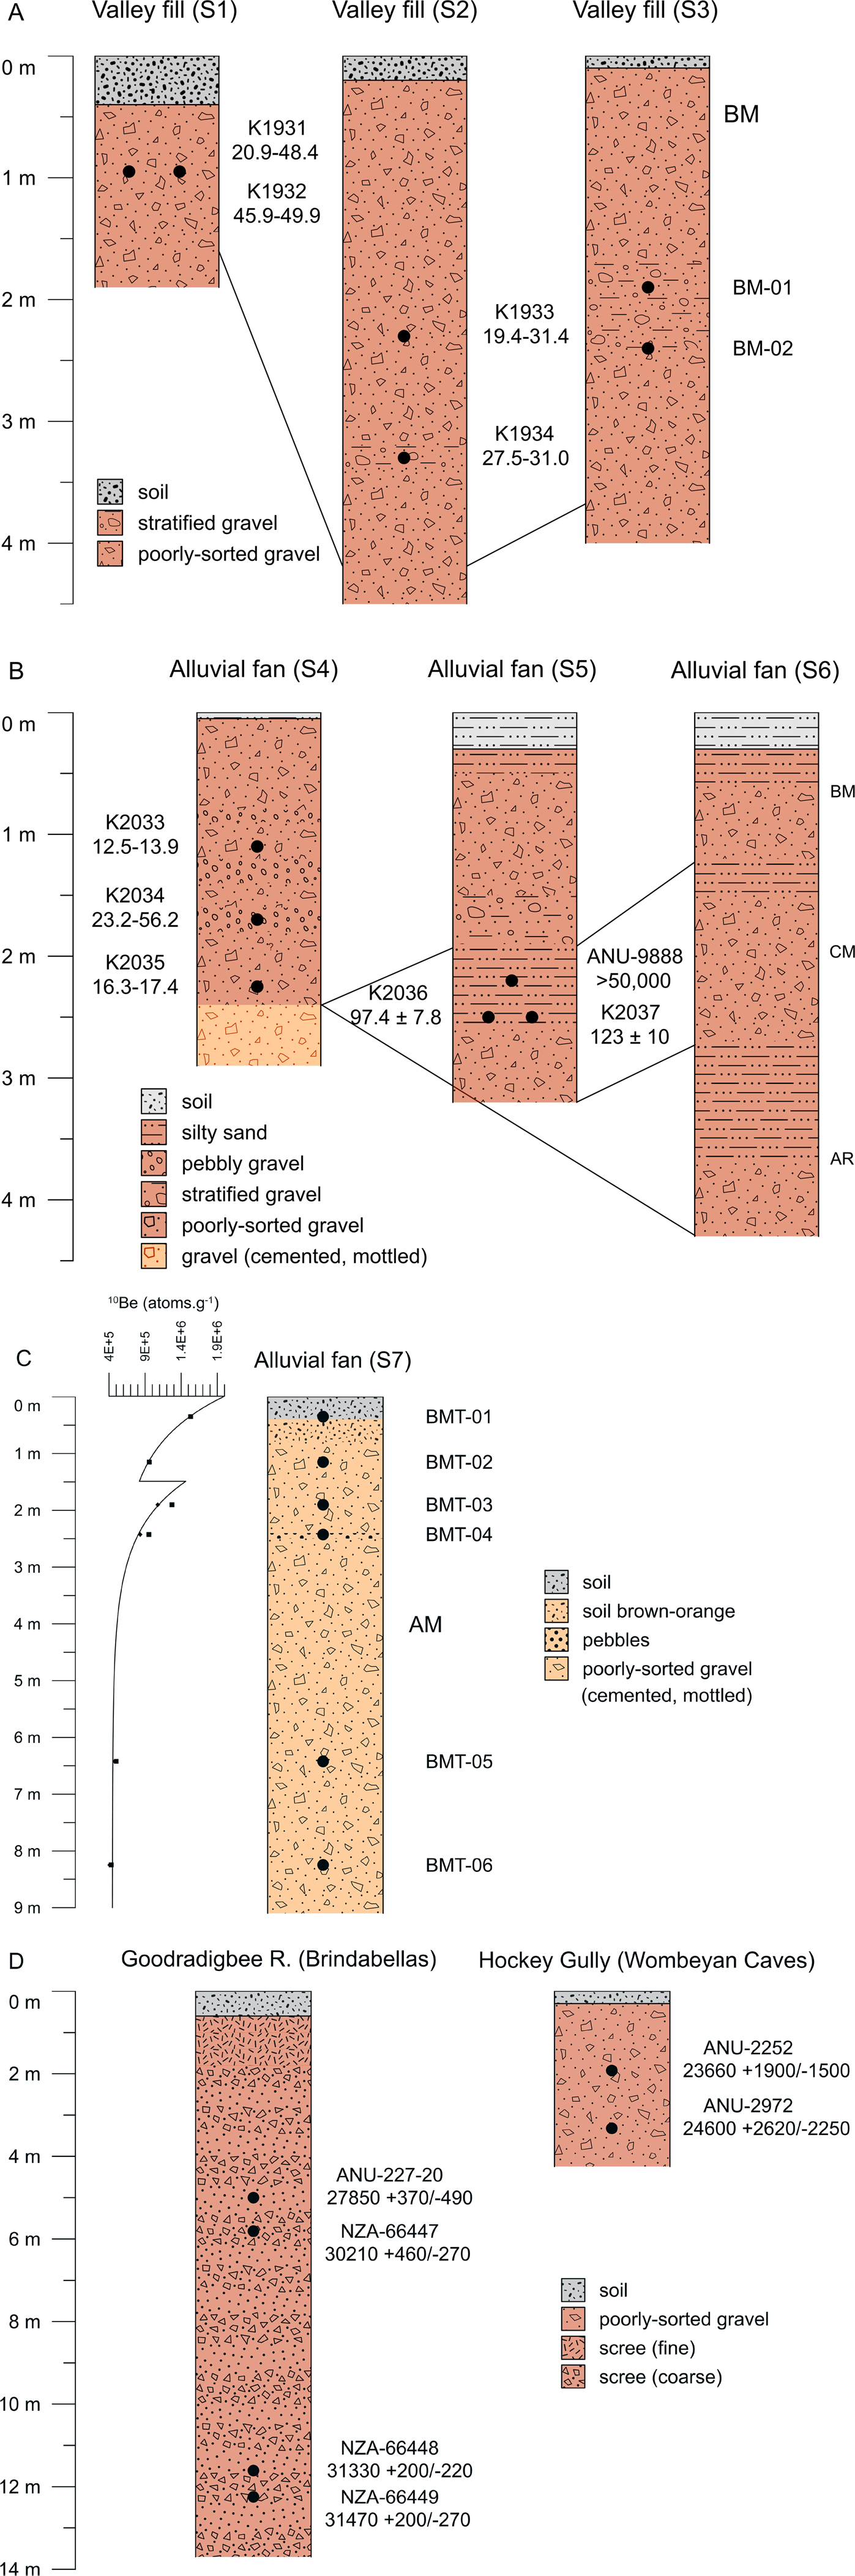
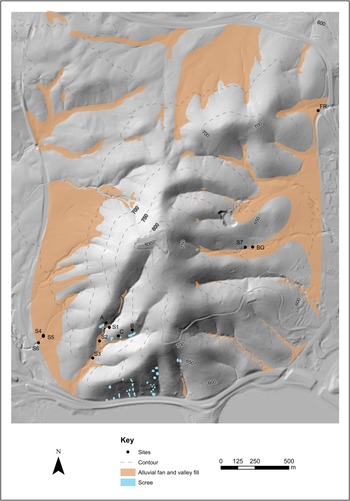
Geomorphic map of Black Mountain. The major geomorphic features are alluvial fans and bajadas, alluvial valley fills, and scree slopes. Sample sites S1–S7 are shown. (BG = Botanic Gardens; FR = Firth Road). 3 m LiDAR DEM was supplied by the ACT Planning and Land Authority, Canberra (captured November 2004).
A considerable history of erosion is indicated by a drill hole at 580 m on the eastern fan of Black Mountain, which revealed 40.5 m of colluvium underlain by alluvial sediments (Henderson, Reference Henderson1986). To investigate the age of the soil mantle, Pillans and Bourman (Reference Pillans and Bourman1996) conducted a palaeomagnetic survey at three sites on Black Mountain (Fig 2). At site FR (Fig. 2), strongly weathered alluvial fan gravels up to 4 m deep had reversed polarity and must pre-date the Brunhes-Matuyama boundary (788 ka). Pillans and Bourman (Reference Pillans and Bourman1996) suggested the site was equivalent to the level dated by Costin and Polach (Reference Costin and Polach1973) as late Pleistocene 820 m to the south. Results from the Botanic Gardens (Fig. 2; site BG) were of lower quality and showed both reversed polarity and normal polarity, consistent with a weathering imprint predating the Brunhes/Matuyama boundary, possibly back to the Miocene (B. Pillans, personal communication, 1995). Samples from a fan unit on the western side (Fig. 2; site S6) all showed stable, normal polarity magnetizations, despite both thermal and alternating field demagnetization techniques (B. Pillans, personal communication, 1995).
Costin and Polach (Reference Costin and Polach1973) proposed that the fan on the eastern flank experienced periglacial activity during the late Pleistocene. They described 3 layers in a 3 m section on the eastern fan at 590 m (100 m east of Figure 2 at 149.1125°E, 35.2728°S). The uppermost clast-rich unit was ~2 m thick and overlaid ~1 m of a middle unit with fewer clasts. Together, these two units overlaid a truncated mottled, clay-rich, relatively clast-free paleosol. Within the middle unit was an organic-rich lens from which three charcoal samples ranging in age from 29,560–34,390 cal yr BP were taken. Costin and Polach (Reference Costin and Polach1973) interpreted the organic material as originating from the lower unit because it contained reworked phytoliths. A similar age of 36,270 +1110/−1510 cal yr BP was found by Walker and Gillespie (Reference Walker and Gillespie1978) for the lowest of two buried paleosols in colluvium 5.5 km to the east in a similar setting on the eastern flank of Mount Ainslie (Fig. 1). South of Black Mountain at Lanyon (LG; Fig. 1), a gully has eroded up the southern side of a 1-km-long, low-angle, inactive alluvial fan adjacent to the Murrumbidgee River, revealing a sequence of fan and valley fill units. Gillespie et al. (Reference Gillespie, Prosser, Dlugokencky, Sparks, Wallace and Chappell1992) dated the base of one of the units to 21,320 +370/−350 cal yr BP. Further south at Wangrah Creek (Fig. 1), slope deposits and alluvial deposits up to 10 m thick are dated at 28,930 +300/−310 cal yr BP and 36,630 +530/−560 cal yr BP, respectively (Prosser et al., Reference Prosser, Chappell and Gillespie1994). Together, these ages date regional slope instability to the late Pleistocene.
Brindabella Range
Periglacial deposits, including blockstreams, are common along the flanks of Mt Ginini (1762 m) and Mt Gingera (1855 m) above the Cotter River in the Brindabella Range (Fig. 1). Low-altitude scree slopes occur on east-facing slopes of the Goodradigbee River (site GR). This site, first mentioned in Costin and Polach (Reference Costin and Polach1973), at 685 m is significant, being the best example of a stratified scree slope on mainland Australia. Described as a “grèzes litées,” it has rhythmically deposited layers of clasts (Fig. 3C, D). Southeast of here, organic material recovered from slope deposits at Billy Billy Creek (1150 m) (Fig. 1) date a period of slope instability at 20,690 +260/−280 cal yr BP (Walker and Gillespie, Reference Walker and Gillespie1978).
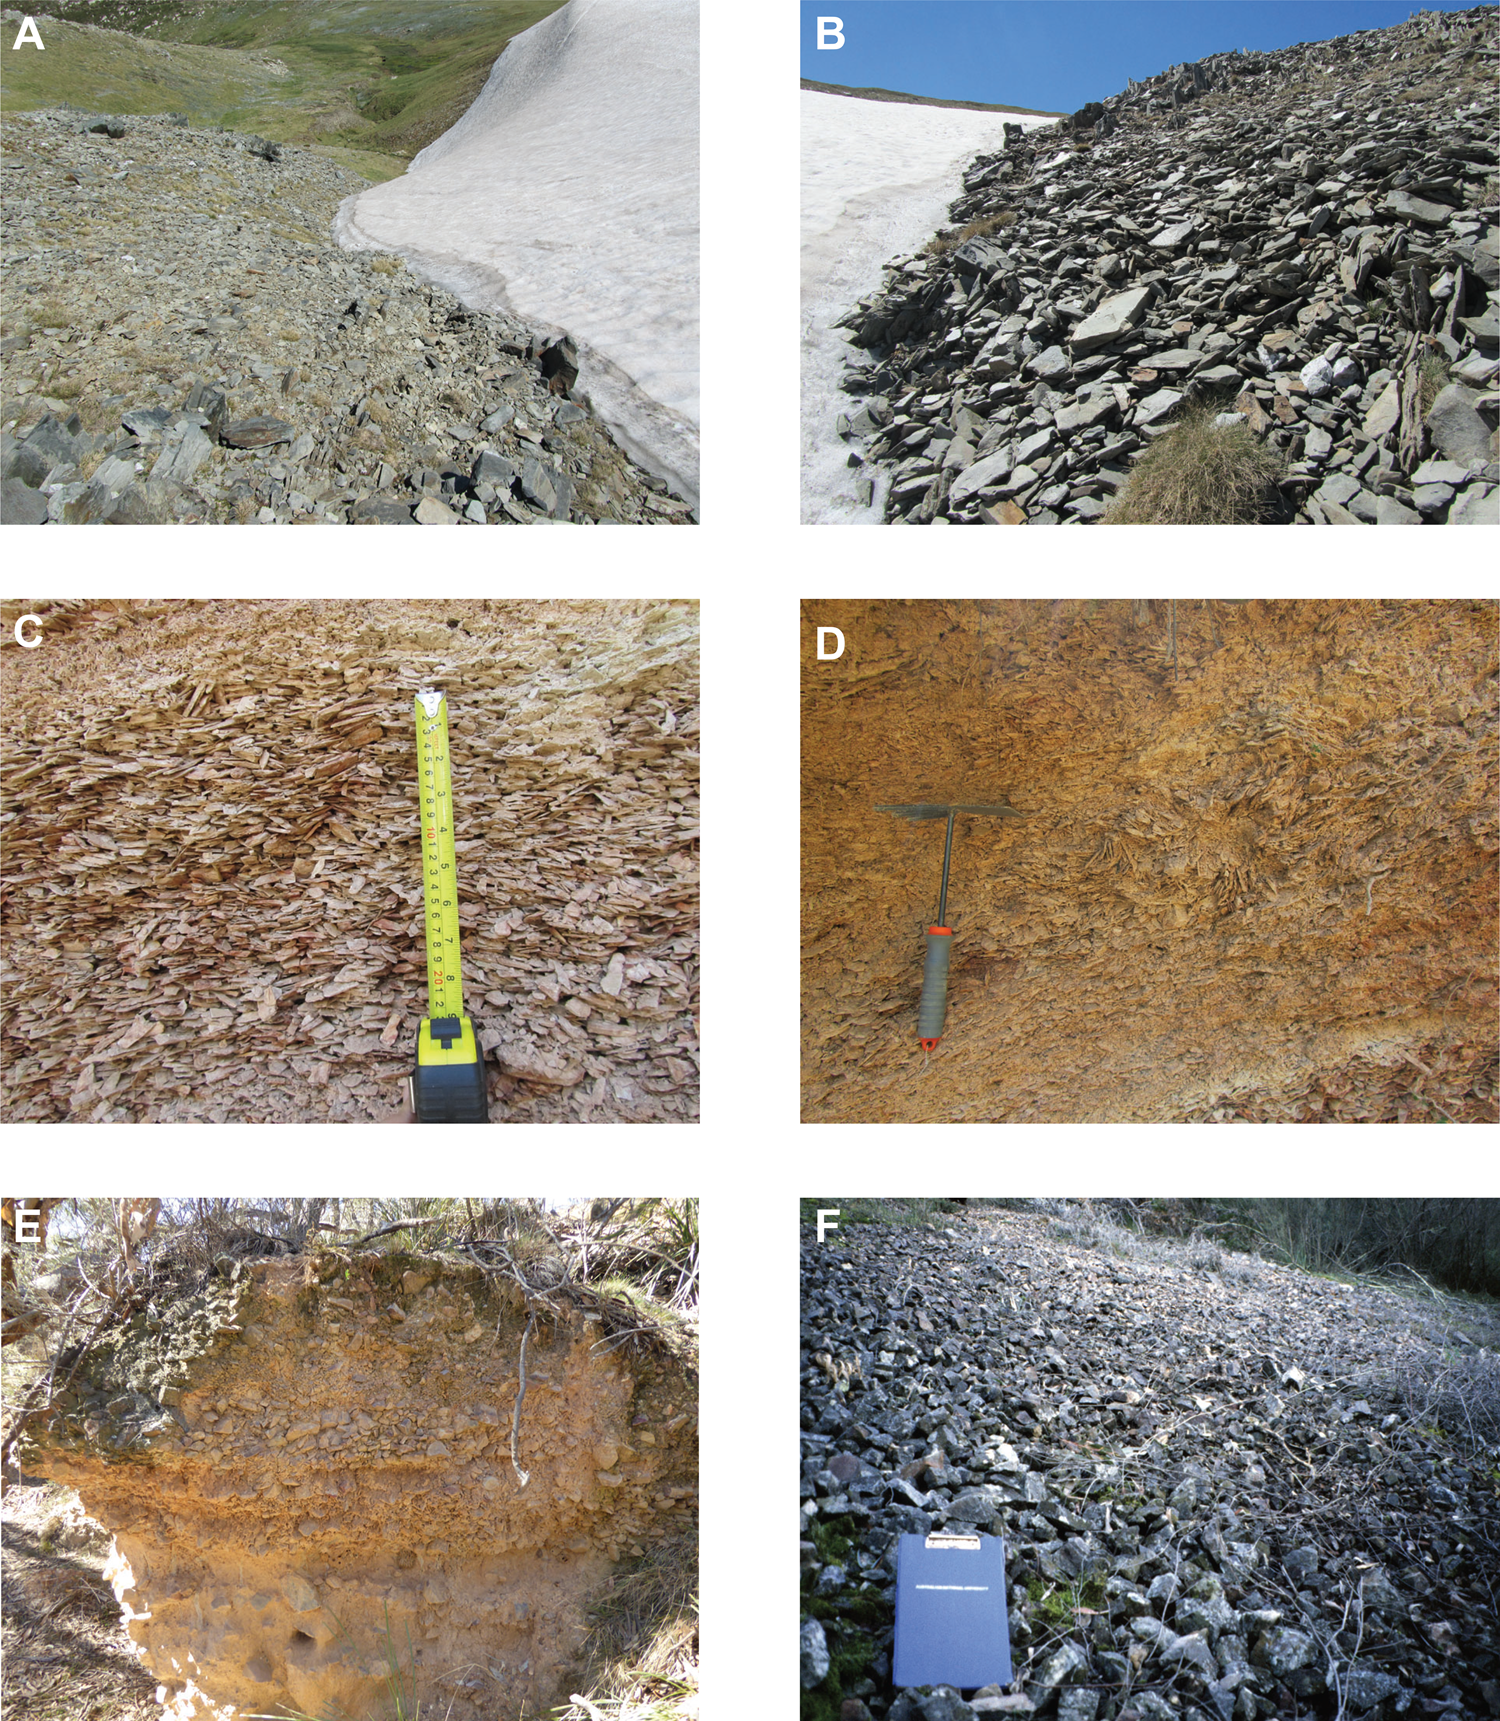
Key sites in the Snowy Mountains and Southern Tablelands. (A) Snowy patch to the south of Mt Twynam, Snowy Mountains. Frost cracked debris lies in the foreground and not the sediment valley fill below the snow patch. (B) Same site as A, showing scree slope. (C) Goodradigbee scree slope section. (D) Same site as C, showing involutions and contorted bedding near the top of the section. (E) Site S5 on the SW alluvial fan of Black Mountain. (F) Scree slope A on Black Mountain.
Wombeyan Caves
The Wombeyan Caves lie northeast of Black Mountain (Fig. 1) and is the only location where a low-altitude solifluction deposit has been described. A deposit composed of pebble- to cobble-sized angular clasts ~7 m thick is exposed in the Basin Cave lower entrance (Gillieson et al., Reference Gillieson, Spate and Head1985). The deposit is crudely stratified and shows strong orientation of clasts composed of marble, which does not normally weather to platy fragments. A charcoal band at ~3.5 m was radiocarbon dated at 32,140 +1220/−1110 cal yr BP. The date indicates that the upper part of the deposit formed during the late Pleistocene. The cave entrance lies at 660 m, a similar altitude to the flanks of Black Mountain. Solifluction is the only likely geomorphic process in this setting because if moving water were involved to create the orientation, the sediment would have infilled the cave.
About 2 km north of Basin Cave in Hockey Gully (Site HG; 650 m), and other sites nearby, stratified slope deposits are exposed in the valley walls. These are composed of angular rock fragments from fine-gravel to cobble size, crudely laid at an angle of ~20° in downslope beds, often interbedded with fine-grained material and with some openwork texture (Jennings et al., Reference Jennings, James, Montgomery, Dyson, Ellis and James1982). These have the form of periglacial slope deposits and they date to the coldest part of the last glacial cycle (23,660 +1900/−1500 cal yr BP) (Jennings et al., Reference Jennings, James, Montgomery, Dyson, Ellis and James1982). There are also terraces 3–5 m above present creek level recording debris input from slopes resulting in an increase in valley floor base level (Jennings et al., Reference Jennings, James, Montgomery, Dyson, Ellis and James1982).
Lake George
Galloway (Reference Galloway1965) drew attention to a series of shorelines and alluvial fans well above the historic lake level of Lake George (Fig. 1). He deduced that at least one of the shorelines was formed during the Pleistocene, later verified by dating (Galloway, Reference Galloway1967). Coventry (Reference Coventry1976) provided a more detailed lake level history and noted extensive fan development in the Lake George basin. A date of 31,100 +2620/−2360 cal yr BP from the North Barney fan (Fig. 1) dates considerable slope instability at 690 m (Coventry and Walker, Reference Coventry and Walker1977). At Fern Gully (Fig. 1), a similar age of 30,990 +790/−940 cal yr BP provides a maximum age for slope instability (Coventry, Reference Coventry1976). On the west side of Lake George at Shingle House Creek/Grove Creek, charcoal from a buried paleosol had a radiocarbon age of 31,130 +560/−730 cal yr BP (Walker and Gillespie, Reference Walker and Gillespie1978). This soil underlies a unit considered to be equivalent to the extensive valley fill deposits around the Southern Tablelands and contemporaneous with fan deposits in the Lake George catchment.
Galloway (Reference Galloway1965) identified ice wedge-like structures in a quarry section through a beach ridge on the north side of Lake George (680 m) (Fig. 1). Galloway (Reference Galloway1967) dated charcoal fragments from within the beach ridge to 18,370 +370/−270 cal yr BP. Hughes et al. (Reference Hughes, Shawcross, Sullivan and Spooner2014) dated the same beach ridge 2 km farther north. Depending on assumed water content and dose rates, the ridge formed between 15 ka and 27 ka. The lake at the time of spit formation would have been up to ~12 m deep. If the structures are ice wedges, the paleoclimatic implications of permafrost at such low elevations in eastern Australia are profound, but further study of this site is needed before conclusions can be drawn.
Crack-like structures have been found elsewhere at low altitude. Chartres and Costin (Reference Chartres and Costin1981) documented buried soil cracks at two sites in the upper Shoalhaven River Valley, at 674 m altitude, 73 km SE of Lake George (Fig. 1). The sand-filled, wedge-like structures are arranged in a polygonal pattern, on average 1 m apart and 1.75 m deep over a fluvial terrace. The age of formation is limited by radiocarbon dates in a 5 m higher terrace to a maximum of 25,500 +520/−550 and 25,030 +870/−850 cal yr BP. Pollen extracted from the clay is dominated by grasses, sedges, and composites, with few eucalypts, indicating a generally open habitat with few trees (Chartres and Costin, Reference Chartres and Costin1981).
METHODS
Scree Slopes as Indicators of Climate Change
Frost cracking is the result of ice segregation in partially frozen rock during prolonged periods below 0°C in a sustained subzero temperature gradient with available moisture (Hallet et al., Reference Hallet, Walder and Stubbs1991; Murton et al., Reference Murton, Peterson and Ozouf2006). It is also assisted in saturated rocks by the 9% volume expansion of water to ice, especially in climates with a large number of high amplitude frost cycles with temperatures a few degrees below zero (Hallet et al., Reference Hallet, Walder and Stubbs1991). Crack growth can be accelerated by the input of water at the rock surface (Wettlaufer and Worster, Reference Wettlaufer and Worster1995; Matsuoka, Reference Matsuoka2001), for example during spring melt or in autumn, and by warming of the rock surface during summer if the subsurface is still below freezing (Hallet et al., Reference Hallet, Walder and Stubbs1991). Efficient delivery of water results in faster ice segregation growth, greater stress within cracks, and therefore more intense frost cracking (Hales and Roering, Reference Hales and Roering2007). The climate most likely to produce frost shattering is therefore one with sustained cold temperatures below freezing during winter, with a warm summer.
Fracturing is most effective not at the 0°C threshold, but in a lower temperature window (Anderson, Reference Anderson1998). This range depends on the mechanical properties of the rock and varies between −2 to −15°C (Walder and Hallet, Reference Walder and Hallet1985). The freezing point of pore water decreases with decreasing porosity (Matsuoka, Reference Matsuoka2001). Rocks with low porosity typically have higher mechanical strength, and therefore require lower temperatures to break. On theoretical grounds, Walder and Hallet (Reference Walder and Hallet1985) calculated a range of −4 to −15°C for low-porosity rocks, such as granite. Hallet et al. (Reference Hallet, Walder and Stubbs1991) measured −3 to −6°C in a medium-porosity rock (sandstone). High-porosity rocks, such as tuff, may have an upper limit closer to 0°C (Matsuoka, Reference Matsuoka2001).
The term “scree” is used here to describe accumulations of unconsolidated, generally fine (gravel or cobble size), angular rock debris on a slope. Scree is often used as a synonym of talus, but is commonly used in the literature associated with periglacial settings. We use it here in a plural sense to include coarse debris-mantled slopes (‘scree slopes’) of frost-cracked blocks where processes are operating in addition to rockfall to form the deposit. Processes common in periglacial landscapes, such as surface water flow, slush avalanching, and surface transport over snow, combine to produce a concave up form on large scree slopes with angles below the angle of repose. As noted by Pierson (Reference Pierson1982), scree is often only openwork at the surface. The term “talus” is used here in a restricted sense for an accumulation of open-work coarse debris beneath a cliff face where rockfall is the main depositional process and the debris is thick enough to mask the form of the slope beneath it. There is a form-process continuum between these extremes.
Aspect is an important controlling factor for marginal scree slope sites (south-facing slopes in the southern hemisphere), but is less important at higher elevations (Hales and Roering, Reference Hales and Roering2009). South-facing slopes receive less solar radiation, experience longer freezing periods, have less temperature variability, and achieve mean annual rock surface temperature of up to 6°C colder than a north-facing slope (Coutard and Francou, Reference Coutard and Francou1989). Therefore, screes tend to be better developed on shaded slopes. If minimum temperatures did not play a role in the formation of screes, then their distribution would be more like that for talus—independent of aspect or altitude and would be restricted to the location of cliffs with available accommodation space (Hales and Roering, Reference Hales and Roering2009).
Solifluction and frost cracking are important surface processes in the periglacial zone. Frost cracking and the production of coarse debris is only significant in Australia above ~1950 ± 50 m in the periglacial zone. The periglacial zone also corresponds to a major vegetation boundary. Trees are absent on southerly slopes above 1850 m and on the northerly slopes above 2050 m (Slatyer, Reference Slatyer and Good1989). Ground vegetation becomes increasingly less dense with bare ground emerging above 2000 m. Snow cover is important for 6 months of the year and persists in favorable locations of drift, sometimes lasting the whole year (Green and Pickering, Reference Green and Pickering2009). On the latter sites, vegetation growth is inhibited, and exposed ground is preferentially attacked by frost during summer and autumn when snow cover is absent (Fig. 3A, B). Most of the area above 1950 m is granite, with an enclave of shale and sandstone. Frost weathering breaks the sedimentary rocks into platy fragments and produces granular disintegration and small boulders in the granite. North-facing slopes are drier and have fewer scree slopes. It would therefore be expected that in the past, the lowest altitude of periglacial activity would be confined to southern and eastern aspects.
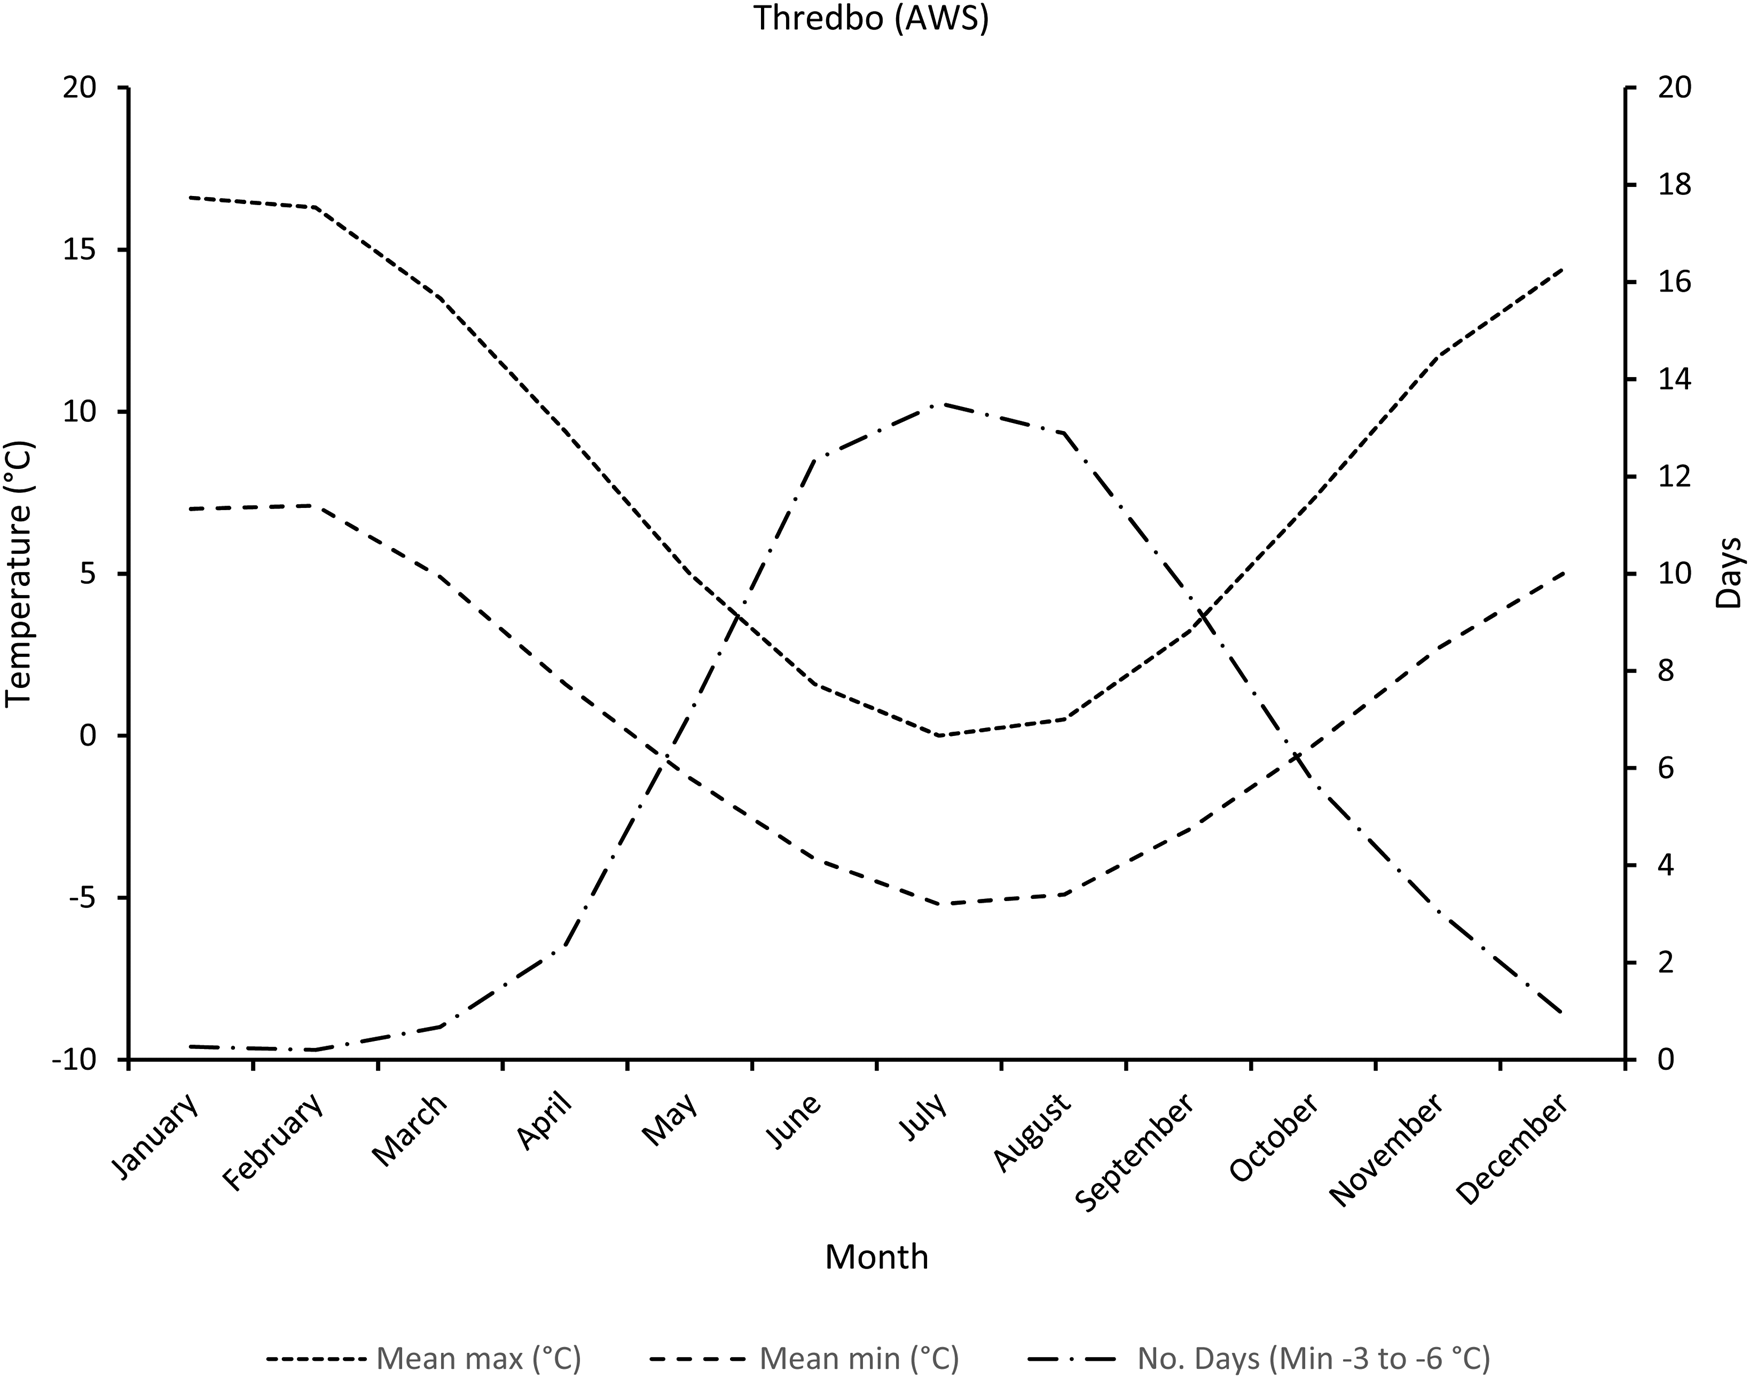
Only one weather station (Thredbo AWS) is sited within the periglacial zone at 1957 m (Bureau of Meteorology, 2020). Temperature data from this site is plotted in Figure 4. Mean minimum temperatures are <0°C for 6 months of the year and the number of frost cycles is high. The number of days per month when the daily minimum is ≤0°C totals 165 for the year. The number of hard frosts is significant, with the number of days with a minimum <−3°C totaling 112. The coldest minimum temperatures occur from June to August, and therefore most of the time within the frost cracking window is also in this period (Figure 4). Therefore, mean winter temperature (JJA) is a useful proxy for the occurrence of frost cracking. Elsewhere, it has been shown that at a similar mean annual temperature, frost-cracking peaks in late winter (Fahey and Lefebure, Reference Fahey and Lefebure1988). From regression of data from regional climate stations (Bureau of Meteorology, 2020), the mean winter (JJA) temperature at 1900 m, where frost cracking becomes significant, is −2.1°C. The ground temperature will be up to 2°C colder than this because measurements in Stevenson screens (Bureau of Meteorology, 2020) are >1.2 m above the surface (Linacre, Reference Linacre1977). The uncertainty in the frost cracking limit is quantified by the altitudinal variation in the limit of the frost shattering zone (± 50 m) as a function of the winter (average JJA) temperature gradient (6.4°C/km) (= ± 0.32°C) and the standard error of the regression to predict winter minimum temperature (average of JJA) at 1950 m (= ± 0.25°C), added in quadrature (= ± 0.4°C).
Thredbo weather station (071032 THREDBO AWS) mean maximum and minimum temperature data for the years 1966–2020. The number days when the minimum is between −3°C and −6°C is shown.
Mapping and logging
To determine the lower limit of periglacial activity, we mapped the surficial geomorphology of Black Mountain on a 3 m LiDAR digital elevation model (DEM). Our initial mapping used soil stratigraphy as a basis to determine relative age (Brewer, Reference Brewer1972). However, this proved problematic. Soils varied significantly along catenary lines and laterally because of aspect and topography. Surface sedimentary units, composed of variably weathered materials, also varied laterally in composition and in texture. The most common soil on the most widespread surface unit is a red-brown soil with weak to no textural difference between the A and B horizons. The degree of soil development is consistent with regional soil profiles dated to the late Pleistocene (Walker and Coventry, Reference Walker and Coventry1976; Walker and Gillespie, Reference Walker and Gillespie1978; Chittleborough et al., Reference Chittleborough, Walker and Oades1984). More highly weathered sediments with strongly developed soil characteristics are sporadically exposed at the surface in erosional settings, often truncated at the B horizon. Seven sites were chosen based on representativeness and exposure for further study on the southern and southwestern flank of the mountain (Fig. 2). These sites were logged to record the stratigraphy and sampled for OSL, radiocarbon dating, and profile dating using the cosmogenic nuclide 10Be (Fig. 5).
Dated stratigraphic sections in the Southern Tablelands. (A) Black Mountain alluvial valley fill sites; (B) Black Mountain alluvial fan sites; (C) Botanic Gardens site. Squares are original data; diamonds are corrected data (see methods); (D) Goodradigbee River and Hockey Gully sites. BM = Black Mountain Member; CM = Caswell Member; AR = Aranda Member; AM = Acton Member. OSL ages (K1931–K2037) are in thousand years (ka).
To better understand regional context, we included other putative low-elevation periglacial sites in the study. In the Brindabella Range, we logged a section on the Goodradigbee River scree slope and collected samples for radiocarbon dating. In Hockey Gully at Wombeyan Caves, a section was logged and a sample was collected for radiocarbon dating. At Lake George, photographs of a representative wedge-like structure were digitized and an orthophoto was created using structure from motion photogrammetry. The sedimentology and structure were logged to provide a basis for interpreting formation.
Radiation modeling and wind-redistributed snow
Although the distribution of periglacial landforms is controlled by temperature, they are also controlled by aspect and the length of time snow persists on the ground. To explore the effects of these two factors on the geomorphology of Black Mountain, we conducted radiation and snow-drift modeling to determine the association of landforms with shading and potential snow drift.
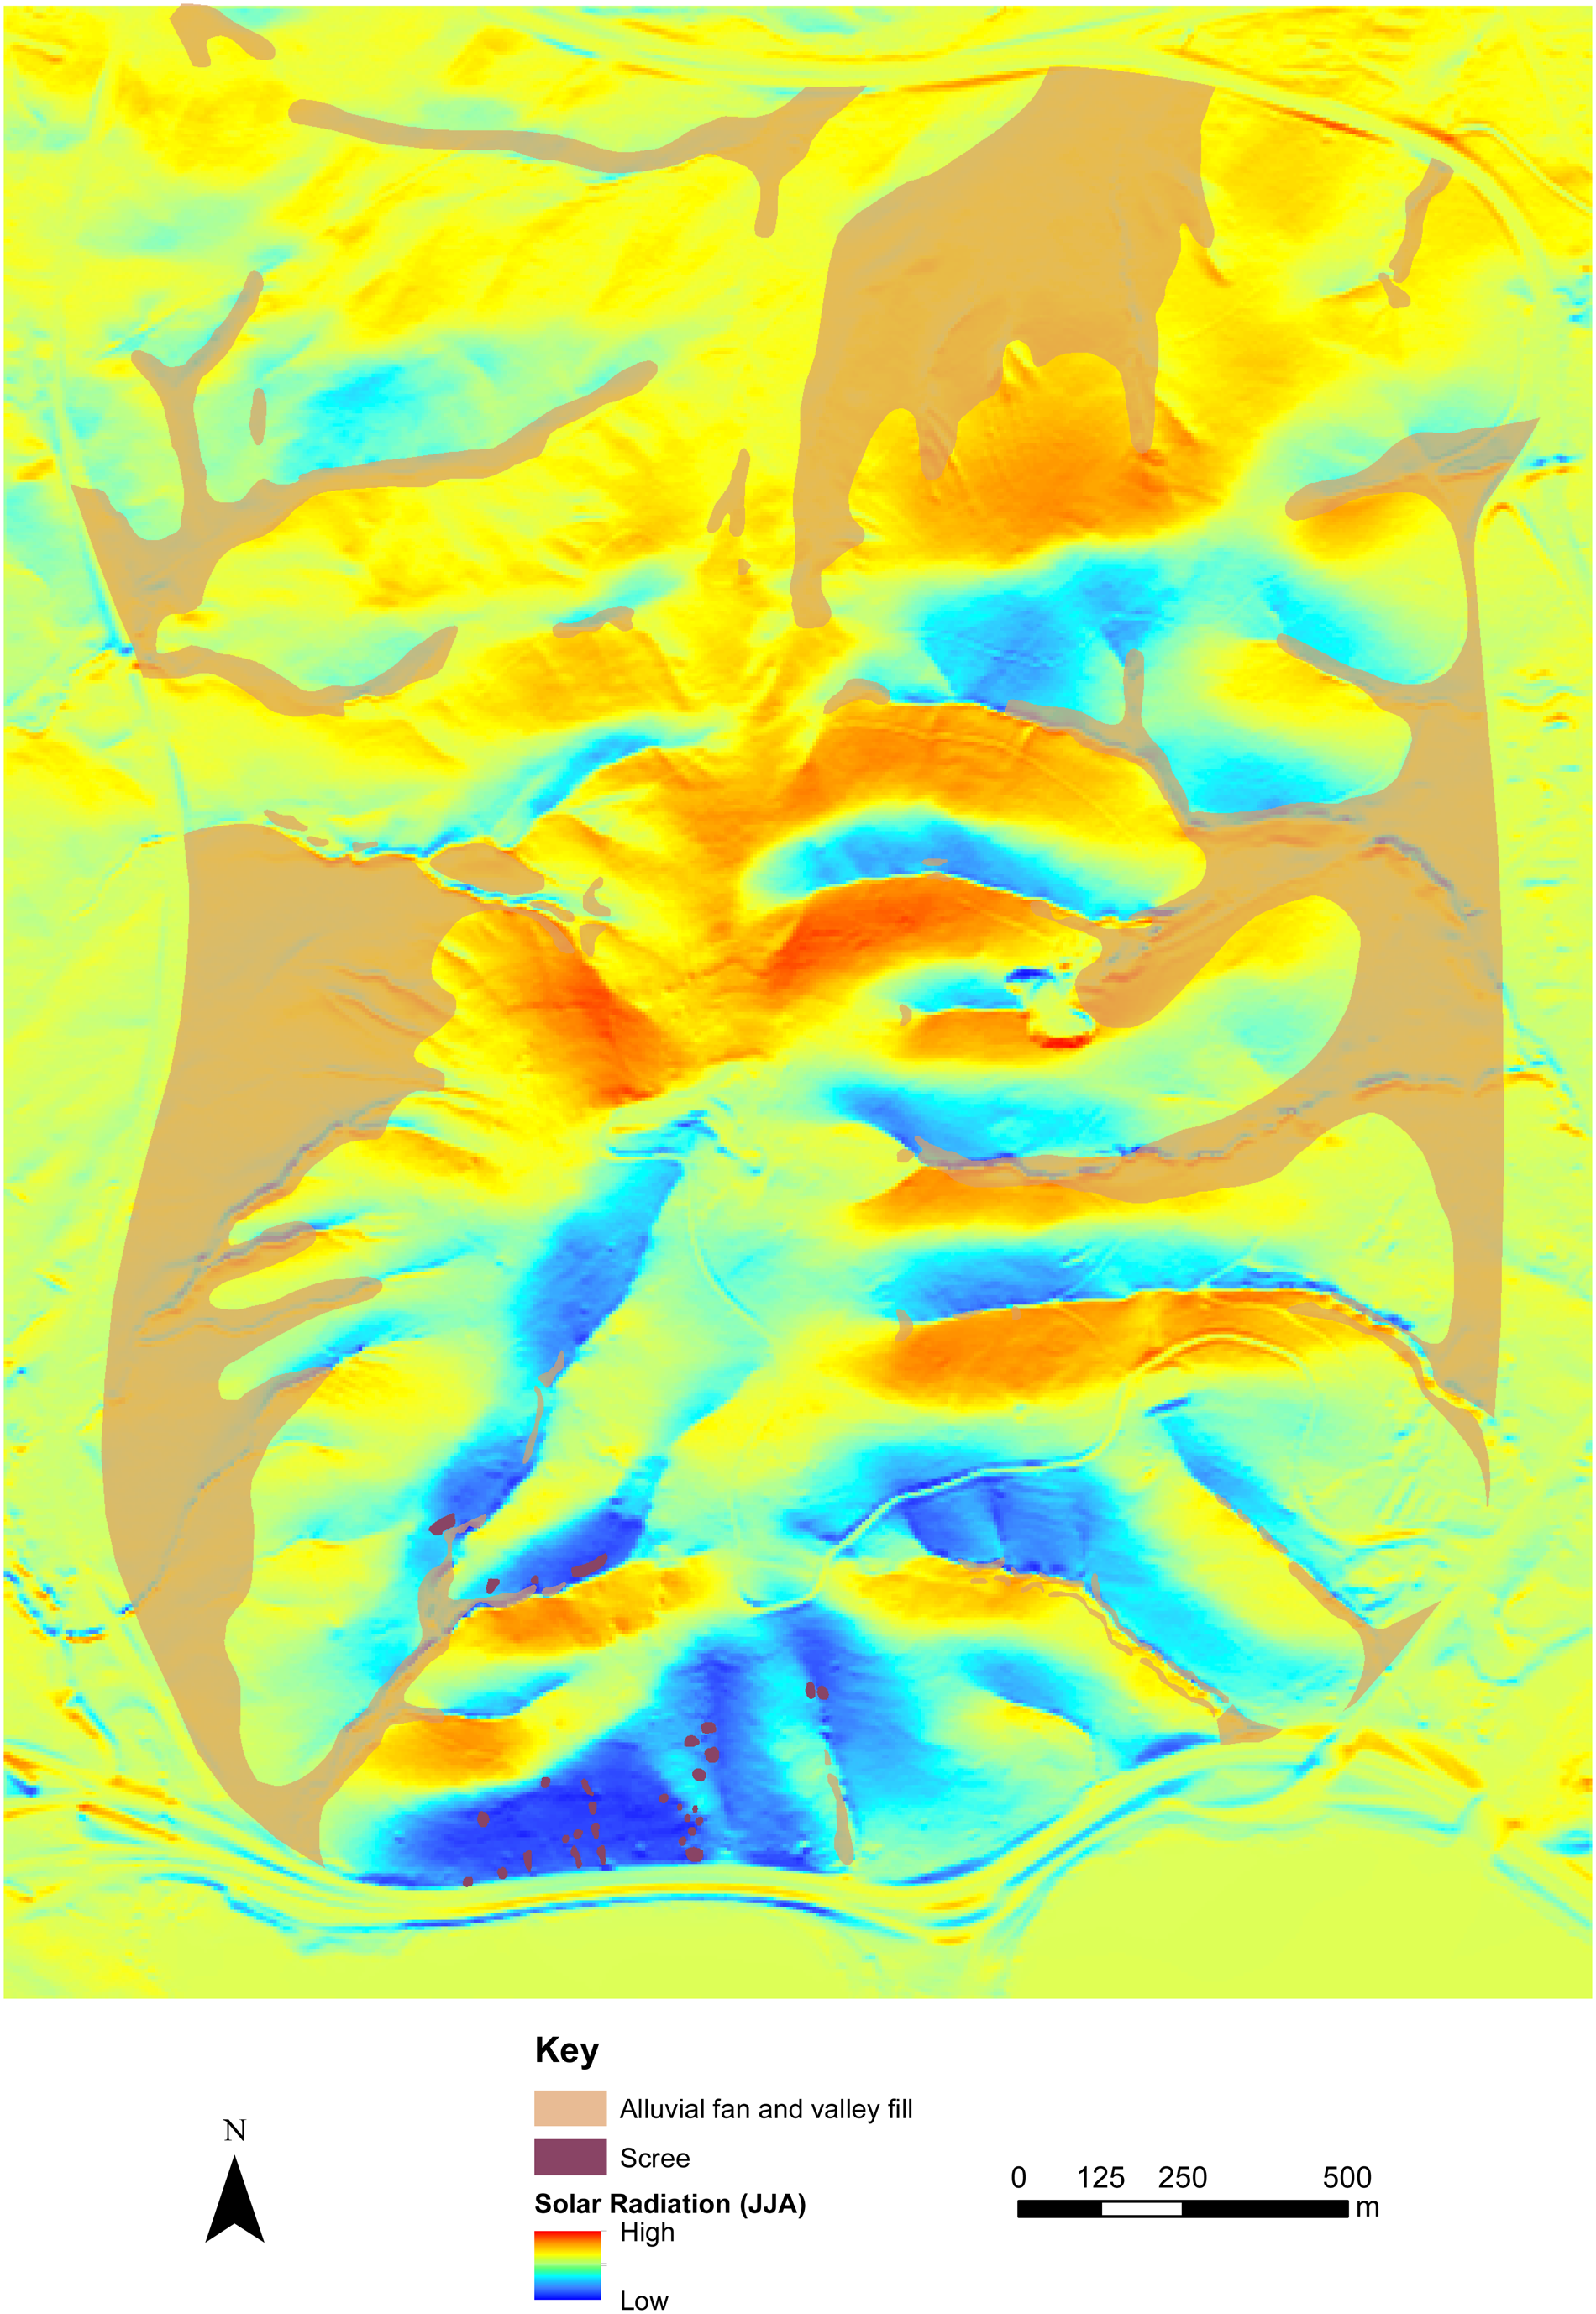
Solar radiation was modeled using the Area Solar Radiation tool in ArcGIS (Fig. 6). This calculates insolation across the entire landscape under observation. The time configuration was June 1, 2020, to August 31, 2020. Default values are used, with the exception of radiation parameters. The diffuse proportion is set to 0.2 and the transmissivity to 0.7 to reflect very clear sky conditions. During the last glacial maximum, obliquity was similar to present (~23°) (Laskar et al., Reference Laskar, Robutel, Joutel, Gastineau, Correia and Levrard2004), and therefore did not require adjustment.
Map of the results of solar radiation modeling at Black Mountain superimposed on the geomorphic map.
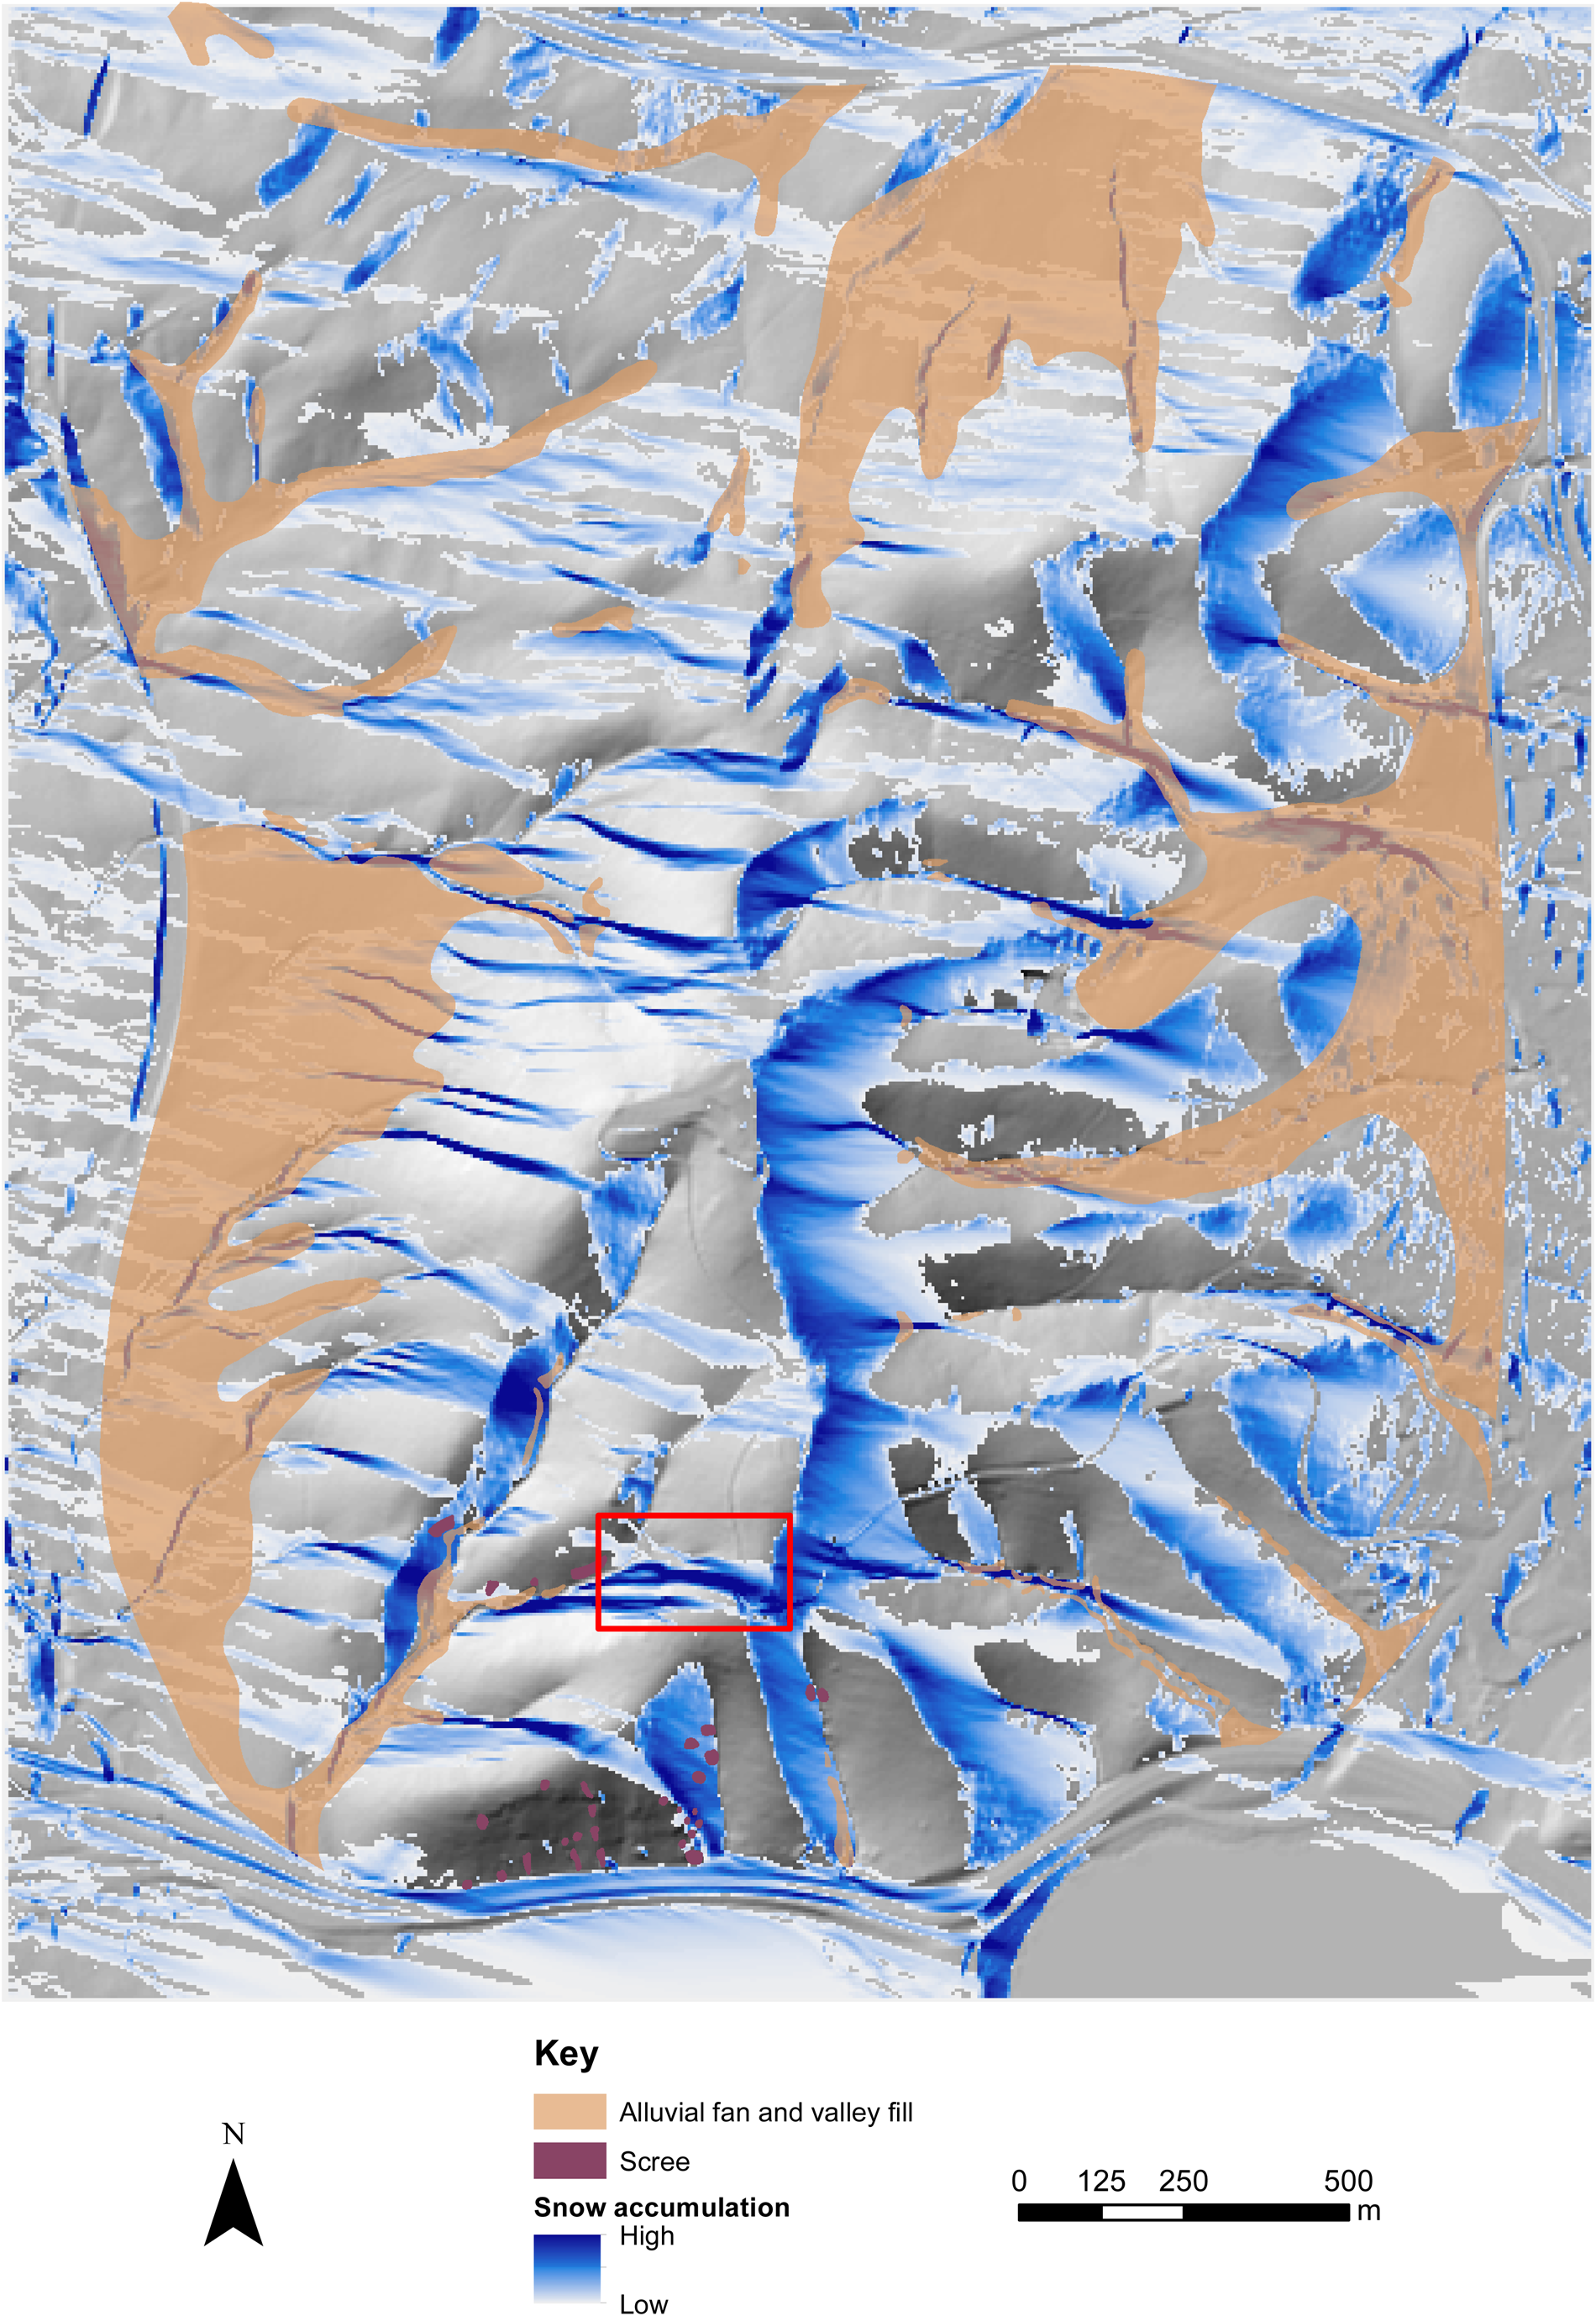
To determine the distribution of snowdrift and its potential association with periglacial landforms, we used the snowdrift model (Snow_Blow) of Mills et al. (Reference Mills, Le Brocq, Winter, Smith, Hillier, Ardakova, Boston, Sugden and Woodward2019) (Fig. 7). This model uses a DEM and prevailing wind direction as inputs. Prevailing winds in the Canberra region average an azimuth of 283° with a high steadiness (82%) during winter (Coventry, Reference Coventry1976). This is the direction that we use in the model. This azimuth is used as a baseline because the mean direction of wind during the last glacial cycle is not known. However, cirque orientations in the nearby Snowy Mountains are dominated by a westerly component (~270°) (Galloway, Reference Galloway1963), indicating that there has not been a major change in prevailing wind direction. Dunes on the Molonglo River floodplain have orientations of 270–315° (Gardner, Reference Gardner1966) and probably have a similar age. The prevailing wind is deflected around topography and areas of erosion/deposition are identified. Snow is distributed across the landscape and deposited, in order to derive a ‘relative’ snow depth index. Default values are used, whereby the critical wind speed threshold for snow transport is set to 5 m/s, mean depositional distance of snow was set to 150 m (i.e., the majority of snow is deposited within the first 150 m), the maximum transport distance is 690 m, and maximum slope was set to 20°. We ran the model for 1 iteration because running it longer only affects the values in each cell and not the general pattern of snow accumulation, which is of interest here.
Map of the results of snowdrift modeling at Black Mountain superimposed on the geomorphic map.
DATING
Optically stimulated luminescence dating
Optically stimulated luminescence (OSL) dating provides an estimate of the time elapsed since luminescent minerals, such as quartz, were last exposed to sunlight (Aitken, Reference Aitken1998). The method therefore effectively measures the timing of sediment burial, assuming the material was exposed to sufficient sunlight during transport to fully reset the luminescence signal. In periglacial settings, sediments are not always completely exposed to sunlight. However, using single grain measurements to identify individual grain ages exposed during transient events, despite a mixed population, it may be possible to obtain age estimates for these features. Fine-grained sediment produced during physical weathering that is washed out and deposited downstream in alluvial settings has a greater chance of being sufficiently well bleached with respect to the OSL signal and should date the periglacial activity.
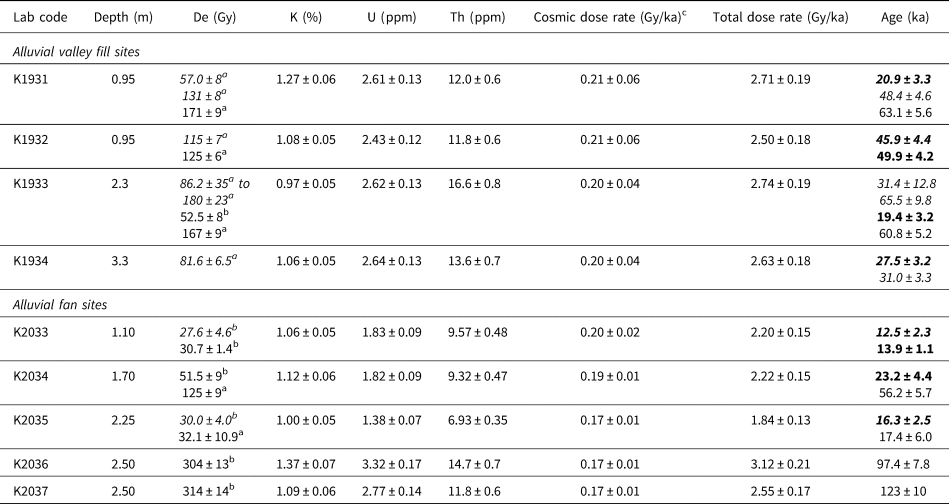
Nine samples for OSL dating were collected from three sites (Fig. 2; Table 2). These comprise duplicate samples (BM3/K1933 and BM4/K1934) from immediately below a scree slope (Fig. 2, S1) and two (BM1/K1931 and BM2/K1932) ~100 m downstream within an incised valley fill (Fig. 2, S2). Additionally, five samples were collected from alluvial fan sediments on the southwest flank of the mountain, three of which (BM5-7/K2033–5) were from the surface unit (Fig. 2, S4), and two (BM8–9/K2036–7) from exposure of the underlying unit on the opposite side of the creek (Fig. 2, S5). Samples were processed for OSL using previously published methods (see Supplementary Information for more detail).
Optically stimulated luminescence ages. Equivalent dose (De), dose rate data, and OSL age estimates for the Black Mountain sites. Single grain ages are given in italics. Ages in bold are considered the most reliable. aCalculated using the finite mixture model of Galbraith et al. (Reference Galbraith, Roberts, Laslett, Yoshida and Olley1999). bCalculated using the central age model of Galbraith et al. (Reference Galbraith, Roberts, Laslett, Yoshida and Olley1999). c149.09°E, 35.282°S, 600 m.
Radiocarbon dating
Radiocarbon dating of periglacial deposits is problematic because low temperatures and snow cover, combined with frequent frosts, inhibit woody vegetation. Complicating this, residence times of organic material in alpine soils can be long, meaning that the ages provide only a maximum limiting age on formation (Barrows et al., Reference Barrows, Stone and Fifield2004). To date a periglacial deposit, the vegetation must have died shortly before the deposit formed. For radiocarbon dating, we chose sites where scree slopes or alluvial sediments had incorporated charcoal, assuming that these marginal periglacial settings were most likely to have the shortest delay between vegetation death and the establishment of the scree slope.
At Black Mountain, almost all sections examined had sediments that were inorganic below the surface Holocene soil. The sediments contrast with modern periglacial soils in the Snowy Mountains, which are carbon rich. Site S5 (Fig. 2) contained macroscopic charcoal in a buried soil profile (Figs. 3E, 5B). A 1 kg sample of soil was disaggregated in water, sieved to >250 μm, and charcoal was separated using heavy liquid (lithium heterotungstate). We observed two generations of charcoal in the sample: friable black charcoal and clay-coated nodules with a carbonized wood core. The nodules probably represent material reworked after erosion of an older paleosol, and these were hand-picked out. An initial sample of 28 g of charcoal was dated to 30,640 ± 850 14C yr BP (ANU-9888) in 1995 using conventional acid-base-acid preparation and measurement. Based on this much younger than expected result, a split of the same sample was analyzed again using more rigorous sample pre-treatment and accelerator mass spectrometry. Pre-treatment consisted of an acid-base-oxidation procedure (Bird et al., Reference Bird, Ayliffe, Fifield, Turney, Cresswell, Barrows and David1999). The charcoal samples were combusted in their entirety at 800°C.
At the Goodradigbee River site, bulk samples of scree weighing several kilograms were collected at six depth levels through the section (Fig. 5). Charcoal was collected using the same methodology as for Black Mountain. Sufficient charcoal (>30 mg; all samples were <100 ppm charcoal) was extracted from four samples and insufficient charcoal was available from the upper two samples. The charcoal was prepared using the same method as for the Black Mountain charcoal. In an analogous setting at Wombeyan Caves, charcoal was collected in 1981 from a section adjacent to that dated by Jennings et al. (Reference Jennings, James, Montgomery, Dyson, Ellis and James1982) (Fig. 5). This sample received a conventional acid-base-acid preparation.
ANU-2972 and ANU-9888 were prepared and dated at the Australian National University using conventional radiocarbon measurement (Polach et al., Reference Polach, Stipp, Golson and Lovering1967). For the ANUA/ANU-227-20 radiocarbon dates, graphite was prepared at the Research School of Earth Sciences and run on the 14UD tandem accelerator at the Department of Nuclear Physics, Australian National University. For the NZA samples, charcoal was run at Rafter Radiocarbon, GNS Science. Radiocarbon dates presented in the paper are calibrated to calendar years using the INTCAL20 calibration (Hogg et al., Reference Hogg, Heaton, Hua, Palmer, Turney, Southon and Bayliss2020) in conjunction with CALIB 8.2 (Stuiver and Reimer, Reference Stuiver and Reimer1993). When calibrated, radiocarbon dates (14C yr BP) are expressed in calibrated years (cal yr BP).
Exposure dating
Because of the effective radiocarbon limit at ca. 50,000 cal yr BP and saturation of OSL signals at ca. 100 ka, we chose to date the oldest surface deposit on Black Mountain with profile dating using the cosmogenic nuclide 10Be. Alluvial fans have been dated by applying a variety of approaches using cosmogenic nuclides (Ivy-Ochs et al., Reference Ivy-Ochs, Dühnforth, Densmore, Alfimov, Schneuwly-Bollschweiler, Stoffel, Rudolf-Miklau, Schneuwly-Bollschweiler, Stoffel and Rudolf-Miklau2013). Profile dating provides an effective method of assessing the age of a sediment package deposited in a relatively short period of time (in comparison to the exposure age) that probably includes an inherited signal.
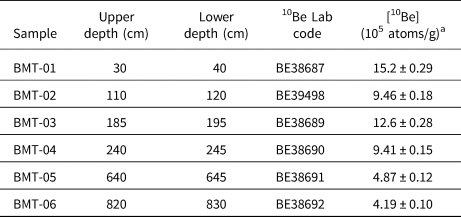
Six ~1 kg samples of sediment were collected from a gully section at S7 (Figs. 2, 5C) adjacent to site BG sampled by Pillans (unpublished data) in the Botanic Gardens. The sediment consists of clasts and fine-grained sediment eroded from rock outcrops in the upper parts of a small catchment on the eastern slopes. It is assumed that the samples include cosmogenic nuclide inheritance approximating steady state equilibrium erosion. The catchment is uniformly quartz-bearing Black Mountain Sandstone. The sand fraction was separated following Barrows et al. (Reference Barrows, Williams, Mills, Duller, Fifield, Haberlah, Tims and Williams2014) rather than using larger clasts because the larger number of finer grains integrates local variations in erosion rate and storage time in the soil before transport. Large clasts may record individual spalling events (Reinhardt et al., Reference Reinhardt, Hoey, Barrows, Dempster, Bishop and Fifield2007). Soils are thin, so slope residence time is expected to be minimal compared to the exposure age. In the age calculations, the modern surface is assumed be the original surface and that minimal erosion has occurred. Topographic shielding from the west is likely counter-balanced by the effective attenuation of cosmic rays on the slope (DiBiase, Reference DiBiase2018), so no topographic shielding corrections were applied.
10Be was extracted from separated quartz using standard methods (e.g., Kohl and Nishiizumi, Reference Kohl and Nishiizumi1992). The isotopic ratio of 10Be/Be was measured by accelerator mass spectrometry at the Center for Accelerator Mass Spectrometry at Lawrence Livermore National Laboratory (Table 3). The production rate was calculated using version 2.3 of the CRONUS calculator (Balco et al., Reference Balco, Stone, Lifton and Dunai2008) and the default production rates for 10Be in quartz from Borchers et al. (Reference Borchers, Marrero, Balco, Caffee, Goehring, Lifton, Nishiizumi, Phillips, Schaefer and Stone2016). Ages were scaled using the scheme of Lifton et al. (Reference Lifton, Sato and Dunai2014; LSDn). To determine the exposure age for the profile, the coefficients of Granger and Smith (Reference Granger and Smith2000) were updated for the production of 10Be with depth (Barrows et al., Reference Barrows, Williams, Mills, Duller, Fifield, Haberlah, Tims and Williams2014). A least squares fit was made to estimate both exposure age and inheritance using the average depth of the samples. Profile modeling used internal uncertainties only, but final exposure ages are also reported with external uncertainties from production rates in brackets. Details of the profile modeling are supplied in the supplementary information.
10Be data for Botanic Gardens site (149°6′15.4″E, 35°16′29.5″S, 651 m). aRelative to the KNSTD value (Nishiizumi et al., Reference Nishiizumi, Imamura, Caffee, Southon, Finkel and McAninch2007); Carrier 10Be/Be = 0.5 x 10⁻¹⁶.
RESULTS
Black Mountain, Southern Tablelands
Black Mountain is characterized by thin soils on the upper slopes, some block deposits, and alluvial fan and valley fill sediments along the eastern and western flanks. The geomorphological map of Black Mountain is presented in Figure 2 and the landforms are discussed in the following sections.
Scree slopes
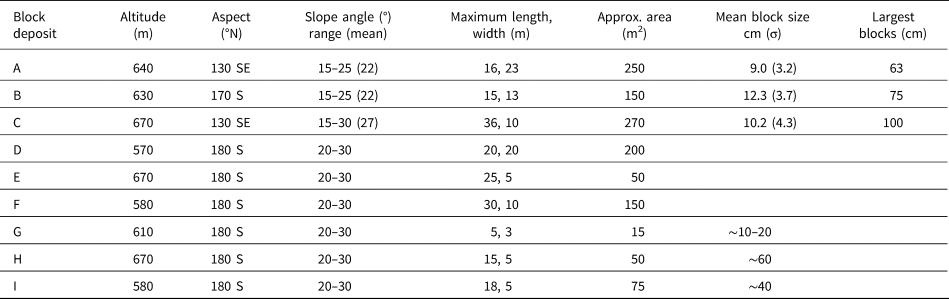
Block deposits in the form of scree slopes, streams, and banks occur on predominantly south-facing aspects of the upper slopes (Figs. 2A–C, 3F). Scree slopes occur as aprons along the slope and are up to 23 m across (Table 4). Free faces are commonly found within or above the deposits. In places, the scree is more extensive in down-slope direction than across slope and range up to 36 m in length (scree streams). The largest block deposits have clast size ranges with low standard deviation with respect to the length of the longest axis (Table 4). Block sizes occur up to 40 cm, with occasional blocks to 1 m. Scree banks take the form of small lobes of blocks lying transverse to the slope, usually 5–10 m across and <5 m downslope. These banks are sorted and show size grading, becoming coarser downslope. Some of these appear to be reactivated by slopewash. The block deposits occur in the slope angle range of 15–35°, mostly occurring between 20–25°, below the angle of repose. The most likely explanation is that snow, ice, or both were present to enable the blocks to be deposited at a lower slope angle. No similar deposits have been found at elevations lower than the south side of Black Mountain, indicating this is the lower limit of block formation.
Scree slope data.
There is abundant evidence that block production has ceased. The blocks have a thin weathering rind and lichen or moss cover. Free faces above the deposits display no signs of recent spalling and have weathering rinds and lichen cover. Colonization by vegetation is occurring at the edges of the larger screes. At depth, the larger deposits are accumulating organic-rich material on top of reddish-brown, fine-grained inorganic sediments. The deposits are also associated with deposits dated to the Pleistocene (see following sections).
There is a strong relationship between the location of block deposits and highly shaded areas indicated from the radiation modeling (Fig. 6). No direct sunlight reaches some of these positions during the winter months. This evidence strongly supports a periglacial origin because low solar radiation prolongs the persistence of ice in the landscape and promotes frost cracking.
Snowdrift predominantly occurs in the lee of the prevailing wind direction (east-facing slopes). There is a relationship with the position of the largest deposit (A) on a downwind east-facing slope, but not to the smaller deposits on the southern slopes (Fig. 7). Snow is also deposited in the gullies on the mountain. This is a function of the prevailing wind direction being modified by the topography and being funneled into the gully. The long linear depositions of snow observed in the figure are likely artefacts produced by the model due to the alignment of the gullies with the dominant wind direction (see red box, Fig. 7).
Alluvial valley fill deposits
Valley fill deposits occur in all the main drainages on the mountain. Scree slope A can be traced downhill to fills up to 8.1 m thick. The sediment is a poorly sorted red-brown, angular to sub-angular gravel in a sandy/silty matrix, sometimes interbedded with thin beds of pebbles or clast-supported gravels (Fig. 5A S1–3). Grading is usually minimal, indicating rapid deposition. Typical modal sizes of clasts range from 2–7 cm. Clasts are angular/subangular, but angular in scree slopes, indicating some abrasion during transport or a residence time on the slopes. There is no organic material in the sediment. The valley fill deposits below Scree A terminate where the drainage widens at the foot of the mountain and opens into a fan capped by a sieve deposit (Wasson, Reference Wasson1974) composed of angular to sub-angular gravel and boulders. The principal mode of sedimentation appears to be debris flow. Occasional high flow events are responsible for incorporating the larger clasts into the deposits. Matrix-free layers are probably due to winnowing of fine sediment. Rengers et al. (Reference Rengers, Kean, Reitman, Smith, Coe and McGuire2020) found a strong relationship between sediment production and alpine temperature. Channel filling occurred in the cold season and debris flow transport occurred in the warm season. Aggradation on Black Mountain indicates the system was flow limited. There is a relationship between snow drifting and the downslope accumulation of deep valley fills at scree slope A, possibly indicating a relationship with snow melt. We geologically group the similar valley fills downstream of screes A-C as the Black Mountain Member.
Alluvial fans/bajadas
The fans and bajadas are most extensive on the eastern and western sides of the mountain and are associated with the steepest slopes of the mountain, except on the southern side where the Molonglo River has prevented sediment build-up. On the southwest flank, there are at least three units of fan deposition separated by soils (Fig. 5B, S4–6); the Black Mountain Member, Caswell Member, Aranda Member, and a fourth on the east side, the Acton Member. All are grouped informally within a broader unit, the Molonglo Formation. The units typically consist of a fine-grained upper subunit with occasional clasts and a coarse, angular clast-rich lower subunit. Contacts are typically non-erosional and paleosols are often preserved. Clasts are angular to subangular, 5–10 cm in longest axis (rarely to 15–30 cm). The upper part of the youngest unit, the Black Mountain member (Fig. 5B, S4, S5), has active sedimentation elsewhere on the toe slopes of the fan. The lower subunit has a similar degree of weathering to that of the valley fill units and we consider them coeval. In S4 and S5 there are clast-supported interbeds and some sorting and imbrication of pebbles. The next two oldest units are exposed downslope where the fan thickens at site S6. The Acton Member exposed on the eastern slope (site S7) strongly contrasts with the younger units in having undergone significant pedogenesis. There is often strong mottling (orange, white, red, and brown) of the matrix with variable gleying, cementation, strong illuviation, and iron oxide segregation, with friable shale clasts. There is a clast-free zone in the middle, and based on the dating results, this unit may be the result of two different depositional periods.
The poorly sorted, matrix-supported, non-imbricated diamictons comprising the coarse sediments of the four units most likely originated as debris flows. The sorted interbeds with some imbrication are likely sediments from channelized flows across the fan. The upper finer subunits indicate colluvial processes, such as slope wash, as the dominant mode of deposition. X-ray diffraction of crystals separated from the upper subunit in S5 are gypsum, indicating accumulation of salts. There is no obvious relationship between the locations of the fans with solar radiation or patterns of snow blow (Figs. 6, 7).
Dating
The OSL dating results are presented in Table 2. Both single aliquot and single grain distributions yielded wide, often highly scattered, age populations. Large overdispersion values reflect these distributions. The finite mixture model (Galbraith and Green, Reference Galbraith and Green1990) was applied to all samples. Multiple age populations are interpreted as reflecting mixed populations, incompletely bleached grains, and beta dose rate heterogeneity (e.g., Duller, Reference Duller2006; Galbraith, Reference Galbraith2015; Smedley et al., Reference Smedley, Duller, Rufer and Utley2020). Bioturbation was not apparent at any of the sites. Because of the depositional setting as muddy sediments with incomplete exposure and possible reworking, multiple populations are expected. Because of this, the lower-dose population likely represents the most recent mobilization of the sediment. The most reliable age estimates are highlighted in bold text (see also supplementary information). Where both single aliquot and single grain analyses were undertaken, the resulting ages are similar, with the exception of K1931 and K1933. In the case of sample K1931, single aliquot ages are assumed to incorporate incompletely bleached grains, and are therefore deemed unreliable. The single grain dose distribution of sample K1933 is highly scattered, and only an age range could be calculated; the single aliquot age lies within this range.
The optical ages at the two sites below the largest scree slope (A) produced ages over a greater than expected range, indicating that slope instability was not confined to the last glacial maximum. In the incised section below A (S1), the two OSL ages from the same level in the middle of the deposit (Fig. 5) have a broad age range with the youngest peak at 20.9 ka, probably extending to 48.8 ka, and possibly as old as 63 ka (Table 2). Farther down valley (S2), the age of the lower OSL sample (27.5–31 ka) provides a limit on the upper sample of 19.4–31.4 ka.
On the alluvial fan, the ages from the lower subunit of the Black Mountain member (S4) likely fall within the LGM at 16.3–17.4 ka and 23.2 ka (possibly as old as 56.2 ka). It ceased deposition at 12.5–13.4 ka. The Caswell Member upper unit has an age range of 97.4–123 ka, dating the penultimate phase of landscape stability to the previous glacial cycle. The charcoal sampled from this unit has an age 49,750 +2440/−980 cal yr BP, similar to what was measured earlier by Bird et al. (Reference Bird, Ayliffe, Fifield, Turney, Cresswell, Barrows and David1999), indicating an age beyond the radiocarbon limit (Table 1). The background level is satisfactorily low (0.2%M), despite stepped combustion not being used in our graphitization procedure for these and the Goodradigbee River samples.
Results from exposure dating of the Acton Member at S7 are presented in Figure 5C. The profile fit to the upper samples gave an exposure age of 248 ± 16 ka. This is likely a minimum age if some erosion has occurred. The lower profile has an exposure age of 172 ± 16 ka. Adding the exposure from the bed above, the total exposure history here extends back 420 ka. Although the fan units are assumed to be deposited instantaneously, it is likely that each bed accumulated over thousands of years, similar to the Black Mountain Member, therefore the age estimates are a minimum. The apparent erosion rate from the upper profile is 7.3 ± 0.5 m/Ma and the lower profile is 8.6 ± 0.7 m/Ma. The similarity of the two estimates indicates that the erosion rate has been fairly constant over the last ca. 420 ka.
Brindabella Range
The stratigraphic log of the Goodradigbee section is presented in Figure 5D. Approximately 14 m of angular blocks have accumulated and consist of alternating coarse (up to 1 m thick) and fine beds (up to 10 cm thick). Near the surface, there is clear evidence of contorted bedding from cryoturbation (Fig. 3D). The deposit is inactive and has a soil forming at its surface. This stratified slope deposit is oriented to the southeast and is in a position favorable to snow accumulation. The deposit formed in a vegetation-poor environment, although at least some woody vegetation was present upslope or upwind because of the presence of fine-grained charcoal in the deposit. Charcoal was unommon in the lower two thirds of the deposit, but very rare in the upper third. The radiocarbon ages from the three lower samples have ages of 27,850–31,470 cal yr BP (Table 1), similar to the valley fills at Black Mountain.
Wombeyan Caves
The stratigraphic log of the Hockey Gully section is presented in Figure 5D. The bedding is similar to that seen on Black Mountain valley fills and the well-layered, fine-scale bedding characteristics of the Goodradigbee deposit are not present. The radiocarbon age of the charcoal is 24,600 +2620/−2250 (ANU-2972), slightly older than the age of 23,660 +1900/−1500 (ANU-2252) higher in the section (Jennings et al., Reference Jennings, James, Montgomery, Dyson, Ellis and James1982), indicating rapid deposition. At a crossing of the Abercrombie River 25 km northwest of Wombeyan Caves, openwork block deposits line southward facing slopes at 690 ± 5 m (Fig. 2). These block deposits are similar to the scree slopes on Black Mountain and are at a similar elevation.
Lake George
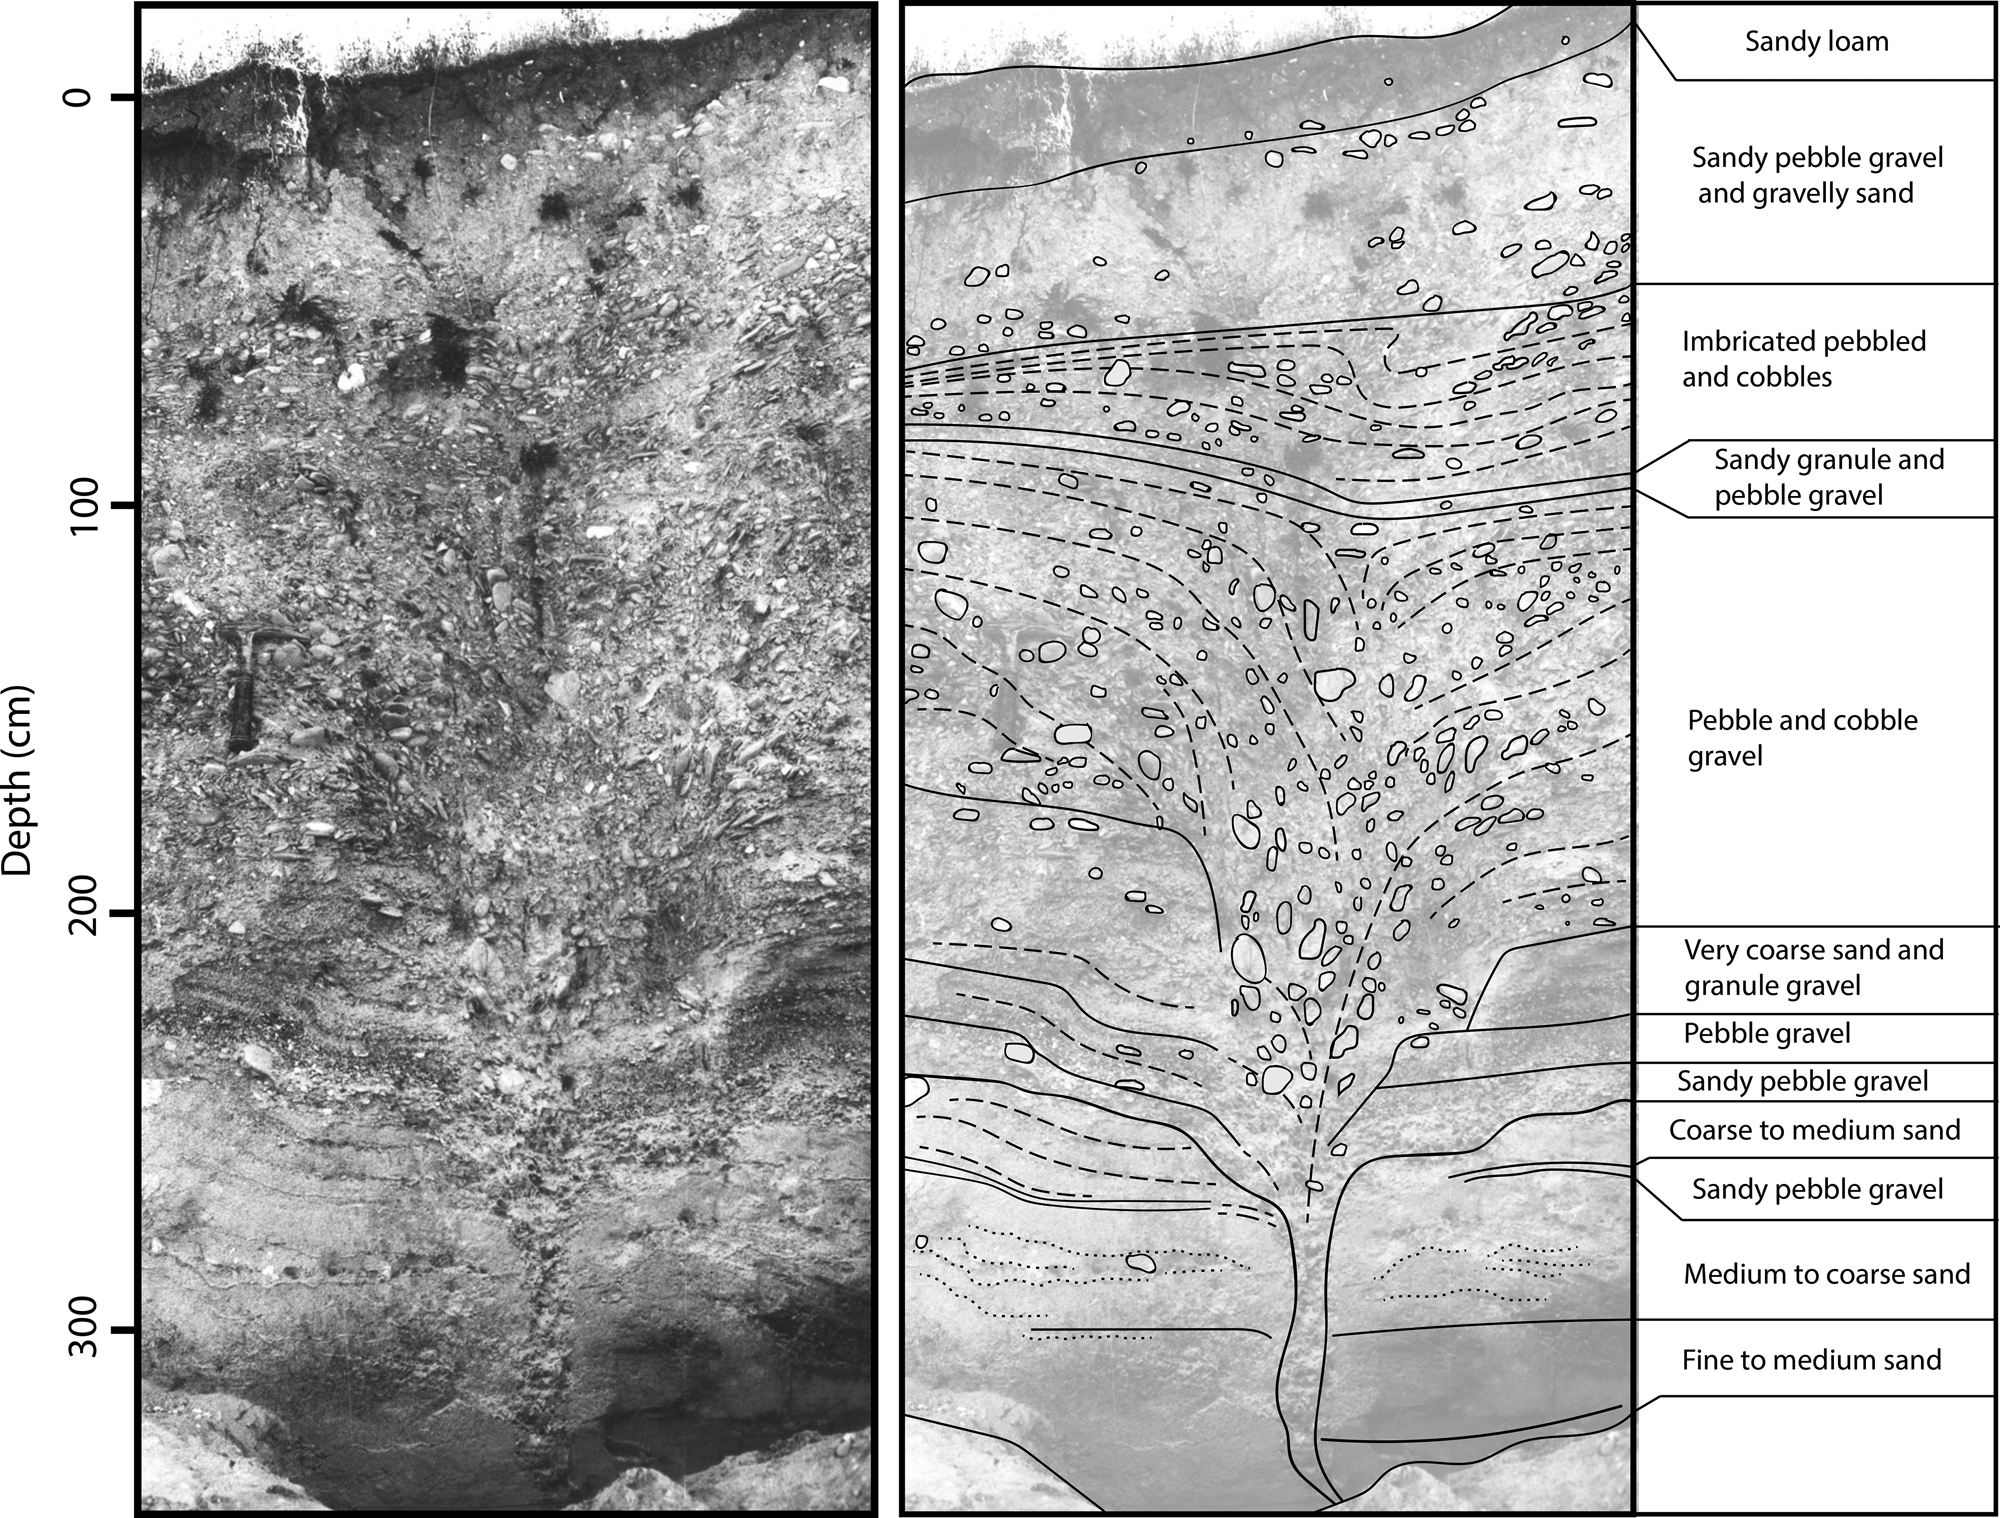
The wedge-shaped structure from the gravel pit is logged in Figure 8. The sediment exposed in the section is mostly gravel or very gravelly sand. Bedding is poorly developed in the upper 1–1.5 m, except for substantial gravel lenses. At greater depths, layers of well-developed, gently dipping fore-slope and top-slope beds alternate with steeply dipping backslope beds. The structure reached a depth of >3 m and had a maximum width of ~40 cm. The structure narrowed downward to a thin crack, which petered out in a layer of sand near the floor of the quarry. In the center, pebbles were aligned vertically, whereas on the margins they showed indications of having subsided towards the center. The structure is not infilled with a foreign material, such as soil. The upper part is reworked into gravel lenses near the surface, indicating that it was syngenetic with formation of the beach ridge, and therefore dates to the time of its formation. No surface expression of the wedge, such as a polygonal pattern, was observed.
Interpretation of a sediment wedge exposed in a quarry to the north of Lake George, NSW. Left side: orthophoto constructed from three photos and structure from motion photogrammetry down the side of the pit. Right side: interpreted sedimentary log of the sediment wedge showing structures and sediment texture.
DISCUSSION
Dating of periglacial deposits
OSL dating shows that periglacial activity was not limited to just the LGM, but probably occurred throughout the last glacial cycle with limits of 50–13 ka and possibly as early as 66 ka. This approach shows promise for dating periglacial deposits where production and exposure to light of fine-grained sediments is contemporaneous with water transporting sediments away from frost-shattered blocks. However, it is likely that the ages reflect multiple times the sediments were remobilized and exposed, rather than when the sediment was created.
Radiocarbon dating of periglacial deposits is problematic. Barrows et al. (Reference Barrows, Stone and Fifield2004) reviewed previous dating attempts in the region and concluded that they are only maximum limiting ages for periglacial activity. Dating of the Black Mountain charcoal shows that carbonized wood/charcoal has long (ca. 105 years) residence times in the regolith and may be reworked. The new ages presented here limit periglacial activity at the Goodradigbee and Wombeyan sites to before and during the LGM.
Radiocarbon dating of the Black Mountain charcoal has demonstrated that contamination is a serious issue in these regolith settings. Concerted efforts to remove the contamination have extended the age of the charcoal from 30,640 to 55,860 14C yr BP (Bird et al., Reference Bird, Ayliffe, Fifield, Turney, Cresswell, Barrows and David1999). This result casts doubt on the validity of previous radiocarbon dating from similar settings, where conventional pretreatment techniques were used. For example, bulk samples in Costin and Polach (Reference Costin and Polach1973), Coventry (Reference Coventry1976), and Walker and Gillespie (Reference Walker and Gillespie1978) were only acid washed. Walker and Gillespie (Reference Walker and Gillespie1978) combusted samples up to 5 kg in weight. Gillespie et al. (Reference Gillespie, Prosser, Dlugokencky, Sparks, Wallace and Chappell1992) showed that conventionally treated radiometric ages older than 20,000 14C yr BP almost certainly have some contamination.
Exposure dating of periglacial deposits is most successful where the assumption of no inheritance can be made (Barrows et al., Reference Barrows, Stone and Fifield2004). Profile dating has potential to extend the time range for dating both alluvial fans and valley fills in periglacial settings. The major limitations are the assumption of “instantaneous” deposition and constant background inheritance. The results from Black Mountain indicate that slope instability commenced by the mid Pleistocene (420 ka). Dating is not precise enough to match the two layers to specific cold-climate episodes. South of the Southern Tablelands, Heimsath et al. (Reference Heimsath, Chappell, Dietrich, Nishiizumi and Finkel2001) found that rapid exhumation of a tor at Frogs Hollow (Fig. 1) recorded an erosional episode at ca. 150 ka. Elsewhere, Fifield et al. (Reference Fifield, Wasson, Pillans and Stone2010) found at least 280,000 years of meteoric 10Be accumulation at a forested site at an elevation of ~870 m near Burra (Fig. 1). They suggested soil production rates of 1–7 m/Ma, the upper end of which is very similar to the value we found for Black Mountain. However, 700 m north in the same catchment, Fifield et al. (Reference Fifield, Wasson, Pillans and Stone2010) also record channelized and debris flow sediments dating back before 16,000 cal yr BP, indicating spatially variable stripping and treeless conditions. Burial dating at Black Mountain using the 10Be/26Al pair at the site would be required to constrain the early history of Plio-Pleistocene alluvial fan deposition and soil stripping.
Periglacial activity on the Southern Tablelands
Stratigraphy on Black Mountain indicates that landscape instability has been highly episodic. At least four phases of erosion and stabilization have occurred. Conditions conducive to landscape instability, either through persistent cold temperatures, aridity, or both, occurred at multiple times during the last glacial cycle. Regional geomorphology shows widespread landscape instability, but deposits locally are likely timed to be stochastic event-driven erosion and deposition, as seen in the Holocene (Prosser et al., Reference Prosser, Chappell and Gillespie1994).
The lowest-altitude confirmed periglacial deposits are scree slopes. The stratified scree slope with cryoturbation at Goodradigbee, the block deposits on Black Mountain, and the slope deposits near Wombeyan Caves present unambiguous evidence for a periglacial environment at low altitude. In contrast to the findings of Galloway (Reference Galloway1965), there is only one documented solifluction deposit preserved in unusual circumstances at Wombeyan Caves. No hillslope mantle solifluction deposits, with characteristic angular clasts oriented downslope, were found on Black Mountain. Slee and Shulmeister (Reference Slee and Shulmeister2015) mapped block deposits and “mountain scree” within this region. However, we could not verify whether these sites were periglacial because the data coordinates are not available.
Stratified slope deposits, such as the one at Goodradigbee, are produced by alternating processes of frost shattering and transport of coarse clasts with episodic slopewash and debris flows following the melting of snow and thawing of the active layer in spring. The clasts here are consistent with brecciation of the bedrock by ice segregation producing pebble- to cobble-sized angular, tabular fragments (Murton et al., Reference Murton, Coutard, Lautridou, Ozouf, Robinson and Williams2001). Given the age, thickness, and number of layers, deposition of the fine layers probably occurred on a timeframe of thousands of years. No stratified screes form in the Snowy Mountains today. This may be a function of the high modern precipitation, which results in a long snow cover at the highest elevations, and herbaceous vegetation cover of the surface.
The closest modern analogue to the geomorphic setting of valley fills/fans below periglacial block deposits on Black Mountain is at Mt Twynam in the Snowy Mountains. In the Snowy Mountains, the persistence of snow patches for most of the year results in geomorphic processes collectively known as nivation (Caine, Reference Caine1992). Scree slopes form and fine debris that is transported by surface wash and solifluction accumulates on the slopes below (Fig. 3A, B). Frost weathering of rock results in heightened sediment production available for transport (Rengers et al., Reference Rengers, Kean, Reitman, Smith, Coe and McGuire2020). On Black Mountain, the alluvial valley fills up to 8 m thick indicate considerable slope instability and stripping of hillside regolith. These sediments are likely derived from erosion, both from the block deposits and from the adjacent hill sides. The most likely cause of slope instability is frost heaving, as recorded on the slopes of Black Mountain today during winter frosts, in a vegetation-poor environment with little snow cover. The absence of a significant buffer layer of vegetation would more closely couple air and ground-surface temperature (Murton and Ballantyne, Reference Murton and Ballantyne2017). Sheet wash from storms, snow melt, and periodic mass movement moved sediments into the valley bottoms and mountain flanks where the flow regime had insufficient energy to completely export the sediments. Channeled flows appear to have occurred, as evidenced by the presence of thin, laterally continuous sub-units in the fan units.
One unknown factor is the length of time required to form the low-altitude deposits. Frost cracking may occur quickly and only during maximum cold. Therefore, it is difficult to assess how representative the scree slopes are in the periods dated. Other unknowns are the residence time of soil on slopes and the rate of regolith stripping. The bedrock erosion rate measured on the east side of Black Mountain is 7–9 m/Ma, indicating an abundant production of regolith. Costin et al. (Reference Costin, Wimbush and Kerr1960) found that the rates of soil erosion on bare soil at the treeline were two orders of magnitude greater than erosional rates on forested soil. The timing of debris flows was probably threshold based (Wasson, Reference Wasson1979a), with events occurring once sufficient material had accumulated on the slopes and a precipitation event of sufficient magnitude occurred.
The starkest contrast between the Black Mountain sediments and modern Mt Twynam sediments is the lack of organic content. This absence extends below the soil zone, indicating it is not a result of pedogenesis. The poor vegetation cover was likely a function of the combination of a cold environment at or above the treeline, accentuated by lower precipitation than present. There is currently no analogous climate in Australia. The nearest active alluvial fans are probably the Mundi Mundi fans ~1000 km northwest near Broken Hill (Wasson, Reference Wasson1979b). These are low in organic matter due to sparse vegetation cover, rapid breakdown of organic matter at the surface, and poor preservation potential. This contrasts with the low decay rates in alpine settings together with high preservation potential in saturated soils. Annual precipitation at Broken Hill (246 mm) is less than half that of Canberra (600 mm) (Bureau of Meteorology, 2020). Several lines of evidence point to drier conditions on the Southern Tablelands. There was widespread aeolian activity in mainly supply-driven settings, indicating sparse riparian vegetation. Sand dunes blown from the Murrumbidgee riverbed were coeval with hillslope instability (Kellett, Reference Kellett1981) and are also present on the Molonglo River (Gardner, Reference Gardner1966). Dunes near Lake George and the Shoalhaven River have ages between 17–19 ka (Nott and Price, Reference Nott and Price1991). Hydrologic modeling by both Galloway (Reference Galloway1965) and Coventry (Reference Coventry1976) at Lake George indicates precipitation of approximately half present levels. Aridity probably meant that snow cover and duration were much less at the Pleistocene treeline compared to present, and therefore snow had a minimal effect on geomorphology except in high-accumulation settings.
Australian vegetation is least adapted to a cold/dry climate (Costin, Reference Costin, Mulvaney and Golson1971), so the combination of lower temperature and precipitation would limit vegetation cover at the treeline. Singh and Geissler (Reference Singh and Geissler1985) reconstructed Southern Tablelands vegetation changes from pollen preserved in Lake George and found the most likely vegetation to be largely open, treeless, herbfield and grasslands during glacial intervals. Relict snowgum populations in Canberra might support a former treeline at this elevation. No biological material dated to the LGM has been recovered from sites above 800 m. In combination with the observed landforms, this indicates that elevations above 700 m were a periglacial steppe, with grassland as the only likely vegetation.
The final remaining potential indicators of ice at low elevation are the wedge-shaped structures at Lake George. Wedge-shaped structures can have both climatic and non-climatic origins (Washburn et al., Reference Washburn, Smith and Goddard1963; Black, Reference Black1976), therefore care needs to be taken in their interpretation. There are several possible processes that could operate at this site to produce this form. The structure superficially resembles an ice wedge, but there is no additional supporting evidence for this. The host material does not have upturned strata at the edges, which would indicate a preserved pressure effect. The Lake George wedge material orients downwards, indicating subsidence, but this also could be interpreted as fissure ice melting (French and Gozdzik, Reference French and Gozdzik1988). No foreign material has been added to the crack, as occurs in ice wedge casts. Because of the proximity to the Lake George fault, a seismic origin is possible (e.g., Thorson et al., Reference Thorson, Clayton and Seeber1986). However, there is no accompanying evidence for liquefaction, convoluted bedding, or the venting of sand or silts from under the beach ridge. The wedge cannot be a desiccation crack because of the drainage properties of the coarse sediment. It is not a tree-root cast because of its shape and lack of infilling of organic matter. The wedge resembles a tension fracture (Black, Reference Black1976), but there is no evidence of slumping in the adjacent sediment. The low gradient of the embankment makes this unlikely, especially since some of the observed structures ran approximately at right angles to the sloping faces of the embankment.
The Lake George wedge, most appropriately called a sediment or soil wedge (Murton, Reference Murton, Elias and Mock2013), most closely resembles those produced by thermal contraction cracking. This explanation is consistent with the shape, depth, presence in gravel, and reorientation of clasts (Black, Reference Black1976). Thermal contraction cracking occurs when frozen ground cools quickly, and cracks can extend to 4 m (Washburn, Reference Washburn1973). Frost cracking is the incipient stage of ice wedge development, but ice segregation and growth only continue in a permafrost environment. Because the wedges are syngenetic (French and Gozdzik, Reference French and Gozdzik1988), they likely formed during a low lake level interval during the LGM. This kind of tensile fracture is affected by insulation cover (snow and vegetation), particle size, and the ability of the ground to creep (Murton, Reference Murton, Elias and Mock2013; Murton and Ballantyne, Reference Murton and Ballantyne2017). Thermal contraction cracking is consistent with a dry climate with little cloud cover and where snow cover or vegetation is minimal (Washburn et al., Reference Washburn, Smith and Goddard1963). The site is in a basin, which also results in cold air pooling. Thermal contraction cracking also explains the observation of probable frost cracks at a similar elevation in the Shoalhaven River Valley. Chartres and Costin (Reference Chartres and Costin1981) outlined one possible group of mechanisms to explain the cracks as seasonal thermal contraction cracking associated with periodic filling of the cracks by wind- or water-borne debris.
Surface temperature in the Late Pleistocene
The distribution of the lowest elevation periglacial sites provides an opportunity to independently estimate maximum cooling during the LGM. The lowest unambiguous periglacial deposits are the scree slopes on Black Mountain (mean of 650 ± 17 m), Goodradigbee River (690 ± 5 m), Abercrombie River (690 ± 5 m), and Hockey Gully (650 ± 5 m) sites. The elevations are the heads of these deposits where the bedrock was frost-cracked. Hales and Roering (Reference Hales and Roering2007) found that mean rock headwall elevation coincided with the most intense cracking predicted by their model. The lithology at Black Mountain is sandstone, Goodradigbee River is shale and sandstone, Abercrombie River is shale, and Hockey Gully is a pyroclastic rock. There is no apparent petrological effect on the distribution of sites, so the altitudes of all sites are averaged.
The mean winter temperature at the average periglacial scree limit (680 ± 10 m) is 6.1 ± 0.3°C (Bureau of Meteorology, 2020). The temperature difference required to lower the frost cracking limit to this elevation (by ~1274 m) is 8.2 ± 0.5°C. The error is estimated as the uncertainty of temperature at the frost-cracking limit combined with the uncertainty of the temperature at the block-deposit limit in quadrature. This estimate of cooling relative to modern temperature is at the low end of 8–14°C estimated by Galloway (Reference Galloway1965), Costin and Polach (Reference Costin and Polach1971, Reference Costin and Polach1973), and Costin (Reference Costin1972), based on arguments associated with the lower limit of solifluction. The presence of solifluction at Wombeyan Caves is consistent with the new temperature estimate. It is slightly lower than the 9°C estimated by Slee and Shulmeister (Reference Slee and Shulmeister2015), who assumed the environmental limits for solifluction (Galloway, Reference Galloway1965) applied to block deposits. The estimate is higher than estimates of 5–6°C for low-altitude, low-to-mid-latitude land surfaces elsewhere (Seltzer et al., Reference Seltzer, Ng, Aeschbach, Kipfer, Kulongoski, Severinghaus and Stute2021).
The calculated temperature difference would significantly lower vegetation boundaries. van Dijk (Reference van Dijk1959) suggested that the plains around Canberra (500–600 m) would have been treeless. Singh and Geissler (Reference Singh and Geissler1985) estimated that the treeline was lower by 1200–1500 m during glacial maxima. They calculated that this would equate to a difference in mean temperature for the warmest month (January) of 8–10°C. The similarity between that summer estimate and the winter temperature above suggests that the temperature difference was not biased to one season.
The temperature associated with thermal contraction cracking at Lake George and Shoalhaven River Valley is less certain. The nearest analogue has been described by Costin and Wimbush (Reference Costin and Wimbush1973) at 1905 m in the Snowy River valley, with thermal contraction cracking up to 0.6 m deep. Their development under modern conditions at this elevation is impeded by a buffer zone of thick snow cover and vegetation. Black (Reference Black1976) and Murton (Reference Murton, Elias and Mock2013) have stated there is no simple relationship with mean annual air temperature. French (Reference French and French2007) summarized that the best correlation with air temperature occurs in localities of thin snow cover, favorable local conditions, and with winter air temperature. The modern to relict elevation difference of 1225 m with the modern analogue is consistent with the altitudinal difference for the formation of scree slopes and the presence of involutions at Goodradigbee River.
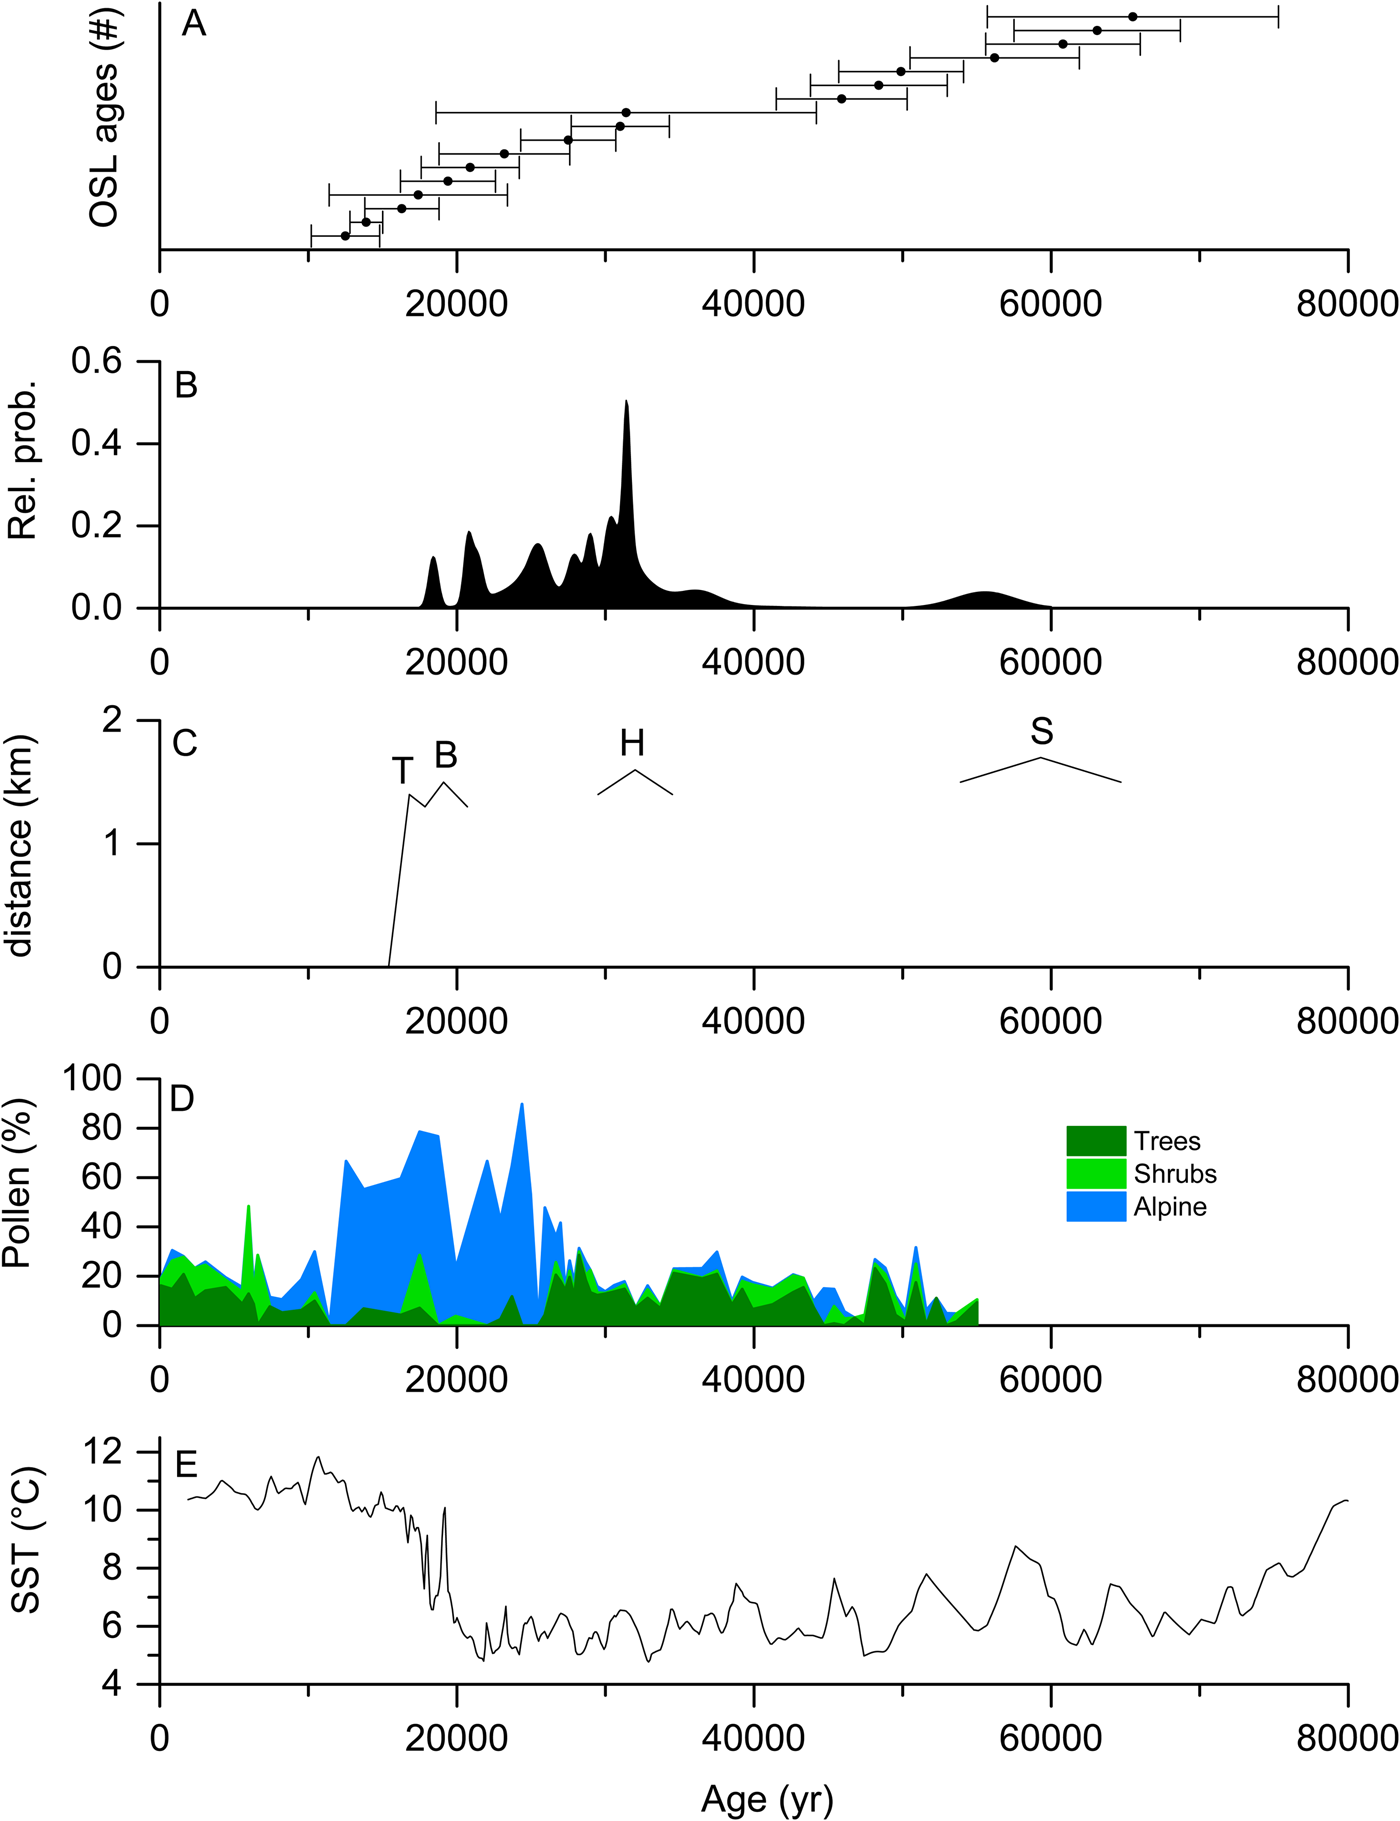
The new OSL ages are plotted against the radiocarbon ages, the timing of glaciation in the Snowy Mountains (Barrows et al., Reference Barrows, Stone, Fifield and Cresswell2001), elements of the pollen record from Lake George (Singh and Geissler, Reference Singh and Geissler1985), and a stack of sea-surface temperatures from the Southern Ocean (Barrows et al., Reference Barrows, Juggins, De Deckker, Calvo and Pelejero2007) in Figure 9. The OSL ages (Fig. 9A) span most of the last glacial cycle. The radiocarbon ages (Fig. 9B) are presented as a probability density function (c.f., Barrows et al., Reference Barrows, Stone, Fifield and Cresswell2002) and represent a maximum age for the periglacial landform or slope instability. They are bracketed by the youngest glacier advance in the Snowy Mountains (Fig. 9C). The pollen curve presents the sum of all trees and shrubs and selected alpine taxa (Fig. 9D). The pollen taxa are plotted on a new age model to be compatible with the other dating (see Supplemental Information). Alpine taxa are abundant between 11,400–27,000 cal yr BP. The change in communities can be examined using the modern analogue technique (c.f., Barrows and Juggins, Reference Barrows and Juggins2005) and the South-East Australian Pollen Database (D'Costa and Kershaw, Reference D'Costa and Kershaw1997). The two samples with the highest elevation analogues are at 16,200 and 22,000 cal yr BP. The nearest analogue is from Blue Lake in the Snowy Mountains, 1200 m higher in altitude and ~9°C colder on average in summer. This altitudinal and temperature difference is very similar to that estimated from the periglacial landforms. There is a notable low in the tree/shrub sum when alpine taxa are most represented and charcoal is rare in this interval (Table 1), probably because of treeless vegetation. The OSL ages are spread over the coldest interval of the last glacial cycle indicated by the regional SST record (Fig. 9E), without any concentration of activity in the periods when ice is present in the Snowy Mountains. A combination of cold (8.2 ± 0.5°C colder winters) and dry conditions during the LGM would have severely restricted vegetation and, despite lower water availability, resulted in regional slope instability. Although the errors on the OSL ages are relatively large, slope instability was likely episodic rather than continuous. The SST stack shows repeating periods of low SST between 70–20 ka. The cooling during these brief intervals may have been similar or slightly less than that experienced during the LGM, judging from the SST record.
Chronology of cold climate landforms on the Southern Tablelands with regional paleoenvironmental records. (A) Age-ranked plot of OSL ages (<80 ka) from Black Mountain. (B) Relative probability plot of radiocarbon ages from Table 1. (C) Length of individual glacier advances at Blue Lake in the Snowy Mountains (T = Twynam Advance, B = Blue Lake advance, H = Headley Tarn Advance, S = Snowy River Advance) (Barrows et al., Reference Barrows, Stone, Fifield and Cresswell2001). (D) Selected pollen taxa from Lake George core LG4; alpine taxa are those identified in Singh and Geissler (Reference Singh and Geissler1985, table 5), including Liliaceae = Astelia unconfirmed). (E) Sea-surface temperature stack for the Southern Ocean (Barrows et al., Reference Barrows, Juggins, De Deckker, Calvo and Pelejero2007).
A cooling of 8.2 ± 0.5°C would have resulted in a change in snow storage on the Southern Tablelands, increasing warm-season discharge, which in turn would influence the character of rivers draining the Tablelands (Reinfelds et al., Reference Reinfelds, Swanson, Cohen, Larsen and Nolan2014). The Lachlan River (Fig. 1) begins in the east of the Tablelands and forms part of the Murray-Darling Basin alluvial plain. A synthesis of the dating (e.g., Kemp et al., Reference Kemp, Pietsch, Gontz and Olley2017) and paleochannel size on the Lachlan River showed that at ca. 67 ka, bankfull discharge was 18 times the modern channel. At 24 ka it was 7–27 times modern and at 18 ka it was 12 times modern, before declining to 2.5 times at 16 ka (Hesse et al., Reference Hesse, Williams, Ralph, Fryirs, Larkin, Westaway and Farebrother2018). At the terminus of the Willandra Lake distributary, 575 km west of Black Mountain, discharge created lakes that contained water from before 50 ka until ca. 19 ka (Barrows et al., Reference Barrows, Fitzsimmons, Mills, Tumney, Pappin and Stern2020). Hesse et al. (Reference Hesse, Williams, Ralph, Fryirs, Larkin, Westaway and Farebrother2018) attributed these much larger bankfull discharges to higher runoff and possibly higher precipitation. Our findings rule out higher precipitation and suggest that increased runoff, largely as a function of lower evapotranspiration, the combination of colder temperatures with aridity, together with increased low altitude storage of precipitation as snow are the most likely causes of melt-season high discharges.
CONCLUSIONS
Fans and valley fills across the Southern Tablelands indicate pronounced erosion cycles during the Pleistocene, with relative stability during the Holocene. Inactive periglacial deposits, such as screes, solifluction, and frost cracks, indicate periglacial conditions at low altitude. The altitude of inactive screes indicates that the frost cracking limit was ~1300 m lower during formation, and mean winter temperature was 8.2 ± 0.5°C colder than present.
Radiocarbon and OSL ages from screes, alluvial valley fills, and fans date formation to the last glacial maximum and the late Pleistocene, possibly back to 66 ka, with activity ceasing by ca. 13 ka. Exposure dating and OSL ages on a soil indicate another phase of landscape stability in the previous glacial cycle, probably back to ca. 420 ka. The erosion rate on the eastern side of Black Mountain over this time has been 7.3–8.6 m/Ma.
Most of southeastern Australia above ~600 m experienced periglacial conditions during maximum cooling. Vegetation was probably steppe with treeless and dry conditions promoting hilltop and hillside stripping, erosion, and increased run off. Cold conditions increased seasonal storage of snow and produced a strong seasonal bias of meltwater (and to a much lesser extent glacial meltwater). These higher seasonal flows produced large rivers that flowed into the arid interior.
Supplementary material
The supplementary material for this article can be found at https://doi.org/10.1017/qua.2021.72
Acknowledgements
This research began as a BSc Honours project by TTB, supervised by Patrick De Deckker. We are grateful to him for drawing our attention to the slope deposits in the National Botanic Gardens and encouraging the research. The dating was supported by Australian Research Council grant DP110103081. This paper is dedicated to Robert (Bob) W. Galloway who inspired this work. Bob found the wedge structures at Lake George and produced the sedimentary log and some of the discussion about that site. We thank the Australian National Botanic Gardens (Permit Number 2012/13 1) for access and permission to sample within the grounds. We are very grateful to R. (Bert) Roberts for two pilot OSL ages. We thank Brad Pillans for providing access to unpublished data and assisting with the collection of the pilot samples. We thank Elena Savidge (University of Wollongong) for redrafting the Lake George figure. Reviews from Paul Hesse, Geoffrey Hope, Nicholas Lancaster, and Yeong Bae Seong improved the manuscript.


 Open access