




Introduction
Banana (Musa spp.) is an important food crop throughout the world, with a global production of about 149 million tonnes in 2021 (Lescot, Reference Lescot2023). This production includes (i) dessert banana, with 103 million tonnes produced, of which 24 million tons are exported. This sector relies on a limited number of varieties mainly related solely to the Cavendish subgroup (Musa acuminata, AAA), and (ii) plantains (Musa acuminata × Musa balbisiana, AAB) and cooking bananas, with 24 and 23 million tonnes produced, respectively, which are major staple foods in many tropical areas (Goenaga et al., Reference Goenaga, Irish and Marrero2019; Kwa and Temple, Reference Kwa and Temple2019).
For the dessert banana, the reliance on such an extremely narrow genetic base for production makes the world market particularly vulnerable to ecological and climatic changes, pests, and diseases. These clones are particularly susceptible to diseases, such as the Black Leaf Streak Disease (BLSD) caused by Pseudocercospora fijiensis, and the emerging fusarium wilt caused by the fungus Fusarium oxysporum f. sp. cubense Tropical Race 4. Varietal improvement is therefore a potential lever for maintaining world banana production, by developing varieties that are resistant to biotic and abiotic stresses (Salmon et al., Reference Salmon, Bakry, Efile, Ricci, Toniutti and Horry2023).
The plantain banana, previously produced for self-consumption, becomes more and more a main cash crop in Africa, and a source of diversification of financial income in rural areas due to the rise in the proportion of production sold on domestic markets and regional export markets. Thus, in addition to its role in addressing food security, the plantain also contributes to the economies in Africa (Tomekpe et al., Reference Tomekpe, Kwa, Dzomeku and Ganry2011) by generating considerable employment and being more lucrative than other traditional crops such as cassava, maize, or yam and also because of lower labour requirements. These changes in the plantain market chain led growers to mostly harvest green fruit at different maturity stages, depending on the distance to market (Udomkun et al., Reference Udomkun, Masso, Swennen, Innawong, Fotso Kuate, Alakonya, Lienou, Ibitoye and Vanlauwe2021). However, there is no reliable predictor to guide plantain growers on when to harvest.
Accurate harvest time prediction is a challenge for developing sustainable fruit production and reducing food waste (Lee et al., Reference Lee, Monteiro, Barclay, Marcar, Miteva-Neagu and Parker2020), particularly for crops that have a short period of optimum size, weight, or quality in the field, as well as a short shelf life. It is important to have an accurate estimate of the planned harvest schedule to supply local, regional, or export markets and avoid losses, particularly due to fruit ripening during distribution through the marketing chain. For the banana, the most common method of estimating harvest date in use is that of age/grade control, which combines the bunch emergence to harvest interval and fruit size (Ahmad et al., Reference Ahmad, Clarke and Thompson2001). This method is based on empirical relationships between the fruit storability, generally assessed from the green life of banana (Tixier et al., Reference Tixier, Salmon and Bugaud2010), with its age in days or weeks since flowering, and with its size through a thermal time model that is widely used to predict plant responses and dates of phenological events, such as flowering or harvest. Several methods can be used to calculate thermal time based either on assuming a linear relationship between temperature and the development rate (Arnold, Reference Arnold1959; Bonhomme, Reference Bonhomme2000) or on non-linear models to define plant response to temperature (Amaral et al., Reference Amaral, McConchie, Dickinson and Walsh2023; Molitor et al., Reference Molitor, Junk, Evers, Hoffmann and Beyer2014). Nevertheless, these models require complex computational procedures and present some limitations when implemented for practical usage by growers and managers that can be overcome through the improvement of the parameters of simple thermal time models. Thermal time has been used in phenological models of many fruit trees to predict the flowering stages, the timing of fruit ripening, and the maturity date of fruits (Amaral et al., Reference Amaral, McConchie, Dickinson and Walsh2023; Chen et al., Reference Chen, Roan, Lee and Chen2016; Łysiak and Szot, Reference Łysiak and Szot2023), and for some species, including several cultivars (Zapata et al., Reference Zapata, Salazar, Chaves, Keller and Hoogenboom2015).
However, the predictive capacity of any thermal time method depends on an accurate determination of base or threshold temperature (defined here by θ). A major difficulty for users is the lack of information on θ used to build thermal time sum models, particularly in the context of the current efforts to develop more sustainable banana cropping systems through varietal diversification. Moreover, errors in estimating or questionable interpretation thereof, such as the physiological base temperature, i.e., the temperature at which no growth or development occurs, will lead to error in the quality of model prediction (Normand and Léchaudel, Reference Normand and Léchaudel2006).
The threshold temperature θ is therefore a statistical parameter whose accuracy and use depend on the calculation method and on the domain of validity, respectively (Bonhomme, Reference Bonhomme2000; Yang et al., Reference Yang, Logan and Coffey1995). Many methods to determine θ have been reported and are essentially based on the least standard deviation in growing degree days or in days, on the coefficient of variation in days, and on the regression coefficient (Yang et al., Reference Yang, Logan and Coffey1995). Previous studies on the banana have relied on one method to estimate the threshold temperature for predicting harvest date based on the thermal time sum of different varieties (Tixier et al., Reference Tixier, Salmon and Bugaud2010; Umber et al., Reference Umber, Paget, Hubert, Salas, Salmon, Jenny, Chillet and Bugaud2011). In these studies, the threshold temperature was estimated from the slope of the regression between the heat units accumulated above 0°C during the flowering-to-ripening interval and this interval in days. But the limit of this approach was to often overestimate the threshold temperature compared to the other statistical methods reported in the literature and presented by Yang et al. (Reference Yang, Logan and Coffey1995). Moreover, studies on estimating the threshold temperatures reported the variation of this statistical parameter according to varieties (Souza et al., Reference Souza, Leonel and Carvalho da Silva2011; Umber et al., Reference Umber, Paget, Hubert, Salas, Salmon, Jenny, Chillet and Bugaud2011; Zapata et al., Reference Zapata, Salazar, Chaves, Keller and Hoogenboom2015).
Fruit splitting on the plant due to excessive pulp growth (Rubel et al., Reference Rubel, Hossain, Hafiz, Rahman and Khatun2020) is a disorder that can limit the evaluation of the duration of the phenological phase between flowering and the natural fruit ripening on the plant. So, for cultivars encountering this disorder, the threshold temperature cannot be estimated from dataset of the phenological phase between flowering and ripening. However, as proposed on mango, the objective of the calculation method can be adapted through use of thermal time scale, by the superimposition of growth curves from contrasting temperature conditions (Normand and Léchaudel, Reference Normand and Léchaudel2006).
The aim of this study is to present the harvest date prediction of various varieties of dessert and plantain bananas from estimates of the threshold temperature, depending on the banana cultivar. The proposed approach was developed by adapting the thermal time sum method to minimize the variability of either the duration of a given development phase, i.e., from flowering to natural ripening of fruit on the plant, or the occurrence of fruit splitting obtained under contrasted temperatures in different geographical areas. From these estimates, the optimum harvest date according to the targeted market was predicted by combining fruit storability, evaluated through green life measurements, and fruit grade.
Materials and methods
Plant material and experiment design
The banana plants assessed in this study were grown in Guadeloupe (at CIRAD Neufchateau (Field 1), 16°04′50″N, 61°36′08″W, elevation 250 m a.s.l., average annual rainfall 3500 mm, average daily temperature 25°C, soil classified as andosol, CIRAD Roujol (Field 2) 16°10′53″N, 61°35′24″W, elevation 15 m a.s.l., average annual rainfall 2000 mm, average daily temperature 27°C, soil classified as alluvial and Baie-Mahault (Field 4) 16°15′37″N, 61°35′25″W, elevation 50 m a.s.l., average annual rainfall 1195 mm, average daily temperature 26.1°C, soil classified as alluvial), in Martinique (at CIRAD CAEC station (Field 6), 16°37′15″N, 61°58′13″W, elevation 20 m a.s.l., average annual rainfall 2000 mm, average daily temperature 26.5°C, soil classified as ferrisol), in Reunion (at CIRAD Bassin Plat station (Field 3), 20°52′48″S, 55°31′48″E, elevation 150 m a.s.l., average annual rainfall 1200 mm, average daily temperature 23°C, soil classified as brown-andic), and in Cameroon (at CARBAP station (Field 5), 4°34‘12”N 9°38‘47”E, elevation 80 m a.s.l., average annual rainfall 2700 mm, average daily temperature 26°C, soil classified as young brown andosol). There were six trials in Field 1 conducted in 2009, 2017, 2018, 2019, 2020, and 2021 to 2023, respectively, and one trial in each of the other Fields (2 to 6) conducted in 2018, 2021, 2019, 2020, and 2022 for Fields 2 to 6, respectively. During each trial, the various plant observations, i.e., flowering date, bunch harvest date, fruit grade, green life, and first fruit splitting, were conducted over several months covering the different seasons throughout the year. All the trials from which the data are derived were conducted under non-limiting conditions for nutrients and water: monthly fertilizer applications (100 g/plant of complete fertilizer, 15–4–30 NPK) and irrigation during the dry season.
The dessert varieties studied were triploid Musa acuminata 925, 931, 938, 964, 965, 966, obtained by hybridization at CIRAD Neufchateau and selected through the CIRAD banana breeding programme for their agronomical and taste traits (Bugaud et al., Reference Bugaud, Deverge, Daribo, Ribeyre, Fils-Lycaon and Mbéguié-A-Mbéguié2011; Salmon et al., Reference Salmon, Bakry, Efile, Ricci, Toniutti and Horry2023), especially for their resistance to leaf spot diseases (Abadie et al., Reference Abadie, Chilin-Charles, Huat, Salmon, Pignolet, Carlier, Lescot, Côte and Jenny2009). The seventh variety was a plantain banana variety, cv. French Clair (AAB). The temperature data were recorded at an hourly step from a meteorological station or temperature sensor (Tinytag, Gemini Data Loggers Ltd., UK) installed in each plot. Each day, an average of temperatures hourly recorded was calculated to use daily average temperature values in the models.
Measurements of phenological phase, fruit characteristics, and green life
First to estimate the threshold temperature θ of each variety, we recorded the flowering date (defined as the date when the inflorescence was pendulous with all the bracts fully opened and all the hands were in horizontal position) and the ripening date (defined as the date when the first yellow fruit was observed on the bunch). These records allow us to determine the flowering-to-ripening interval (hereafter denoted FRI). For each plant, the development rate of the banana bunch from the flowering to the first ripe fruit on the bunch was calculated as the inverse of the FRI, in day-1. For each FRI, the mean temperature of the interval was calculated from the daily temperatures recorded.
At various harvest dates (n = 49 plants for cv. French Clair, n = 118 plants for CIRAD 938, n = 15 plants for CIRAD 931, n = 128 plants for CIRAD 964, n = 124 plants for CIRAD 965, and n = 110 plants for CIRAD 966), bunches were harvested and we measured the fruit diameter (grade, in mm) of the external fruit of the middle zone of the third hand for dessert banana and the middle hand for the plantain one, and we determined the fruit storability by measuring its green life (GL) at 20°C of the external and internal fruits of the middle zone of the third or middle hand for dessert bananas plantains, respectively. The mean GL was calculated for each bunch, i.e., each plant. The GL, expressed in the number of days between harvest and onset of the climacteric rise of each harvested fruit, was determined as described by Tixier et al., (Reference Tixier, Salmon and Bugaud2010). The onset of the climacteric peak corresponded to the day when fruit firmness suddenly decreased (measured manually each day) and when the fruit turned yellow naturally after storage in a room at 20°C and 85% of relative humidity, without added ethylene.
In the particular case of the 925 variety, we noted the fruit splitting percentage.
Thermal time model and threshold temperature estimation
The thermal time model to predict harvest date of banana considers that the time needed for the completion of the phase between flowering and ripening of the first fruit on the bunch is constant and weighted by the temperature above a threshold temperature θ as follows: ${\rm{TT}}{{\rm{S}}_{{\rm{FRI}}}} = \sum\limits_{{\rm{i}} = 1}^{\rm{n}} {\left( {{{\rm{t}}_{{\rm{mi}}}} - {\rm{\theta }}} \right){\rm \cdot \, {\delta }\, }, {\rm{where \,\delta }} = \left\{ {\matrix{{0,{{\rm{t}}_{{\rm{mi}}}} \le \theta } \cr {1,{{\rm{t}}_{{\rm{mi}}}} \gt \theta } \cr} } \right.}$
where TTSFRI is the thermal time sum for the FRI in degree.days (°C.days). The date of ripening of the bunch is considered when the first fruit turns yellow, tmi the mean temperature at day i (°C), and n the number of days of the phase.
The threshold temperatures for the FRI of the different varieties of banana studied were calculated using five statistical methods described by Arnold (Reference Arnold1959), including a minimization of 1) the standard deviation, expressed in degree.days, of the thermal time sums of the FRI dataset (M1); 2) the standard deviation, expressed in days, corresponding to the thermal time sums of the FRI dataset (M2); 3) the coefficient of variation of the thermal time sums of the FRI dataset (M3); or 4) zeroing the regression coefficient between thermal time sums and the mean temperature during the FRI (M4); or 5) calculating the x-intercept value of the linear relationship between the development rate (1/phase duration in days) and the mean temperature during the FRI (M5).
The threshold temperature for the FRI was estimated for five dessert banana varieties, i.e., CIRAD 938 (n = 324 plants), CIRAD 931 (n = 51 plants), CIRAD 964 (n = 184 plants), CIRAD 965 (n = 191 plants), and CIRAD 966 (n = 208 plants), and one plantain variety, i.e., French Clair (n = 70 plants). The k-fold cross-validation method was used to evaluate the model. Cross-validation is a statistical technique that assesses the performance of a learning algorithm by dividing the data into two parts: one for calibration and the other for validation (Refaeilzadeh et al., Reference Refaeilzadeh, Tang, Liu, Liu and ÖZsu2009), with a calibration:validation ratio of 70:30. In k-fold cross-validation, the dataset is partitioned into k equally sized subsets. In each iteration, one subset is set aside for validation while the remaining k − 1 subsets are used for calibration. This process is repeated k times, with each subset used once as the validation set. If the dataset contains about 50, 70, or more than 100 observations, k equals 5, 7, or 10, respectively. The performance of the thermal time model to predict FRI for each studied variety was calculated by averaging the performances of all iterations. For each variety, three parameters were used to evaluate the performances of all the iterations: the coefficient of determination (R²C and R²V, for calibration and validation, respectively) of the linear regression between the predicted and observed FRI, the root mean square error (RMSEC and RMSEV, for calibration and validation, respectively), and the mean absolute percentage error (MAPEC and MAPEV, for calibration and validation, respectively) calculated from the predicted and observed FRI.
The RMSE was calculated with the following formula: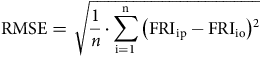 ${\rm{RMSE}} = \sqrt {{1 \over n}\cdot \sum\limits_{{\rm{i}} = 1}^{\rm{n}} {{{\left( {{\rm{FR}}{{\rm{I}}_{{\rm{ip}}}} - {\rm{FR}}{{\rm{I}}_{{\rm{io}}}}} \right)}^2}} }$
where FRIip and FRIio are the predicted and observed FRI values of the fruit, respectively, and n is the number of observations.
The formula for MAPE is as follows: ${\rm{MAPE}} = {1 \over n}\cdot\sum\limits_{{\rm{i}} = 1}^{\rm{n}} {\left| {{{{\rm{FR}}{{\rm{I}}_{{\rm{io}}}} - {\rm{FR}}{{\rm{I}}_{{\rm{ip}}}}} \over {{\rm{FR}}{{\rm{I}}_{{\rm{io}}}}}}} \right|\cdot100}$
Once θ was estimated for each method, a mean of θ was calculated (hereafter denoted as θmean). Then, based on θmean, the mean daily temperatures and the dates of flowering and harvesting, the thermal time sum on the FRI was calculated.
Particular case of 925 banana variety
The threshold temperature for 925 was estimated from the occurrence of fruit splitting on the plant during its development under contrasted temperature conditions in two geographical areas where this variety was cultivated, i.e., Guadeloupe and Reunion. The model of changes in the occurrence of fruit splitting is based on the logistic equation: ${{\rm{FS}} = 1/\left( {1 + {{\rm{e}}^{{{{\rm{TT}}{{\rm{S}}_{{\rm{mid}}}} - {\rm{TTS}}}}\over{{scald}}}}} \right), \text{ with}\; \text{TTS} = \sum\limits_{{\rm{i}} = 1}^{\rm{n}} {{\rm{(}}{{\rm{t}}_{{\rm{mi}}}}{\rm{ - }}\theta {\rm{) }}\cdot{\rm}\delta }\ {\rm as \ per \ eq. \;1}}$
where FS is the number of splitting fruits per bunch (in %) at day d, TTS the thermal time sum at day d from flowering (°C.d), TTSmid the thermal time sum when the occurrence of splitting fruit was equal to 50%, corresponding to the thermal time sum at mid-asymptote or at the inflection point (°C.d), tmi the mean temperature at day i (°C), and scald (°C−1.d−1) a parameter that characterizes the inverse of the speed of the occurrence of fruit splitting, corresponding to the slope at the inflection point. The parameters TTSmid, scald, and θ were estimated by minimizing the sum of squares of deviations from the observed percentage of splitting fruits on a bunch.
All the statistical analyses were performed with R software, version 4.1.2 (Team, Reference Team2021) with an alpha level of 0.05. For the first four methods of threshold temperature estimation, θ was estimated using a minimization algorithm for non-linear functions, i.e., the nlm() function from the Base package. The fifth method (M5) was carried out using linear regression, i.e., the lm() function from the Base package. For the 925, parameters TTSmid, scald, and θ were estimated with the nls() function from the Base package. The relationships between the development rate of banana and the mean temperature during the FRI, between the green life at 20°C of banana and the flowering-to-harvest thermal time sum, and between the grade of the external banana and the flowering-to-harvest thermal time sum were studied using linear regression, i.e., the lm() function from the Base package.
Results
Temperature threshold estimation
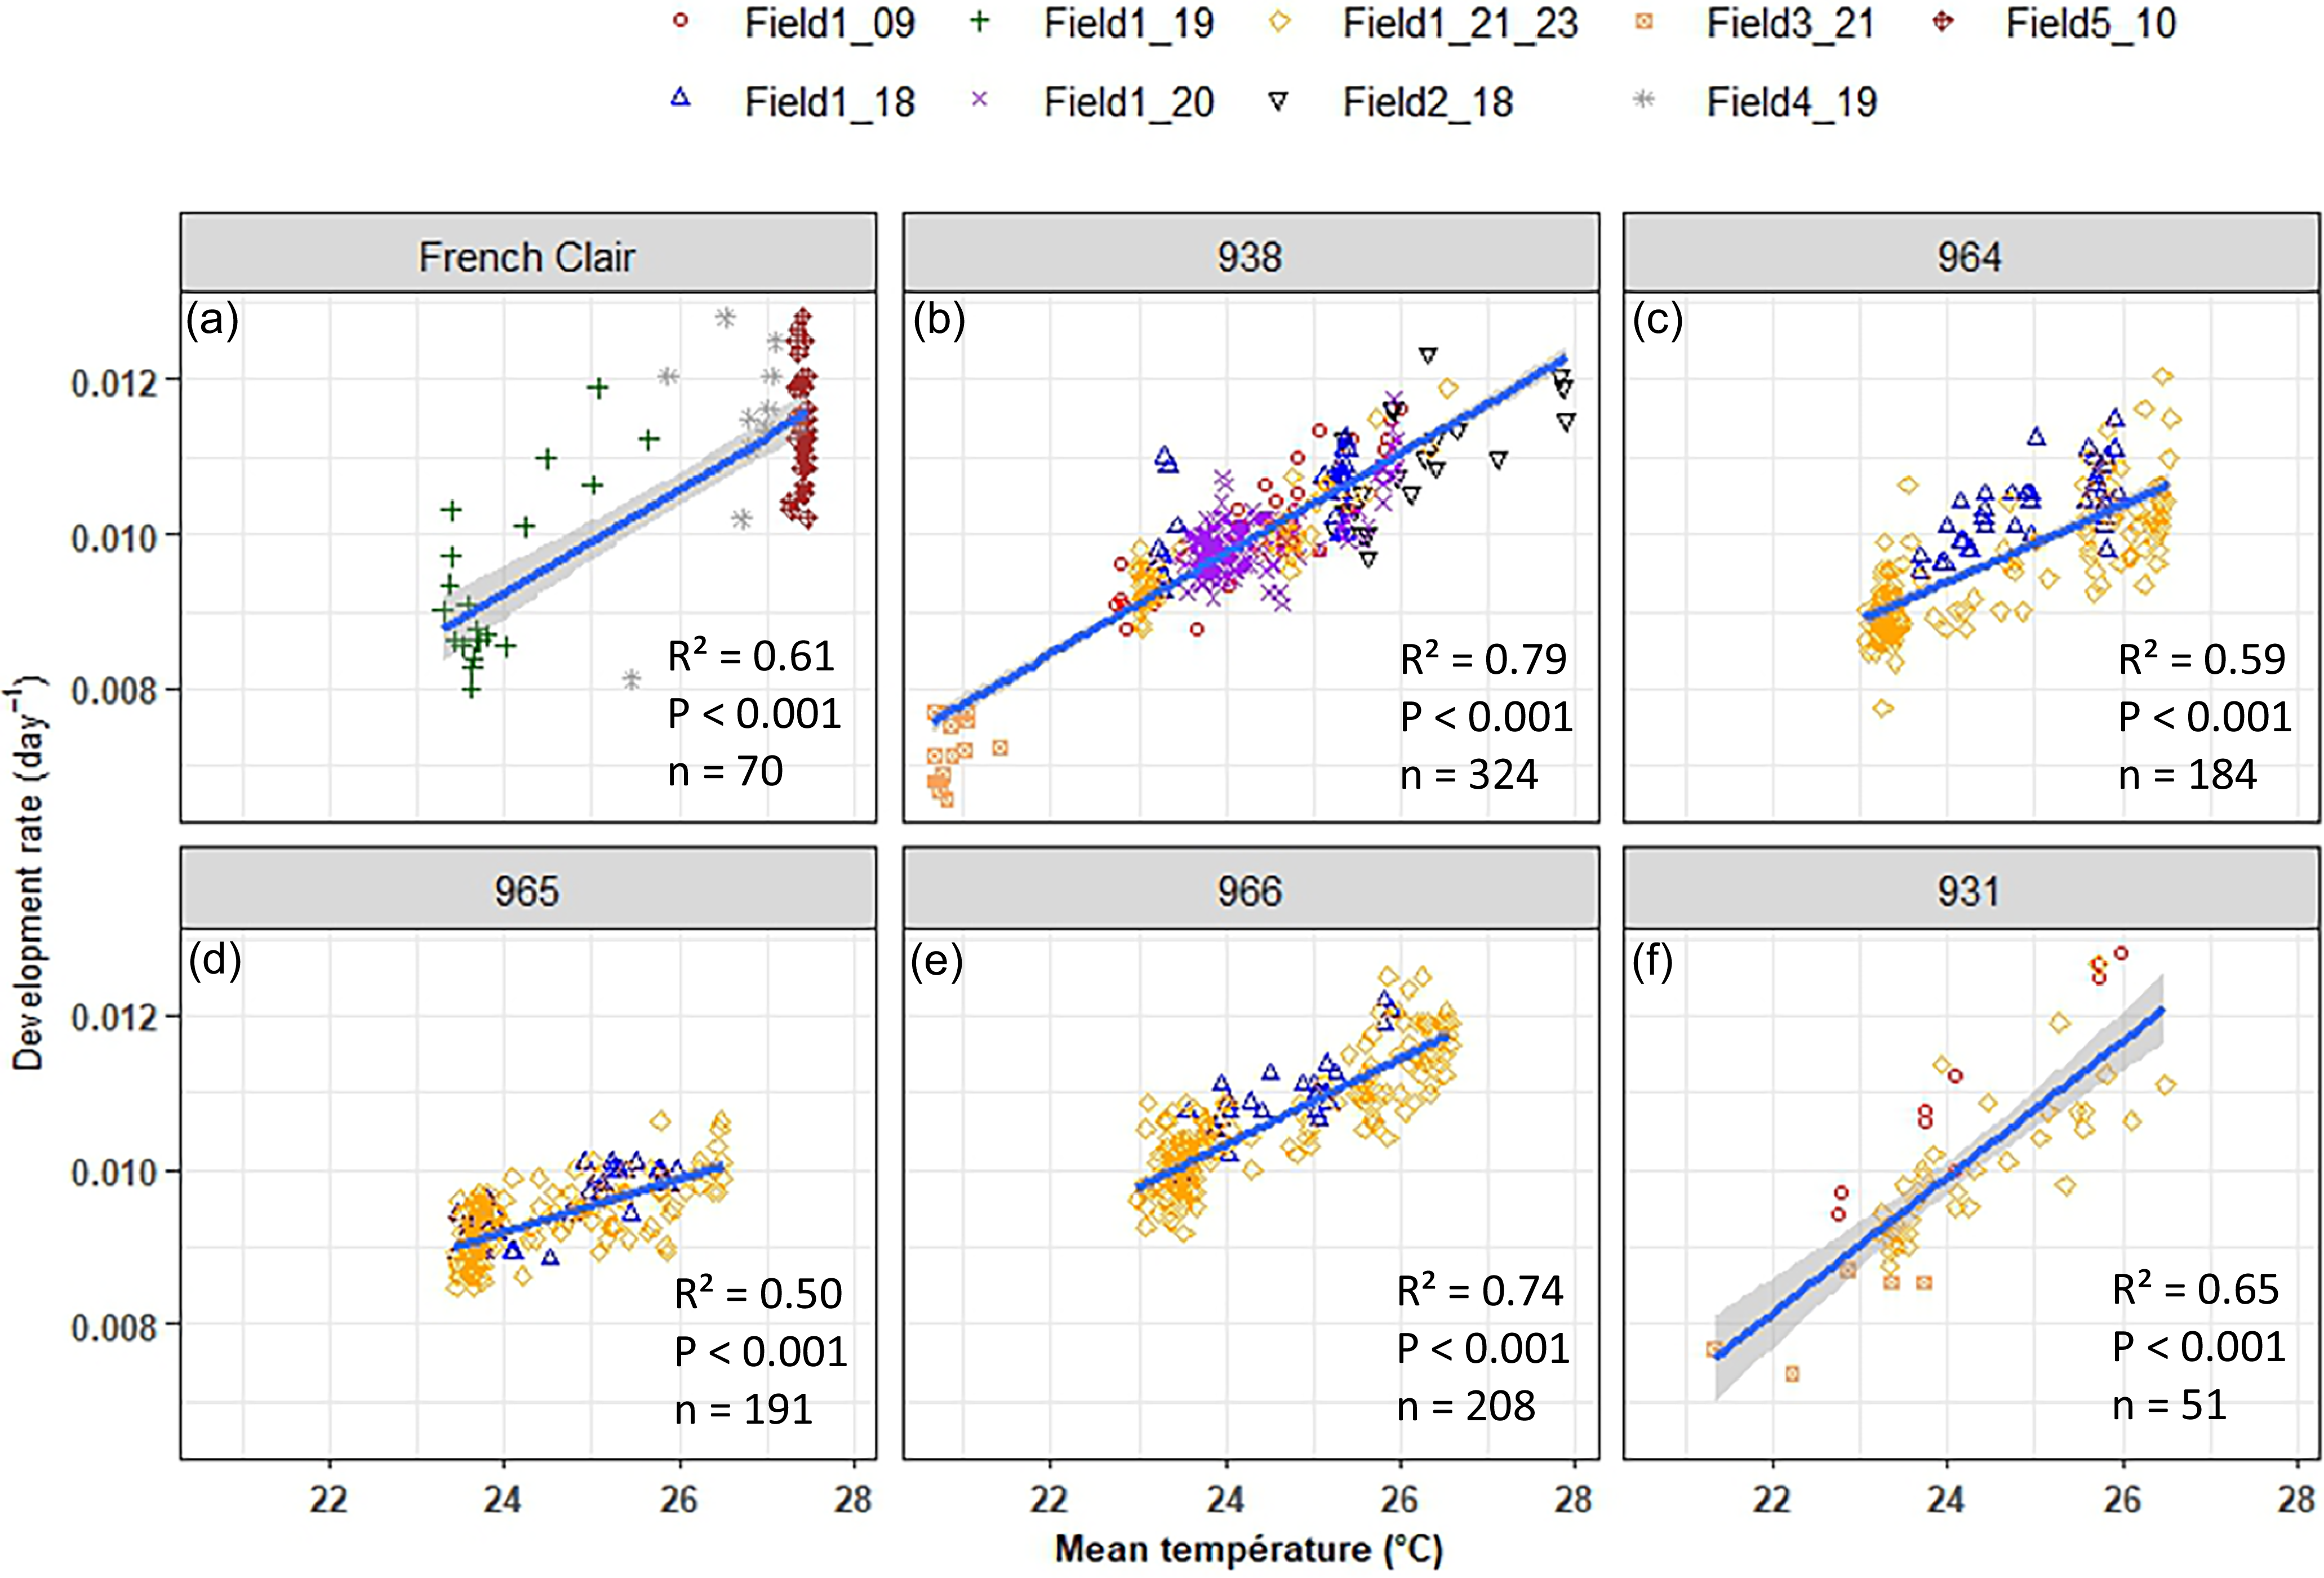
The mean temperatures during the FRI varied from 23.3 to 27.5°C, 20.6 to 27.9°C, 23.1 to 26.5°C, 23.4 to 26.5°C, 23.0 to 26.6°C, and 21.3 to 26.5°C, for French Clair (Figure 1a), 938 (Figure 1b), 964 (Figure 1c), 965 (Figure 1d), 966 (Figure 1e), 931 (Figure 1f), respectively. By integrating different years and regions, according to the studied variety, the mean temperatures of the FRI were contrasted. The development rates of the studied banana varieties, ranging from 0.0066 to 0.0125 day−1 (Figure 1), showed significant variability. It reflected the wide range in the duration of the FRI, from 80 to 200 days, 78 to 125 days, 81 to 152 days, 83 to 129 days, 94 to 118 days, 80 to 109 days, 78 to 136 days, for French Clair, 938, 964, 965, 966, 931, respectively. We found that the development rate is significantly and positively related to the mean temperature during the FRI. Both the intercept and slope of the linear models were different according to the variety (Figure 1).
Relationships between the development rate of bunch (1/duration of the flowering-first-ripening interval on the bunch, FRI, in day−1) and the mean temperature during the FRI (average of the daily temperatures during the FRI), for cv French Clair (a), 938 (b), 964 (c), 965 (d), 966 (e), and 931 (f). The adjusted R-squared, its corresponding p-value, and the number of data used to establish each relationship are presented for each banana variety. Each point corresponded to one plant on which the various measurements were recorded (flowering, first ripe fruit on the bunch).
For each studied variety, the different calculation methods gave similar values for θ, except the minimization of the standard deviation of the thermal time sums (M1), which gave a higher value in our study (Table 1). Given that, we calculated the θmean value only on the basis of the values of θ obtained by the M2 to M5 methods (Table 1).
Estimated threshold temperature (θ) and standard deviation (± s.d.) of the flowering-to-first-ripening interval on the bunch (FRI) of different banana varieties using five statistical methods (M1 to M5), and FRI prediction quality according to the estimated threshold temperature

n is the number of data used for estimating the threshold temperature; k is the number of folds for K-fold cross-validation; M1, M2, M3, M4, M5 are the statistical methods including a minimization of 1) the standard deviation of the thermal time sums of the FRI dataset, 2) the standard deviation, expressed in days, corresponding to the thermal time sums of the FRI dataset, 3) the coefficient of variation of the thermal time sums of the FRI dataset, or 4) zeroing the regression coefficient between thermal time sums and the mean temperature during the FRI, or 5) calculating the x-intercept value of the linear relationship between the development rate (1/phase duration in days) and the mean temperature during the FRI. θmean is the average of the estimated threshold temperatures using methods M2 to M5. ${\rm{R}}_{\rm{c}}^2$
, RMSEC, and MAPEC are the determination coefficient, root mean square error, and mean absolute percentage error of the calibration set;
${\rm{R}}_{\rm{c}}^2$
, RMSEC, and MAPEC are the determination coefficient, root mean square error, and mean absolute percentage error of the calibration set; ${\rm{R}}_{\rm{v}}^2$
, RMSEV, and MAPEV are the determination coefficient, root mean square error, and mean absolute percentage error of the validation set.
${\rm{R}}_{\rm{v}}^2$
, RMSEV, and MAPEV are the determination coefficient, root mean square error, and mean absolute percentage error of the validation set.
The performance of the model can be evaluated based on both calibration and validation sets, corresponding to calibration and validation parameters, respectively. In the case of model validation, the R² values varied from 0.51 to 0.85 for dessert varieties and was equal to 0.71 for plantain one, and the MAPE coefficients varied from 3 to 5.4% for dessert varieties and was equal to 6.8% for plantain one (Table 1). The best model performance was established for 938, with a regression coefficient between observed and predicted FRI higher than 0.8, a RMSE lower than 5 days, and a MAPE of 3.9%, for both the calibration and validation datasets (Table 1). The performance of the model for 966 was lower in terms of R², but was better in MAPE, i.e., 3%, and RMSE, i.e., less than 4 days. The performance of the model for the plantain variety was lower than for the dessert varieties, i.e., 931, 938, 964, with a R² value of about 0.7, a RMSE one of about 8 days, and a MAPE one of about 6.8%, regardless of the datasets. The mean θ value of the four methods retained as the threshold temperature was negative for the FRI in banana 965 (Table 1).
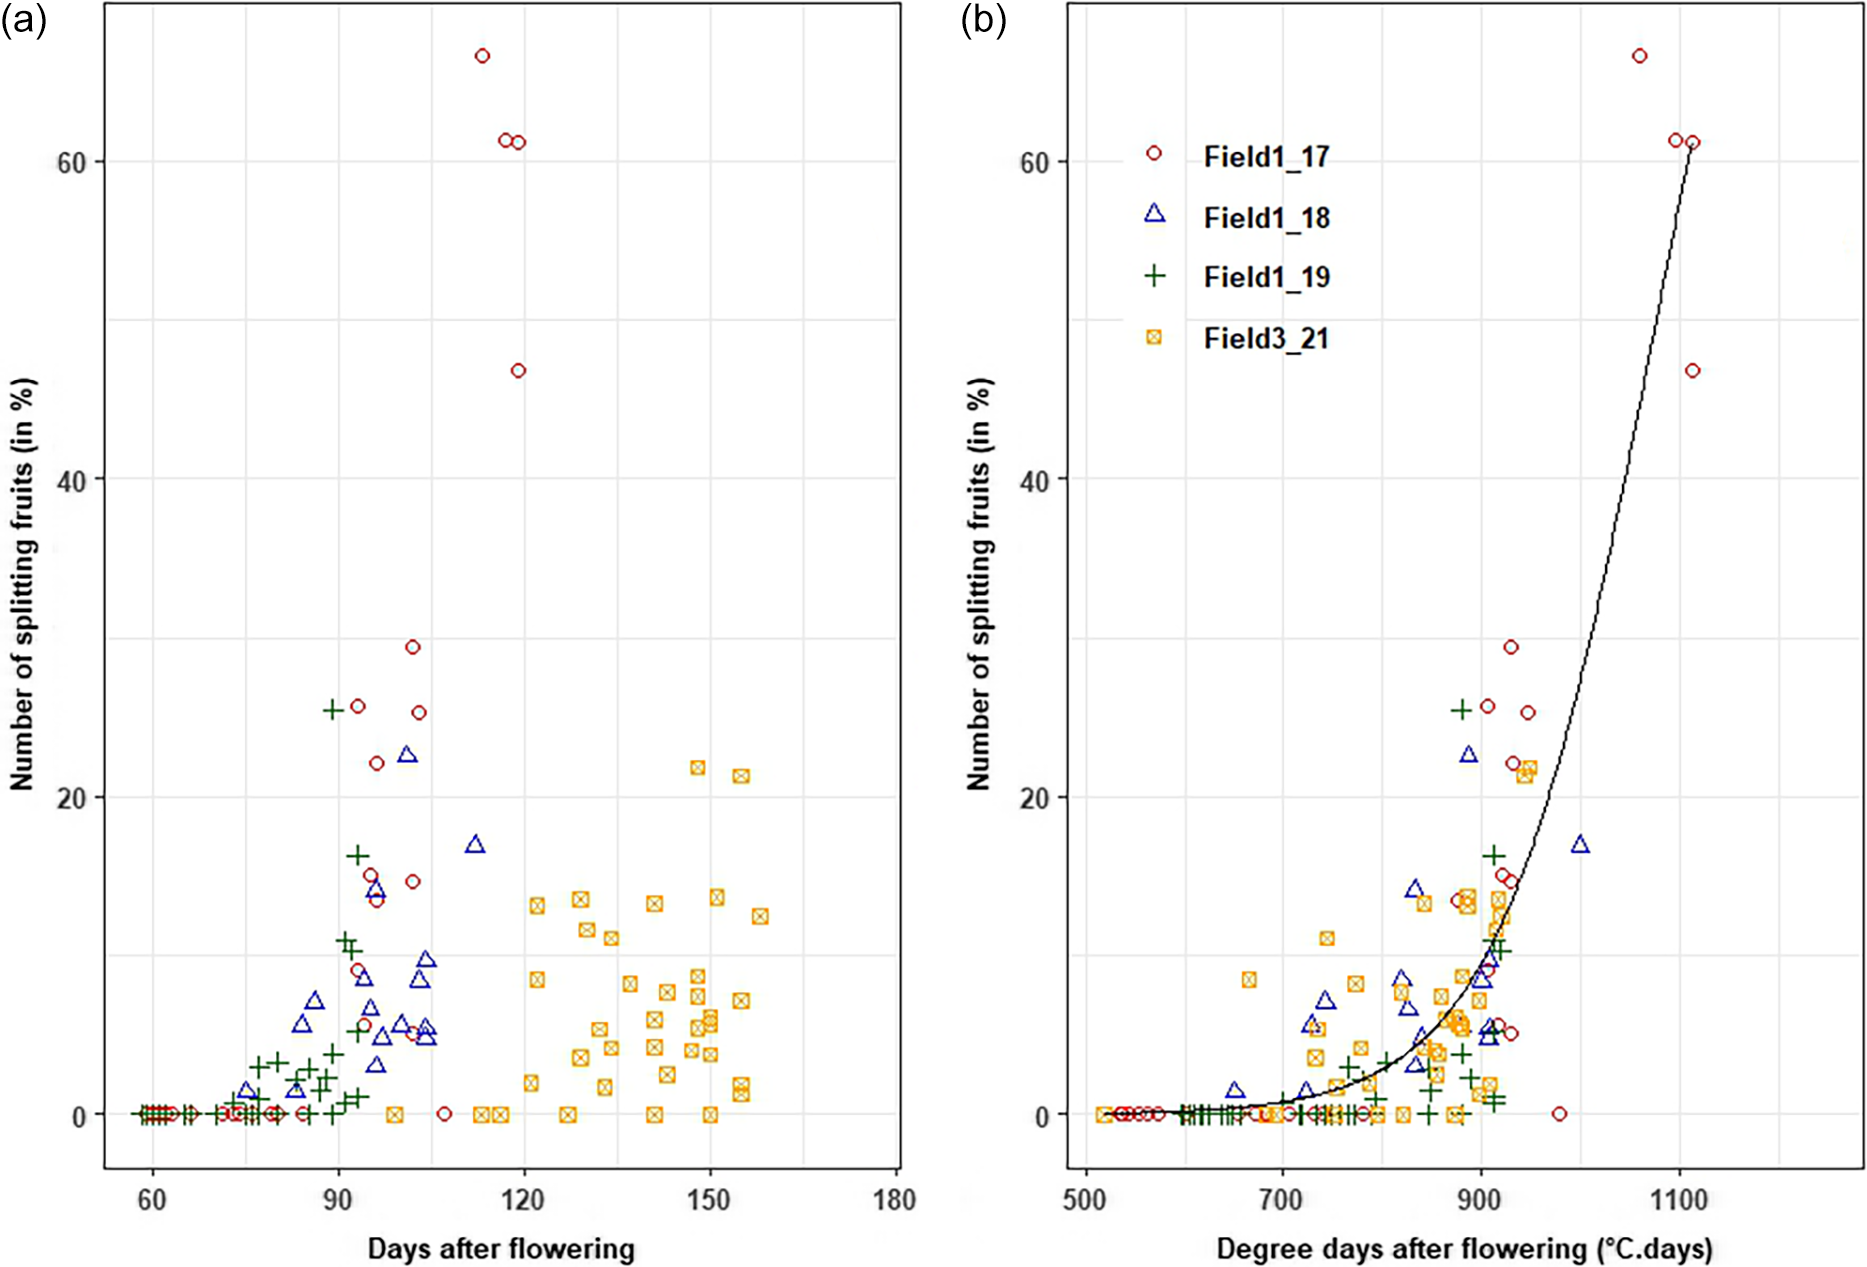
For the dessert banana 925, the estimated parameters of the occurrence of fruit splitting model were scald = 78.53 ± 4.12°C−1.d−1, TTSmid = 1076.45 ± 7.25°C.d, and θ = 15.1°C (n = 149 plants, RMSE = 5.2 days, MAPE = 3%, R² = 0.78). The threshold temperature model was well adjusted to the data issued from each field (Figure 2).
Changes in the occurrence of fruit splitting (in %) of banana cv 925 on the bunch according to the bunch age in days after flowering (a) and in degree days accumulated under the threshold temperature after flowering (b). The grey area corresponded to one to five percent of fruits splitting on a bunch.
Determining the optimum harvest date
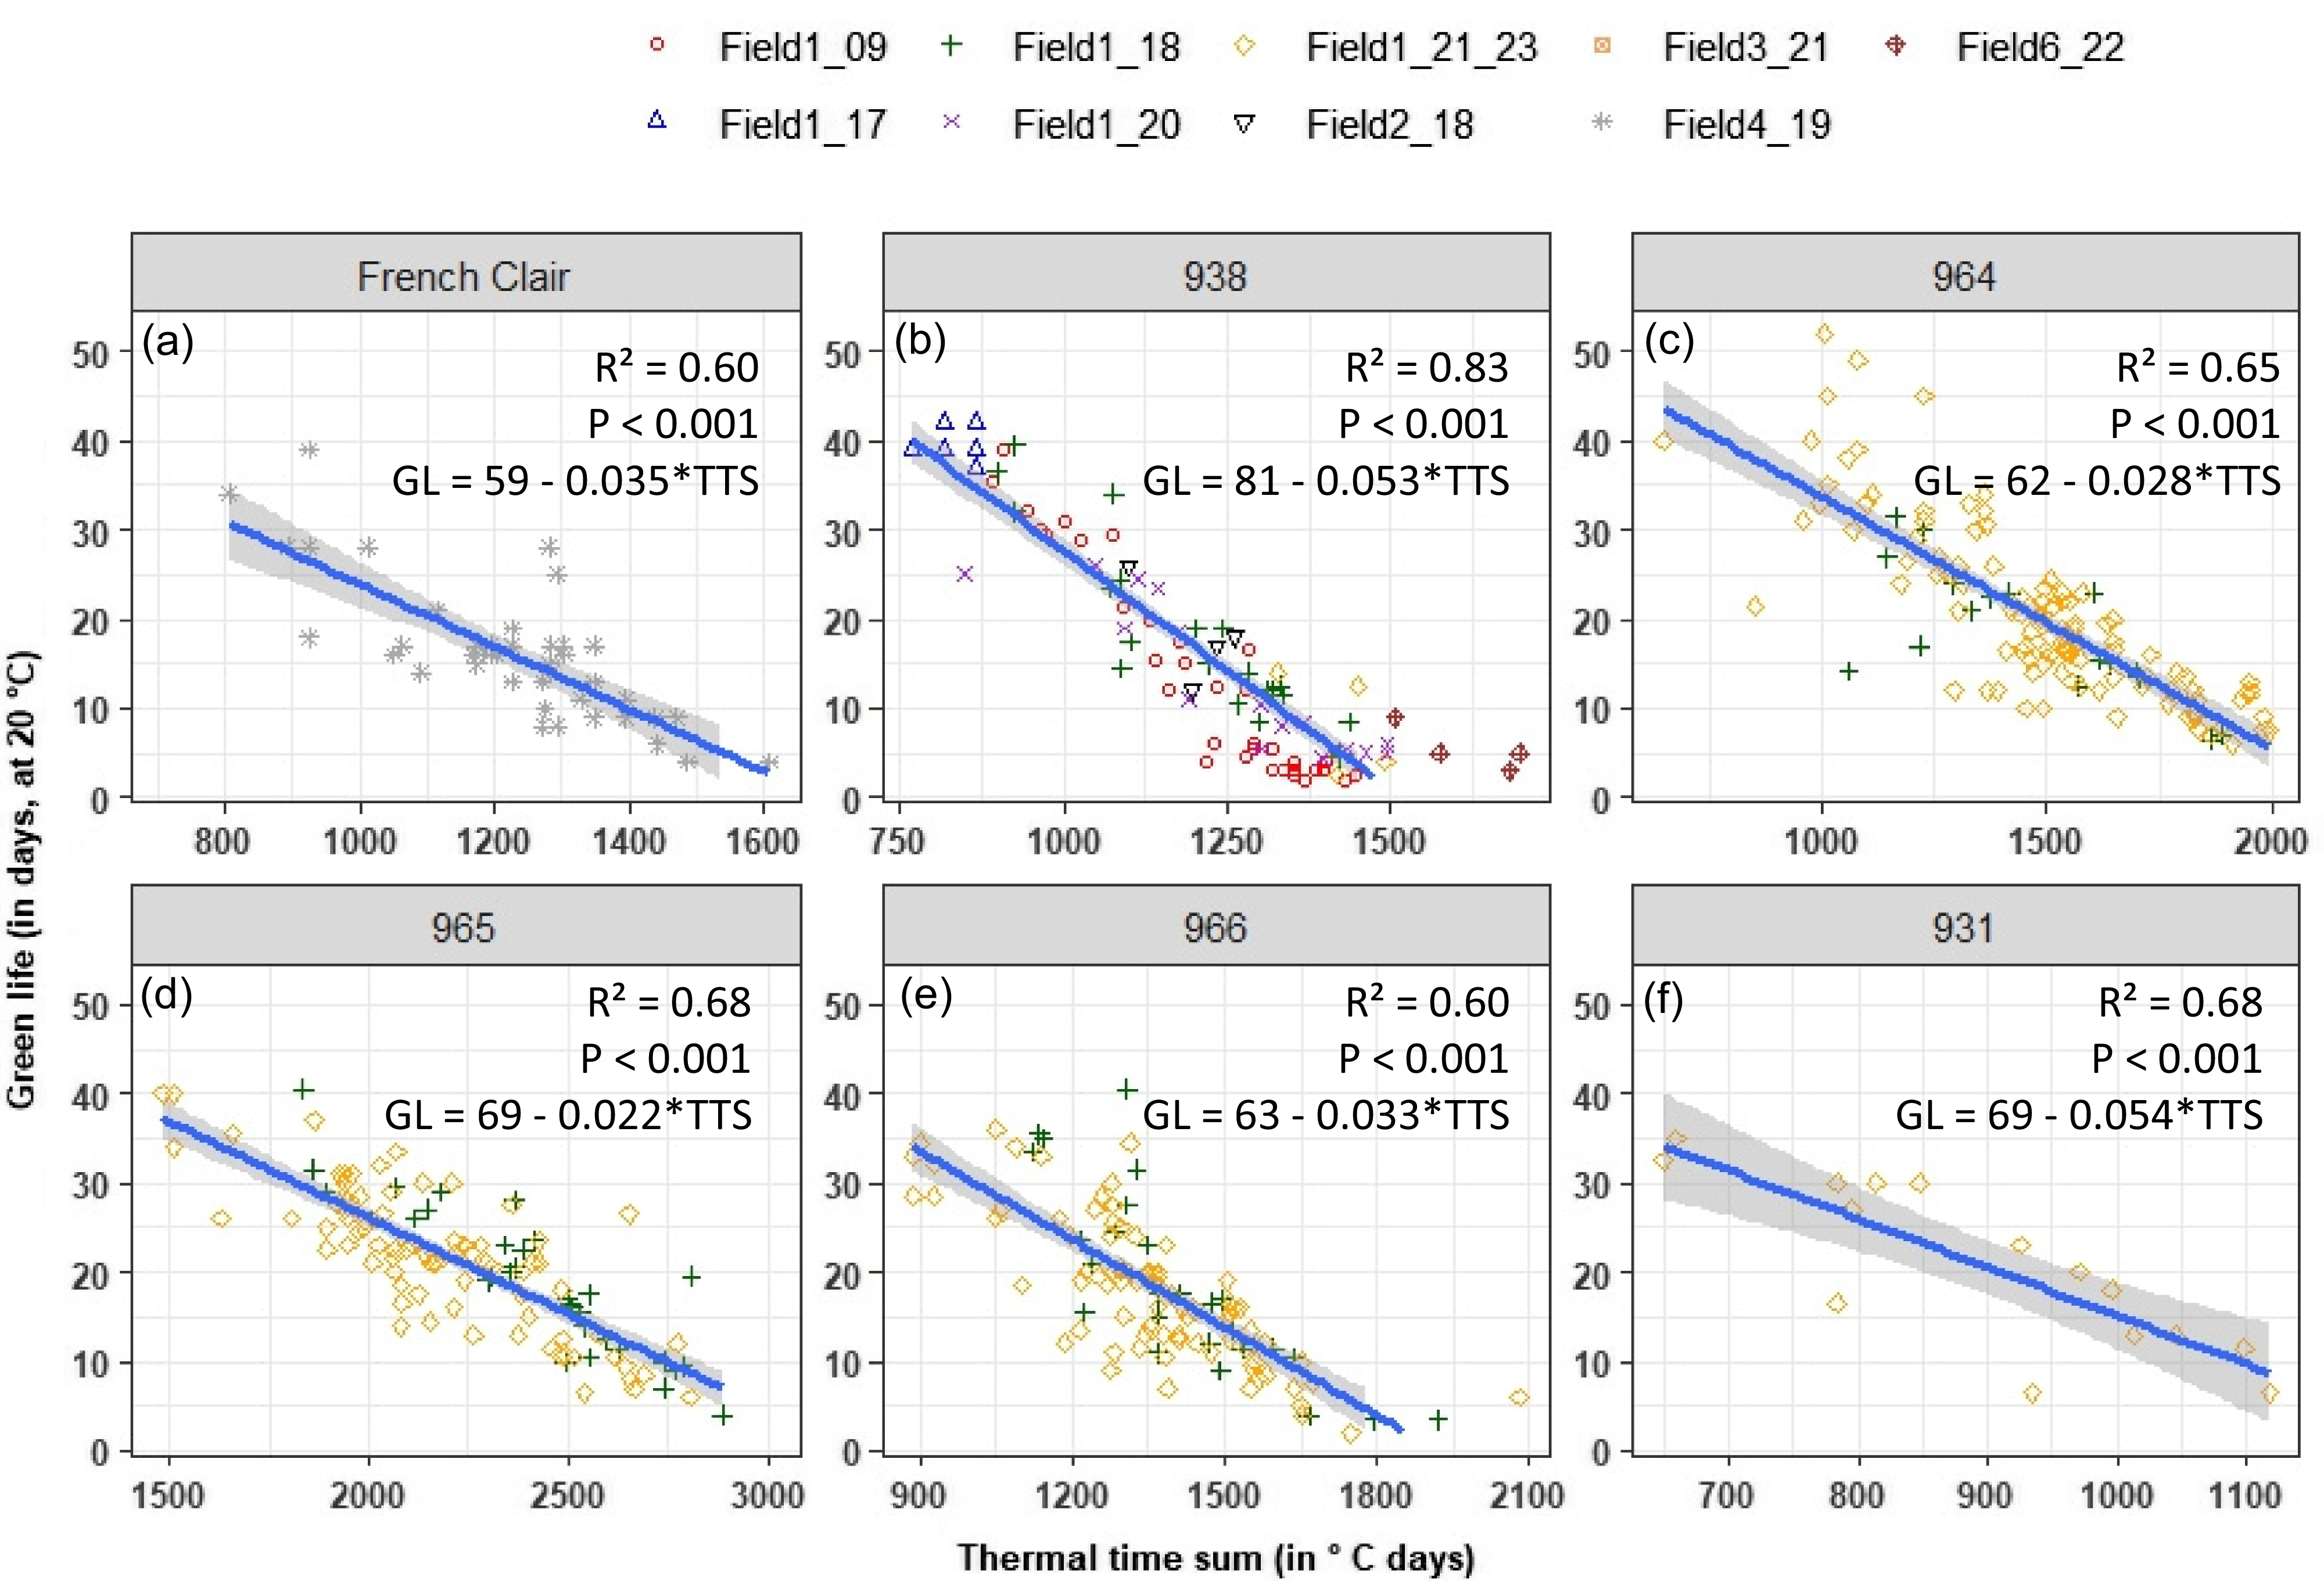
To assess the optimum harvest date for each dessert or plantain banana variety according to the target market, the relationship between fruit storability, evaluated by means of the fruit green life, and the age of bunch expressed in thermal time sum from flowering, was used. The fruit green life varied from 2 to 40 days and decreased with the bunch age in °C.days (Figure 3). This negative relationship was significant (P < 0.001), with a R² value of 0.60, 0.83, 0.65, 0.68, 0.60, and 0.68, for cv French Clair, 938, 964, 965, 966, and 931, respectively. For the plantain variety, cv. French Clair, the optimal harvest date for an export market, estimated for a range of 15–25 days of fruit storability, was about 950 to 1260°C.days accumulated above θ, i.e., 10.6°C for this cv. (Figure 3a, Table 1). The best relationship was assessed for 938 that held over a wide range of green life and age values (Figure 3b) by integrated contrasted conditions of temperatures and harvest dates from different years and geographical areas. In the case of exporting bananas, the targeted green life value depends on the distance between the production area and the market, i.e., regional or international. The thermal sum for an optimal harvest with a range of 15–25 days of fruit storability was around 1060 to 1250°C.days accumulated above θ, i.e., 9.6°C for 938 (Figure 3b, Table 1). A bunch aged more than 1500°C.days corresponds to a fruit green life closed to zero, for a local and direct market without storage, and also it would be observed as the first fruit ripening on the bunch. For the other dessert varieties, the significant relationship between green life ad bunch age in °C.days can be used to determine the optimum harvest date according to the targeted market (Figure 3c–f).
Relationships between the green life at 20°C of banana (corresponding to the number of days between the harvest and the natural ripening onset) and the flowering-to-harvest thermal time sum, for cv. French Clair (a) 938 (b) 964 (c) 965 (d) 966 (e), and 931 (f). The adjusted R-squared, its corresponding p-value, and the equation of the linear relationship are presented for each banana variety.
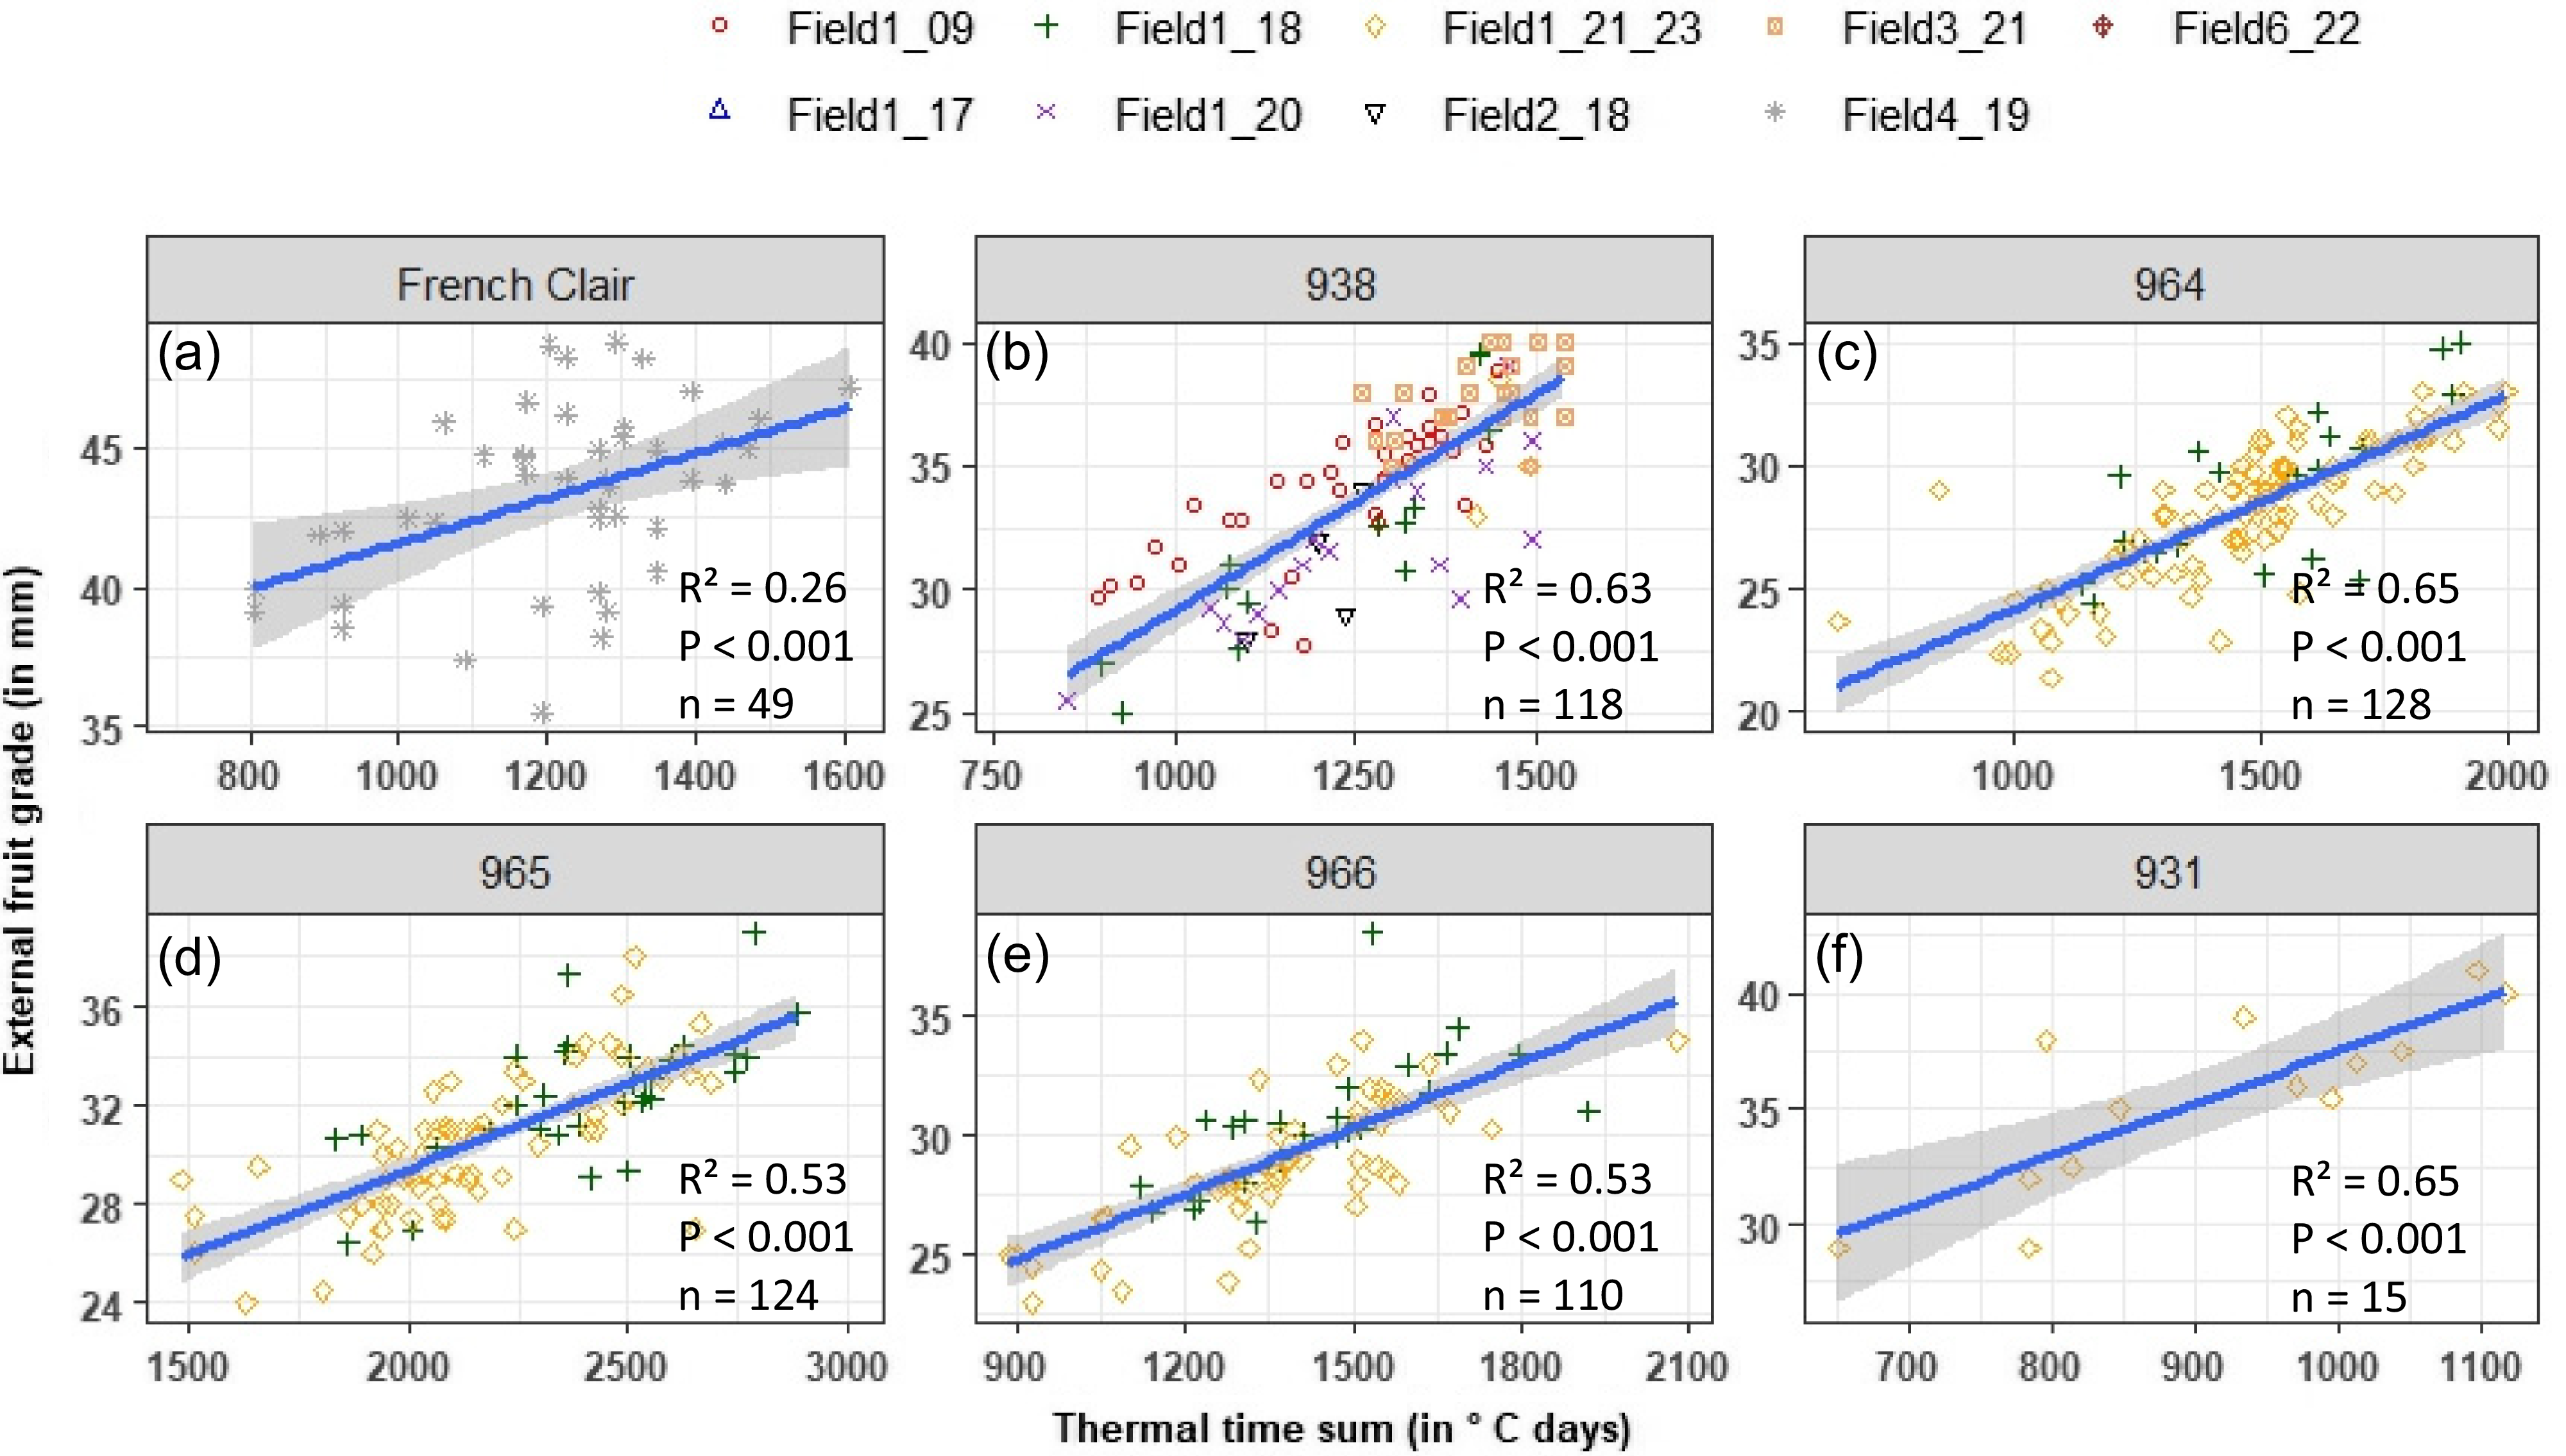
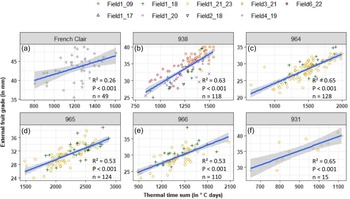
The fruit size increased with the age of the bunch at harvest (Figure 4). This positive relationship was significant (P < 0.001), with a R² value of 0.26, 0.63, 0.65, 0.53, 0.53, and 0.65, for cv French Clair, 938, 964, 965, 966, and 931, respectively. For an optimal harvest date adapted to export markets, i.e., with a range of 950 to 1260°C.days and 1060 to 1250°C.days for French Clair and 938, respectively, fruit grade was about 40.5–42.5 mm and 30 to 33 mm for the plantain variety (Figure 4a) and 938 (Figure 4b), respectively. For a local market with a short storage or without storage, i.e., with about 1700°C.days and 1500°C.days for French Clair and 938, respectively, the fruit grades were about 45 mm and 35–40 mm for cv. French Clair and 938, respectively (Figure 4a and b). The same method can be proposed for the four other dessert varieties by adjusting the thermal time sum value (Figure 4c–f).
Relationships between the grade of the external banana and the flowering-to-harvest thermal time sum, for cv French Clair (a) 938 (b) 964 (c) 965 (d) 966 (e), and 931 (f). The adjusted R-squared, its corresponding p-value, and the number of data used to establish each relationship are presented for each banana variety.
For the 925 variety, the optimum harvest date was determined as the period before the increase in the number of splitting fruits, provided that the fruit storability is not affected. The percentage of splitting fruits increased after about 846.2°C.days accumulated above θ of 15.1°C. The green life recorded for fruit harvested at this thermal time sum was about 31 ± 10 days (mean ± sd), and these fruits had a grade of about 35.8 ± 4.0 mm (mean ± sd) (data not shown).
Discussion
Temperature threshold of the flowering-to-fruit-ripening phase is variety-dependent
This study on the banana integrated experimental conditions based on datasets from different fields located at various elevations and across different seasons to lead to a wide range of temperatures that overlapped the optimum range for banana growth (Ganry and Meyer, Reference Ganry and Meyer1975). We showed that the development rate was significantly and linearly correlated with the mean daily temperature during the FRI. Furthermore, we found this relationship is variety-dependent and the wider the range of available temperatures the higher the value of the R² coefficient, as previously was shown for the plant growth rate of various organs of tropical tree species (Dambreville et al., Reference Dambreville, Normand and Lauri2013).
The proposed thermal time sum model can accurately predict the flowering-to-fruit-ripening phase (FRI) of various dessert banana varieties and for the first time of plantain bananas. Indeed, the performance model metrics were satisfying with RMSEV from 3.8 to 8 days; R²V ranging from 0.51 to 0.85 and with a relative percentage error MAPEV for the predicted FRI ranging from 3 to 6.8%. The temperature threshold values of the thermal time sum model were estimated through 5 statistical methods (Yang et al., Reference Yang, Logan and Coffey1995). So, these methods developed for phenological phases of different plants are also suitable in the case of banana harvest date prediction, regardless of the season or production site. As in previous works (Arnold, Reference Arnold1959; Bonhomme, Reference Bonhomme2000; Yang et al., Reference Yang, Logan and Coffey1995), one of these methods, i.e., M1, based on minimizing the standard deviation of the thermal time sums, estimated a higher threshold temperature value. On other varieties of banana, this method was previously used (Tixier et al., Reference Tixier, Salmon and Bugaud2010; Umber et al., Reference Umber, Paget, Hubert, Salas, Salmon, Jenny, Chillet and Bugaud2011) and presented high values of threshold temperature too. The estimated θmean for 965 was much lower than values reported for other tropical fruit crops (Amaral et al., Reference Amaral, McConchie, Dickinson and Walsh2023; Chen et al., Reference Chen, Roan, Lee and Chen2016). However, negative threshold temperatures have already been reported (Normand and Léchaudel, Reference Normand and Léchaudel2006; Wielgolaski, Reference Wielgolaski1999) for the flowering-or-harvest prediction. Therefore, θ should not be interpreted as the temperature below which the plant growth ceases. Rather, it should be considered a purely statistical parameter for prediction, without direct biological meaning. Moreover, this negative value may reflect the influence of other factors than temperature, such as fruit load or water availability, which are not always controlled experimentally and were not explicitly included in the models (Bertin, Reference Bertin2005; Bonhomme, Reference Bonhomme2000). Before increasing model complexity, we argue that model performance can be improved by expanding the range of temperatures covered by the data for each variety. Indeed, the best performance metrics were obtained for 938, which was characterized by the widest range of observed temperatures, i.e., from 21 to 28°C (Figure 1a–f). This broader temperature coverage resulted from combining datasets collected across multiple production zones with contrasting environmental conditions, while maintaining a consistent experimental design and standardized technical practices. This highlights the importance of environmental variability in improving model robustness and generalizability.
The threshold temperatures estimated were different according to the varieties. This variation according to cultivars was previously observed for the banana (Bugaud et al., Reference Bugaud, Deverge, Daribo, Ribeyre, Fils-Lycaon and Mbéguié-A-Mbéguié2011; Lassoudière, Reference Lassoudière2007; Tixier et al., Reference Tixier, Salmon and Bugaud2010). Cultivar-dependent variations in the threshold temperature for the FRI have been documented across several fruit crops, including peach (Munoz et al., Reference Munoz, Sepulveda, Garcia-Huidobro and Sherman1986; Souza et al., Reference Souza, Leonel and Carvalho da Silva2011), grape (Zapata et al., Reference Zapata, Salazar, Chaves, Keller and Hoogenboom2015), and mango (Amaral et al., Reference Amaral, McConchie, Dickinson and Walsh2023). Such differences are commonly attributed to genotypic effects on fruit growth and development (Daymond and Hadley, Reference Daymond and Hadley2008; Jędrszczyk et al., Reference Jędrszczyk, Skowera, Gawęda and Libik2016).
Because the reliability of threshold temperature estimates primarily depends on their statistical significance and on the domain of applicability of the model (Normand and Léchaudel, Reference Normand and Léchaudel2006), an alternative approach was required for 925 for which no FRI dataset was available. In this case, the threshold temperature was estimated as a parameter of the curve describing the fruit splitting occurrence during fruit development on the plant. The threshold temperature model exhibited good accuracy in predicting the changes in the occurrence of fruit splitting according to fruit development on the bunch. This original method for estimating a threshold temperature with a narrow dataset made it possible to take the effect of temperature in a fruit development model into account.
Our study showed that estimated threshold temperatures θmean differ among varieties of the same fruit crop species (Łysiak and Szot, Reference Łysiak and Szot2023). Consequently, to ensure accuracy predictions, threshold temperatures should be estimated in relation to the intended use of the model rather than adopted from the literature for a different variety (Munoz et al., Reference Munoz, Sepulveda, Garcia-Huidobro and Sherman1986; Zapata et al., Reference Zapata, Salazar, Chaves, Keller and Hoogenboom2015).
Optimum harvest date based on thermal time sum depends on the targeted market and variety
Based on the threshold temperature estimated from the thermal time sum model of FRI, the optimum harvest date was assessed according to the targeted market. One advantage of the thermal time sum model is that it does not require detailed daily meteorological measurements, but only daily mean temperature data. Thermal time sums can be readily calculated using daily temperature data obtained either from local weather stations or from publicly or privately available meteorological services (e.g., national weather agencies), without the need for dedicated on-site instrumentation (Łysiak and Szot, Reference Łysiak and Szot2023). In practice, the main challenge for users lies in selecting appropriate parameter values, namely the threshold temperature and the corresponding degree-day sum, for a given cultivar and targeted market. When these parameters are estimated from a sufficiently wide and contrasted dataset, as illustrated for 938, the model achieves high predictive accuracy (RMSE = 4.7 days; MAPE = 3.8%) comparable to or slightly better than that obtained using a machine learning approach for banana harvest predictions (MAPE = 6.0%, (de Souza et al., Reference de Souza, Bonini Neto, Cabrera Piazentin, Dainese Junior, Perin Gomes, dos Santos Batista Bonini and Ferrari Putti2019)). The latter approach, based on climatic variables and using artificial neural networks to predict the bunch harvesting period, requires large and more detailed datasets from complete meteorological stations (de Souza et al., Reference de Souza, Bonini Neto, Cabrera Piazentin, Dainese Junior, Perin Gomes, dos Santos Batista Bonini and Ferrari Putti2019). In contrast, our study proposes a simple and reliable temperature-based method to optimally forecast banana harvest date. For each variety, the proposed model was developed and evaluated using data encompassing a wide range of environmental conditions. Model performance was further assessed using a k-fold cross-validation with independent calibration and validation sets, ensuring stable and reliable predictive accuracy. Improved prediction accuracy may contribute to more sustainable production practices by supporting better decision-making practices along the banana supply chain (Boechel et al., Reference Boechel, Policarpo, Ramos, da Rosa Righi and Singh2022; Minagawa and Kim, Reference Minagawa and Kim2022). In particular, selecting the optimum harvest date by using this simple temperature-based model could help the stakeholders to reduce the risk of ripening during transport or export, limit resource waste, and optimize fruit size and yield. In contrast, empirical methods based on fruit size or age may lead to premature ripening during transport (Jullien et al., Reference Jullien, Chillet and Malézieux2008), whereas approaches based on thermal time models provide more precise and reliable predictions, and reduce the risk of ripening (Tixier et al., Reference Tixier, Salmon and Bugaud2010). This harvesting decision rule requires only that each bunch be accurately tagged at the defined flowering stage (Bugaud and Lassoudière, Reference Bugaud and Lassoudière2005).
For 925, fruit splitting was reported on the plant before the first fruit of the bunch reached natural ripening, thereby preventing completion of the normal fruit development phase and potentially reducing yield (Jullien et al., Reference Jullien, Malézieux, Michaux-Ferrière, Chillet and Ney2001). However, harvesting at the proposed optimum date allows fruits to reach a market acceptable grade and ensure a green life duration suitable for both the regional and export markets.
This study provides the first estimate of the threshold temperature for the FRI in plantain (cv. French Clair), key parameter to predict the optimum harvest dates according to market requirements. Until now, in the context of regional and export markets, optimum harvest dates for plantain have been proposed using a threshold temperature estimated for Cavendish bananas, 14°C (Adopo et al., Reference Adopo, Lassoudière and Tchango1996; Dépigny et al., Reference Dépigny, Lescot, Achard, Diouf, Cote, Fonbah, Sadom and Tixier2017). Our results indicate that this approach may introduce prediction errors given the genotype dependence of this parameter, as demonstrated both in the present study and in other fruit species (Daymond and Hadley, Reference Daymond and Hadley2008; Jędrszczyk et al., Reference Jędrszczyk, Skowera, Gawęda and Libik2016). In the case of plantain, we observed lower correlation coefficients between fruit development rate and mean temperature, as well as between the green life or external fruit grade and the thermal time sum. This suggests that the variability observed for cv. French Clair was less explained by the temperature-based model. This reduced explanatory power may partly reflect the more limited amount of available data for plantain compared with dessert banana cultivars. Such variability is consistent with a previous study showing high intra-varietal variation of various agronomic traits at harvest among different plantain varieties (Dépigny and Damour, Reference Dépigny and Damour2022). Improving prediction accuracy for plantain would likely benefit from expanding the dataset to include a broader range of temperature conditions, ideally by collecting additional data across contrasting production environments.
The reliable model proposed in this study can support banana growers in the adoption and integration of new banana cultivars resistant to multiple diseases, thereby contributing to the development of more sustainable, fungicide-free production systems (Côte et al., Reference Côte, Rapidel, Sourisseau, Affholder, Andrieu, Bessou, Caron, Deguine, Faure, Hainzelin, Malezieux, Poirier-Magona, Roudier, Scopel, Tixier, Toillier and Perret2022; Salmon et al., Reference Salmon, Bakry, Efile, Ricci, Toniutti and Horry2023). Moreover, accelerating the integration of cultivar diversity into banana markets requires efficient and accurate management of the optimum harvest dates to prevent production losses and avoid rejection of new varieties by the market stakeholders. Accordingly, a key strategy in fruit genetic programmes for assessing fruit maturity timing is to rely on multi-environment and multi-year analyses (Hardner et al., Reference Hardner, Hayes, Kumar, Vanderzande, Cai, Piaskowski, Quero-Garcia, Campoy, Barreneche, Giovannini, Liverani, Charlot, Villamil-Castro, Oraguzie and Peace2019). In banana, which is produced year-round, this process could be further accelerated by exploiting green life data collected across contrasting seasons and monitored on the same bunch until the first fruit reaches the yellow stage (FRI stage).
Climate change is already observable in many regions worldwide. The model development in this study could therefore be used to anticipate climate-driven shifts in the banana harvest timing and the associated fruit availability for different market targets. Thermal time sum-based prediction approaches have been used to assess the impact of climate change on the strawberry harvest timing (Bethere et al., Reference Bethere, Sīle, Seņņikovs and Bethers2016), showing that phenological processes are expected to occur earlier in the future, with marked regional differences. In banana, failure to anticipate earlier harvest dates could result in fruits harvested too late, thereby increasing the risk of over-ripening during transport and marketing, reducing storage potential, and enhancing susceptibility to fungal disease.
Moreover, accurate predictions of a product availability and quality at the time of marketing are becoming increasingly important for limiting fruit loss and improving sustainability. In this context, future work could aim to develop adapted models for stakeholders that incorporate additional fruit quality traits, such as organoleptic or functional characteristics (Dorey et al., Reference Dorey, Fournier, Léchaudel and Tixier2016; Hou et al., Reference Hou, Park, Li and Wang2024).
Supplementary material
To view supplementary material for this article, please visit https://doi.org/10.1017/S0014479726100258
Acknowledgements
The authors gratefully acknowledge Lise Rohmer, Yoann Van Elslande, Willem Louiserre, and Vincent Soulé, for their assistance in field experiments and data collection, and James Brownlee for revising the manuscript and improving the English.
Author contributions
Mathieu Léchaudel: Conceptualization, Methodology, Investigation; Formal analysis, Writing – Original draft; Sandrine Andypain, Methodology, Investigation, Review; Bastien Barral, Methodology, Investigation, Writing – Review and Editing; Sylvain Dépigny, Methodology, Investigation, Writing – Review and Editing; Dominique Carval, Methodology, Investigation, Writing – Review and Editing; Bernard Abufera, Methodology, Investigation, Review; Antoine Wyvekens, Methodology, Investigation, Review; Frédéric Lambert, Methodology, Investigation, Review; Jean-Claude Efile, Methodology, Investigation, Review; Mathieu Joyeux, Methodology, Investigation, Florentin Pietrus, Methodology, Investigation; Frédéric Salmon, Methodology, Investigation, Writing – Review and Editing.
Funding statement
This work was carried out as part of the ‘Amiqual’ and ‘Divac’ projects, funded by a grant from the Conseil Régional de Guadeloupe (mesure ‘Coopération’ du Programme de Développement Rural de la Guadeloupe et St Martin 2014–2020). It was also supported by the CIRAD DPP COSAQ agronomical research programme (period: 2015–2021) funded by a grant from the European Union (ERDF) and the Conseil Régional de La Reunion and by the CIRAD DPP SADur agronomical research programme. This programme is co-funded by the European Union, the French State, and the Réunion Region. Europe is committed to La Réunion through the EAFRD (grant REU77071-1-000011), for which the La Réunion Department is the managing authority, and through the ERDF (grant 2024-1248-005756), for which the Réunion Region is the managing authority.
Competing interests
The authors declare none.




 Open access

