

1. Introduction
1.1. Vowel shifts and vowel space in American English
In American English, vocalic variation is one of several distinctive acoustic markers of regional identity. For example, the Northern Cities Shift (Labov, Ash & Boberg, Reference Labov, Ash and Boberg2006), the Southern Vowel Shift (Thomas, Reference Thomas2003), and the California Vowel Shift (Eckert, Reference Eckert2008b; Hinton et al., Reference Hinton, Birch Moonwomon, Herb Luthin, Lerner and Corcoran1987) are so named for the regions of the United States in which they were first reported or are commonly found. However, as sound changes spread geographically and more details about the shifts are uncovered, more accurate names may be introduced. In the case of the California Vowel Shift, sociolinguists have advocated for the geographically neutral “Short Front Vowel Shift,” henceforth SFVS (Boberg, Reference Boberg2019; Kennedy & Grama, Reference Kennedy and Grama2012), which refers specifically to the movement of the vowels in kit, dress, face, and trap. These front vowels are seeing a simultaneous decrease in F2 and an increase in F1, which are linked to lower and more posterior articulation of the tongue in the vocal tract. The acoustic change in these front vowels has also been linked to an open-mouthed jaw setting (Pratt & D’Onofrio, Reference Pratt and D’Onofrio2017) and overall compression in the vowel space (D’Onofrio, Pratt & Van Hofwegen, Reference D’Onofrio, Pratt and Van Hofwegen2019). The changes occurring to these vowels appear to be happening in tandem: they are moving as a set, with variation in the progress of the shift conditioned by speaker gender (Boberg, Reference Boberg2019). The SFVS has been reported up and down the west coast of North America, including in the Pacific Northwest, Canada, as well as the Midwest (Kendall & Fridland, Reference Kendall and Fridland2012; Kennedy & Grama, Reference Kennedy and Grama2012; Labov et al., Reference Labov, Ash and Boberg2006; Stanley, Reference Stanley2020; Strelluf, Reference Strelluf2018).
While the SFVS is apparently spreading in its geographical reach, the Southern Vowel Shift (SVS) has been identified as being “in retreat” (Dodsworth, Reference Dodsworth2013; Thomas, Reference Thomas2003) in the Southern United States, which includes the states of Texas and Georgia. Typical SVS features include monophthongization of the vowel in price, and reversal and “breaking” of the vowels in face and dress and fleece and kit. Participation in this shift among white Texans is conditioned by whether speakers live in more rural or more urban areas (Thomas, Reference Thomas1997), with young, urban-oriented speakers in metropolitan areas trending away from Southern vowels and toward the vowels of the Elsewhere Shift (Stanley, Reference Stanley2020), which includes the SFVS.
There has been a recent uptick in studies that examine not only shifts in the acoustics of individual vowels, but also speakers’ overall vowel space areas (VSA), a measurement calculated from both F1 and F2 of “peripheral” vowels, as a sociophonetic variable that indexes identity. Early reports on VSA in American English first established a connection with gender identity (even after accounting for the effect of variable vocal tract length on vowel formant measurements) and sexuality (Heffernan, Reference Heffernan2010; Pierrehumbert et al., Reference Pierrehumbert, Tessa Bent, Bradlow and Michael Bailey2004). While VSA is a more abstract variable than those used to measure vowel shifts, D’Onofrio et al. (Reference D’Onofrio, Pratt and Van Hofwegen2019) argue that the California Vowel Shift can be modeled as a consequence of overall compression or reduction in VSA, owing in part to articulation itself (as discussed in Pratt & D’Onofrio, Reference Pratt and D’Onofrio2017) as well as to a possible phonological pattern of centralization and reduction or a reduction in peripherality (Gratton, Reference Gratton2019). Fox and Jacewicz (Reference Fox and Jacewicz2017) further showed that VSA could be used to analyze regional dialect variation and sound change in American English. Kim and Wong (Reference Kim and Wong2020) looked at Korean Americans in Southern California and found that those who participated most in the California Vowel Shift also had the most narrow and fronted vowel space across groups, especially second generation Korean American women. Taken together, the past literature suggests that speakers may employ more than just variability in single vowels, chain shifts, or even several chain shifts, but the entire vowel space, as a sociolinguistic variable to express their intersecting regional and ethnic identities.
1.2. Race, ethnicity, and sound change
Sound changes often become associated with certain groups of people, identities, or personas, due to the nature of indexicality (Silverstein, Reference Silverstein2003): as social beings, we tend to notice axes of difference among people and link these differences to patterns of speech (Agha, Reference Agha2003; Johnstone, Andrus & Danielson, Reference Johnstone, Andrus and Danielson2006). For example, aspects of the SVS are associated not just with the South, but also with a speaker’s occupation (Dodsworth, Reference Dodsworth2013) and generation (Reed, Reference Reed2014). Even individual vowel movements within a shift can carry indexical meaning (Eckert, Reference Eckert2008a). For example, several studies have shown that trap retraction indicates a variety of social meanings to listeners, including a Valley Girl or stereotypical Californian persona (Adcock & Becker, Reference Adcock and Becker2016; D’Onofrio, Reference D’Onofrio2015; Villarreal & Kohn, Reference Villarreal and Kohn2021), higher socioeconomic class and class mobility (Geenberg, Reference Geenberg2014), as well as formality, education, youth, and frivolity (Becker & Swan, Reference Becker and Swan2019).
Despite the association of these vowel shifts with the majority white population of the regions in which they are found (e.g., Podesva et al., Reference Podesva, Annette D’Onofrio and Kyung Kim2015; Van Herk, Reference Van Herk2008), there is ample evidence from the literature that, in general, racial and ethnic minorities can and do participate in regional shifts (e.g., Fought, Reference Fought1999; Hoffman & Walker, Reference Hoffman and Walker2010; King & Calder, Reference King and Calder2020; H. Lee, Reference Lee2000), and they sometimes even lead the changes in their local communities (Hall-Lew, Reference Hall-Lew2009). Variationist research on the role of racial and ethnic identity in language has often focused on the phenomenon of ethnolects, which are patterns of speech (including phonology, as well as other levels of grammar, such as syntax and lexicon) associated with a specific racial or ethnic group. In the United States context, the most widely studied ethnolects of American English are African American English (e.g., Lippi-Green, Reference Lippi-Green2012; Wolfram et al., Reference Wolfram, Hazen and Ruff Tamburro1997) and Chicano English (e.g., Fought, Reference Fought1999; Roeder, Reference Roeder2010; Santa Ana & Bayley, Reference Santa Ana and Bayley2004). These studies have not only demonstrated how minoritized speakers pattern their speech in comparison to other groups, but they have also proven the importance of understanding the intersections of racial and ethnic identity with other identities, including a speaker’s regional identity. For example, Fridland (Reference Fridland2003) analyzed participation in SVS among African Americans in Memphis, Tennessee and found that their participation in some aspects of SVS was stronger if they had closer ties to their local African American community. Race and ethnicity, as socially constructed categories, are not static or independent from other categories such as region, gender, and class.
For Asian Americans, the influence of race and ethnicity on linguistic production has always been complicated by the unique history of Asian racialization in the United States. In some cases, they are treated as “honorary whites” (who thus demonstrate no difference from mainstream middle class white English speakers) and in others as “forever foreigners” (assumed to speak English with a foreign accent). This dichotomous racialization of Asian Americans (Tuan, Reference Tuan1998) has historically disallowed nuanced analysis of Asian American speech and identity. Nevertheless, in recent years Asian Americans have been featured in an increasing number of studies of ethnic variation in English (Cheng, Reference Cheng2016; Ito, Reference Ito2010; Umbal, Reference Umbal2021; Wong, Reference Wong2010; Zheng, Reference Zheng2018, among others).
Of course, Asian Americans are not a monolithic group. The social and linguistic histories of Korean Americans differ substantially from those of Chinese Americans and Indian Americans, for example. Furthermore, even within one ethnic group, there are axes of difference that may have differing effects on linguistic output. Studies that address variation among Asian American speakers of English have begun to shed light on the ways in which an ethnic group might demonstrate internal variation based on geography. For instance, Wong and Hall-Lew (Reference Wong and Hall-Lew2014) compared the pronunciation of the thought vowel in two groups of Chinese Americans from New York and San Francisco. They found that both a speaker’s age and region influenced the vowel’s pronunciation, arguing that, as a sociophonetic variable, it likely indexed different identities for Chinese Americans in each community.
1.3. The Korean American linguistic landscape
Asian Americans recorded the fastest population growth rate among all racial and ethnic groups in the United States between 2000 and 2019 (Budiman & Ruiz, Reference Budiman and Ruiz2021). Korean Americans, as one of these fast-growing groups, are relevant in sociolinguistics not just because of what the speech of this diasporic community tells us about the relationship between “Korea(n) English” and American English (J. W. Lee & Jenks, Reference Lee, Jenks, Jenks and Won Lee2017), but also because of what their unique history and patterns of settlement in various American metropolitan regions can tell us about the adoption of changes in progress in American English.
The history of Korean immigration is frequently described as occurring in three waves. The first wave occurred in the early twentieth century, consisting mostly of migrant laborers working on plantations in Hawaiʻi and California. After the Korean War armistice in 1953, a second wave of immigration brought approximately 6,500 Koreans to the United States, including military families and war refugees. The third wave arrived following the Immigration Act of 1965 and the Immigration and Nationality Act amendments of 1976, which lifted longstanding immigration bans from Asian nations. Compared to the first two waves of immigration, the third wave was by far the largest and most prolonged. Today, there are approximately 1.8 million Korean Americans in the United States, making them the fifth-largest Asian American ethnic subgroup (U.S. Census Bureau, 2016). Like many other immigrant groups of the late twentieth century, Koreans tended to congregate in urban areas and formed ethnic enclaves, such as the Koreatown neighborhood of Los Angeles, California (Park & Kim, Reference Park and Kim2008). An estimated 210,000 Korean Americans reside in Los Angeles County, at least 25% of whom live within the boundaries of Koreatown itself (Park & Kim, Reference Park and Kim2008). Populations of Korean Americans are also growing in Harris County, Texas (11,000) and in Gwinnett County, Georgia (23,000) (U.S. Census Bureau, 2016). (See Table 1.)
Population demographics of the three regions (U.S. Census Bureau, 2016)

But these population centers are not homogeneous. The Los Angeles Koreatown, being one of the country’s oldest and largest, has a significant footprint on local geography and culture. It constitutes about 150 city blocks, includes multistory shopping centers, skyscrapers, and thousands of local, national, and transnational businesses. Asian residents comprise over one-third of its population—Hispanic residents are a majority (Statistical Atlas, Reference Atlas2018)—but Asians from all across Los Angeles County and even neighboring Orange County travel to Koreatown because it has been the hub for Korean and Asian dining, shopping, and entertainment since the 1980s (J. W. Lee, Reference Lee2017; Park & Kim, Reference Park and Kim2008). The linguistic landscape of “the original K-town” makes evident the visibility of Korean culture here: bilingual English-Korean signage (and plenty of businesses with Korean-only signage), trilingual conversations in English, Korean, and Spanish overheard in markets, and, most recently, the glamor of K-pop stars bringing Korean names, faces, and songs to every storefront. In comparison, Koreatowns in the American South are more suburban and have smaller cultural footprints. Korean Americans immigrated to Texas and Georgia more recently and in smaller numbers.
In Harris County, Texas, one of the most populous metropolitan areas surrounding Houston, the largest Korean neighborhood is in Spring Branch. It houses Korean-owned churches, restaurants, grocery stores, museums, and language and educational centers. However, Houston’s Koreatown did not truly become established until 2008, when the Korean American Super H Mart grocery store chain opened in Spring Branch and attracted more development to the area (Patel, Reference Patel2008), including community organizations such as the Korean American Chamber of Commerce (Christian, Reference Christian2011). Koreans are still a minority in this neighborhood, and Hispanic residents maintain a plurality of the population. Spring Branch is overshadowed by Sharpstown, a neighborhood ten miles to the south that has a larger total population of Asian Americans. The Korean businesses in this large, sprawling strip mall sit alongside Chinese-, Vietnamese-, and Thai-owned businesses and restaurants, making Sharpstown more of an “Asiatown” than a Koreatown. Whether establishing themselves in Spring Branch or Sharpstown, the Korean Americans of the Houston area, like Hispanic Americans and other Asian Americans, began to immigrate in larger numbers after the local African American population dwindled in the 1990s, and not without backlash from the local white community (Glasrud, Reference Glasrud2001). Today, Harris County’s Asian population is 7% and growing, compared to 31% white (non-Hispanic), 19% Black (non-Hispanic), and 42% Hispanic (U.S. Census Bureau, 2016).
Like the environment in Harris County, the Koreatown of Gwinnett County, Georgia, has developed relatively recently. Gwinnett County, a suburban sprawl located northeast of Atlanta, is the second most populous county in the state. It has become the core of Georgia’s Korean American community over the last fifteen years (Yeomans, Reference Yeomans2016), owing largely to an increase in immigration following the 1996 Atlanta Olympics and the suburbanization movement of Korean Americans across the country (Min & Kim, Reference Min, Kim and Gap Min2012). Today, it is known as the “Seoul of the South” (Explore Gwinnett County, 2022). Of the cities located in the county, the largest Korean population is found in Duluth (with approximately 14% of the county’s total Korean population), where the major Korean grocery chain, H Mart, opened in 2004 and attracted more development, including other Korean chain businesses, newspapers, and churches (McBrayer, Reference McBrayer2017). Within Gwinnett County, Asians make up 11% of the total population, compared to 52% white (non-Hispanic), 26% Black, and 21% Hispanic. Koreans constitute 24% of the overall Asian population in Gwinnett County, and 43% of the total Korean population of Georgia resides in this region (U.S. Census Bureau, 2016).
The Korean diaspora is represented in these three disparate geographical regions, but the nature of its presence is widely variable. The Los Angeles Koreatown has an enormous impact on its immediate linguistic and cultural landscape and has held this cultural position since the 1960s. The Harris County and Gwinnett County Koreatowns, on the other hand, are smaller, less urban, and more recently developed. Given these contrasting patterns of immigration within the Korean American diaspora, it is important to understand how the Korean American community in separate regions may have acculturated to regional sound changes in different ways. We can compare the Korean American neighborhoods in Harris County, Texas and Gwinnett County, Georgia to their “older sibling” neighborhood in Los Angeles, California, almost as different snapshots in time of the growth of an immigrant speech community.
Each of these communities has been studied through the lens of variationist sociolinguistics before. J. Y. Kim and Wong (Reference Kim and Wong2020) found that Korean Americans in Southern California participated in the California Vowel Shift, sometimes having a narrower and more fronted vowel space compared to white speakers. Cheng, Faytak, and Cychosz (Reference Cheng, Faytak and Cychosz2016) similarly found that Korean Americans in Northern California demonstrated a more advanced state of the California Vowel Shift than white and other Asian ethnic groups. In the South, Jeon (Reference Jeon, Jenks and Lee2017) found that ethnic identity orientation played an important role in variability in goat production among Korean American English speakers in Houston, Texas. Kim (Reference Kim2021) similarly found that Korean American English speakers backed goat to index their ethnic identity in Gwinnett County, Georgia, with those who identified more strongly with their Korean identity using a more backed variant. These studies focus on variation in back vowels. We note that only one previous study has examined Korean Americans’ participation in a local pattern involving front vowels, though not one associated with SFVS. Lee (Reference Lee2016) found that the Korean Americans in Bergen County, New Jersey, which happens to be the most population-dense community of Koreans in the country, did not adopt the local “short-a” (trap) system associated with the greater New York and New Jersey metropolitan area but overall adopted what he called a “General American” norm.
1.4. Hypothesis
Given the dissimilar linguistic landscapes of Korean American communities around the country, how might Korean Americans living in different areas participate in broad sound changes such as the SFVS or SVS? Until now, the work on Korean American speech has not compared Korean American communities in different areas. While ethnic identity does unite people who live in different regions, it should not be assumed that all Korean Americans speak the same simply because they are Korean, just like not all African Americans speak the same variety of African American English (or even speak AAE at all) simply because they are African American. Nevertheless, it is possible that a broadly construed version of Korean American identity affects the English speech of Korean Americans across regions, such that a “supraregional” Korean American variety of English may emerge, a variety that is distinct from Korean L1-accented English.
To address the question of Korean American English across regions, our study compares the vowel acoustics of Korean American speakers of English in Southern California, Texas, and Georgia. We hypothesize that, in terms of SFVS, Californians would exhibit the shift to a greater degree compared to other Texans and Georgians. However, in terms of the Southern Vowel Shift, we do not expect any of the groups to exhibit the SVS, because it is in retreat among young metropolitan speakers in the South. Finally, we hypothesize that the three groups will demonstrate different amounts of vowel space compression, owing to each community’s historical relationship to the local linguistic landscape. Korean Americans in California, who may participate in the vowel compression of the California Vowel Shift, are likely to have the smallest VSA, while Korean Americans in Texas and Georgia, who live in a region without this shift and who also have smaller and newer co-ethnic communities, may have larger vowel spaces.
2. Methods
The present study reanalyzes and compares past data (Cheng, Reference Cheng2021; Jeon, Reference Jeon, Jenks and Lee2017; Kim, Reference Kim2021) collected from casual sociolinguistic interviews with Korean American speakers of English located in three different dialect regions of the United States: Southern California, Texas, and Georgia. The California speakers (n = 27, 11 cisgender male, 16 cisgender female) were all born and raised in the Los Angeles metropolitan area, including cities in Los Angeles County and Orange County. The Texas speakers (n = 12, 5 cisgender male, 7 cisgender female) were from Harris County, which is the largest county in the Houston metropolitan area. The Georgia speakers (n = 12, 6 cisgender male, 6 cisgender female) were born and raised in Gwinnett County, which is ten miles northeast of Atlanta and is part of the Atlanta metropolitan area.
The methodology was similar across locations. Participants who self-identified as Korean American were invited to participate in a casual interview, conducted in English, or in English and Korean. All of them were ethnically Korean, born to two ethnically Korean parents, and raised in Korean-speaking or bilingual Korean-English households. Most participants identified as second-generation Korean Americans (i.e., born and raised in the United States) who spoke English natively, while a minority identified as 1.5-generation Korean Americans, who immigrated to the United States as children. Some past sociolinguistic studies on Korean American English have found differences between 1.5 and second-generation vowel spaces (J. Y. Kim & Wong, Reference Kim and Wong2020), while others have not (Cheng, Reference Cheng2019). All the subjects in this study were 1.5- or second-generation Korean Americans. The second-generation speakers acquired English from birth or upon entering school, and the 1.5-generation speakers acquired English beginning at various ages, from preschool age to 16 years old. Full demographic data and interview metadata can be found in Table 2.
Participant demographics and interview metadata

Digital recordings of the participants’ speech during the interviews were made on different but comparable professional recording equipment. We note that the participants’ interlocutors also differed by region, with the interviewers in Texas and Georgia being women of Korean descent, while the interviewers in California varied in gender and ethnic background. The interviews were transcribed by hand in Praat (Boersma, Reference Boersma2001). For the California and Texas data, we used the Montreal Forced Aligner (MFA) to identify individual vowel phonemes in the audio files (McAuliffe et al., Reference McAuliffe, Michaela Socolof, Wagner and Sonderegger2017) and then VoiceSauce (Shue et al., Reference Shue, Keating, Vicenik and Yu2011) to measure and extract the formant measurements at regular intervals within each vowel. For the Georgia data, we used the Dartmouth Linguistic Automation (DARLA), an online alignment and analysis tool that uses the MFA for alignment and FAVE-Extract for formant measurements (Reddy & Stanford, Reference Reddy and Stanford2015). Formant measurements that were considered as outliers were manually checked and corrected for any possible software errors. To preserve vowel allophones as close to “citation form” as possible (following Clopper et al. [Reference Clopper, Pisoni and de Jong2005], Fox & Jacewicz [Reference Fox and Jacewicz2017], and Kim & Wong [Reference Kim and Wong2020]), postcoronal tokens (following /t, d, s, z, n/) and preliquid tokens (preceding /l, r/) of goose and goat were removed.Footnote 1 Table 3 shows the total number of tokens of each vowel from each speaker group. We then normalized all the formant measurements using Lobanov (Z-score) normalization (Lobanov, Reference Lobanov1971) via the R scale() function (R Core Team, 2021), which is speaker-intrinsic and formant-intrinsic but vowel-extrinsic: it uses the mean and standard deviation of all vowel measurements per formant and per speaker to calculate values that are comparable across speakers and groups. This type of data transformation is common in studies that compare vowel formants of different genders due to the effect of vocal tract length on formant values for cisgender men and women (Fitch & Giedd, Reference Tecumseh and Giedd1999; Johnson & Sjerps, Reference Johnson, Sjerps, Pardo, Nygaard, Remez and Pisoni2021). Using the z-scores, we calculated the median F1 and F2 for each vowel for each speaker. We focus on two measurements in this study. The first was the Euclidean distance between various short front vowels and the anchor vowel fleece (IY), calculated from F1 and F2. We used this to determine each region’s participation in the Short Front Vowel Shift or the Southern Vowel Shift. We also performed a visual analysis of short front vowels in normalized F1-F2 space. The second measurement was VSA. For this measurement, we used Euclidean distance between five corner vowels, fleece (IY), goose (UW), goat (OW), lot (AA), and trap (AE), to determine VSA using Heron’s formula (D’Onofrio et al., Reference D’Onofrio, Pratt and Van Hofwegen2019; Jacewicz et al., Reference Jacewicz, Fox and Salmons2007):
 $${\rm{area}} = \surd \left( {{\rm{s}}\left( {{\rm{s - a}}} \right){\rm{*}}\left( {{\rm{s - b}}} \right){\rm{*}}\left( {{\rm{s - c}}} \right)} \right), {\rm{where \,\,s}} = \left( {{\rm{a}} + {\rm{b}} + {\rm{c}}} \right){\rm{/2}}$$
Total number of tokens of each vowel per region

This formula uses the length of each side of a triangle and the perimeter to calculate triangle area. For example, the area of the uppermost triangle in Figure 1 could be calculated by using the Euclidean distance between fleece and goose, goose and goat, and goat and fleece. We repeated this process for the second and third triangles, then calculated the sum of the areas to get the VSA of the entire polygon (in normalized F1 and F2).
The three vowel triangles used in the calculation of VSA using Heron’s method.

3. Results
3.1. Short Front Vowel Shift and Southern Vowel Shift
Our hypothesis was that Korean Americans in the California group would exhibit more of the SFVS than Korean Americans in the Texas and Georgia groups, such that kit, dress, face, and trap would be more backed and lowered relative to fleece. Results showed that the distributions of short front vowels in normalized F1 and F2 space varied by gender and region (Fig. 2). For example, female Korean American speakers in California and Texas showed considerable overlap in fleece and face, whereas those in Georgia showed more overlap between face and hand (prenasal trap). In addition, the distance between trap and hand for women in the Georgia group is much greater compared to women in the California and Texas groups.
Vowels implicated in the Short Front Vowel Shift produced by female (top row) and male Korean Americans from Southern California, Houston, and Gwinnett County, Georgia.
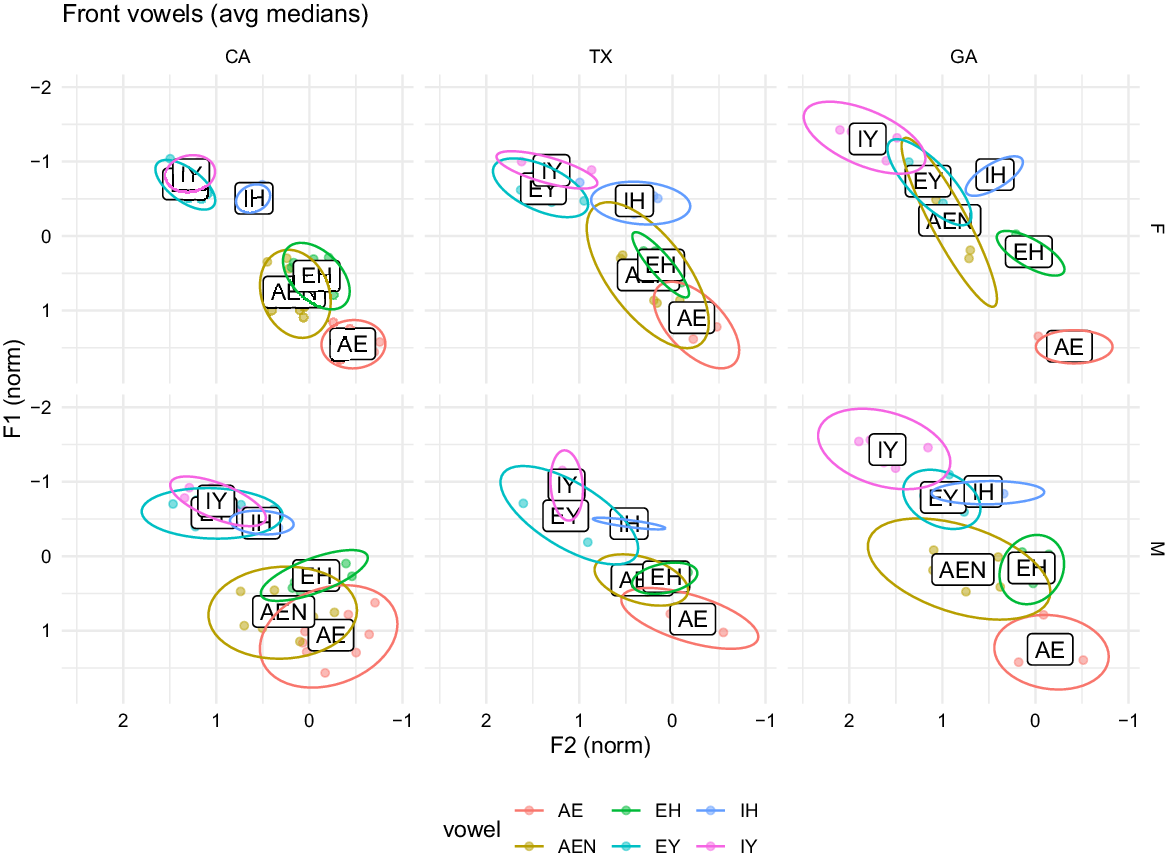
We fitted a generalized linear mixed effects regression model to the Euclidean distance measurements to test for significant differences between regions. First, we built a base model that did not include region as an explanatory variable (fixed effect), and then we built a test model that did include region. The other fixed effects included in both models were gender, age of acquisition, and log-transformed vowel duration. Then, we used an ANOVA to compare the two models. The test model, which included region, had a much lower Akaike Information Criterion (AIC) value and was thus determined to be a better fit for the data. (ANOVA results can be found in Table 4, and full results for the test model can be found in Table 5.) We thus conclude that region is a significant predictor of Euclidean distance for the short front vowels, which in turn indicates that speakers from each region participate in the Short Front Vowel Shift at different rates. Next, we performed a Tukey HSD post-hoc test to analyze the output of the test model and determine which pairings of factors were significant. With a conservative alpha criterion of 0.001 (due to the large number of comparisons being made), the test results showed that California and Texas speakers were not significantly different from one another, but both were significantly different from Georgia (Table 6). The post-hoc test of each vowel pairing determined that each vowel had a significantly different Euclidean distance value from every other one, with the marked exception of dress versus hand.
ANOVA comparison of a base generalized linear mixed effects model for Euclidean Distance (IY-Vowel) and a test model that included a three-way interaction between gender, vowel, and region. Significance was determined by an alpha criterion of <0.001

Summary and ANOVA of the test generalized linear mixed effects model deemed the best fit for the data on Euclidean Distance (IY-Vowel)

Tukey HSD post-hoc test results for the test generalized linear mixed effects model on Euclidean Distance (IY-Vowel), including gender, vowel, and region. Significance was determined by an alpha criterion of <0.001

Figure 3 illustrates the differences in Euclidean distance for each of the short front vowels. We see that the Georgia speakers consistently had the largest Euclidean distance values. Boberg (Reference Boberg2019) reminds us that the prenasal context for trap (i.e., hand) is exempt from the shift and in fact is a phonological environment that conditions raising and fronting. hand-raising (as it were) has been found in many dialects of English and has been studied in the context of the California Vowel Shift (e.g., in Eckert, Reference Eckert2008b), but our results show that it is most pronounced among Georgians. In all three groups, the degree of hand-raising is such that it overlaps considerably with dress, which is reflected in the results from the post-hoc test (Table 6).
Euclidean distance between fleece and other front vowels produced by female (left) and male Korean Americans from Southern California, Houston, and Gwinnett County, Georgia.

As for the Southern Vowel Shift, we expected the speakers in the Texas and Georgia groups not to participate in it, as it is in retreat among speakers in Southern metropolitan areas. Figure 2 indeed shows no reversal of face and dress in vowel space for the Texas or Georgia speakers, nor of fleece and kit. We also do not see backing or centralization of face with respect to dress. We concluded that none of the three regional groups showed evidence of SVS participation.
3.2. Vowel space area
Although speakers from all three regions demonstrated participation in the Short Front Vowel Shift, the Georgia speakers appeared to have the greatest amount of backing and lowering, as well as an advanced trap-hand split. This was determined by calculations of Euclidean distance, but it is possible that overall VSA could have affected these results. If Georgia speakers’ overall VSAs are larger, then that would contribute to larger Euclidean distance values for their vowels.
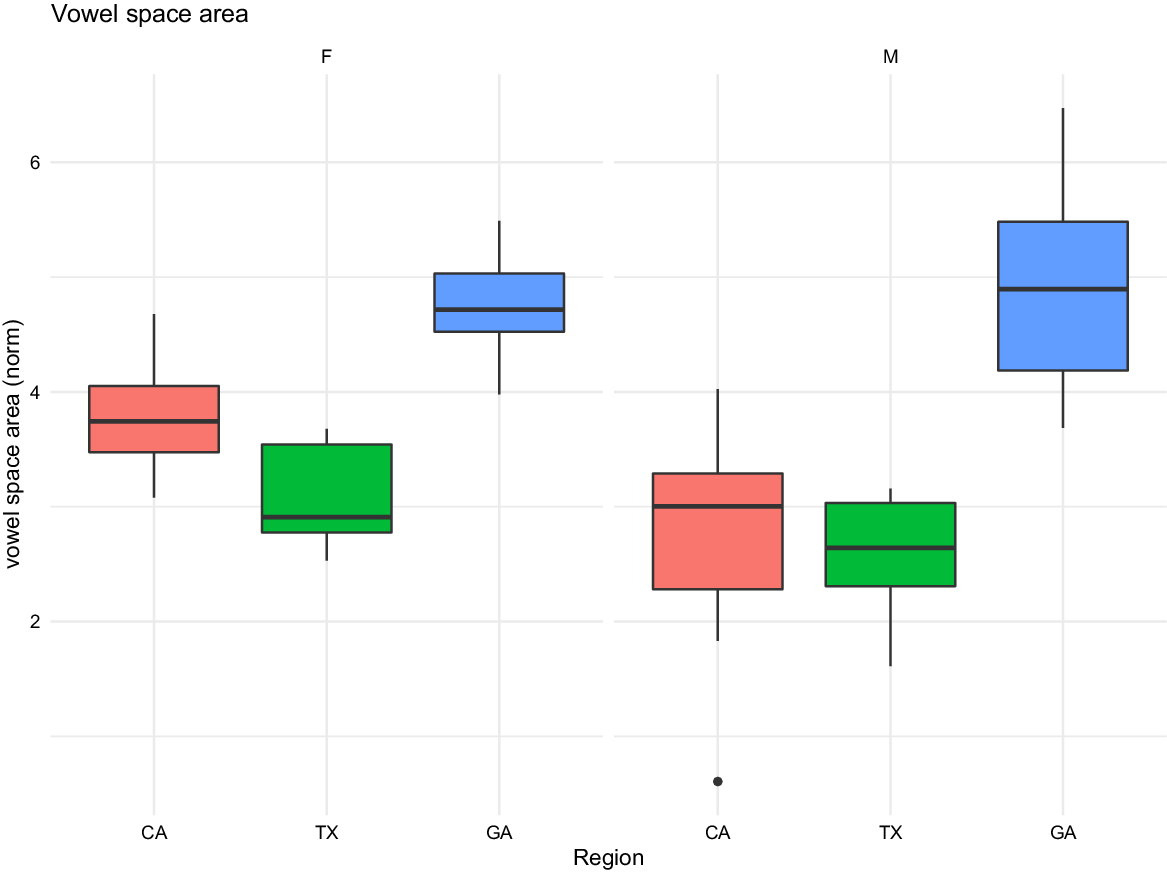
Unlike Euclidean distance measures, there was only one VSA value per speaker, so we fit a linear model to the data, with VSA as the dependent variable and gender, region, age of acquisition, and log vowel duration as independent variables. The results of the linear model, reported in Table 7, show that all the test variables were significant (at an alpha criterion of 0.01), including gender, region, and log vowel duration, except for age of acquisition. The interaction effect between gender and region was not statistically significant. Figure 4 illustrates these results: Georgia speakers, regardless of gender, had the largest VSAs, while California and Texas speakers were relatively more compressed. Korean American women in the California group had larger vowel spaces than those in the Texas group, but men in the California group varied considerably in their VSAs. We can see from Figure 5 that not only did the speakers in the Georgia group have greater VSAs, but they also had the longest raw vowel durations. But because speakers with a faster speech rate or shorter vowel duration tend to compress their vowels (Miller, Reference Miller, Eimas and Miller1981), we also calculated the mean log vowel duration for each speaker and plotted it against each speaker’s mean VSA, with the result that the Georgia speakers’ vowels ended up not being significantly longer than California and Texas speakers’ vowels. Log vowel duration was independently significant. A second test model that included an interaction between duration, gender, and region did not improve the model fit, so we concluded that there was no interaction between log vowel duration and region or gender.
Linear model for vowel space area with effects of gender, region, and vowel duration. Significance was determined by an alpha criterion of <0.01

Vowel space area for female (left) and male Korean Americans from Southern California, Houston, and Gwinnett County, Georgia.
Vowel space area by mean raw (left) and normalized (right) vowel duration for Korean Americans from Southern California, Houston, Texas, and Gwinnett County, Georgia.

3.3. Individual differences
The analysis of the results reveals that our initial hypothesis was not supported: rather than the California group differing significantly from the Texas and Georgia groups, it was the Georgia group that differed significantly from California and Texas. However, in addition to the group comparison, we recognize that there is a great deal of individual variation within each region. For this reason, we believe that diving in depth to look at individual differences among speakers of each region can give us a more nuanced explanation for what is happening in each region. In this section, we provide a few case studies from each speaker group to situate vowel space in terms of personal identity construction. For each case study, each speaker’s (unnormalized) vowel spaces are shown in Figure 6.
Vowel spaces of three female case study subjects (Section 3.3).
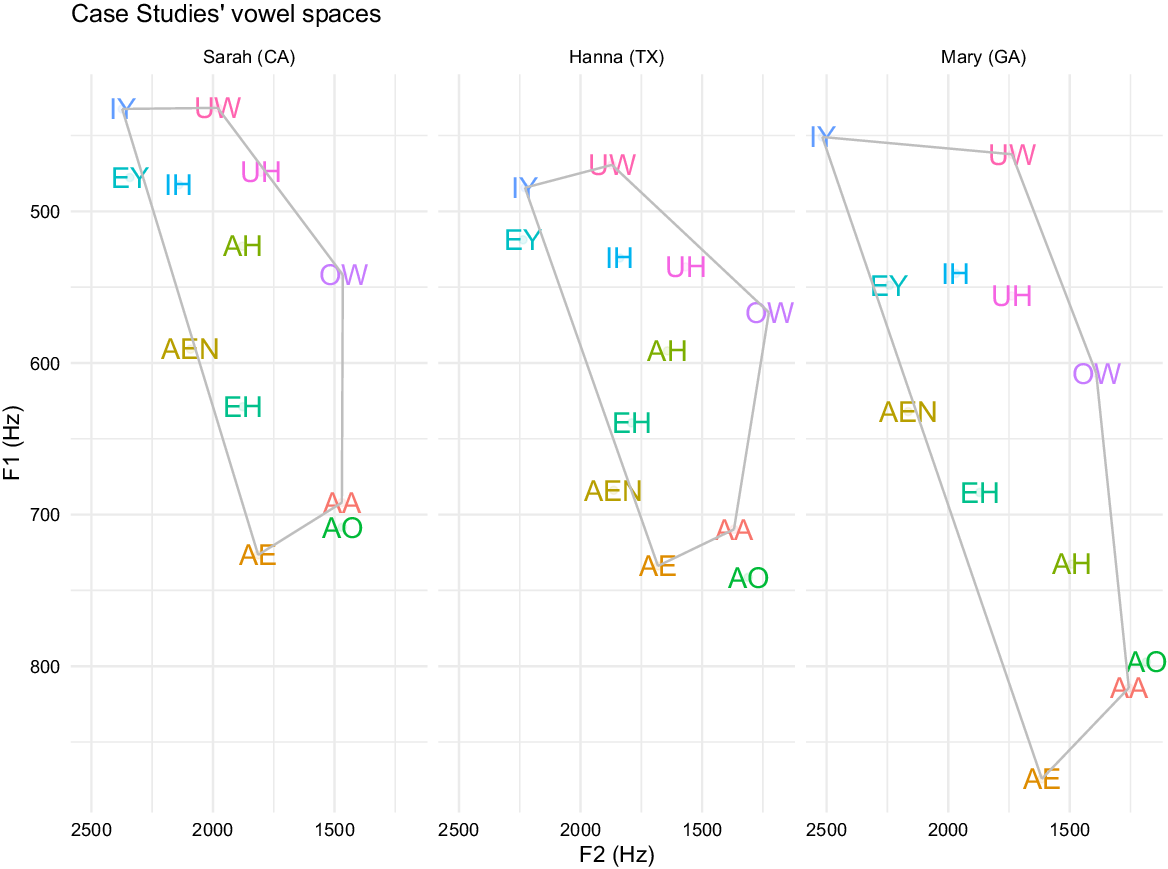
In the case of Texas, we highlight “Hanna” (all names used are pseudonyms), a 32-year-old second-generation Korean American woman born in Houston. Hanna’s personal self-identification to Korean American culture, which we call ethnic orientation, is notably strong compared to her Texan peers. Although Hanna has traveled to South Korea several times and has close social networks with Korean American friends with whom she attended church in Houston, during her interview she emphasized the importance of Korean language and culture in her life today and expressed regret that she didn’t value it more when she was growing up. Hanna says, “Growing up, I kind of shunned [my heritage]. And now that I identify as Korean, growing up, I realize I wasn’t aware of [how] it’s okay to be different, now. […] My parents didn’t really push. They were pretty lenient about that, but I feel like, I wish they had at least immersed me a little bit more, for the culture.” Among the Texan Korean Americans, Hanna had the most to say about what it means to “sound Houstonian” or to “sound Korean American.” In her words, “Houston seems to have a much rougher […] speech pattern than most other Texas cities I’ve seen. […] They’re not as genteel and as sweet as Austin or Dallas people, for instance.” But when remarking on her own speech style, she says that her way of talking can represent either Houstonian or Korean American/Korean Texan: “I try not to incorporate too much slang in my language, because I’m trying to be more professional now. But I do notice that [slang] come out in Houston and with my Korean friends.” Hanna is referring here to the kind of code-switching that Korean Americans may do when in the presence of other Korean or Asian American interlocutors, which Cheng (Reference Cheng2022) notes is not limited to slang terminology and lexical items but also encompasses acoustic characteristics of speech.
A closer look at Hanna’s vowel space patterns, together with facts about her social persona, suggests that sounding Korean American in Houston involves indexing a kind of metropolitan English variety. (Although Hanna grew up in Houston, she has also lived in Los Angeles and Boston.) She does not participate in the Southern Vowel Shift and instead demonstrates features found among younger speakers in metropolitan areas of Texas, such as the SFVS and goose-fronting (like “Sarah” in the California case study, below). However, while Hanna’s vowel space was the largest of the Texas group, there was no pattern whereby Texas speakers’ greater orientations toward Korean culture correlated with larger VSA. Hanna’s speech and commentary demonstrate that, while ethnic orientation is important in the construction of Korean American identity in Houston, it does not greatly affect vowel acoustics.
We found a similar case study from California: “Sarah”, a 28-year-old second-generation Korean American woman, who was born and raised in Los Angeles’ Koreatown, although she attended a private school outside of Koreatown in her adolescence. Due to her upbringing, Sarah believes that she has both an insider and outsider understanding of what makes Los Angeles’ “K-town accent” what it is and connects the speech style to local Korean church culture and the young Korean Americans whose primary social networks are composed solely of other Korean Americans. As for her own speech, Sarah claims to have the “Valley Girl accent” and that it will never go away. While Sarah’s vowel space was neither the largest nor the smallest of Californians (being around the median), she does demonstrate a large split between trap and hand (comparable to “Hanna” in our Texas case study), as well as goose-fronting (more so than “Mary” in our Georgia case study, below). Sarah describes the Korean American linguistic landscape in Koreatown as notably distinct from the rest of the city, where “for blocks and blocks you see street signs in Korean; like, it’s very easy to live there and never speak English” and, as a consequence, the children who grow up there have what she calls “the Korean American accent.” Sarah claimed that she had never heard this accent from her Korean American friends who grew up in Northern California, but, at the same time, her own “unaccented” voice was around the median among her Southern California peers. Like the speakers from the Texas group, Sarah and other Korean Americans in California did not show a pattern or correlation between their orientation to Korean culture and vowel space or participation in the SFVS. But Sarah’s and Hanna’s vowels exemplify the similarities between Texan and Californian Korean Americans, whereas Korean Americans in Georgia turned out to be quite different.
The Korean American speakers in Georgia did not participate in SVS, but the size of their vowel spaces, in addition to being larger overall than the Californians and Texans, also appeared to pattern along axes of social network and ethnic orientation (but not gender). Specifically, speakers whose social networks were white-dominant and who oriented away from Korean culture tended to have smaller VSA. Two case studies from Georgia exemplify this: “Mary,” a 21-year-old second-generation Korean American woman with the smallest VSA of her peers, and “Sam,” a 22-year-old second-generation Korean American man whose VSA was the largest. Mary was born in Virginia and moved to Gwinnett County when she was seven years old, so she has lived her entire life in the American South. Her parents immigrated to the United States when they themselves were young, and they spoke to Mary and her siblings in English at home. According to Mary, her neighborhood is mostly white, and she thus did not often interact with other Korean Americans, but instead had a social network composed mostly of white Georgians. Unlike the other Korean Americans from the Georgia group, Mary mentioned that her parents do not frequently cook Korean food at home, and her family does not celebrate Korean traditional holidays. Instead, her family’s largest and favorite family tradition is celebrating July 4th. During her interview, Mary explicitly expressed that she prefers to be identified as Korean American (emphasis added): saying, “Even when I was growing up, I didn’t really consider myself a big Korean American […] because I never hung out with a Korean group at church, or anything like that. I always wanted to be really American when I was growing up.” In contrast to Mary, Sam had the largest VSA of the Georgia group (and of all the speakers in the current study). Sam was born in Pennsylvania and moved to Georgia at the age of three, where he grew up surrounded by other Korean American Georgians. Sam reported that he spoke Korean and English daily, both at home and in his community, and also stated that he identified more as Korean than as Korean American. He had a much stronger ethnic orientation toward Korean culture. Taken together, Mary and Sam’s commentary about their Korean American cultural identity demonstrates the important relationship between social factors and vowel acoustics. But this holds for the local context of Gwinnett County, Georgia; the same trend was not seen for Korean Americans in Southern California nor the Houston metropolitan area.
4. Discussion
Overall, the speakers in the present study did not demonstrate the vowel qualities of the Southern Vowel Shift at the group level. We believe that this is because the Korean Americans in the Texas and Georgia groups grew up in suburban metropolitan areas and did not strongly identify with the kind of “Southerner” identity that is indexed by SVS (namely, white, Black, or rural). These results are similar to other studies that have found that white speakers in suburban Southern areas are also retreating from the SVS, despite regular exposure to it, as for example in Texas (Jeon, Reference Jeon2018; Thomas, Reference Thomas2003) and in North Carolina (Dodsworth Reference Dodsworth2013). On the other hand, most of the speakers in every group demonstrated participation in the Short Front Vowel Shift, with men and women in the Georgia group having the greatest Euclidean distances between fleece and the front vowels as well as the largest split between trap and pre-nasal hand. In this way, all three Korean American groups appeared to have participated in one aspect of the California Vowel Shift, which, as noted previously, has been found not just in California but in younger, urban-oriented speakers across North America (and as such is also referred to as the Western Shift, the Canadian Shift, or the Elsewhere Shift),Footnote 2 regardless of gender or ethnic background. However, the Georgia group’s larger Euclidean distance values were easily explained by the fact that they also had larger VSAs than the California and Texas groups. Consistent with prior research, gender played a role in VSA measurements, with women from the California and Texas groups having greater VSA than men. We hypothesized that the Texans would show less compression in their VSA, but, in fact, they had smaller VSA than the Californians, while the Georgians had the least amount of compression and the largest VSAs and, unlike the two other groups, did not show a conditioning effect of gender.
Thus, our hypothesis about the Texas and Georgia groups patterning similarly was not supported. When we returned to our demographic data to try to understand what made Texas and California pattern so similarly, while Georgia was so different, we saw that the difference may not have stemmed from the size or cultural impact of a Korean American community, but its context within a broader pan-Asian American community. Compared to Gwinnett County and Los Angeles County, Harris County in Texas had the proportionately smallest population of Korean Americans. However, it was similar to the Korean American demographic of Los Angeles County in that the Korean American demographic is just one of many Asian communities that have established a visible presence in the metropolitan area. Koreans make up 6% of the Asian population of the state of Texas and 7% of the Asian population of California. In contrast, Koreans make up 14% of the Asian population of Georgia, and, as previously noted, 43% of the state’s Korean population live in Gwinnett County. What this means is that in Gwinnett County, where the racial makeup is almost equal parts white (non-Hispanic), Black, Hispanic, and Asian, the Asians are predominantly Korean. In Los Angeles County and Harris County, the Korean communities, while firmly established, do not monopolize the local perception of what “Asian American” looks or sounds like.
Indeed, Los Angeles’ Koreatown is very well-known as a hub for Koreans in the metropolitan area, but it in fact is not the only one: the entire metropolitan sprawl of Greater Los Angeles, which includes Orange County to the south, has many pockets of Korean American communities spread throughout and significant ethnoburbs (Li, Reference Li2008) populated by Vietnamese Americans, Filipino Americans, Japanese Americans, South Asian Americans, and more. The Houston metropolitan area is similar in its ambient pan-ethnic Asian multiculturalism (as exemplified by the “Asiatown” of Sharpstown). But in Gwinnett County, Georgia, Korean Americans may find themselves in a cultural environment with a stricter dichotomy that could be characterized as “Asian or assimilation.” What may influence the linguistic patterns of our speakers is not the size of the Korean community or its cultural influence but rather the situation of a Korean community within a larger metropolitan and pan-ethnic Asian demographic. We believe that this explanation undergirds the finding that, for the speakers in the Georgia group, social network and ethnic orientation were implicated in the VSA pattern. In Gwinnett County, Korean Americans are faced with a kind of imposed social binary: align with local culture and assimilate to a “white” standard of speech, or stay separate and lean into the “Seoul of the South” identity, which plays out in their vowel articulation. The Koreans in Georgia who had social networks with more white people, accordingly, had smaller vowel spaces. On the other hand, in the metropolitan regions surrounding Houston and Los Angeles, the greater relative prominence of a kind of pan-ethnic Asian multiculturalism means that speakers can choose to align with either culture or not to. Speakers in the California and Texas groups feel no pressure to use vowel articulation or vowel space as a distinct ethnic identity marker, which allows them the freedom to “mix and match” variants without concern (conscious or subconscious) for the indexing of a marked and potentially stigmatized racial identity. An alternative explanation is that Korean Texans and Korean Californians are both oriented toward a metropolitan identity rather than a strictly regional one, which they share with one another but not with the Korean Georgians. In this case, overall vowel space compression may be linked to a broader “young, urban speech” style that is present in Southern California and the Houston area but not in Gwinnett County. While this explanation is simpler, it does not account for what makes Gwinnett County different from Harris County, and it also does not consider the importance of Korean American ethnolinguistic identity. But it may be qualified by further research into the vowel acoustics of young American English speakers in these regions regardless of race. In the same way, the influencing factor of ethnic orientation in a demographically Korean-dominant ethnoburb must be verified and replicated, perhaps by conducting a study of the Korean American population of Honolulu, Hawaiʻi, where Koreans are numerous but contribute to a broader Asian and Pacific Islander multiethnic landscape, or of Bergen County, New Jersey, which is notable for having the highest concentration of Korean Americans in the country (e.g., over 50% of the population of Palisades Park, New Jersey is Korean or Korean American).
In conclusion, we found many similarities in VSA and vowel quality between Korean Americans from Texas and California, but Korean Americans from Georgia had much larger vowel spaces. We interpreted this as being due to a difference in the way Georgian Korean Americans construct their ethnic identity, specifically as a less visible minority in a more white-dominant region, which may have led to many Korean Americans in Georgia adopting what they construed to be “white-sounding” speech patterns. All groups demonstrated characteristics of the Short Front Vowel Shift, but neither the Texans nor the Georgians appeared to demonstrate the characteristics of the Southern Vowel Shift, which we attribute to the young demographics of the speakers and the ongoing reversal of this shift in urban areas. This accords with Lee’s (Reference Lee2016) study of Korean Americans in Bergen County, who did not adopt wholesale the local vowel pattern that characterizes the greater northern New Jersey/New York City region, but rather were oriented to what was billed as a “General American” norm (see Becker & Wong, Reference Becker and Wong2010 and Becker, Reference Becker2014 on the reversal of New York City vowel shifts among all speakers). We recognize hints of this norm in the commonalities between vowel spaces of the three Korean American groups of this study, although we also want to underscore that “General American” should not be equated with any kind of unmarked, unspecified variety. Specific groups of people speak in a way that has been labeled “General American,” including, in this case, Korean Americans in different regions. No aspects of their short front vowels or VSA appeared to strongly mark “sounding Korean American” over sounding “generally” American. However, if there is a supraregional Korean American accent or ethnolect, it is likely to be found by also examining nonvocalic phonetic features such as consonants or in suprasegmental features such as prosody and voice quality, since sociolinguistic style is not only negotiated differently in different social contexts, but necessarily covers a wide array of linguistic variables (Bucholtz & Hall, Reference Bucholtz and Hall2005; Moore, Reference Moore2004). For example, Schirra (Reference Schirra2012) identifies fortition of the interdental fricative as a hallmark of Korean American English, and Cheng’s (Reference Cheng2022) analysis of qualitative descriptions of Korean American speech points toward prosody and voice quality as promising directions.
Finally, this study contributes to our overall understanding of the connection between language and identity by demonstrating how Korean Americans speak English not only with influence or transfer effects from Korean but also speak it slightly differently depending on where in the country they grew up and have constructed their unique regional Korean American identity. As the first comparative study of Korean American English through a sociophonetic lens, this study helps us understand Korean American English as a continuum of linguistic distinctness at the intersection of ethnic, regional, and other social identities. Although we do not yet have a definitive picture of what Korean American English is or sounds like, this study helps lay the groundwork for future research. Subsequent studies may include further comparisons of Korean American communities both big and small, more in-depth analyses of the social factors, such as quantified social network strength (see Fridland, Reference Fridland2003) and ethnic orientation (Hoffman & Walker, Reference Hoffman and Walker2010) that seem to affect vowel patterns and vowel dynamism (see Fox & Jacewicz, Reference Fox and Jacewicz2017), as well as focused experimental work on the perception of Korean American speech across regions.
Acknowledgments
The authors would like to thank audiences at the 7th Annual Linguistics Conference at the University of Georgia and at the 2022 Annual Meeting of the American Dialect Society for their feedback. For funding, we thank the Greater Dallas Korean American Chamber of Commerce for the Korean American Urban English Study Grant, the Humanities Research Center at Rice University for the Houston Urban English Research Grant, the Korean Student Association at the University of Georgia for the Korean Student Association Research Award, and the Wilson Center for Humanities and Arts at the University of Georgia for the Graduate Research Award. Finally, we thank our speakers for sharing their voices in this study.
Competing interests
The authors declare no competing interests.


 Open access