Many positive physiological health effects have been related to the formation of SCFA by colonic fermentation of dietary fibre (DF). In the colon, SCFA serve as local nutrients for mucosal cells. Butyric acid, in particular, has been emphasised in this context. Butyric acid is the most important substrate for epithelial cells(Reference Cook and Sellin1), and it has therefore been suggested that it plays a role in the prevention and treatment of colonic diseases. Until recently, the general consensus was that most of the butyric acid formed during fermentation was metabolised by the colonic epithelium. However, results on catheterised pigs, with catheters in the portal vein and mesenteric artery, have shown that the circulating concentration of butyric acid increases with increasing production rates(Reference Bach Knudsen, Serena and Canibe2). Interestingly, recent studies have also shown that butyric acid may have an effect on lipid metabolism, such as reduced production of TAG and phospholipids in Caco-2 cells(Reference Marcil, Delvin and Garofalo3, Reference Marcil, Delvin and Seidman4). Furthermore, improved glucose tolerance, increased satiety and lowered concentration of serum inflammatory markers, in the blood from the antecubital vein at breakfast, have been related to the colonic fermentation of DF-rich products from an evening meal the day before(Reference Nilsson, Ostman and Holst5).
The physiological influence of acetic and propionic acids on the colonic mucosa has not been studied as much as the influence of butyric acid(Reference Comalada, Bailon and de Haro6). Propionic acid has been shown to inhibit gluconeogenesis in hepatic cells(Reference Kaur and Gupta7) and has also been related to systemic and metabolic effects. Consequently, propionic acid production in the colon from DF could have a secondary cholesterol-lowering effect(Reference Cook and Sellin1). In contrast, acetic acid is a substrate for cholesterol synthesis, suggesting that a high propionic:acetic acid ratio during fermentation may be advantageous. Butyric acid has also been shown to induce leptin mRNA expression at physiologically relevant quantities (1 mm) in human adipocytes, but at 5–10-fold higher concentrations, leptin expression is repressed(Reference Soliman, Ahmed and Salah-Eldin8). Leptin levels are linked to adipose mass in the body(Reference Cammisotto and Bukowiecki9).
In addition to the above metabolic effects, intake of DF has been shown to be inversely correlated with serum C-reactive protein and pro-inflammatory cytokines, such as IL-6, IL-18 and TNF-α, and positively correlated with anti-inflammatory markers such as adiponectin. These markers have also been associated with the metabolic syndrome, obesity and insulin resistance. The mechanisms behind this are not clear; however, it has been suggested that the formation of SCFA, primarily propionic and butyric acids, may have an inhibitory effect on NF-κB activation through the activation of PPAR-α. With this in mind, it would be interesting to know more about the concentrations of SCFA in serum, and whether these can be influenced by feeding specific types of DF(Reference Galisteo, Duarte and Zarzuelo10, Reference King11).
Interestingly, different DF have been shown to form specific SCFA profiles as well as different amounts of total SCFA. The chemical composition of DF and the glycosidic linkages between carbohydrate monomers are of great importance in this respect, but so are other factors such as the molecular weight, solubility and crystal structure of DF(Reference Nilsson and Nyman12).
The SCFA profile in serum has been poorly documented due to low concentrations and inadequate analytical methods. A recently developed method, where SCFA can be extracted and concentrated from serum, has made the analysis more reliable(Reference Zhao, Liu and Nyman13). SCFA were analysed in the caecal content, hepatic portal and aortic serum of rats after feeding with pectin, fructo-oligosaccharides (FOS) or guar gum. These DF have been shown to be highly fermented and form different patterns of SCFA in the caecum of rats and also in in vitro studies with human faecal inoculum. Consequently, colonic fermentation of pectin, FOS and guar gum gives high proportions of acetic acid, butyric acid and propionic acid, respectively(Reference Comalada, Bailon and de Haro6, Reference Nilsson and Nyman12, Reference Berggren, Björck and Nyman14–Reference Macfarlane and Macfarlane17). Since SCFA are believed to act not only locally but also systemically, it is important to know whether the different patterns found in caecal content are reflected in the circulation. The aim of the present study was to investigate whether DF that give rise to specific patterns of SCFA in the caecum can also be reflected in the blood system, using a rat model. To our knowledge, this has not been done before.
Materials and methods
Materials
DF diets were made from pectin, FOS and guar gum. The different ingredients in the test diets (Table 1) were mixed in HCC Hackman Mico 93/RN20 for 60 min. FOS (Raftilose P95, degree of polymerisation 2–8) was derived from chicory inulin (ORAFTI), pectin (LM-13) was extracted from citrus fruits (CP Kelko) and guar gum, a galactomannan, was derived from the guar bean (Sigma). The content of the DF in the test diets was 80 g/kg (dry-weight basis; Table 1). The DM content of the diets was adjusted with wheat starch, a type of starch shown in previous experiments to be completely digested and so does not form any caecal SCFA(Reference Björck, Nyman and Pedersen18), and is not expected to give any SCFA in the blood either.
Composition of the experimental diets (g/kg dry weight)
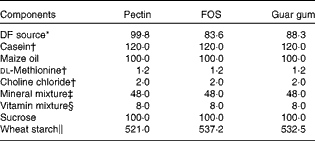
FOS, fructo-oligosaccharides; DF, dietary fibre.
* Corresponding to 80 g DF/kg diet (dry-weight basis). The content of DF was 80·1, 95·6 and 90·6 g/100 g (dry weight) for pectin, FOS and guar gum, respectively.
† Sigma-Aldrich.
‡ Containing (g/kg): 0·37 CuSO4.5H2O, 1·4 ZnSO4.7H2O, 332·1 KH2PO4, 171·8 NaH2PO4.2H2O, 324·4 CaCO3, 0·068 KI, 57·2 MgSO4, 7·7 FeSO4.7H2O, 3·4 MnSO4.H2O, 0·02 CoCl.6H2O, 101·7 NaCl (Bie & Berntsen A-S).
§ Containing (g/kg): 0·62 menadione, 2·5 thiamin hydrochloride, 2·5 riboflavin, 1·25 pyridoxine hydrochloride, 6·25 calcium pantothenate, 6·25 nicotinic acid, 0·25 folic acid, 12·5 inositol, 1·25 p-aminobenzoic acid, 0·05 biotin, 0·00 375 cyanocobalamin, 0·187 retinol palmitate, 0·00 613 calciferol, 25 d-α-tocopheryl acetate, 941·25 maize starch (Apoteket).
∥ Cerestar, varied according to the DF content of the test materials.
Experimental design and rats
Male Wistar rats (Scanbur AB), 6 weeks of age, with an initial weight of 100·3 (SEM 0·8) g were randomly divided into three groups of fourteen. In some cases, we failed to take blood samples from both the aorta and the portal vein. In such cases (nine out of forty-two), the analysis of SCFA was only done on those rats that gave samples from all three locations (caecal content, aorta and hepatic portal vein).
After 7 d adaptation to the environment (22°C, 12 h light–12 h dark cycle), rats were separated into individual metabolism cages, and adapted to the diet for 7 d. The metabolism cages minimise coprophagy because the faeces fall through the mesh floor. The experiment was started on three consecutive days, with each group of fourteen rats starting on a different day. At the end of the subsequent experimental period of 5 d, feed residues were weighed. Feed intake was restricted to 12 g dry weight/d and water was given ad libitum. After the experimental period, rats were anaesthetised by a subcutaneous injection mixture (1:1:2) of Hypnorm (Division of Janssen-Cilag Limited, Janssen Pharmaceutica), Dormicum (F. Hoffmann-La Roche AG) and sterile water at a dose of 0·15 ml/100 g body weight. The animals had been feed-deprived for 1–6 h before anaesthesia. Any effect of fasting was minimised by killing the group fed the same DF on the same day, thereby giving the same variability between the groups. Serum samples were collected from the aorta and the hepatic portal vein, and placed separately in serum tubes (SST™ Advance, Plus Blood Collection Tubes; Becton Dickinson), before being centrifuged. The collected serum was stored at − 40°C until analysis of SCFA. The caecum was removed, weighed with and without its content, and its pH measured, before being stored at − 20°C for analysis of SCFA. Caecal tissue was washed with water and weighed. The rat model used has been shown to correlate well with human experiments concerning total fermentability and bulking capacity(Reference Nyman, Asp and Cummings19). Furthermore, very similar SCFA profiles have been obtained with faecal inoculum from human subjects and rats(Reference Lupton and Villalba20). Experiments and protocols were approved by the Ethics Committee for Animal Studies at Lund University (application no.: M 40-06).
Analytical methods
SCFA in serum were analysed by hollow fibre-supported liquid extraction followed by GLC, showing excellent linearity for all SCFA(Reference Zhao, Liu and Nyman13). An SCFA standard solution was prepared (acetic (Merck), propionic (Janssen Chimica), isobutyric, butyric, isovaleric (Sigma-Aldrich) and valeric (Merck) acids), using seven different concentrations. The standard solutions with the different concentrations were analysed using the same method as for serum samples (see below). A linear equation was produced, using the peak area and the different concentrations for every SCFA, and the equation was used to calculate the concentration of the SCFA in serum samples.
Water was added to the serum samples, mixed with 2-ethylbutyric acid (internal standard; Sigma-Aldrich), and the SCFA (acetic, propionic, isobutyric, butyric, isovaleric and valeric acids) were protonated with 2 m-HCl, which resulted in pH < 2. A polypropylene hollow fibre tube (50 μm wall thickness, 280 μm inner diameter, 0·1 μm pore size, model 50/280 Accurel PP; Membrana GmbH) was dipped into 10 % tri-n-octylphosphine oxide and filled with 0·1 m-NaOH, using a BD Micro-Fine Syringe, after which the ends were sealed. The hollow fibre tube was immersed in the serum solution for 16 h to extract the SCFA using supported liquid membrane extraction. After extraction, the SCFA were flushed from the fibre lumen and injected onto a fused-silica capillary column (DB-FFAP 125–3237; J&W Scientific, Agilent Technologies, Inc.). GC ChemStation software (Agilent Technologies, Inc.) was used for the evaluation of the results(Reference Zhao, Liu and Nyman13).
The SCFA in caecal content were analysed using the GLC method(Reference Zhao, Nyman and Jonsson21). The caecal content was homogenised with an Ultra Turrax® T25 basic (IKA®-Werke) after adding 2-ethylbutyric acid (internal standard) and 0·25 m-HCl to protonate the SCFA. The samples were then centrifuged (MSE Super Minor; Hugo Tillquist AB) and injected onto a fused silica capillary column (as described above).
Calculations and statistics
The design of the experiment was completely randomised and resulted in data from the three test diets containing the different DF. All analyses were performed at least in duplicate, and data from the three diet groups were compared with each other. The maximum error in analysis was ≤ 5 %. Results are presented as means with their standard errors. Minitab statistical software (release 16.0) was used for statistical evaluation of all the results, and a general linear model (ANOVA) followed by Tukey's test for multiple comparisons to find significant differences (P< 0·05) between means. Correlation analysis using the Pearson product–moment correlation coefficient was conducted to evaluate the relationship between the SCFA concentrations in caecal content and portal serum; portal and aortic serum; and caecal content and aortic serum from all the test diets, combined and individually. In the correlation analysis, few values were excluded as Minitab defined them as unusual observations, i.e. the standard deviation of the residuals being ≥ 2·3. The exclusion of these values resulted in stronger correlations, as shown by a higher r value and a lower P value.
Results
Feed intake, weight gain and caecal tissue weight, content and pH
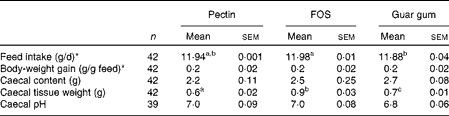
Rats were healthy and active throughout the experiment and the test diets were well tolerated. The animals consumed essentially all of the diets provided during the experimental period (11·88–11·98 g dry weight/d, P= 0·024 for FOS and guar gum; Table 2), and body-weight gain was equal for all the diet groups.
Feed intake, body-weight gain and caecal content, tissue weight and pH in rats fed pectin, fructo-oligosaccharides (FOS) and guar gum for 12 d (Mean values with their standard errors)
a,bMean values within a row with unlike superscript letters were significantly different (P< 0·05).
* Measured over 5 d.
Caecal tissue weight differed considerably between the diet groups (Table 2). Rats fed the FOS diet had a higher caecal tissue weight than rats fed the guar gum diet, which was higher than those fed the pectin diet (0·9 g for FOS, 0·7 g for guar gum and 0·6 g for pectin, P= 0·0046; Table 2). The caecal content and pH were similar with all diets.
SCFA
Effect of the diet on the caecum
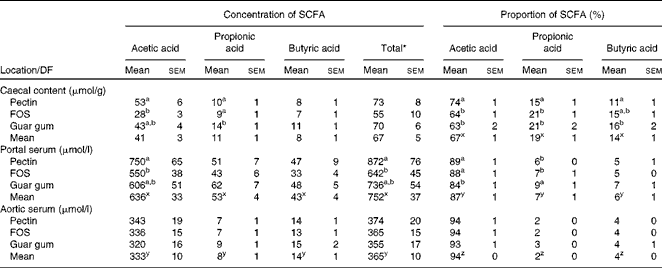
Only small differences in the total caecal concentration of the SCFA between the diet groups were observed, while the concentration and proportion of the individual acids differed considerably (Table 3). Rats fed pectin had a higher concentration of acetic acid when compared with FOS (53 v. 28 μmol/g, P= 0·0048). Rats fed guar gum had a higher concentration of propionic acid compared with rats fed pectin or FOS (14 v. 10 μmol/g or 9 μmol/g, P= 0·025 and 0·0071, respectively).
Proportion (%) and concentrations of the SCFA in the caecal content (μmol/g wet content) and in the portal and aortic serum (μmol/l) of rats fed the diets containing pectin, fructo-oligosaccharides (FOS) or guar gum for 12 d (n 11 for pectin; n 10 for FOS; n 12 for guar gum) (Mean values with their standard errors)

a,b,cMean values within a column for the different dietary fibre (pectin, FOS or guar gum) with unlike superscript letters were significantly different (P< 0·05).
x,y,zMean values within a column for the different locations (caecal content, portal serum or aortic serum) with unlike superscript letters were significantly different (P< 0·05).
* Total of acetic, propionic, isobutyric, butyric, isovaleric and valeric acids.
The highest proportion of acetic acid in the caecal content was seen in rats fed pectin (74 v. 64 % for FOS and 63 % for guar gum, P< 0·001), whereas rats fed guar gum and FOS generated the highest proportion of propionic acid (21 % with both guar gum and FOS v. 15 % with pectin, P= 0·0041). Guar gum gave a higher proportion of butyric acid in rats compared with pectin (16 v. 11 %, P= 0·0079).
Effects of the diet on the portal and aortic serum
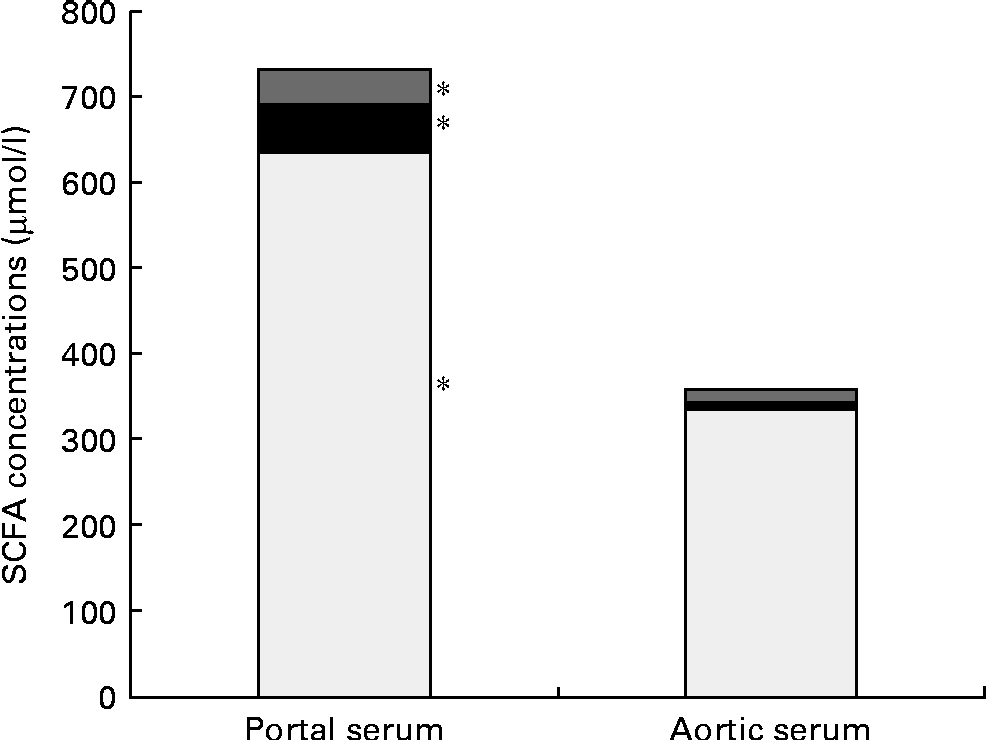
Pectin generated a higher concentration of acetic acid in portal serum than FOS (750 v. 550 μmol/l, P= 0·007). However, the differences in concentrations and proportions of acetic and propionic acids seen in the caecal content and portal serum between the different diet groups were no longer detectable in aortic serum. The total average concentration of the SCFA was considerably lower in aortic serum than in portal serum (365 v. 752 μmol/l, respectively, P< 0·001; Table 3 and Fig. 1). The mean concentration of acetic, propionic and butyric acids was reduced by 48, 85 and 68 %, respectively, from the portal serum to the aortic serum. Notably, the mean concentration of butyric acid in aortic serum was higher than that of propionic acid (14 v. 8 μmol/l, P< 0·001), while the concentration of butyric acid was lower or similar to that of propionic acid in portal serum and in caecal content.
Mean concentrations (μmol/l) of acetic (□), propionic (■) and butyric acids ( ) in the portal and aortic serum of rats fed pectin, fructo-oligosaccharides and guar gum. * Mean values of acetic, propionic and butyric acids were significantly different in portal and aortic serum (P< 0·05).
The different diet groups generated different proportions of acetic and propionic acids in portal serum. The proportion of acetic acid was highest in rats fed the pectin and FOS diets (89 and 88 %, respectively, v. 84 % for guar gum, P= 0·010), while guar gum generated a higher proportion of propionic acid (9 v. 6 % and 7 % for the other two test diets, P= 0·019). There were no differences in the proportion of butyric acid in portal serum between the diets, or for any of the SCFA in aortic serum for any diets.
Comparison of proportions in caecal content, portal and aortic serum
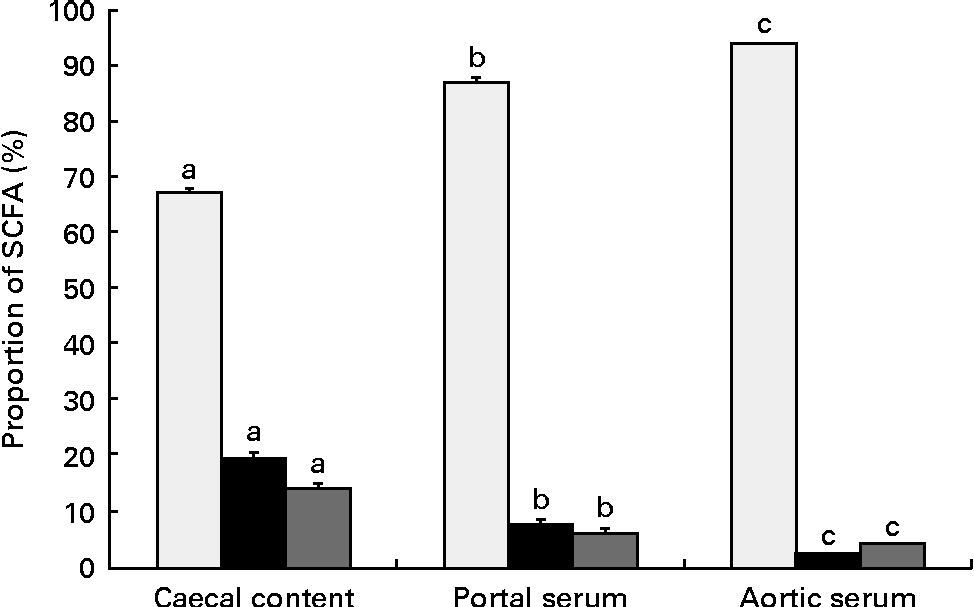
The proportions of the SCFA differed between the sample locations, caecal content and portal and aortic serum (Table 3 and Fig. 2). Consequently, the mean proportion of acetic acid of the total SCFA increased from 67 % in caecal content to 87 % (P< 0·001) in portal serum and to 94 % (P< 0·001) in aortic serum. The mean proportions of both propionic and butyric acids decreased, from 19 and 14 %, respectively, in caecal content to 7 and 6 %, respectively, in portal serum (P< 0·001) and to 2 and 4 %, respectively, in aortic serum (P< 0·001 and P= 0·024, respectively).
Mean proportions (%) of acetic (□), propionic (■) and butyric acids () in the caecal content, portal and aortic serum of rats fed pectin, fructo-oligosaccharides and guar gum. Values are means, with their standard errors represented by vertical bars. a,b,cMean values of specific SCFA (acetic, propionic and butyric acids) at the different locations (caecal content, portal and aortic serum) with unlike letters were significantly different (P< 0·05).
Correlations between the concentrations in caecal content, portal and aortic serum
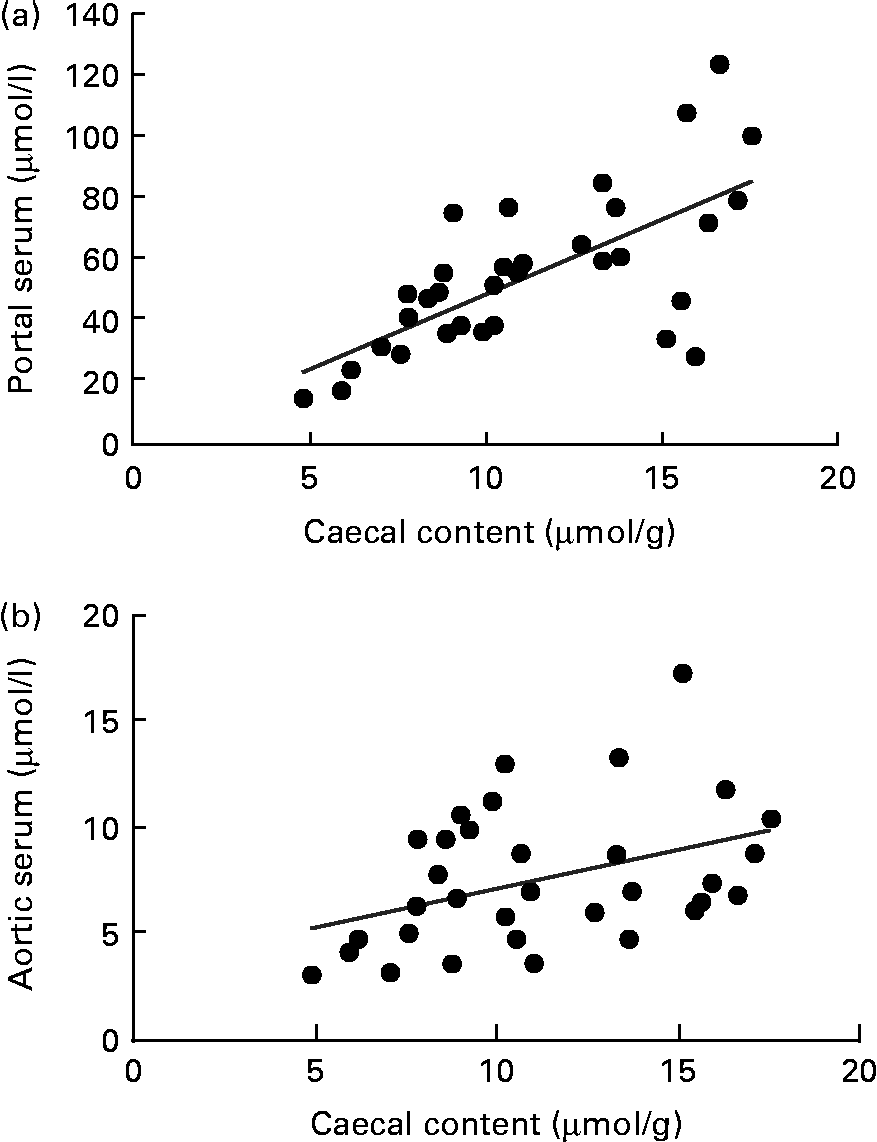
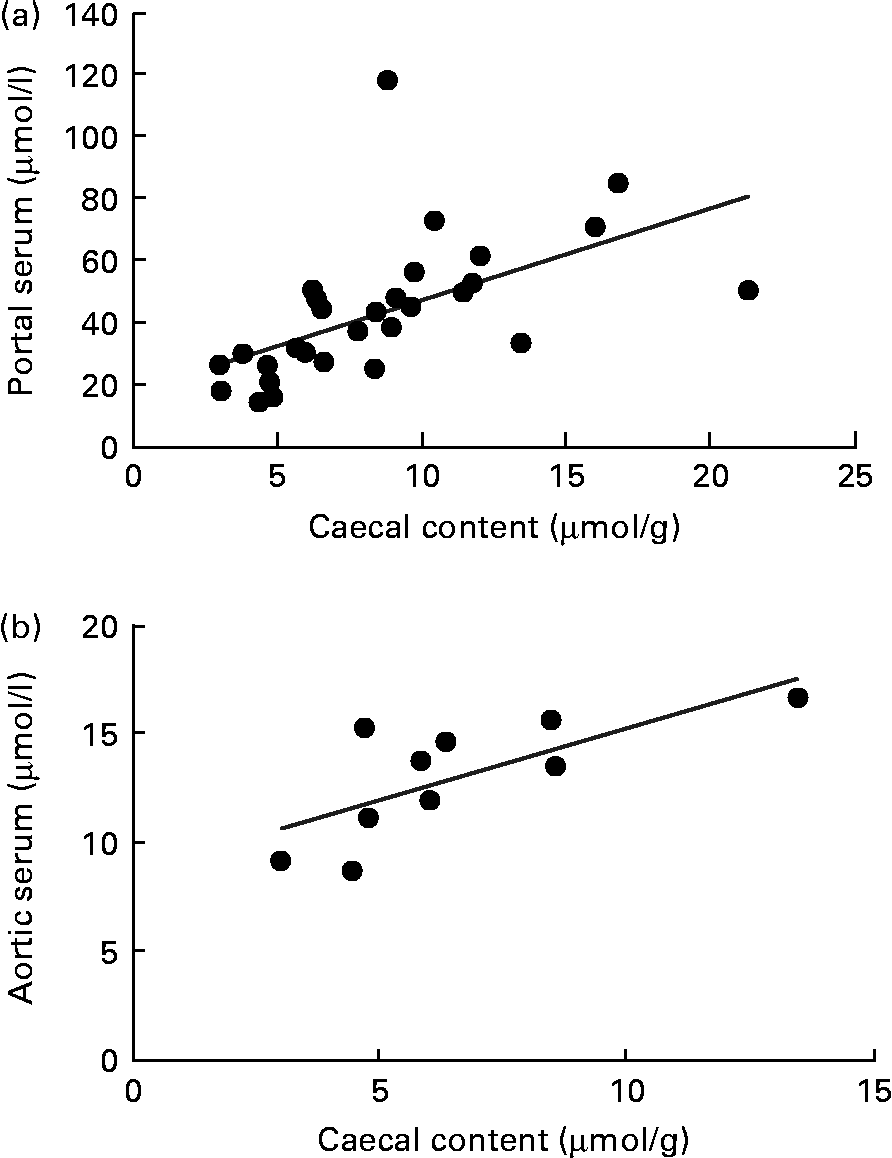
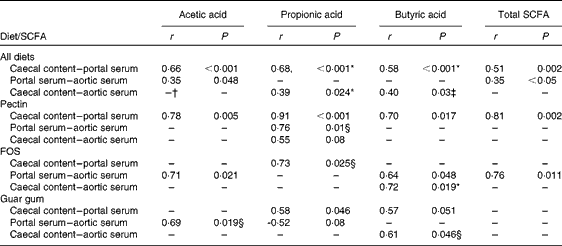
A correlation was found between the caecal content and portal serum concentrations of the total SCFA, acetic, propionic and butyric acids when considering all diets (r 0·51, 0·66, 0·68 and 0·58, respectively, P< 0·002; Table 4 and Fig. 3(a) for propionic acid and Fig. 4(a) for butyric acid). Concentrations of propionic and butyric acids in caecal content could also be correlated with concentrations in aortic serum (r 0·39 and 0·40, P= 0·024 and P= 0·03, respectively; Fig. 3(b) for propionic acid). Fewer correlations were found when studying each diet separately; however, when some unusual values were excluded from the calculations, more correlations were found. FOS and pectin showed stronger correlations than guar gum, as shown by their higher r values, and the strongest correlation was seen for propionic acid between the caecal content and portal serum in rats fed pectin (r 0·91, P< 0·001). The strongest correlation for butyric acid was found between the caecal content and aortic serum for FOS (r 0·72, P= 0·019; Fig. 4(b)).
Correlation of the SCFA between the caecal content, portal serum and aortic serum of rats fed pectin, fructo-oligosaccharides (FOS) and guar gum for 12 d (n 11 for pectin; n 10 for FOS; n 12 for guar gum)
Correlations in the concentration of propionic acid in rats fed pectin, fructo-oligosaccharides and guar gum between (a) the caecal content and portal serum (r 0·68, P< 0·001) and (b) the caecal content and aortic serum (r 0·39, P= 0·024).
Correlations in the concentration of butyric acid between (a) the caecal content and portal serum in rats fed pectin, fructo-oligosaccharides (FOS) and guar gum (r 0·58, P< 0·001) and (b) the caecal content and aortic serum in rats fed FOS (r 0·72, P= 0·019).
Discussion
Increasing evidence about the health-promoting effects of butyric and propionic acids has resulted in an interest in modulating the formation of SCFA through the diet. In the present study, rats were fed three test diets containing different DF that were known to be highly fermented, and known to give rise to different types of SCFA(Reference Nilsson and Nyman12, Reference Berggren, Björck and Nyman14–Reference Henningsson, Bjorck and Nyman16). The intention was to determine whether the various patterns of SCFA formed in the caecum could be maintained after absorption/utilisation in the body and be reflected in portal and aortic serum. Interestingly, the total concentration of SCFA, acetic, propionic and butyric acids in the caecal content of rats could be positively correlated with those in portal serum, and propionic and butyric acids could also be correlated with those in aortic serum. Some correlations between the diet and specific SCFA could also be seen. However, the expected effect of the different DF on the SCFA pattern, i.e. pectin, FOS and guar gum giving rise to high yields of acetic, butyric and propionic acid, respectively, could not be demonstrated in aortic serum. The reason for this is not known; however, the different substrates also gave less specific SCFA caecal content profiles than demonstrated in previous studies using the same rat model(Reference Nilsson and Nyman12, Reference Berggren, Björck and Nyman14–Reference Henningsson, Bjorck and Nyman16, Reference Barry, Hoebler and Macfarlane22–Reference Nilsson and Nyman24). Since both portal and aortic serum were collected at the end of the experiment, the final stages of the study were somewhat extended compared with other studies using the same rat model. It cannot be excluded that more already-formed SCFA was absorbed/utilised at the time of sample collection, which would remove differences. This was consistent with the comparatively low concentration of caecal SCFA. Together with the short experiment time of 5 d, this may explain why correlations were not found for all SCFA at all locations. In a recent study, the maximum concentration of SCFA in human serum has been shown to occur 4–6 h after the intake of a fibre-rich meal (G Jakobsdottir, JH Bjerregaard, H Skovbjerg and ME Nyman, unpublished results). If a similar experiment were to be carried out now, the protocol might therefore be optimised somewhat, giving the rats access to food until the end of the experiment or perhaps, even better, until 2 h before starting to kill the rats.
Higher caecal tissue weights were found in rats fed FOS compared with the other two test diets, although FOS gave the lowest concentration of SCFA in the caecal content of the three test diets. However, previous studies have shown that FOS of low molecular weight, i.e. of the identical type (same manufacturer) as in the present study, formed 2·5 times higher amounts of butyric acid in the caecum of rats fed for the same number of days and the same amount of FOS (80 g/kg)(Reference Nilsson and Nyman12). This is interesting, since butyric acid is the preferred energy source for colonocytes and has been suggested to be the most effective against colonic diseases. One explanation for the lower concentration of butyric acid in the present study in rats fed FOS could, as previously discussed, be explained by the extended time when finishing the study. Consequently, due to the rapid fermentation of this low-molecular-weight DF, the SCFA formed had already been largely absorbed from the caecal content. Another possible explanation is that FOS gives rise to large amounts of lactic acid, which can be further metabolised to SCFA by the microbiota(Reference Hashizume, Tsukahara and Yamada25). Another study in rats, by Le Blay et al. (Reference Le Blay, Michel and Blottiere26), showed that short-chain FOS promoted the growth of lactic acid bacteria. Hashizume et al. (Reference Hashizume, Tsukahara and Yamada25) showed that germ-free rats fed FOS produced large amounts of lactic acid and small amounts of butyric acid. After administration of Megasphaera elsdenii, the concentrations were reversed and butyric acid concentrations increased. It may be speculated whether the colonic microbiota of FOS-fed rats in the present study were not capable of metabolising lactic acid, thereby reducing the formation of butyric acid.
Most of the butyric acid formed in the colon is utilised by the mucosa, while propionic acid and, particularly, acetic acid have been reported to be much less effective in this respect. These acids are instead absorbed and transported via the portal vein to the liver, where most of the propionic acid is metabolised, and further distributed to tissue metabolism(Reference Cook and Sellin1). Therefore, differences in SCFA profiles in caecal content, portal and aortic serum can be expected. According to a study on six sudden death victims, the proportion of acetic acid increased successively during the passage through the body, while the proportion of butyric acid decreased between the colon and the portal vein and that of propionic acid between the portal vein and the hepatic vein(Reference Cummings, Pomare and Branch27). Similar results regarding acetic and butyric acids were obtained in the present study, and the proportion of acetic acid increased from 67 % in caecal content to 87 % in portal serum and to 94 % in aortic serum, while the proportion of butyric acid decreased from 14 % in caecal content to 6 and 4 % in portal and aortic serum, respectively. Interestingly, the proportion of propionic acid decreased to a great extent already between the caecal content and the portal vein (from 19 to 7 %). This indicates that propionic acid is also largely utilised by the mucosal cells, which does not correspond with the existing literature, where most focus is on butyric acid(Reference Hamer, Jonkers and Venema28). For example, in isolated colonocytes, from patients with ulcerative colitis and healthy controls, energy production came primarily from butyric acid(Reference Clausen and Mortensen29). However, the rate of utilisation of SCFA is extremely difficult to evaluate in human subjects, and there are only a few studies on sudden death victims available(Reference Cummings, Pomare and Branch27). From the results of the present study, it cannot be excluded that propionic acid is utilised to a higher extent than previously thought(Reference Al-Lahham, Peppelenbosch and Roelofsen30). It is also important to keep in mind that it may be difficult to compare the results from in vitro studies with in vivo studies in rats.
The concentration of acetic, propionic and butyric acids fell during the passage from the portal to the aortic serum by 48, 85 and 67 %, respectively. These results correspond fairly well with previous results from Peters et al. (Reference Peters, Pomare and Fisher31), who stated that the concentration of acetic acid in peripheral venous serum was approximately 45 % lower, and the concentrations of propionic and butyric acids were 87 and 100 % lower, respectively, than portal venous concentrations in human subjects after caecal installation of lactulose at a fasting state at surgery. The lower reduction of butyric acid found in the present study is probably due to the analysis of aortic serum, compared with peripheral serum in the study by Peters et al. (Reference Peters, Pomare and Fisher31). In that case, tissue cells may have absorbed butyric acid during the circulation, explaining the very low concentration in venous serum. Furthermore, we used a new methodology where the SCFA were enriched during extraction, facilitating more correct analyses of the low amounts of butyric acid found in serum.
Even though the concentrations of SCFA were lower compared with other studies using the same rat model(Reference Nilsson and Nyman12, Reference Berggren, Björck and Nyman14, Reference Henningsson, Bjorck and Nyman16, Reference Barry, Hoebler and Macfarlane22–Reference Nilsson and Nyman24, 32), rats fed a pectin diet yielded, as previously reported, the highest concentration of acetic acid at all locations studied, whereas rats fed guar gum resulted in the highest concentrations of propionic acid. Greater discrepancies appeared when the results of rats fed FOS were related to previous in vivo data(Reference Nilsson and Nyman12), which have shown that comparatively high amounts of butyric acid are formed. The reason for this is not known, but could be, as stated above, be due to the delay when finishing the experiment in combination with the rapid fermentation of FOS.
In conclusion, the specific SCFA profiles seen in caecal content from pectin (acetic acid) and guar gum (propionic acid) could be seen in portal blood. FOS gave low amounts of all SCFA at all locations studied. However, although there was low formation of butyric acid in rats fed the FOS diet, caecal tissue weight was significantly higher. Furthermore, concentrations of butyric acid in aortic serum correlated with concentrations in both caecal content and portal serum. Butyric acid is generally utilised to a great extent by the epithelial cells in the colon, but also propionic acid to some extent. Interestingly, propionic acid was metabolised to a greater extent than butyric acid, as shown by the comparatively lower concentration of this acid in aortic serum than in portal serum. Rats forming high concentrations of propionic and butyric acids in caecal content also had high concentrations of these acids in aortic serum. However, neither the differences in the proportions of SCFA nor the total formation of SCFA between the diets were as striking as in previous studies examining the same DF. The effect of the diet on different patterns and concentrations of SCFA in serum needs further evaluation. The ability to measure SCFA patterns in human subjects using this approach could be useful since invasive measurements cannot be taken, and venous serum samples have to be used when evaluating physiological effects of the diet.
Acknowledgements
The present study was supported by the Swedish Research Council for Environment, Agricultural Sciences and Spatial Planning (FORMAS), the Johanna Andersson Foundation and the Antidiabetic Food Centre, a VINNOVA VINN Excellence Center at Lund University. We thank Sara Rang for surgical assistance and C. Bränning, PhD and L. Haskå, PhD for technical advice. The authors' contributions were as follows: G. J., C. J., L. H. and M. E. N. designed the study; G. J. and C. J. conducted the research and analysed the data; G. J. evaluated the results statistically, G. J., C. J. and M. E. N. wrote the paper; G. J. was responsible for the final content. All authors read and approved the final manuscript. The authors have no conflict of interest.