


1 Introduction
In the past 50 years, design protocol studies have shaped the characteristics of design cognition research. Eastman’s seminal work on cognitive design processes (Eastman Reference Eastman1969, Reference Eastman and Moore1970) paved the way for numerous protocol studies on design cognition (Hay et al. Reference Hay, Duffy, McTeague, Pidgeon, Vuletic and Grealy2017a,Reference Hay, Duffy, McTeague, Pidgeon, Vuletic and Grealyb; Jiang & Yen Reference Jiang and Yen2009). The protocol analysis methodology aims to study design cognition by analyzing verbal utterances of participants during a set experiment (Ericsson & Simon Reference Ericsson and Simon1984; Van Someren, Barnard & Sandberg Reference Van Someren, Barnard and Sandberg1994) or in situ. Recent studies focused on designers’ physiological signals such as eye movements, electrodermal activity (EDA; this corresponds to the activation of sweat glands in the skin) or heart rate variability (HRV; this is the variation in the interval between two heart beats) while performing a design task (Sun et al. Reference Sun, Xiang, Chai, Yang and Zhang2014; Leinikka et al. Reference Leinikka, Huotilainen, Seitamaa-Hakkarainen and Mäkelä2016; Yu & Gero Reference Yu, Gero, Rajagopalan and Andamon2018). Techniques from neuroscience to analyze brain behavior during design thinking processes offer ways to better understand human behavior while designing (Alexiou et al. Reference Alexiou, Zamenopoulos, Johnson and Gilbert2009; Shealy, Hu & Gero Reference Shealy, Hu and Gero2018). The interest in using new methods from other research fields provides opportunities to better understand designers’ cognitive processes while designing.
The aim of this paper is to provide a framework for the study of the minds, the bodies and brains of designers while designing and to highlight new tools, new models and new research questions that emerge from such a framework. The framework is illustrated by relevant research studies, rather than an exhaustive literature review, in order to depict the potential of using the methods integrated within the framework. Other publications synthesize the large body of methods and results on advances in studying design through physiology and neurocognition. See Balters & Steinert (Reference Balters and Steinert2017) on monitoring emotion through neurophysiological tools; Seitamaa-Hakkarainen et al. (Reference Seitamaa-Hakkarainen, Huotilainen, Mäkelä, Groth and Hakkarainen2016) and Borgianni & Maccioni (Reference Borgianni and Maccioni2020) on neuroscience and design; and Pidgeon et al. (Reference Pidgeon, Grealy, Duffy, Hay, McTeague, Vuletic, Coyle and Gilbert2016) on neuroimaging and design creativity. Our aim encapsulates a descriptive framework to better understand the connection between the study of the minds, bodies and brains of designers while designing and to highlight new research challenges that will shape future work in design research.
We consider design thinking as the cognitive activity carried out by designers while they are designing. We categorize the research methods into three paradigmatic approaches for measuring design thinking activity through measuring design cognition (designers’ minds while designing), design physiology (designers’ bodies while designing) and design neurocognition (designers’ brains while designing). We will see that each paradigmatic approach provides different tools to measure distinct characteristics of the design thinking activity. The underlying aim of design physiology and design neurocognition is to inform design cognition by measuring some aspect of a designer’s physiology and neurophysiology while designing.
1.1 Design thinking
The richness and complexity of design tasks lead to a wide range of enquiries on how designers think while designing (Cross Reference Cross2007). Design is often considered as a problem-solving activity (Alexander Reference Alexander1964; Simon Reference Simon1969) with the constraint that design problems, compared to other types of problems, contain a set of variables that are partly unknown. Called ill-defined (Simon Reference Simon1973) or wicked (Rittel & Webber Reference Rittel and Webber1973), design problems evolve along a temporal scale through the overall design activity development. Framing design problems is a prerequisite to proposing a design solution that will fit design requirements (Akin & Akin Reference Akin and Akin1996). The formulation of a design solution gives feedback to designers (Schön Reference Schön1992), which guides them in reframing the design situation in order to advance in their design process. Thus, design is considered to unfold through a co-evolution of the design problem and solution spaces (Maher & Poon Reference Maher and Poon1996; Dorst & Cross Reference Dorst and Cross2001). Design thinking calls for a variety of reasoning mechanisms. In a recent paper, Kannengiesser & Gero (Reference Kannengiesser and Gero2019) proposed a design thinking framework adapting Kahneman’s concept of thinking fast and slow (Kahneman Reference Kahneman2011). With experience, designers learn to ‘think faster’ and will propose design solutions in an effortless and intuitive way. Fast design thinking becomes a shortcut compared to a longer, reasoned design approach. Multiple factors such as design expertise, education domain, as well as design tools used can affect design thinking patterns (Yu & Gero Reference Yu and Gero2016). Design is a situated activity at a social level, implying that it is situated regarding the design context or the materials of the design situation, and at a personal level, meaning that it is situated in relation to a designer’s past experiences. These two levels of situatedness involve a large range of cognitive processes mobilized to tackle design problems.
1.2 Studying cognitive processes during design thinking
The foundational goal of design research is to gain a better understanding of designing in order to improve the design process, to produce tools for designers, to improve design pedagogy, and consequentially to improve the outcome of designing. Design cognition studies use direct (protocol analysis) and indirect (surveys, interviews and black-box experiments) measurements of designers’ cognitive behaviors while designing. Design physiology and design neurocognition studies provide information on designers’ physiological behaviors (from measuring eye movements, EDA and HRV) and brain behaviors (from non-invasive brain measurement techniques) that can be correlated with cognitive activities. Results from design studies provide feedback to designers and design educators on their practices, while doing design and teaching design. With a clearer comprehension of design thinking, we can develop design tools to assist designers in their tasks (Gero Reference Gero1990), pedagogic tools to support a better design learning process and research tools to improve the efficiency and effectiveness of design research.
The combination of those three paradigmatic approaches, design cognition, design physiology and design neurocognition, creates empirically based knowledge that deepens our understanding of design thinking. The focus remains to study designers’ cognitive activity, which is described by the cognitive processes involved while design thinking. Design cognition studies provide a measurement of designers’ cognitive behaviors. Information on design physiology and design neurocognition provides an objective, indirect measure of design cognition and offers a synthetic approach to understanding human behavior while designing. Research in design cognition is the most mature of the three approaches as it started 50 years ago (Eastman Reference Eastman1969, Reference Eastman and Moore1970). Research into design physiology and design neurocognition is increasing due to more accessible tools and more readily available software to analyze physiological and neurological data. The correlation among findings in design cognition, design physiology and design neurocognition is a major goal for future design thinking research and provides the foundations for the development of new models, new tools and new research questions in design thinking, all of which contribute to the understanding of design thinking.
1.3 Outline
In this paper, we present a framework, illustrated by examples, for how we can measure characteristics of design thinking with measures from the three paradigmatic approaches of design cognition, design physiology and design neurocognition. To elucidate how tools from each approach provide measurements of design thinking, we base our presentations on a non-exhaustive set of illustrative research studies. Through the illustrative body of research work we present, some characteristics of design thinking will be explored: design reasoning, processes and patterns; design fixation; design creativity; visual reasoning in design; the co-evolution of design spaces and design collaboration. In Section 2, we discuss different approaches to studying design thinking with black-box experiments or protocol analysis. In Section 3, we explore what we can measure with design physiology while Section 4 focuses on what we can measure with design neurocognition. Section 5 synthesizes results from the previous sections to draw an overview of methods and tools available to study design thinking and the type of results they provide. We also explore the correlation and post-processing of results from each paradigmatic approach. In Section 6, we describe what feedback those results give to designers, educators and researchers; present the potential of new models and tools that can be derived from results; and highlight the emergence of new research questions.
2 What can we measure with design cognition?
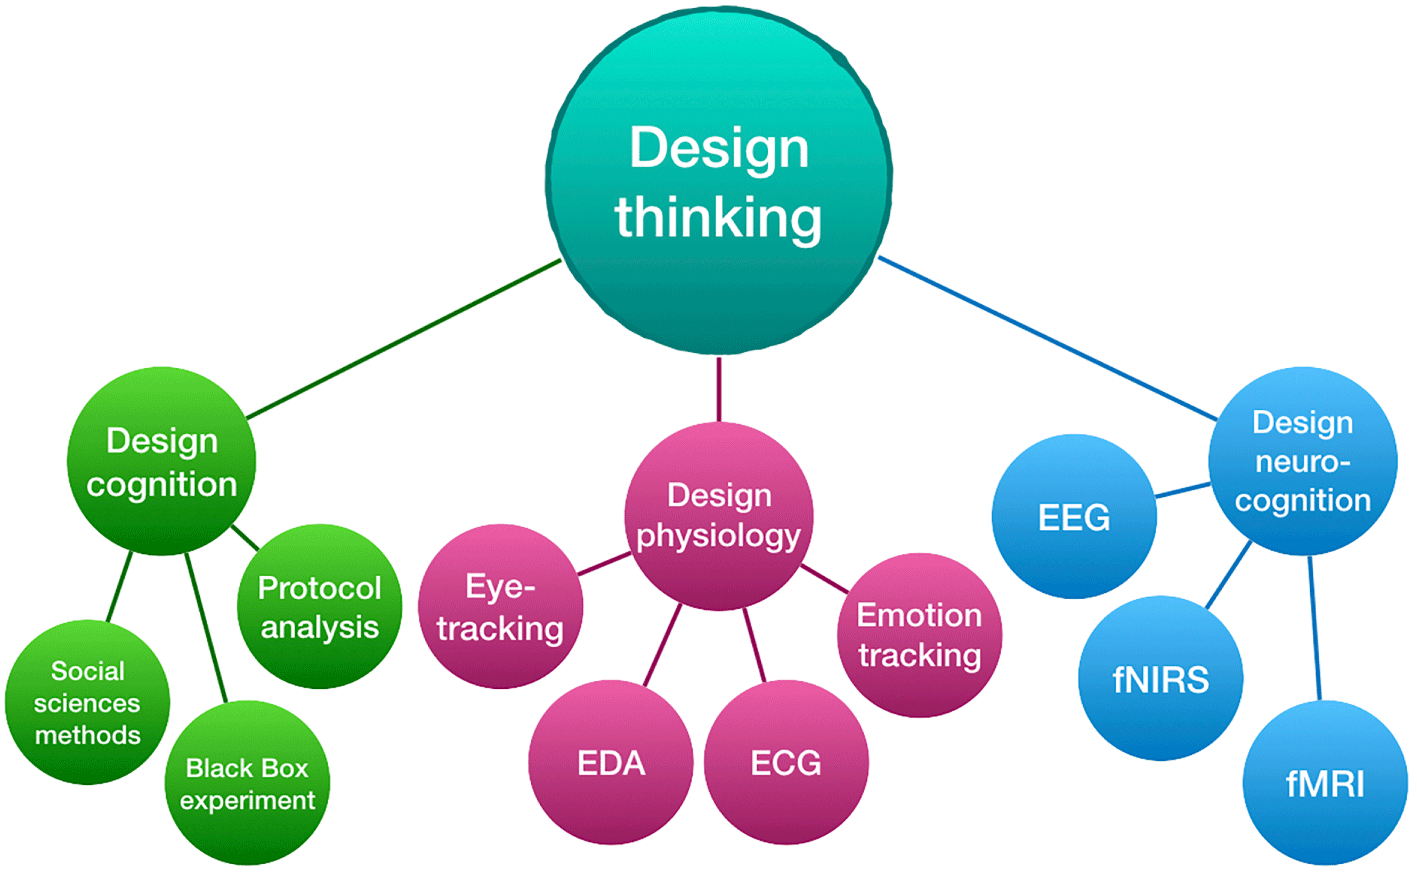
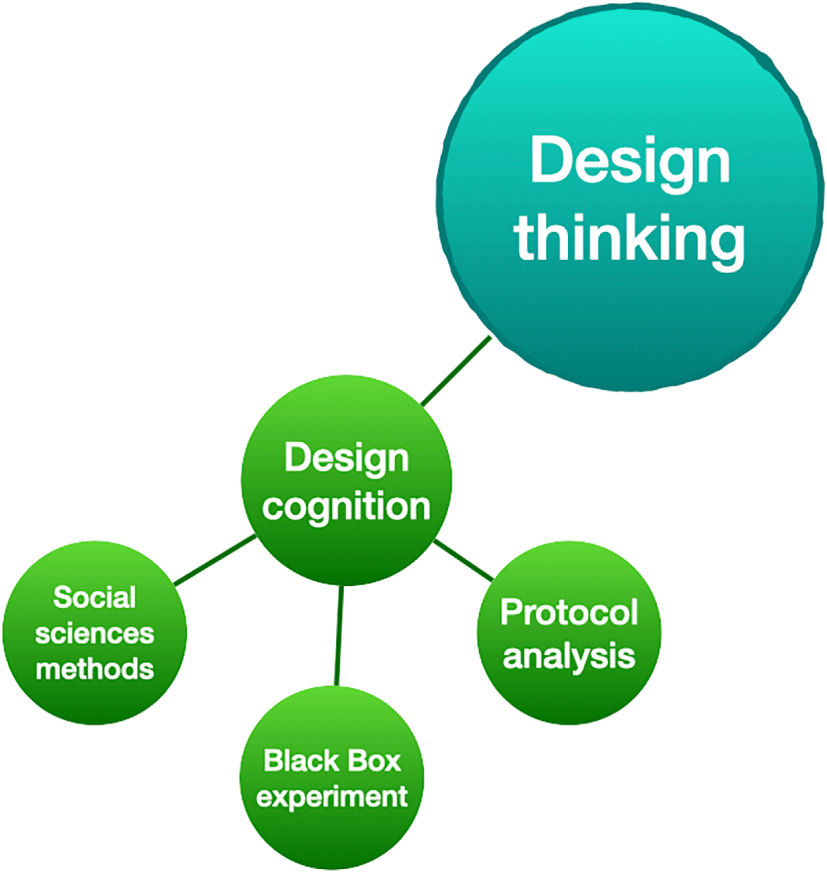
Design cognition is the most developed of the three paradigmatic measurement approaches. Design cognition aims at measuring design reasoning, processes and patterns; divergent and convergent thinking; design fixation; design creativity; visual reasoning in design; design space co-evolution and design collaboration with design cognition tools, among others. Coley, Houseman & Roy (Reference Coley, Houseman and Roy2007) point out that several popular methods can be exploited to study design thinking in terms of cognitive behavior such as the think-aloud method within protocol analysis, observation of sketching behavior, ethnography and diary methods, to which we can add black-box experiments, retrospective interviews (Dorta, Beaudry-Marchand & Pierini Reference Dorta, Beaudry-Marchand, Pierini and Gero2018) and surveys (Blizzard et al. Reference Blizzard, Klotz, Potvin, Hazari, Cribbs and Godwin2015; Coleman et al. Reference Coleman, Shealy, Grohs and Godwin2019). We can regroup these methods into three categories: social sciences methods; black-box experiments and protocol analysis as illustrated in Figure 1. In the rest of the paper, we present our framework in the form of a diagram to allow for its easy comprehension.
Design cognition tools.

Social sciences methods are not considered further in the description of our framework. Black-box experiments focus on the outcomes of the design processes whereas protocol analysis aims at investigating cognitive actions during the design process. In the following, we will illustrate different methods to study design thinking based on cognitive science techniques through a set of illustrative examples to highlight to what end each methodology can be exploited. The results from those studies, although interesting, are not our main focus.
2.1 Black-box experiments: measuring the outcome of designing
In black-box experiments, multiple conditions are set to carry out a design task. One condition is the control and the other condition is the experiment. The outcome of the design task is measured for each condition. A comparative analysis can provide results on the effect of each experiment condition on the design outcome, from which a cognitive behavior can be inferred. For example, Purcell et al. (Reference Purcell, Williams, Gero and Colbron1993) focused on the design fixation effect during a design task for two different groups. The control group was given a written design brief, while the experiment group was given the same design brief with an illustrative example to show the level of detail expected in the design. The example in the illustration happened to be a possible solution. The fixation effect was measured by determining the similar details between design solutions proposed by designers and the illustrative example and comparing these details with those produced by the control group that had not seen the illustrative example.
2.2 Protocol analysis: measuring cognitive behavior
Protocol analysis, eliciting information from verbal utterances, is a common method to study design reasoning, processes and patterns (Ericsson & Simon Reference Ericsson and Simon1984; Van Someren et al. Reference Van Someren, Barnard and Sandberg1994). Used with different design frameworks, it provides a measurement of one or more designers’ cognitive behaviors. The development of a coding scheme to encode the protocols can be based on the data itself (grounded theory) or on a model defined a priori. Ericsson & Simon (Reference Ericsson and Simon1984) suggest running a pilot study in order to develop coding categories. A significant number of models and coding schemes have been exploited and developed to describe design cognitive processes (Hay et al. Reference Hay, Duffy, McTeague, Pidgeon, Vuletic and Grealy2017a,Reference Hay, Duffy, McTeague, Pidgeon, Vuletic and Grealyb). For design thinking studies, a very small number of common coding schemes should be adopted (Gero Reference Gero, Dorst, Stewart, Staudinger, Paton and Dong2010). Although mapping between coding schemes is sometimes possible, results from protocol analysis using different design thinking frameworks are often not commensurable, and as a consequence, the results from different experiments cannot be compared nor can the results from different experimenters, thus reducing their value. The richness of frameworks exploited to describe design processes is also a limit, and the use of a common framework and coding scheme is necessary in order to compare studies to others and provide a more synthetic description of design thinking.
In the following, we will reference research studies using different design frameworks but mainly examples based on protocols analyzed with the Function Behavior Structure (FBS) ontology (Gero Reference Gero1990; Gero & Kannengiesser Reference Gero and Kannengiesser2004). The FBS ontology was chosen given the coverage it has in terms of usage to study designing in different domains: architecture (Pauwels, Strobbe & De Meyer Reference Pauwels, Strobbe and De Meyer2015), engineering (Masclet & Boujut Reference Masclet and Boujut2010; Hamraz & Clarkson Reference Hamraz and Clarkson2015), software design (Hofmeister et al. Reference Hofmeister, Kruchten, Nord, Obbink, Ran and America2007) and systems design, where over 10,000 hours of designing in industry has been coded (Bott & Mesmer Reference Bott and Mesmer2019). The two papers that outline the FBS ontology (Gero Reference Gero1990; Gero & Kannengiesser Reference Gero and Kannengiesser2004) have received over 3,500 citations between them (Google Scholar, accessed 15 January 2020). Multiple approaches to protocol analysis using a first-order coding (the most common form of coding), a second-order coding (two families of codes are used for a protocol), or linkography are described in the following sections. Combining protocol analysis coding results with statistical tools such as Markov models and correspondence analysis provides ways to produce an understanding of design reasoning, design creativity and the co-evolution of the design space.
Example of moving average of cognitive design effort spent on design issues over time (Neramballi, Sakao & Gero Reference Neramballi, Sakao, Gero, Eriksson and Paetzold2019).
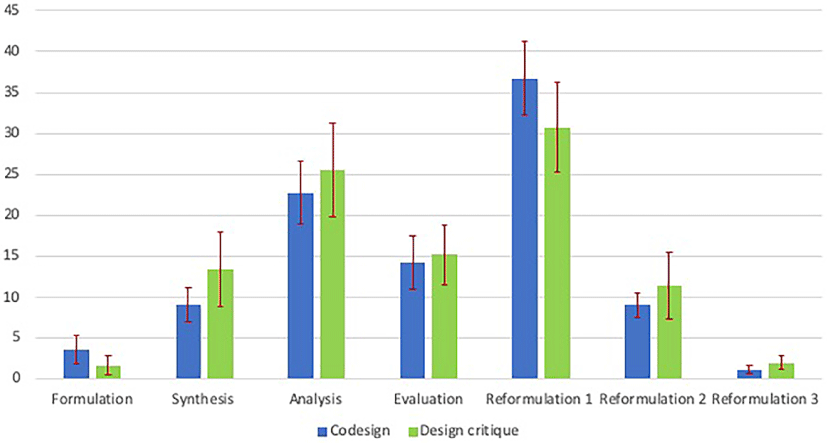
Percentage distributions of FBS design processes for 10 co-design protocols and for 9 architectural critiques (Milovanovic & Gero Reference Milovanovic and Gero2020).

2.2.1 First-order coding
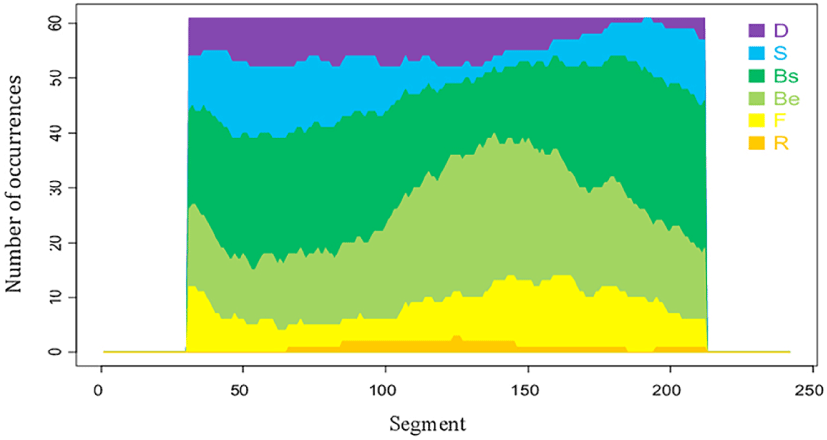
The protocol analysis method consists of analyzing verbal data generated by a single designer while designing (think-aloud or retrospective verbal transcripts) or a team of designers (conversational verbal transcripts) (Jiang & Yen Reference Jiang and Yen2009) to determine cognitive actions while designing. Transcripts are then segmented and associated with a category from the defined coding scheme. Protocol analysis and FBS coding are used to represent the distribution of specific design issues and processes and their occurrence over time. Typical data generated by this analysis is each code’s quantitative distributions over time (Figure 2) and the distribution of design processes for several sessions (Figure 3).
Using protocol analysis and the FBS ontology, Kannengiesser & Gero (Reference Kannengiesser and Gero2019) explore the use of design thinking systems depending on the designers’ expertise. Design thinking demonstrates use of the dual process theory of thinking, elaborated in Kahneman’s System 1 or thinking fast and System 2 or thinking slow (Kahneman Reference Kahneman2011). ‘Designing fast’ means designing in an intuitive, seamless way, which is associated with routine design, whereas ‘designing slow’ implies that the designer goes through a number of reasoning processes to tackle a design problem. Kannengiesser & Gero (Reference Kannengiesser and Gero2019) show that all student and professional designers across a number of protocol analysis studies exhibit both System 1 and System 2 thinking.
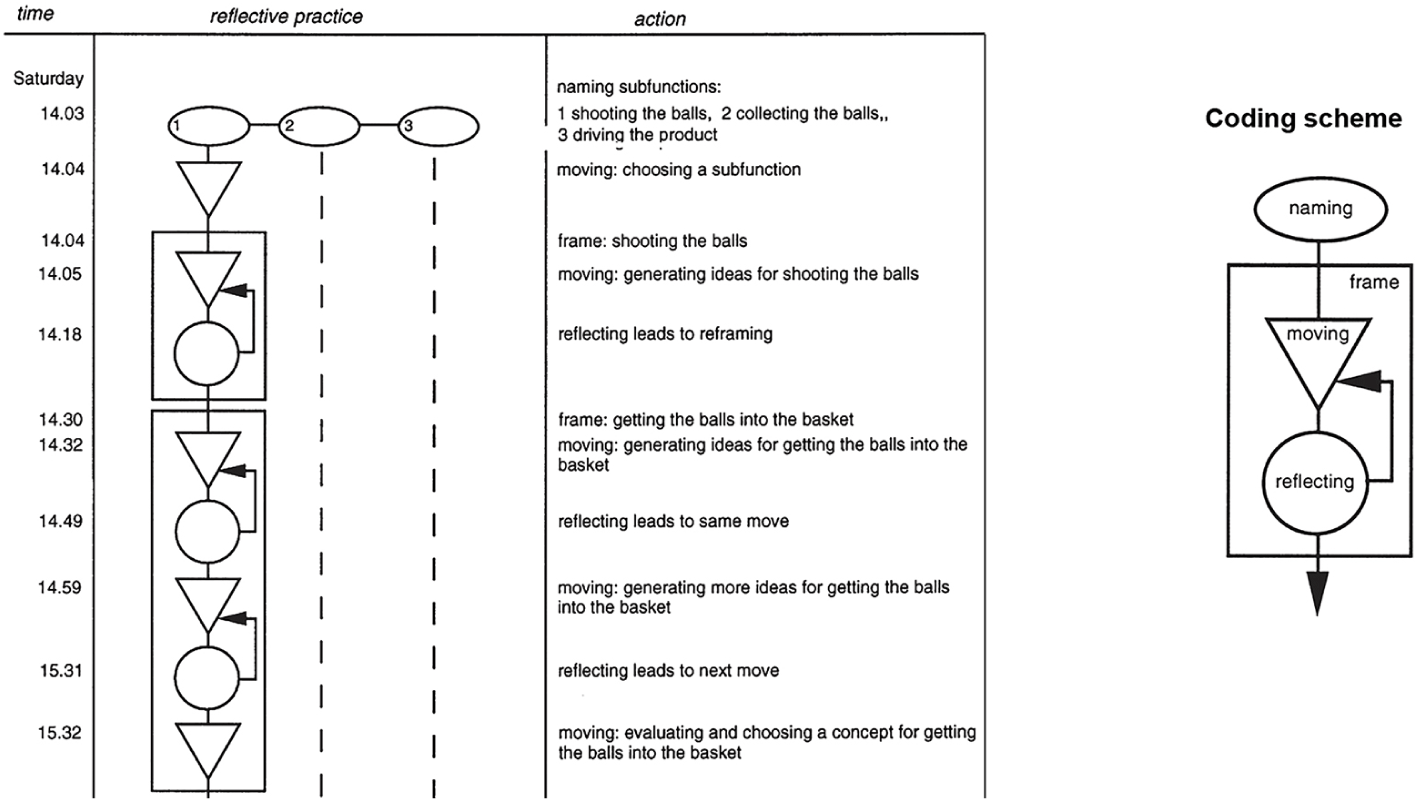
Other studies focus on design reasoning, or design collaboration with a first-order code. For example, Wolmarans (Reference Wolmarans2016) explored design reasoning with protocol analysis in terms of semantic gravity (navigation between abstraction and concretization in design thinking) and semantic density (level of integration of design disciplines in design thinking). Dong, Garbuio & Lovallo (Reference Dong, Garbuio and Lovallo2016) questioned the concept of generative sensing while designing as a form of abductive reasoning. Design team thinking is the focus of Valkenburg & Dorst’s (Reference Valkenburg and Dorst1998) analysis, which studies design framing in a collaborative environment. They based their analysis on three codes taken from Schön’s (Reference Schön1983) model of reflective practice (naming, moving and reflecting) to explore collective framing. Their approach provides a qualitative representation of design actions across time (Figure 4).
Example of a qualitative representation of cognitive states of design reflective practice of a design protocol coded with a first-order code (Valkenburg & Dorst Reference Valkenburg and Dorst1998).
2.2.2 Second-order coding
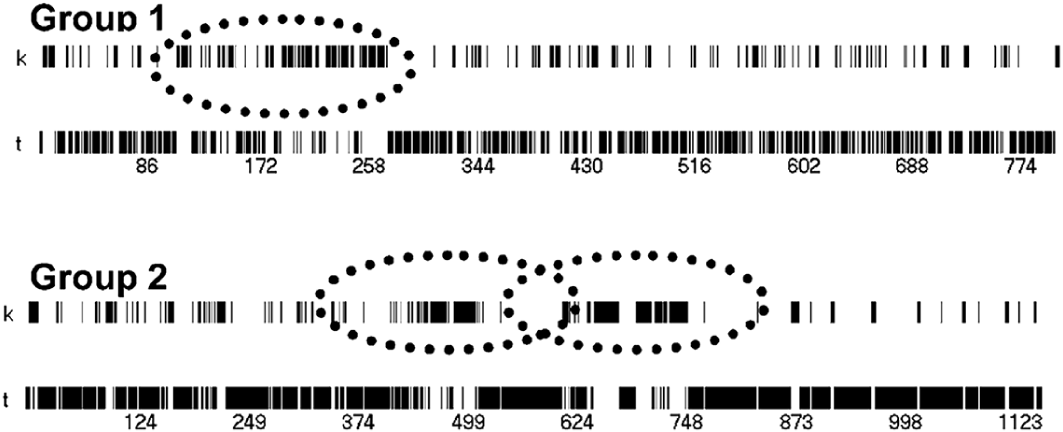
A second-order coding adds another layer of coding to the original coded protocols, which provides the possibility of studying designers at other levels such as interacting with the others in co-design situations (Milovanovic & Gero Reference Milovanovic and Gero2018; Gero & Milovanovic Reference Gero and Milovanovic2019) or of integrating another coding scheme to assess team communication to supplement the study of design thinking processes (Darses et al. Reference Darses, Détienne, Falzon and Visser2001; Stempfle & Badke-Schaub Reference Stempfle and Badke-Schaub2002; Dorta et al. Reference Dorta, Kalay, Lesage and Pérez2011). Second-order coding provides opportunities to both quantitatively and qualitatively explore the movement of a team’s focus on either the content of the design task (solution generation, analysis, evaluation, etc.) or on the collaborative processes (planning, decision, control, etc.) (Stempfle & Badke-Schaub Reference Stempfle and Badke-Schaub2002); see Figure 5.
Analysis of a design protocol with a second-order coding scheme:  $k=\text{content}$ and $t=\text{processes}$ (Stempfle & Badke-Schaub Reference Stempfle and Badke-Schaub2002).
Problem decomposition and recomposition is a common feature of many design processes. A second-order code that suits its analysis is the system–subsystem level (Gero & Mc Neill Reference Gero and Mc Neill1998; Gero & Song Reference Gero and Song2017). The defined levels are the system level, where designers focus on working on the design problem as a whole, the interaction level, where designers tackle interactions between design subsystems, and the subsystem level, where designers deal with detailing design subsystems. Problem decomposition and recomposition are defined by a change of level from the system level to the subsystem level for the decomposition process and inversely for the recomposition process. In their study, Gero & Song (Reference Gero and Song2017) found differences in the cognitive effort expended by designers in decomposing and recomposing design problems depending on their expertise (freshmen, seniors and professionals).
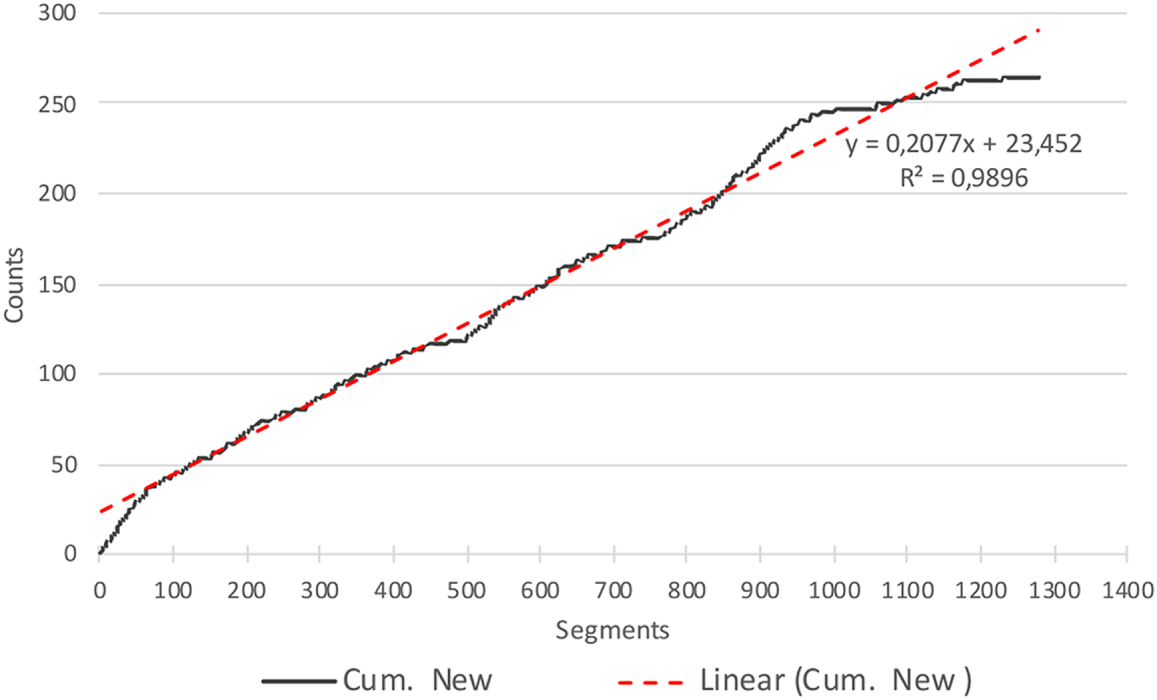
Another example of second-order coding is in the study of design creativity using an augmented FBS coding scheme, adding a ‘new’ and ‘surprising’ code to the FBS coding scheme (Gero & Kan Reference Gero and Kan2016). The study explored the occurrences of new and surprising design issues to model a temporal trend of design creativity. The same augmented code was applied by Gero, Yu & Wells (Reference Gero, Yu and Wells2019) to study the effect of an engineering design capstone course on high school students’ abilities to design creatively. The aim of adding a second-order code to the original code is to provide a more granular analysis of the design activity, in this case to examine the creativity dimension of the design activity (Figure 6).
Cumulative distribution of FBS new design issues (Gero & Kan Reference Gero and Kan2016).
A second-order code has been used to investigate the co-evolution of the design space (Jiang, Gero & Yen Reference Jiang, Gero, Yen and Gero2014; Milovanovic & Gero Reference Milovanovic and Gero2018).
2.3 Meta-level codes to generalize design thinking characteristics
Existing coding schemes can be used to generate a meta-level understanding by grouping codes into higher level categories. The use of a meta-level coding scheme provides a more general analysis of a design activity. The notion of co-evolution of the problem/solution space is a general concept defining the design activity (Maher & Poon Reference Maher and Poon1996; Dorst & Cross Reference Dorst and Cross2001) and can be studied by grouping FBS design issues into design problem related issues and design solution related issues (Jiang et al. Reference Jiang, Gero, Yen and Gero2014; Milovanovic & Gero Reference Milovanovic and Gero2018). Requirement (R), function (F) and expected behavior (Be) are part of the design problem space whereas structure (S) and behavior from structure (Bs) are within the design solution space. By grouping FBS codes into two meta-codes (problem and solution issues), we obtain a general time-based representation of the design activity expressing the cognitive focus of the activity.
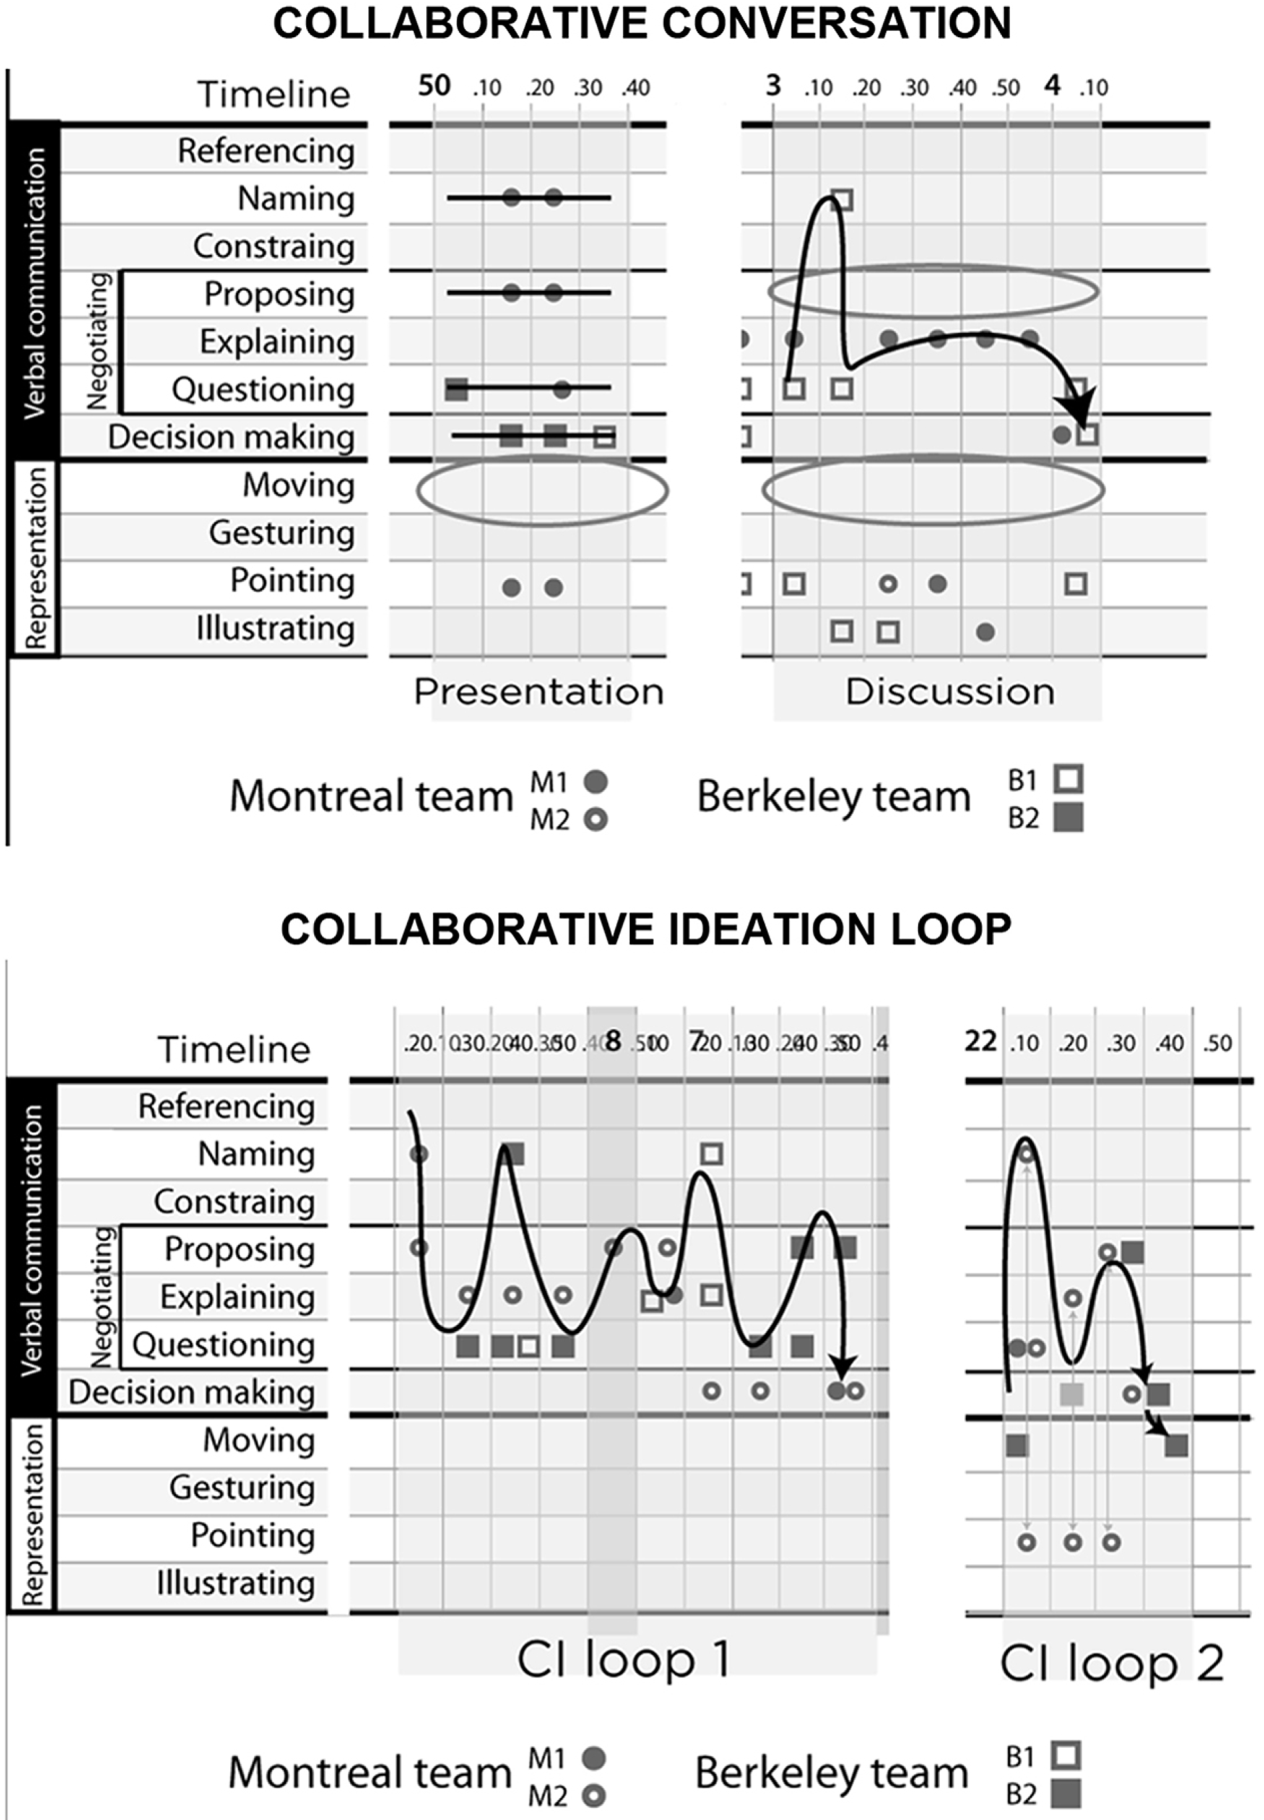
Collaboration can also be studied by a meta-level coding scheme as exploited in Dorta et al.’s (Reference Dorta, Kalay, Lesage and Pérez2011) analysis, which assesses patterns of co-ideation in design protocols. In their framework, seven types of design conversation are part of their coding scheme: referencing, naming, constraining, proposing, explaining, questioning and decision-making. The association of several of those verbal actions forms two types of co-design process, collaborative conversation and collaborative ideation, as illustrated in Figure 7.
Identification of patterns of design collaboration based on a meta-level coding scheme analysis (Dorta et al. Reference Dorta, Kalay, Lesage and Pérez2011).

2.4 Data analysis: various ways to exploit coded protocols
Information given by the coded protocols can be further analyzed using tools such as linkography, Markov modeling and correspondence analysis. Linkography analyzes semantic relationships between design segments (also called moves) (Goldschmidt Reference Goldschmidt1990, Reference Goldschmidt2014). The most probable design process transitions (Kan & Gero Reference Kan, Gero, Dave, Li, Gu and Park2010), reasoning (Gero & Peng Reference Gero and Peng2009) or speaker transitions can be assessed by Markov models. Correspondence analysis highlights relationships between categories of protocols, such as design processes and participants or design processes and representation media.
Linkography to explore design reasoning structure
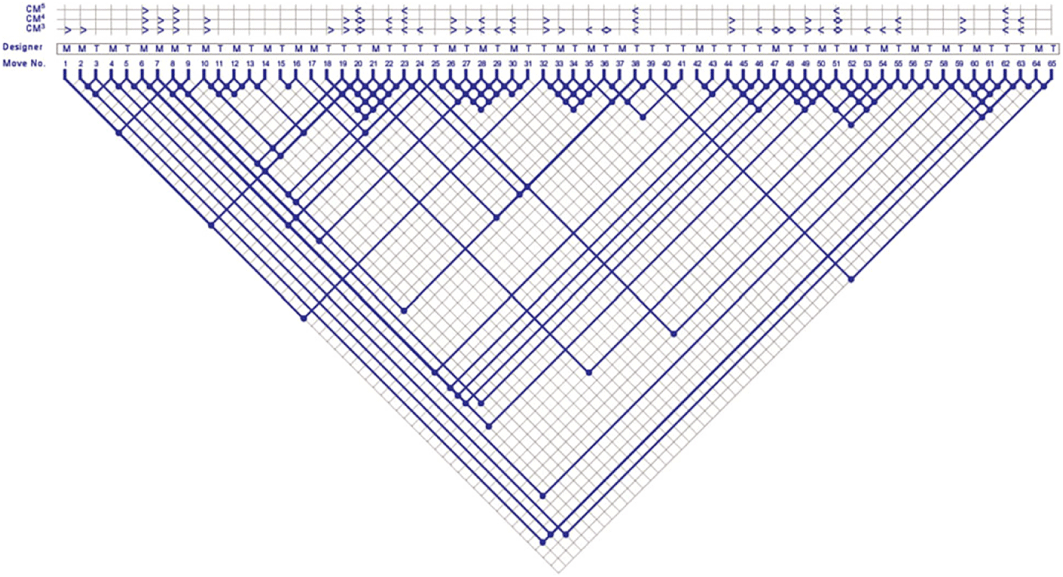
Linkography (Goldschmidt Reference Goldschmidt1990, Reference Goldschmidt2014) aims at studying the relationships between design segments (moves), which are actions or steps, in the design process, and is based on design protocols. A linkograph represents the reasoning structure during a design session (Figure 8). It includes a horizontal axis, where the design segments are placed in chronological order. Two types of links are distinguished: forelinks, links going from one idea to another by moving forward in time, and backlinks, links going from one idea to another by moving back in time. A link is both a forelink and a backlink, depending on the reference move.
Example of a linkograph of a design critique (Goldschmidt, Hochman & Dafni Reference Goldschmidt, Hochman and Dafni2010).

The Link Index is the number of links divided by the number of moves connected by these links. The higher the Link Index, the denser the number of links as compared to the number of moves. Critical Moves are moves with a high number of links and, according to Goldschmidt (Reference Goldschmidt1990, Reference Goldschmidt2014), account for the structure of the design activity. Results from the linkograph can be exploited in multiple ways to inform about the design activity, such as design entropy (Kan & Gero Reference Kan and Gero2008, Reference Kan and Gero2017).
Markov models to explore patterns in the design activity
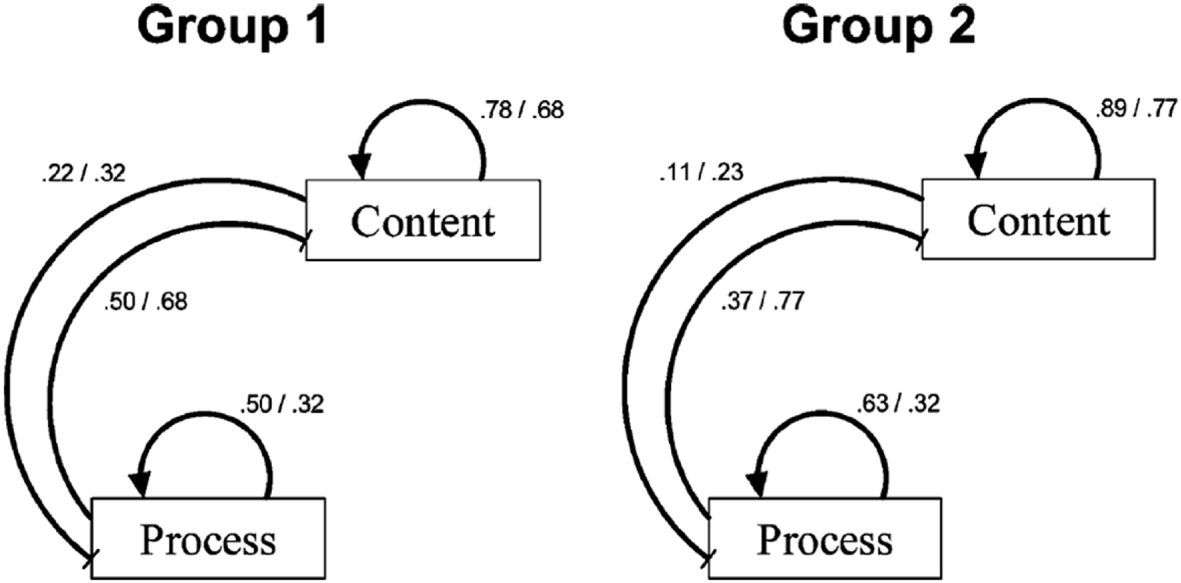
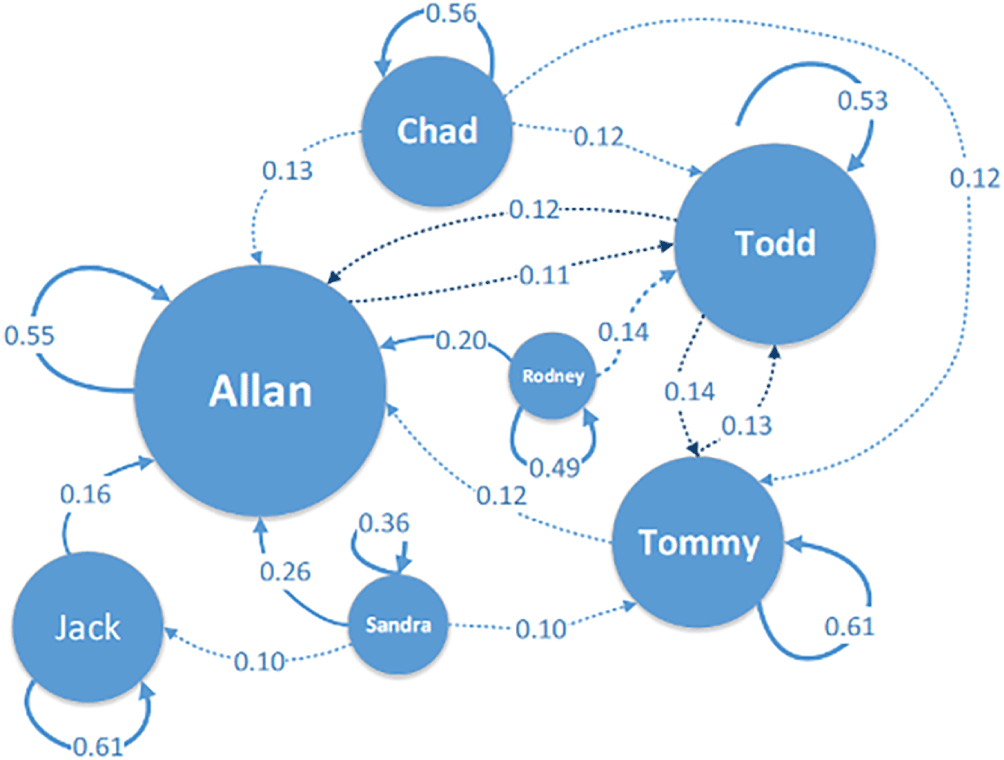
Transitions between design issues can be modeled with a first-order Markov model, which expresses the probability of transitioning from one state to another. Markov models normalize data and lose magnitude effects since they are based on percentage occurrences. The interest in using first-order Markov models is to reveal design patterns in the datasets collected from empirical data (Yu & Gero Reference Yu and Gero2016; Kan & Gero Reference Kan and Gero2017; Milovanovic & Gero Reference Milovanovic and Gero2018) or participants’ design patterns in the case of a team design (Gero et al. Reference Gero, Kan, Jiang, Meboldt, Matthiesen, Badke-Schaub and Lohmeyer2014); see Figure 9. Using a similar tool, Stempfle & Badke-Schaub (Reference Stempfle and Badke-Schaub2002) explored transitions of team mental focus, either on content (solution generation, analysis, evaluation, etc.) or the collaborative processes engaged (planning, decision, control, etc.); see Figure 10.
Transition diagram of design communication, showing probability of the next person being communicated with after an idea is expressed by one person (Gero et al. Reference Gero, Kan, Jiang, Meboldt, Matthiesen, Badke-Schaub and Lohmeyer2014).

Transition diagram of team’s mental focus showing the probability of switching the focus between content and process (Stempfle & Badke-Schaub Reference Stempfle and Badke-Schaub2002).
Correspondence analysis to highlight relative relationships between features of the design activity
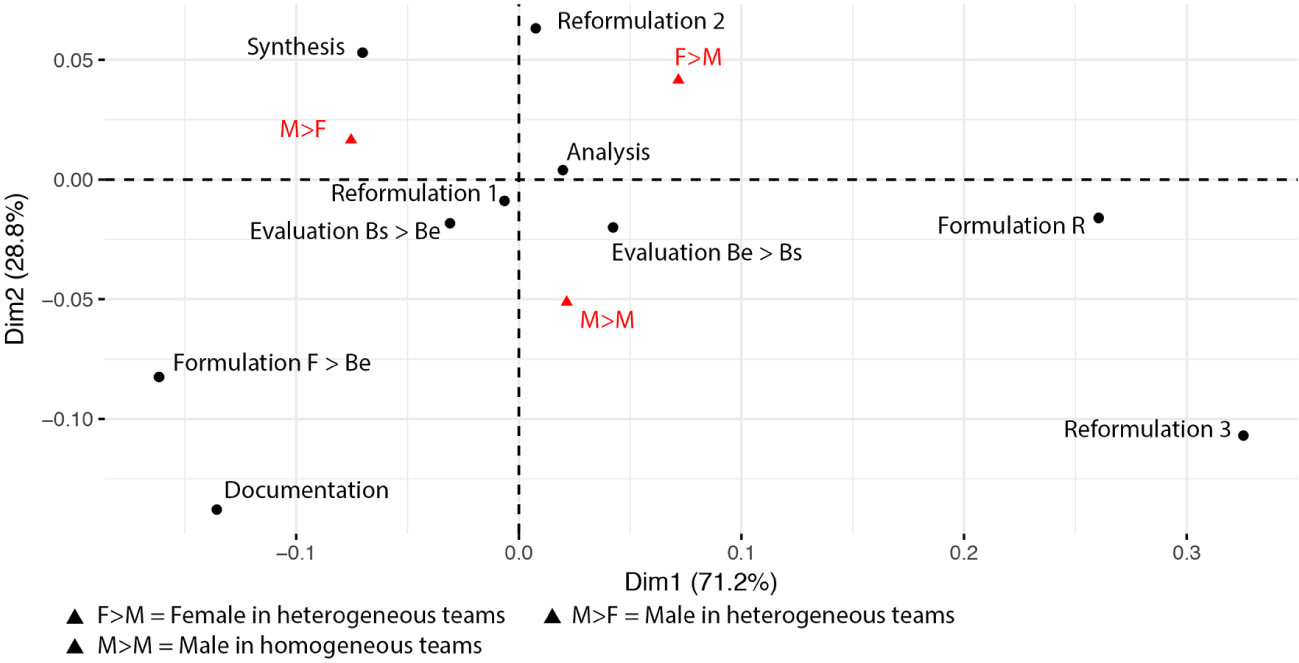
Correspondence analysis is a dimensional reduction method that concludes by representing on a two-dimensional graph, relative relationship between categories of the design activity. In the example in Figure 11, participants’ interactions and FBS design processes are presented relative to each other (Milovanovic & Gero Reference Milovanovic, Gero, Eriksson and Paetzold2019). Three types of participant interactions are examined based on their gender: male to male  $(M>M)$, female to male $(F>M)$ and male to female $(M>F)$. Based on the correspondence analysis results, we can infer qualitative differences between designers’ type of interactions, based on their teammate’s gender related to design processes. The ensemble of methods presented above illustrates the richness of the cognitive approach to studying design thinking. A limit of these methods is the time and resources needed for a full analysis. This generally inhibits large-scale studies. This issue could be addressed by using other, more direct, measurement methodologies, such as design physiology and design neurocognition, to measure designers’ cognitive activity while designing.
Correspondence analysis of speakers’ interactions and design processes (Milovanovic & Gero Reference Milovanovic, Gero, Eriksson and Paetzold2019).

3 What can we measure with design physiology?
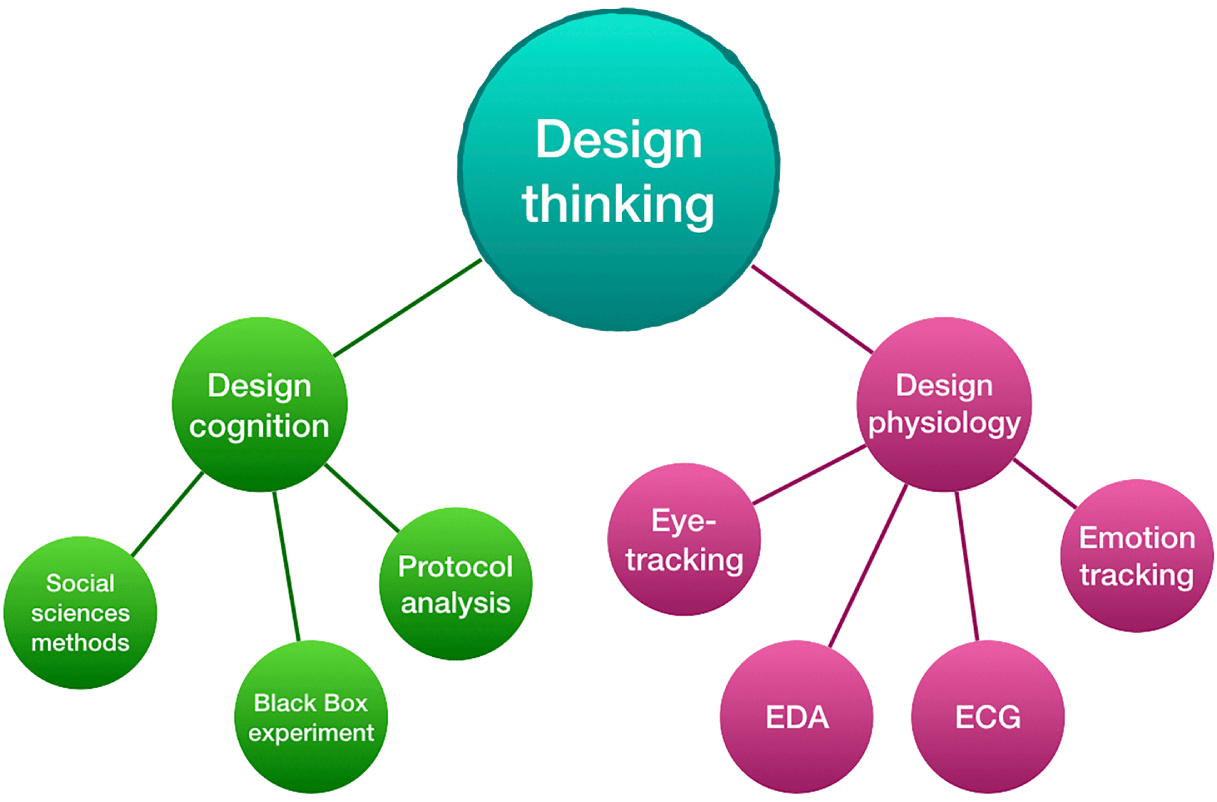
The measurement of design physiology includes several signals that can be accessed from eye tracking, EDA, electrocardiogram (ECG) and emotion tracking (facial feature recognition); see Figure 12. Physiology sensors are able to capture humans’ emotion reactivity in a design context (Balters & Steinert Reference Balters and Steinert2017), and it is a relevant feature to analyze in order to deepen our understanding of design cognition. Here again, we introduce a set of illustrative studies to highlight how techniques and tools to measure physiological markers can provide information about design cognition processes.
Design physiology tools.
3.1 Eye movement: measuring design reasoning, comprehension and analysis
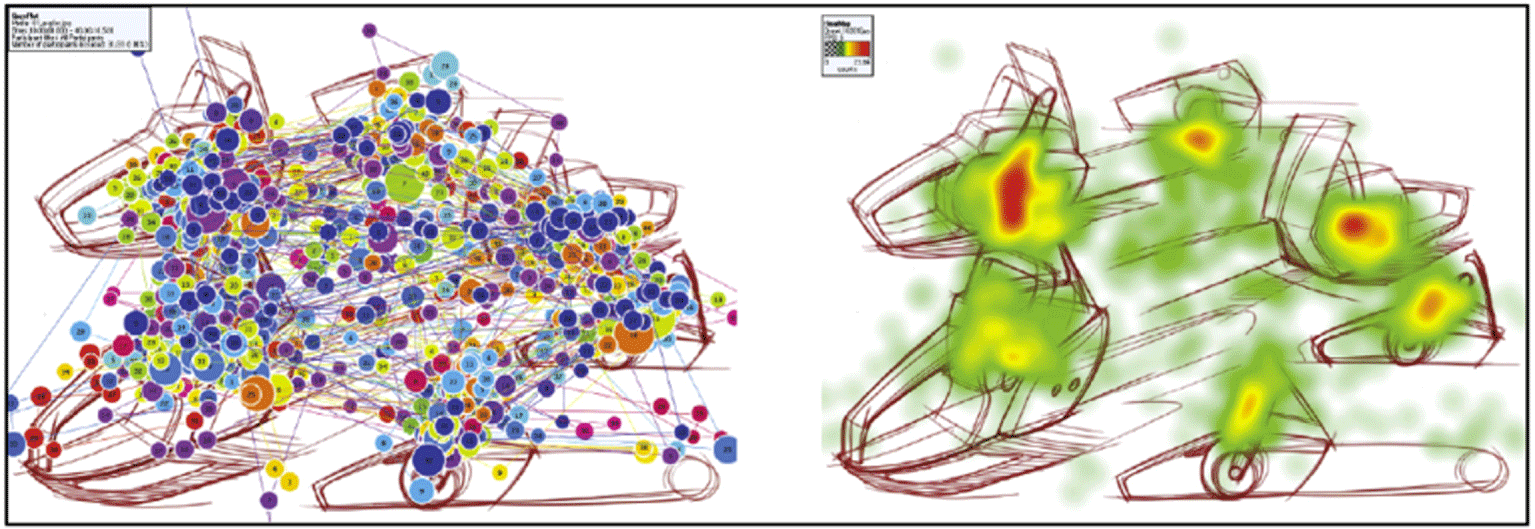
Eye-tracking devices and software capture eye movement and pupil dilation and provide an analysis of gaze points, fixation, saccades and tracking presented as heat maps, fixation sequences and areas of interest in different settings (Figure 13). Eye tracking can be screen-based, mobile see-through glasses or in virtual reality. In design, eye tracking has been used to analyze design reasoning (Yu & Gero Reference Yu, Gero, Rajagopalan and Andamon2018), creativity (Sun et al. Reference Sun, Xiang, Chai, Yang and Zhang2014) and design analysis (Matthiesen et al. Reference Matthiesen, Meboldt, Ruckpaul, Mussgnug, Lindemann, Srinivasan, Yong Se, Sang Won, Clarkson and Cascini2013; Self Reference Self2019). Studying eye movement gives insight into visual reasoning during a design task. Yu & Gero (Reference Yu, Gero, Rajagopalan and Andamon2018) looked at correlations between physiological and cognitive measurements of a design session in architecture. In this case study, architects used a parametric modeler to work on a high-rise building. The study shows that designers tend to focus more on facades than edges or corners of their design.
Example of gaze tracking (left) and heat map (right) (Self Reference Self2019).
Eye-movement patterns can also be mapped onto creative moments. Sun et al. (Reference Sun, Xiang, Chai, Yang and Zhang2014) in an experiment showed a correlation between creative segments and eye movements while sketching. A creative segment is defined by the expression of an idea that offers a new goal, a new function or a new structure and followed by the documentation of that idea through sketches. During creative segments, designers have specific eye-movement characteristics: the fixations are longer and the pupils’ diameters dilate. A longer fixation on the sketches being drawn accounts for more effort on the perception of that new idea.
Matthiesen et al. (Reference Matthiesen, Meboldt, Ruckpaul, Mussgnug, Lindemann, Srinivasan, Yong Se, Sang Won, Clarkson and Cascini2013) used eye tracking to explore designer’s functional analysis of a drilling machine in four different representation types: on screen section, 3D model manipulation, paper section and a physical prototype. To study how designers analyze the functionality of an object, fixations on area of interests are monitored as well as scan paths and heat maps.
Self (Reference Self2019) looked at the impact of domain expertise on design communication with sketches, divided into four groups: idea sketch, study sketch, usability sketch and memory sketch. Industrial designers, engineers and managers were presented with four sketches, one of each type. Eye tracking was monitored in order to study points of interest for each group of experts. Fixation duration was captured to study attention and pupil dilation was analyzed to study cognitive load and comprehension. The study showed that industrial designers responded better to representations’ ambiguity compared to engineers and managers. They had an increased comprehension and a reduced challenge in understanding idea sketch and study sketch. The domain of expertise was found to be implicated in the capacity to comprehend sketches and interpret their meaning.
3.2 EDA: measuring learning in design and engagement in design tasks
The EDA and galvanic skin response (GSR) provide a measure of emotional arousal (joy, fear, stress), cognitive processing and attention (Dawson et al. Reference Dawson, Schell, Fillion, Cacioppo, Tassinary and Berntson2012). The EDA occurs through the activation of sweat glands in the skin. The palmar and plantar surfaces are activated by behavioral triggers more than other parts of body’s thermoregulation. Therefore, variations in EDA measures in those areas suggest different cognitive states: emotional, arousal, information processing and/or attentional.
The EDA accounts for a strong emotion but the correlation with its valence (quality of emotion, positive or negative) is unclear. In their study, Villanueva et al. (Reference Villanueva, Campbell, Raikes, Jones and Putney2018) looked at engineering students’ emotions in different learning situations (passive and active learning) and workshop topics (problem statement, generation of ideas, selection of design solutions, prototyping, presenting design solution). This study showed an increase in EDA for active and collaborative learning compared to passive learning. The EDA measurements were coupled with an emotion self-report to qualify the type of emotions felt by students during each workshop to explore the correlation between EDA and emotional valence.
3.3 Heart Rate Variability with ECG: measuring mental stress and design creativity
The cardiovascular system can be affected by psychological factors such as stress (Berntson, Quigley & Lozano Reference Berntson, Quigley, Lozano, Cacioppo, Tassinary and Berntson2012). Electrocardiography provides measures of electrical potential differences between two electrodes over time. A heart contraction is triggered by the depolarization (electrical impulse) of the sinoatrial node and the atrioventricular node. Those signals are recorded in the ECG, which represents one cardiac cycle.
Heart rate variability is a measure of variations in the interval between two heart beats and can be connected to mental stress (Nguyen & Zeng Reference Nguyen and Zeng2014). The HRV can be analyzed with different methods such as time domain methods and frequency domain methods (Malik et al. Reference Malik, Bigger, Camm, Kleiger, Malliani, Moss and Schwartz1996; Berntson et al. Reference Berntson, Quigley, Lozano, Cacioppo, Tassinary and Berntson2012). Domain frequency methods provide an evaluation of the HRV spectrum over a time period. The spectrum is classified into different bands such as low frequency (LF) and high frequency (HF), which provide a measure of the LF/HF ratio that can be used to analyze mental stress (Nguyen & Zeng Reference Nguyen and Zeng2014; Leinikka et al. Reference Leinikka, Huotilainen, Seitamaa-Hakkarainen and Mäkelä2016).
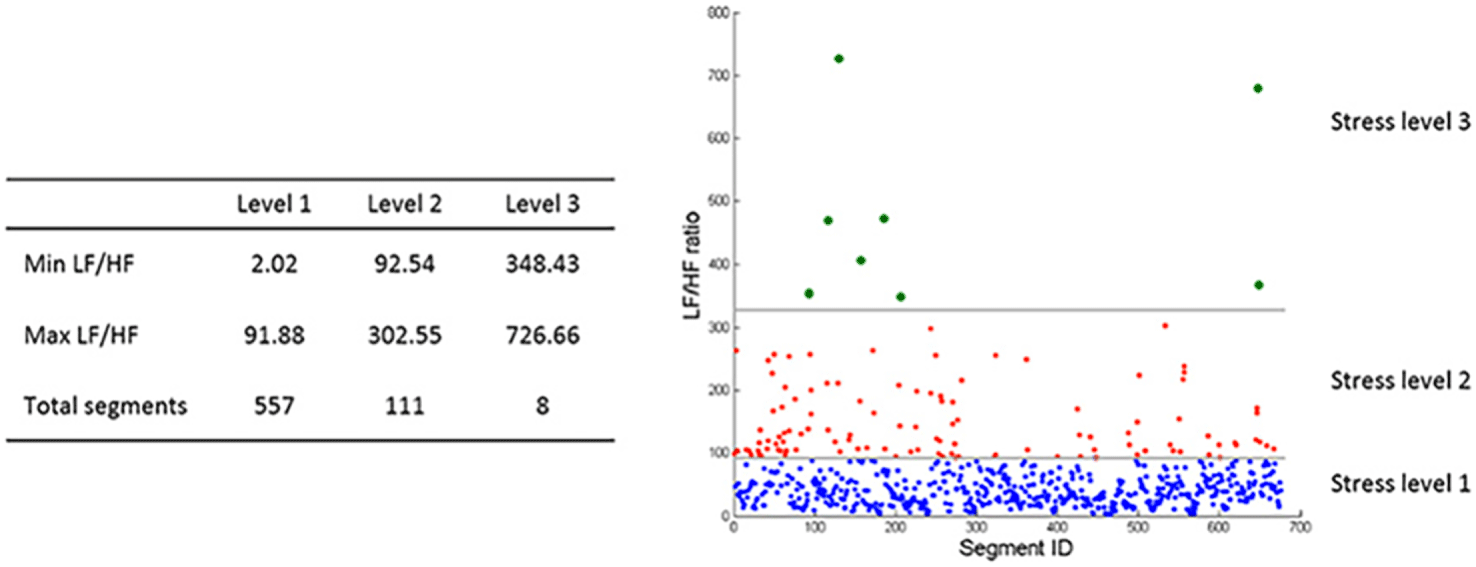
Nguyen & Zeng (Reference Nguyen and Zeng2012) postulate that design creativity can be correlated with mental stress in the shape of an inverse U curve. Mental stress in design can be caused by the recursive nature of the design process and the uncertainty and unpredictability of the design outcome. According to those authors, too low or too high mental stress caused by the design task does not support creativity or performance. In their study, Nguyen & Zeng (Reference Nguyen and Zeng2014) analyzed designers’ mental stress, measured with HRV during an open-ended design problem such as designing a house that can fly. For the design task, designers used a graphic tablet that was recorded as well as the scene. The recorded drawings and annotations served as a basis to segment the video-recorder protocols based on changes in the designer’s actions. Each segment is associated with HRV measured by the LF/HF ratio, and the segments are then clustered in three levels of mental stress from low to high (Figure 14). From the study, it was found that over time, the mental stress did not differ significantly and that designers spend less time in high mental stress than in low and medium mental stress. Depending on the expertise and background knowledge of each designer, they show different patterns of mental stress. Leinikka et al. (Reference Leinikka, Huotilainen, Seitamaa-Hakkarainen and Mäkelä2016) carried out a study to analyze HRV in three different task situations: copying, designing and improvising, and with two different mediums of expression, drawing and modeling with clay. The study showed that the LF/HF HRV ratio was lower for designing and improvising tasks compared to the copying task, especially while drawing. The results from this study support that a larger amount of free cognitive capacity was available while designing and improvising.
Cluster of stress levels of designers during design tasks based on LF/HF ratio (Nguyen & Zeng Reference Nguyen and Zeng2014).

3.4 Tracking emotions while designing
According to Balters & Steinert (Reference Balters and Steinert2017), the key to understanding human behavior is emotions, and they should be incorporated into the design process. Affective and emotion design is a developing field and aims at integrating a motivation to generate an emotion with the design object and at integrating future users’ emotions in the design process (Triberti et al. Reference Triberti, Chirico, La Rocca and Riva2017). Monitoring emotions can also be used to better understand designers’ emotions while designing, and their potential effect on the design process. Ho & Siu (Reference Ho and Siu2012) proposed a model to better comprehend different aspects of emotion design through the definition of two key concepts: emotionalized design and emotional design. The first describes the introduction of the designer’s emotions into the design process and outcomes, and the second implies that designers include in their design a motivation to produce specific emotions on potential users. Here we give examples from studies of the designers’ own emotions during designing.
Studies on emotions often exploit a cognitive linguistic approach to measure emotions, although those methods are limited while considering design since emotional aspects of design are hard to express in lexical terms (Kim et al. Reference Kim, Bouchard, Ryu, Omhover and Aoussat2012). Real-time monitoring of emotions with psycho-physiological methods suits the temporal characteristic of the design activity. As mentioned in Section 3.2 EDA gives a measure of a strong emotion but does not account for its valence (like or dislike feeling). Other techniques use facial coding to measure facial emotional expression. The Facial Action Coding System (FACS) developed by Ekman & Friesen (Reference Ekman and Friesen1976) is a standardized method to manually code video units with a set of described facial emotions. Automatic facial expression analysis has become more reliable and addresses the limits of time-intensive human coding with FACS. Algorithms such as AFFDEX and FACETS can detect and classify facial expressions based on psychological theories and statistical analysis (Stöckli et al. Reference Stöckli, Schulte-Mecklenbeck, Borer and Samson2018). Body postures also inform designers’ emotions as explored by Behoora & Tucker (Reference Behoora and Tucker2015). In their study, they tested several machine learning algorithms to detect eight different postures that relate to design team interactions. The relevance of this approach is to correlate design team interactions, designers’ emotions and team performance.
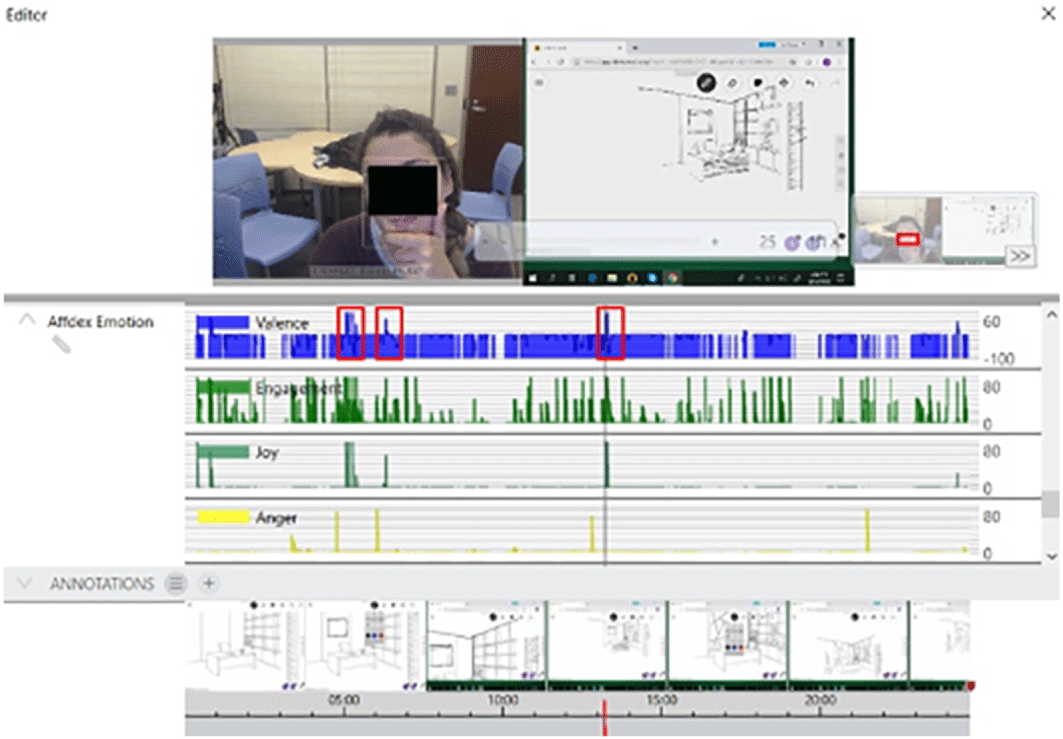
Emotion processing and cognitive processing are known to be related although more research is needed to infer which particular types of cognitive processes influence particular channels of emotions (Ochsner & Gross Reference Ochsner and Gross2005; Kim Reference Kim2011). Therefore, studying emotions while designing with automatic facial expression analysis promises to increase our understanding of design processes. The Imotion software (https://imotions.com/) integrates multiple biosensors such as eye tracking, EDA, electroencephalography (EEG) and facial expression analysis modules, which can be recorded simultaneously. Emotion changes across time can be measured with the AFFDEX module in the Imotion software as illustrated in Figure 15 (Abdellahi Reference Abdellahi2020).
Example of emotion automatic recognition with the AFFDEX module with Imotion (Abdellahi Reference Abdellahi2020).
4 What can we measure with design neurocognition?
Design neurocognition studies aim at exploring connections between cognitive processes and brain activity. Three tools provide data on brain activity (Seitamaa-Hakkarainen et al. Reference Seitamaa-Hakkarainen, Huotilainen, Mäkelä, Groth and Hakkarainen2016; Shealy & Hu Reference Shealy, Hu, Mahalingam, Madras, Shealy and Gil2017); see Figure 16. The EEG measures the electrical activity of the brain with electrodes placed on the surface of the scalp. The EEG detects neural activity and communication via the identification of electrical current (neural connections) that represents brain activity. The temporal resolution of EEG is high, but its spatial resolution is low since it is difficult to separate the electrical activity when sensors are close to each other (surface or deeper in the brain) (Grohs et al. Reference Grohs, Shealy, Maczka, Hu, Panneton and Yang2017). However, recently dense EEG with 256 electrodes has been developed (EGI 2020). Functional magnetic resonance imaging (fMRI) measures brain activity by detecting the blood oxygen level dependent (BOLD) changes connected to neuronal activity, with the assumption that when an area of the brain is used, the blood flow increases in that part of the brain. Compared to EEG, fMRI’s temporal resolution is low but its spatial resolution is very high in all three dimensions. Functional near infrared spectroscopy (fNIRS) measures the BOLD changes by analyzing light reflected from the brain when an infrared beam of light is shone into the brain. The light that reflects back to the sensor is due to a higher presence of blood oxygen in parts of the brain that are activated. The spatial resolution of fNIRS is low compared to fMRI and its temporal resolution is higher than fMRI but considerably lower than EEG. Brodmann areas define specific locations of the brain that are associated with a variety of cognitive functions (Brodmann Reference Brodmann and Garey1909/2006). In general, the frontal lobe is connected to planning, judgement, decision-making, concentration, emotion and motor skills. Goel (Reference Goel2014) argues that distinct design cognitive processes relate to two distinct brain areas’ activation (left and right prefrontal cortex) and that the interactions between both are specific to design cognitive processes (Goel & Grafman Reference Goel and Grafman2000).
Design neurocognition.
Design is a complex, high-order cognitive activity that relates to multiple cognitive processes such as visual processing and reasoning, decision-making, emotions and problem solving, among others. Moreover, design is situated and context related. Therefore, a wide range of brain areas can be activated during a design activity. Defining whether brain activation patterns and cognitive patterns are associated is central to research in design cognition, and methods in cognitive neuroscience can provide new measurements to enhance theories in design cognition (Shealy & Hu Reference Shealy, Hu, Mahalingam, Madras, Shealy and Gil2017) and support methods for design education (Grohs et al. Reference Grohs, Shealy, Maczka, Hu, Panneton and Yang2017).
4.1 EEG: measuring changes in brain behavior for different design tasks and expertise
The EEG method to record brain activity suits design thinking studies because of its high temporal resolution and usability, due to the availability of wireless headsets that allow free movement. Experiments studying design with EEG measurements can integrate sketching (Nguyen & Zeng Reference Nguyen and Zeng2010; Vieira et al. Reference Vieira, Gero, Delmoral, Gattol, Fernanes and Fernandes2019b) and modeling tasks (Kruk et al. Reference Kruk, Aravich, Deaver and deBeus2014; Seitamaa-Hakkarainen et al. Reference Seitamaa-Hakkarainen, Huotilainen, Mäkelä, Groth and Hakkarainen2016), which is not currently possible with fMRI monitoring (Alexiou et al. Reference Alexiou, Zamenopoulos, Johnson and Gilbert2009).
Results from early EEG studies of designers are generally consistent with cognitive findings in design thinking research such as differences between problem-solving and open-ended design tasks (Vieira et al. Reference Vieira, Gero, Delmoral, Gattol, Fernandes, Parente and Fernandes2019a), domain related divergences (Vieira et al. Reference Vieira, Gero, Delmoral, Gattol, Fernanes and Fernandes2019b), the effect of expertise in problem solving (Göker Reference Göker1997) and drawing (Belkofer, Van Hecke & Konopka Reference Belkofer, Van Hecke and Konopka2014) and design reasoning defined by a sequence of design moves (Nguyen & Zeng Reference Nguyen and Zeng2010; Nguyen, Nguyen & Zeng Reference Nguyen, Nguyen and Zeng2015, Reference Nguyen, Nguyen and Zeng2019).
The EEG data is transformed in order to obtain different measures such as the transformed power of the sensor measurement (PoW) (Vieira et al. Reference Vieira, Gero, Delmoral, Gattol, Fernandes, Parente and Fernandes2019a,Reference Vieira, Gero, Delmoral, Gattol, Fernanes and Fernandesb) calculated for each electrode, the task related power or TRP (Vieira et al. Reference Vieira, Gero, Delmoral, Gattol, Fernandes, Parente and Fernandes2019a,Reference Vieira, Gero, Delmoral, Gattol, Fernanes and Fernandesb), which highlights differences in power between a rest or registration state and a specific task, or power spectral density of brain waves (Liu et al. Reference Liu, Nguyen, Zeng and Hamza2016; Nguyen & Zeng Reference Nguyen and Zeng2010). Each of the primary five components of brain wave frequencies – alpha, beta, delta, theta and gamma – is associated with cognitive states. Using a principal component analysis (PCA), Liu et al. (Reference Liu, Nguyen, Zeng and Hamza2016) explored the correlation between brain waves and design activities. According to this study, design activity correlates with the beta band (20–30 Hz) and the gamma band (30–50 Hz) of designers’ brain electrical activity.
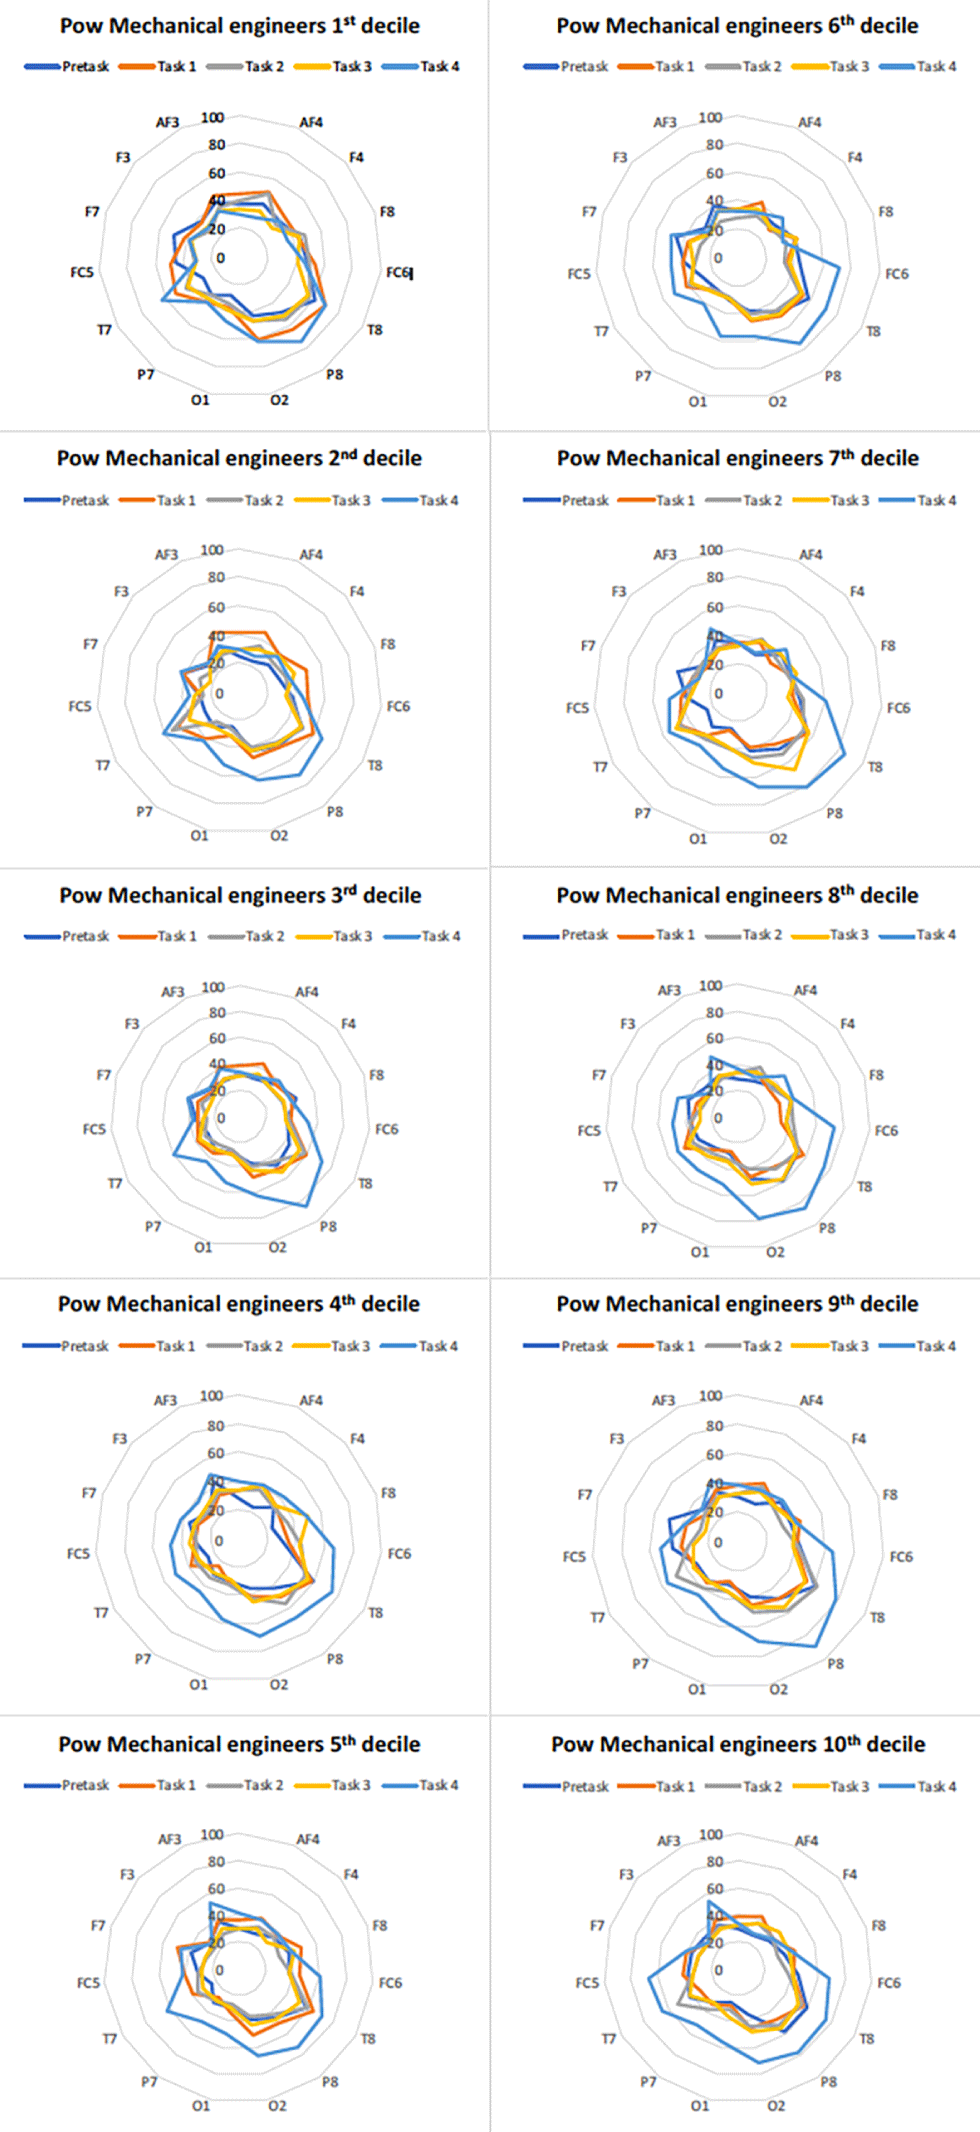
Brodmann areas are connected to cognitive processes. Therefore, mapping Brodmann areas with brain activation during design informs us about cognitive design processes (Vieira et al. Reference Vieira, Gero, Delmoral, Gattol, Fernanes and Fernandes2019b). In their study, Vieira et al. (Reference Vieira, Gero, Delmoral, Gattol, Fernandes, Parente and Fernandes2019a) also explore differences in brain activation of mechanical engineers for two different tasks: problem solving and designing. The brain areas activated differ depending on the task and also on the time during the task. The division of each session in deciles provides a temporal analysis of design neurocognition of mechanical engineers. The changes in brain area activation across time for the open-ended design task are shown in Figure 17.
Variation in task PoW across time for mechanical engineers. The labels around the circle are the channel labels from a standard distribution of sensors, reflected around the center of the brain producing two hemispheres. (Vieira et al. Reference Vieira, Gero, Delmoral, Gattol, Fernanes and Fernandes2019b).
Nguyen & Zeng (Reference Nguyen and Zeng2010) studied the correlation between power spectral density of brain waves and design segments related to the design activity of problem analysis, solution generation, solution evaluation and solution expression (drawing/writing). They developed a measure called transient microstate percentage that relates to the perceived hardness of design problems and that deciphers moments during the design session that are associated with different activities (Nguyen et al. Reference Nguyen, Nguyen and Zeng2015).
4.2 fNIRS: measuring changes in brain behavior for different concept generation techniques
The fNIRS techniques allow designers to perform design tasks while mobile. This makes the method more suitable to study design thinking than fMRI when mobility is involved, while being able to monitor the activity with a higher spatial resolution than EEG. The fNIRS measurement involves a much less expensive device than fMRI. Design neurocognition studies using fNIRS explored concept generation using three different idea generation methods (Shealy et al. Reference Shealy, Hu and Gero2018; Shealy & Gero Reference Shealy and Gero2019) and analyzed differences in design cognition based on expertise (Shealy et al. Reference Shealy, Grohs, Hu, Maczka and Panneton2017).
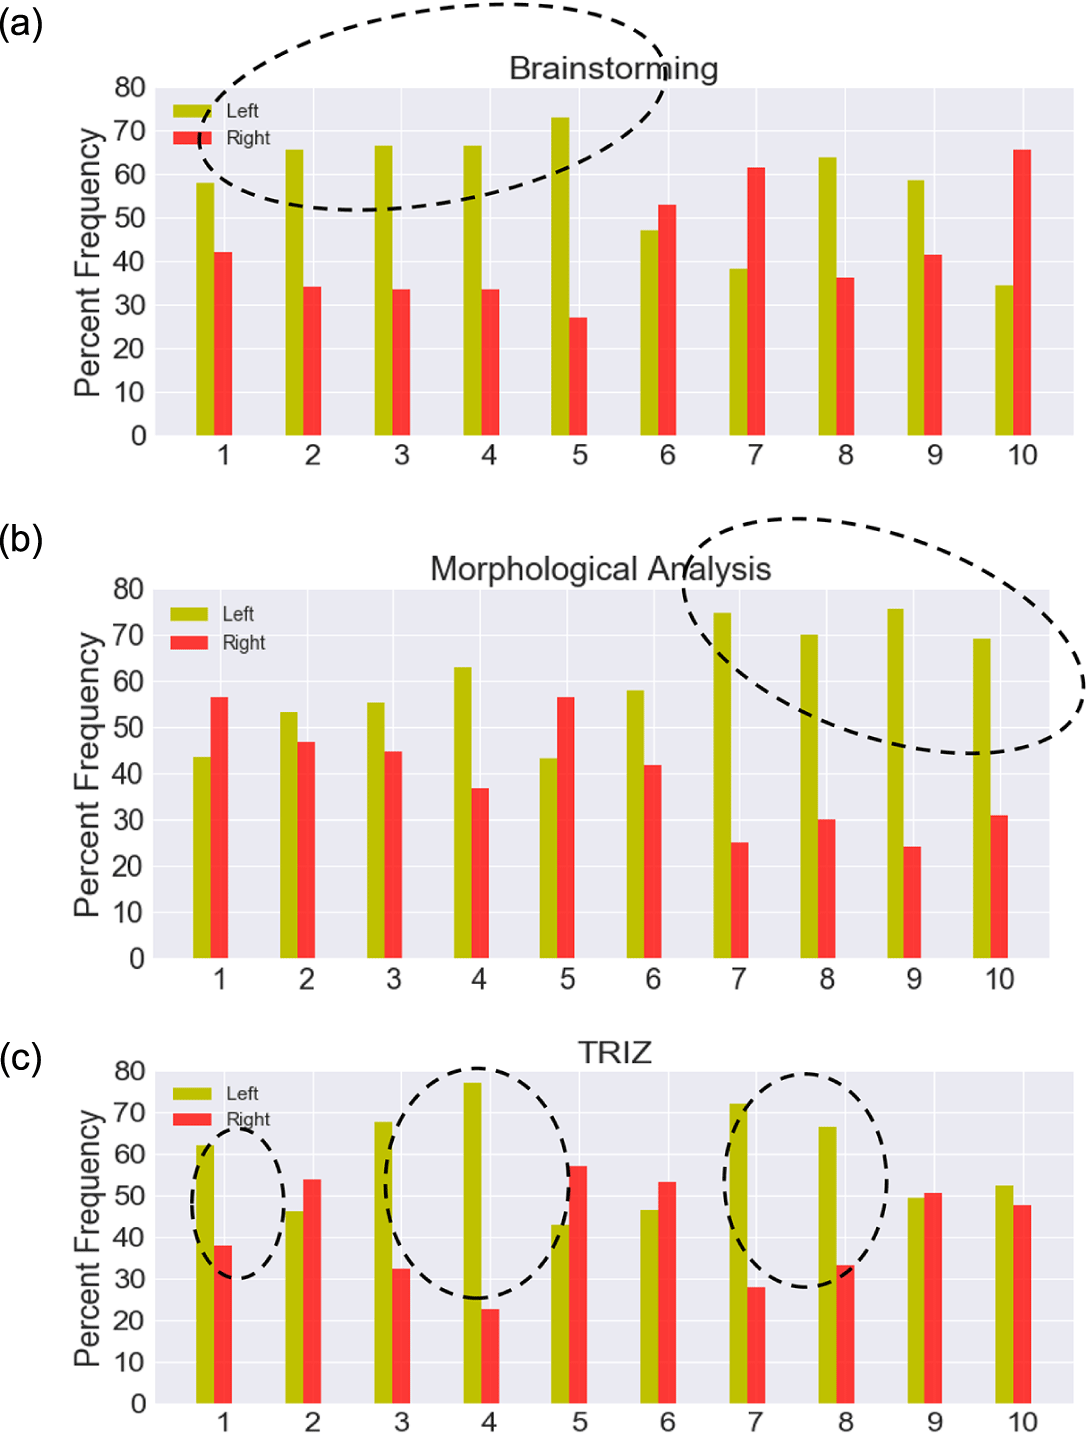
In their study, Shealy & Gero (Reference Shealy and Gero2019) compared brain activation in the prefrontal cortex of graduate engineering students during concept generation using differently structured techniques: TRIZ (structured), morphological analysis (semi-structured) and brainstorming (unstructured). Results show that each technique correlates with different patterns of activation of the left or the right hemisphere over the time of the task (Figure 18). More specifically, different subregions of the prefrontal cortex activate depending on the technique used.
Differences in activation of the prefrontal cortex during concept generation over time (10 deciles) for three different techniques: (a) brainstorming; (b) morphological analysis; (c) TRIZ (Shealy & Gero Reference Shealy and Gero2019).

4.3 fMRI: measuring brain behavior in design reasoning
Experiments in design with fMRI have mainly focused on visual reasoning or analogical reasoning since movements are limited while in the fMRI scanner (Seitamaa-Hakkarainen et al. Reference Seitamaa-Hakkarainen, Huotilainen, Mäkelä, Groth and Hakkarainen2016). Participants are often limited to clicking with a computer mouse without being able to sketch. In the experiment designed by Alexiou et al. (Reference Alexiou, Zamenopoulos, Johnson and Gilbert2009), participants are monitored while performing two different tasks: a problem-solving task and an open-ended design task. The task consisted of arranging a bedroom using a trackball mouse to interact with the projected layout. Differences in cognitive functions needed for the two tasks reflected in the distinct brain network activated for each task. According to Alexiou, Zamenopoulos & Gilbert (Reference Alexiou, Zamenopoulos, Gilbert and Gero2011), design thinking involves two layers of brain activity. The first one serves to construct an emotional and cognitive representation of the task and relates to the activation of the temporal, occipital and parietal areas of the brain. The second serves to monitor conflicts in different brain areas, constructs schemes of action and is related to the activation of the prefrontal cortex.
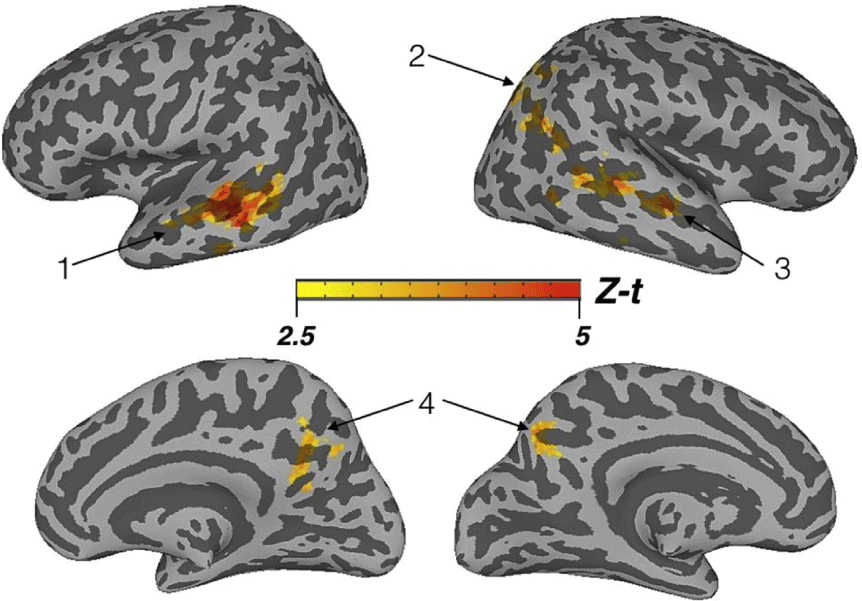
Goucher-Lambert, Moss & Cagan (Reference Goucher-Lambert, Moss and Cagan2019) looked at brain activation with fMRI during design ideation tasks while providing a support for analogical reasoning (words for the control group and images for the experimental group). The authors found distinct brain activation patterns for what they call inspired internal search (stimuli leading to analogies) and unsuccessful internal search (absence of stimuli); see Figure 19. In the first case, designers make connections with retrieved concepts from memory to generate new ideas. In the second case, they tend to search the design problem space for insights, which is pointed in the data by an increase of activity in brain areas related to visual processing.
Mapping on a brain template of brain activation cluster for inspirational stimuli versus control with no stimuli for time locked response model (Goucher-Lambert et al. Reference Goucher-Lambert, Moss and Cagan2019). The images here are used to show what the brain maps look like and are not meant to be read for results.
Some of the limitations in using fMRI to study design neurocognition have been ameliorated with new accessories. For example, recently developed drawing tablets that are not affected by a magnetic field can sit on the designer with visual feedback to a screen above them, and this provides new opportunities for the kinds of experiments that can be carried out.
5 Summary, result correlation and post-processing
5.1 Synthesis of methods to study design thinking characteristics
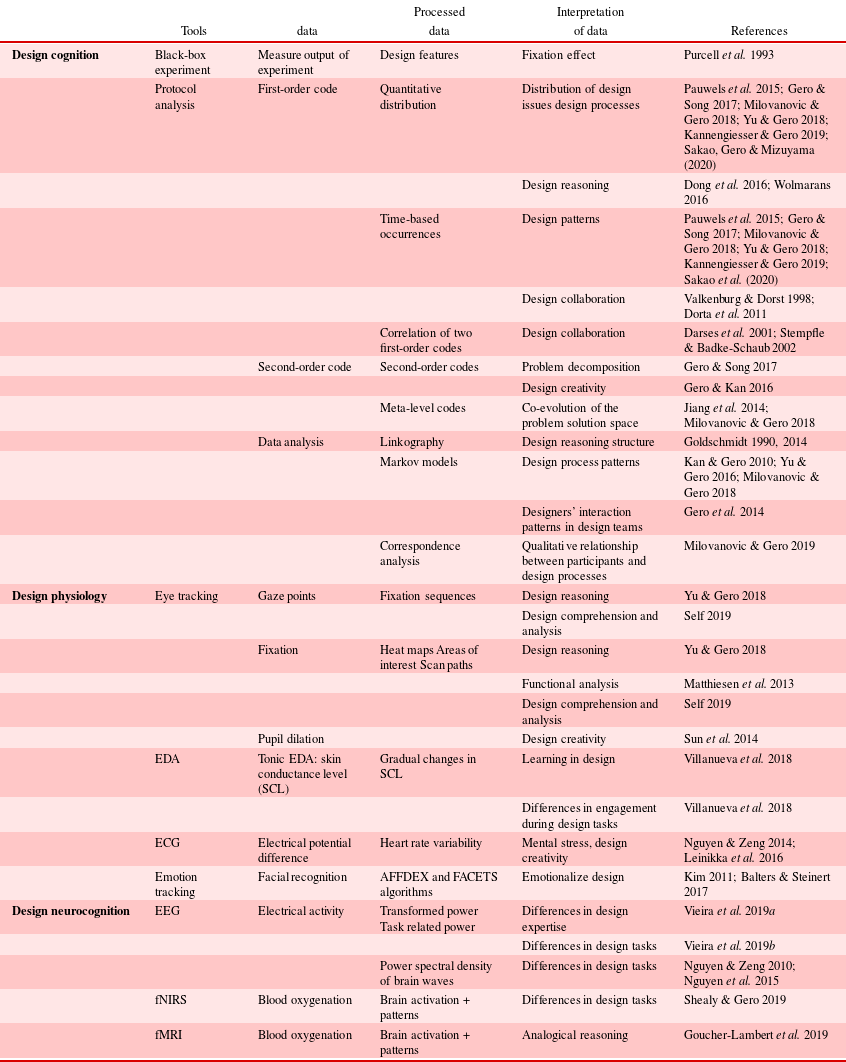
Each of the three paradigmatic approaches offers multiple ways to measure an activity related to design cognition processes such as design reasoning, design collaboration, design creativity, the co-evolution of design problem and solution space, design learning and differences in the design activity depending on the task, the medium used or design expertise (Table 1).
Synthesis of methods to measure design thinking characteristics

5.2 Correlating and post-processing results
Three paradigmatic approaches were delineated in the previous sections, each providing different types of data on design thinking. By triangulating these heterogeneous data sources, we can improve our understanding of design thinking. Results from each type of study can be correlated or post-processed in order to provide new elements to describe designers’ cognitive processes (Figure 20).
Correlation and post-processing of design thinking analysis results.
5.2.1 Correlation: triangulating data
The correlation of results from different paradigms increases the overall understanding of the phenomenon being studied. Merging techniques to measure a task related to design has the potential to inform emotional evaluation of design products, a key aspect of feedback in designing that informs designers (Tomico et al. Reference Tomico, Mizutani, Levy, Takahiro, Cho, Marjanovic, Storga, Pavkovic and Bojcetic2008; Kim et al. Reference Kim, Bouchard, Ryu, Omhover and Aoussat2012), design creativity (Carroll & Latulipe Reference Carroll and Latulipe2012), connection between emotions and CAD software for design tasks (Liu et al. Reference Liu, Ritchie, Lim, Kosmadoudi, Sivanathan and Sung2014), or can provide new methods to segment design protocols (Nguyen et al. Reference Nguyen, Nguyen and Zeng2015, Reference Nguyen, Nguyen and Zeng2019).
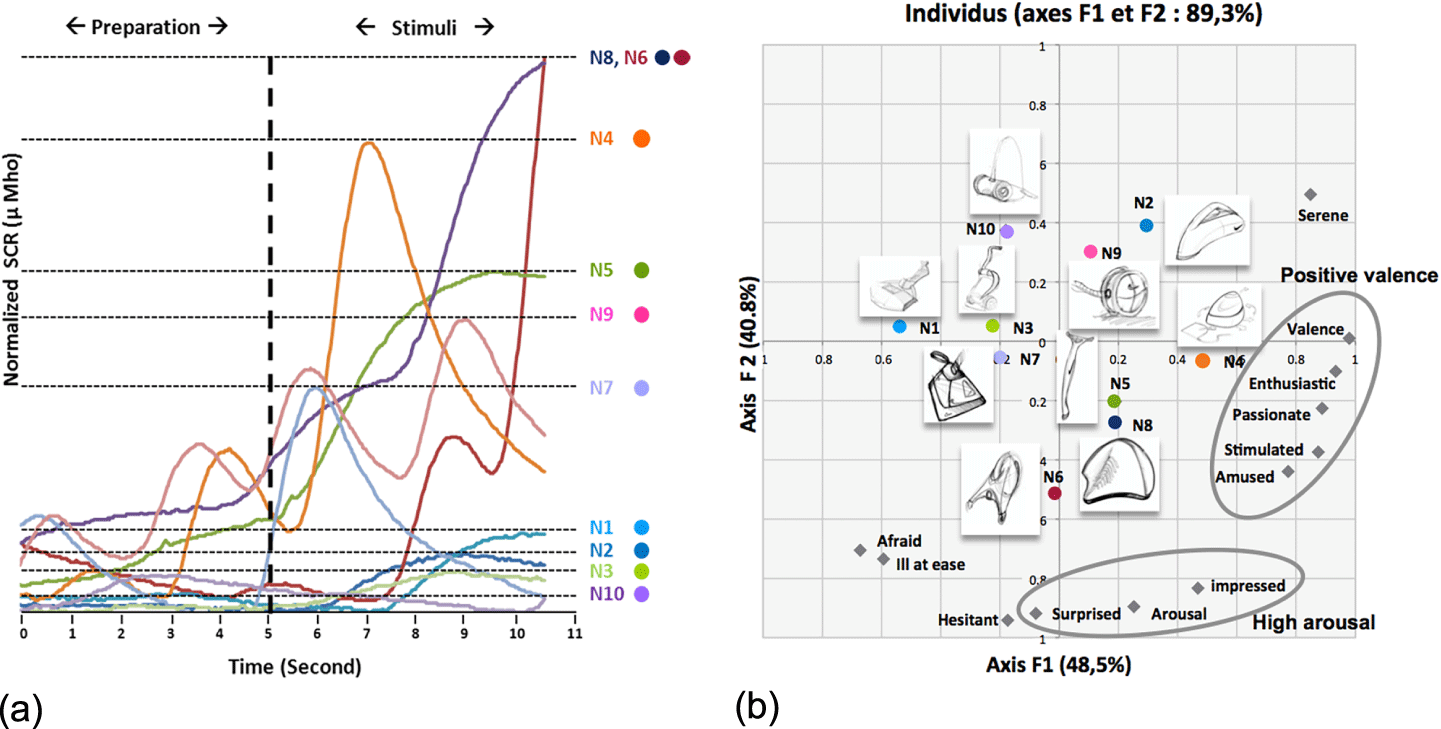
For example, Tomico et al. (Reference Tomico, Mizutani, Levy, Takahiro, Cho, Marjanovic, Storga, Pavkovic and Bojcetic2008) explored the comfortableness of a designed object (pencils) based on the measurement of participants’ emotions while evaluating the object, with a two-point EEG to monitor the fluctuation of alpha waves (design physiology) and a structured interview to gather subjective assessment of the object (design cognition). Similarly, Kim et al. (Reference Kim, Bouchard, Ryu, Omhover and Aoussat2012) explored the correlation of skin conductance response (SCR), self-assessment emotions and semantic descriptors to measure emotions related to the evaluation and perception of an industrial design object (vacuums). The EDA accounts for an emotional arousal but does not give a qualitative measure of the valence of the arousal. In Figure 21(a), results from the SCR of designers reveal objects that induced a high arousal (N8, N6 and N4). Those products are described with a positive valence (N4) and as surprising (N6 and N8) in relation to the others based on the PCA of the self-assessment test (Figure 21(b)).
(a) Results from designers’ SCR variations while observing the products, and (b) the PCA on the self-assessment test for emotions related to the products (Kim et al. Reference Kim, Bouchard, Ryu, Omhover and Aoussat2012).
Liu et al. (Reference Liu, Ritchie, Lim, Kosmadoudi, Sivanathan and Sung2014) developed a model of four emotions (frustration, satisfaction, engagement, challenge) based on GSR, heart rate (HR) and EEG data measured during the experiment. The model they developed allowed the correlation of emotions with specific tasks during the CAD design session. The authors used a fuzzy model approach to define the emotions based on valence measured with EEG signals and arousal based on GSR and HR signals.
Nguyen et al. (Reference Nguyen, Nguyen and Zeng2015, Reference Nguyen, Nguyen and Zeng2019) pointed out the limits of manually segmented design protocols and explored how to use EEG data to perform that task. In their study, they compared manual segmentation to a set of algorithms that automatically segment the EEG dataset. Eight design sessions of up to 2-hour length were used for the analysis. The study showed that transient microstate algorithms worked well to describe the temporal aspects of design moves.
5.2.2 Post-processing: highlighting patterns
In their study, Goucher-Lambert & McComb (Reference Goucher-Lambert and McComb2019) provide an example of post-processing results of an fMRI using Hidden Markov Models to decipher brain activation patterns during ideation tasks. This technique uses machine learning algorithms to automatically infer cognitive states in fMRI datasets. Twelve states were analyzed over the 2-min sequence, where designers produced design solutions while in the MRI. Each of the 12 states represents average modes of brain activation during the solution generation sequence. The study explores differences between high performing designers and low performing designers in terms of the activations of each state over the time period.
6 Future work: exploring design thinking results to develop new models, new tools and new research questions
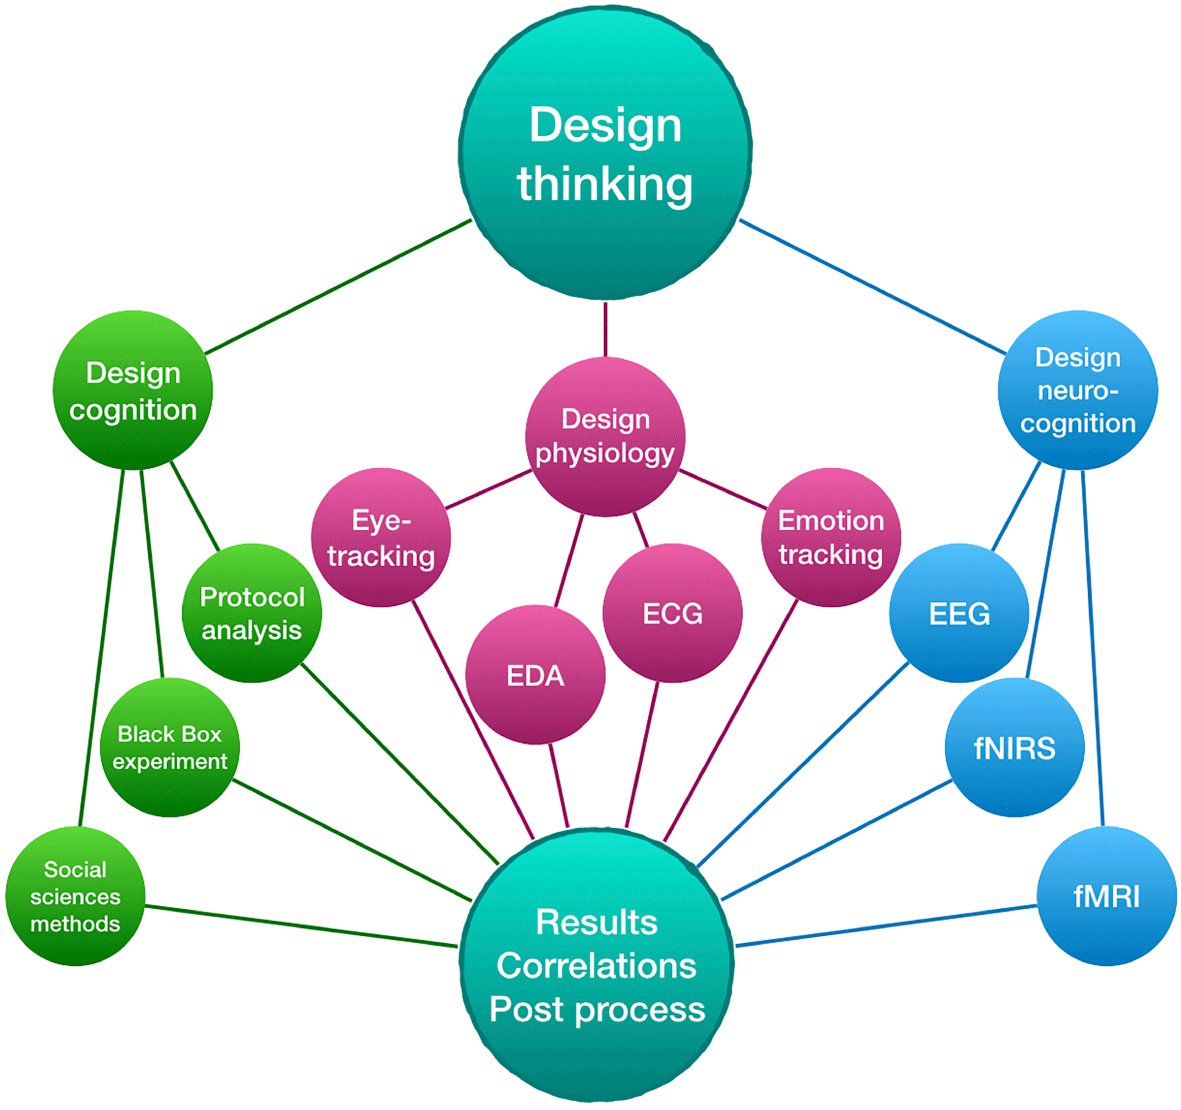
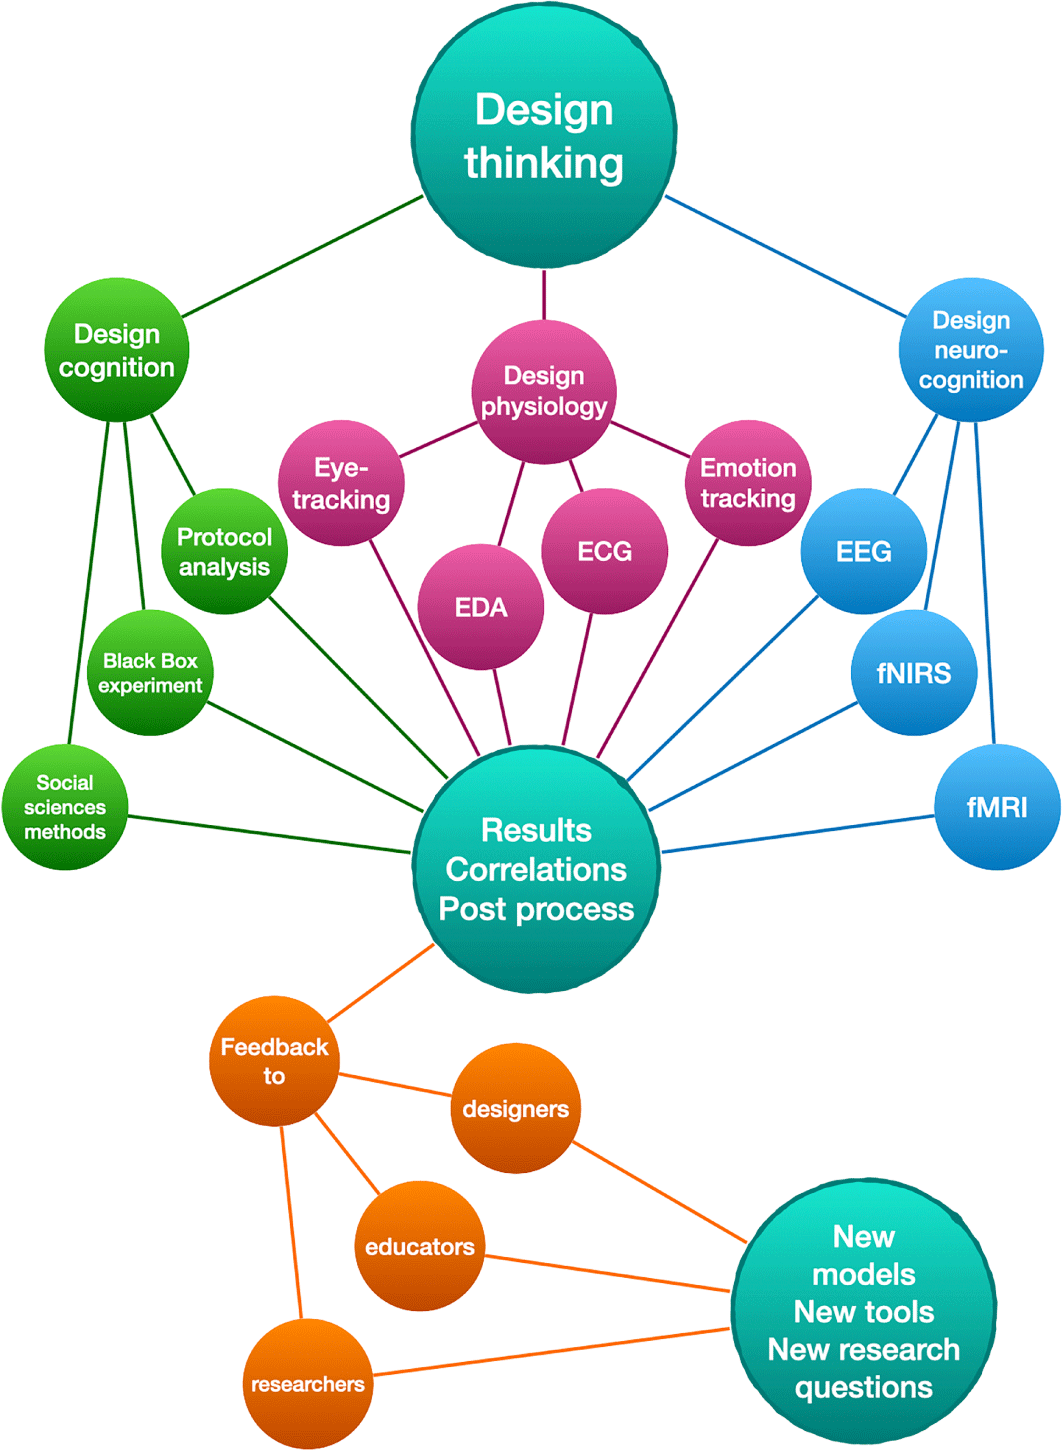
The set of results on design thinking obtained from all three paradigmatic approaches provides a source of feedback to designers, design educators and researchers in design science (Figure 22). This new knowledge has the potential to support the development of new models to describe design thinking, specifically design cognitive processes, not only through the lens of design cognition but also through the integration of all three paradigmatic approaches. New tools can be developed for designers, design educators and design researchers, which leads to the development of new research questions.
Feedback to researchers, educators and designers to develop new models, tools and research questions. This framework shows the relationships between the three measurement paradigms and the results that flow from them.
6.1 Feedback to designers
Designers face challenges in their work as demands for creativity, innovation, collaboration, efficiency and management are high. With a better comprehension of designers’ minds, bodies and brains, there is an opportunity to augment designers’ performance, self-reflection and self-regulation during the design process and facilitate designers’ collaboration and creativity. Feedback of design thinking research results to designers can be classified into three categories: feedback about the activity of designing, feedback about the designers themselves such as emotions that relate to a personal level and feedback about designers’ interactions when collaborating during co-designing.
Studies on design thinking bring a richer and more nuanced understanding about design cognition, which serves as a base for the development of design support and design augmentation tools. Design cognition, design physiology and neurocognition provide information about the designer’s mental and physical states while designing. While designing with an AI design tool, the designer’s physiological and neurocognitive states can give more information to the AI to better adapt to the design situation. Information can be given to the designer in real time about the design state.
At an individual level, we can draw a parallel between biofeedback to measure sports performance and biofeedback to measure a designer’s performance. For example, an Apple Watch can stimulate a person to take a walk to exercise or to sit down in order to rest based on their HR evaluation. The aims of research on biofeedback in real life situations, such as studying athletes’ performances, can be mapped onto a designer’s situation. Biofeedback to designers could be given in real time concerning their design processes to enhance divergent or convergent thinking, lateral or vertical transformation or to provide inspirational stimuli for idea generation (Goucher-Lambert et al. Reference Goucher-Lambert, Moss and Cagan2019; Shealy et al. Reference Shealy, Gero, Milovanovic and Hu2020). Emotional design takes into account designers’ emotions while designing. Designers might not be conscious of their emotions although they affect their decision-making processes while designing. Liu et al. (Reference Liu, Ritchie, Lim, Kosmadoudi, Sivanathan and Sung2014) developed a fuzzy model to monitor designers’ emotions based on neurophysiological signals. A real-time analysis of those signals could provide a direct feedback to designers on their cognitive state to enhance their design process, such as their design creativity.
In design collaboration, a part of the design activity is focused on team-oriented activities such as negotiating, planning and mutual understanding. Monitoring designers’ physiological, neurocognitive and emotion states can provide real-time feedback to the designers to enhance the collaboration. Appraisal, mental effort and stress can be captured through physiological data and be provided as real-time feedback to the design team while designing in order to address collaboration issues.
6.2 Feedback to design researchers
Researchers in design science are confronted by problems related to the feasibility of large-scale studies on design thinking. The cost of time and resources, as well as the access to professional designers, the intrusiveness of tools used to measure designers’ cognitive behaviors are hindrances to the development of wider experiments. Advances in design thinking studies can improve the efficiency of studying the design activity by developing new tools and hybrid methods. Protocol analysis gives a rich source of information of design cognitive processes but has limits. The method is time- and resource-consuming given that to ensure data reliability, each protocol has to be encoded several times by at least two coders. Therefore, studies often include only a small number of participants. Using physiological or neurocognitive data to study design protocols can be a more efficient way to analyze design situations. As explored by Nguyen et al. (Reference Nguyen, Nguyen and Zeng2015, Reference Nguyen, Nguyen and Zeng2019), EEG-based protocol segmentation is relevant to revealing design actions over time.
Another direction to explore concerns the automation of protocol analysis using speech recognition and machine learning using tools from natural language processing. Already coded protocols form a database for pattern classification that can be used by a machine learning algorithm to encode new datasets. To obtain a near- to real-time coding of the data, speech recognition could be added to the automated coding of the protocols.
6.3 Feedback to design educators
Teaching design includes particular challenges due to the nature of design thinking processes that are situated at social and personal levels. In an educational context, knowledge about students’ and tutors’ physiological and neurological behaviors during courses or studios can be used to better inform the effects of the pedagogic strategies used. Learning design in the studio implies social and collaborative learning, where tutors adapt their comments to students based on their perceived abilities. Obtaining data on students’ engagement and emotions during a course points out the effect of teaching methods on students (Villanueva et al. Reference Villanueva, Campbell, Raikes, Jones and Putney2018). The design studio pedagogy is partly implicit, and tutors with professional backgrounds tend to teach without any pedagogical training. Using tools to measure physiological and neurological behaviors from students during such studio sessions can provide feedback on the effect of different pedagogic approaches to teaching design. New data obtained from these sources could provide a new perspective on different pedagogic strategies to teach design in the studio.
6.4 Developing new models, new tools and new research questions
The results from all three paradigmatic approaches to study design thinking provide feedback to researchers, educators and designers. Based on those results, new models of design thinking can be inferred or existing models modified if the results are not covered by existing models. New tools can be developed to support designing, and new research questions may emerge.
6.4.1 New models
Models of designing are grounded in either theory or the design cognition paradigm. A rich set of cognitive processes is identified as characteristics of design thinking such as problem framing, problem structuring, concept generation, visual reasoning and problem reframing to name a few (see Hay et al. Reference Hay, Duffy, McTeague, Pidgeon, Vuletic and Grealy2017a,Reference Hay, Duffy, McTeague, Pidgeon, Vuletic and Grealyb). The exploration of mapping between cognitive processes and physiological and neurological measurements has the potential to generate objective knowledge about the designing mind (Cacioppo, Tassinary & Berntson Reference Cacioppo, Tassinary and Berntson2012). It may be possible to determine whether designing is a set of unique mental activities or whether it is a unique combination of generic mental activities. New models may be required depending on the answer to such questions.
6.4.2 New tools
Results from physiological and neurophysiological studies on design activities depict design as an embodied activity (designing with brain, body and mind). Based on those results, tools to support designers can emerge. A correlation between design cognitive patterns and design neurocognitive patterns can serve as a starting point to develop brain–computer interfaces (BCI) for designers’ tools and software. The GUIs in current designing tools are limited, and BCI can provide an interface that may suit some designers’ tasks better (Esfahani & Sundararajan Reference Esfahani and Sundararajan2012). For instance, designers using a BCI are already able to manipulate 3D objects (zoom in and out, rotate and scale) by thought alone; gaze monitoring with eye tracking can serve as a pointer and used to select objects, and gestures can be used to draw and model in VR or AR with devices.
Novel brain–design cognition interfaces have become possible through real-time feedback of brain signals to enhance a designer’s self-regulation capability, producing improvements in idea generation behaviors (Shealy et al. Reference Shealy, Gero, Milovanovic and Hu2020). New user interfaces to communicate with design software are not the only perspective that opens up with new knowledge. Existing tools, using co-creative agents to support design creativity (Davis et al. Reference Davis, Popova, Sysoev, Hsiao, Zhang, Magerko, Colton, Ventura, Lavrač and Cook2014), can be enhanced based on designers’ physiological and neurophysiological measurements. Collaborative AI design tools offer potential in enhancing designers’ performances, efficiency and creativity.
New tools from data science can be used to support researchers’ and educators’ data analysis (see Section 6.2) and enhance students’ learning experiences (see Section 6.3).
6.4.3 New research questions
Over the past 50 years, results from design thinking studies through the cognitive paradigm approach defined designing as an intentional activity, which evolves through time, based in its social situation that includes personal factors (designers’ experience and design learning), where the problem has to be defined, and is dependent on the design path taken. With a triangulation of the methods that have been presented, new research questions regarding the design activity itself emerge. We pointed out cognitive characteristics of designing, and we can question whether designing implies a unique association of common cognitive brain activation or a specific brain activation. Is there something fundamental in brain activations that defines designing? Cognitive methods to study design cognitive processes analyze design at the cognitive scale. Physiological and neurocognitive tools can measure design thinking at the microscale and provide opportunities to explore whether there are activities specific to designing that exists at this smaller scale.
In the previous section, we identified the emergence of new tools to accompany the design process. By acquiring increased knowledge of design thinking, we can develop more refined computational models of design activity based not only on design cognition but also on design physiology and design neurocognition. The integration of active computational agents into the design process provides a new kind of AI design tool. The BCI and ‘thinking caps’ are another direction to explore in terms of tool development based on results from design neurocognition studies. Design software (CAD, BIM) and design software interfaces (Graphical User Interface, Tangible User Interface) affect the design activity, which raises another question: What will be the effects of AI design tools and BCI on the design process and outcomes?
7 Limitations
The framework we presented covers past and ongoing design thinking research agendas and points to future areas of work. A limitation of this framework is that the measurements synthesized might not be sufficient to capture the complexity and diversity of designers’ thinking processes while designing. Moreover, there are inherent limits of experiments using the methodologies present to study design cognition, design physiology and design neurocognition. Laboratory measurements provide a better control over the experiment but suffer from a lack of realism available through in situ studies. To measure physiology and brain behavior, designers have to wear extra equipment, even during in situ experiments, that can affect their behaviors. Another common issue that we mentioned before is the scale of studies, often quite small due to the cost of collecting data, which limits the inference of any generalizations. In Section 6.2, on the feedback to design researchers, we laid down future possibilities to address study scales and data collection limits.
8 Conclusion
In this paper, we have presented a framework for the measurement of design thinking based on three measurement paradigms: design cognition, design physiology and design neurocognition. Within each paradigm, we have outlined current methodological approaches that are used to study design thinking. Studying design thinking by measuring design cognition is well established and has a history of development over many decades. Studying design thinking by measuring design physiology and design neurocognition is still a novel approach that is gaining acceptance. These two approaches have become increasingly feasible as the cost of the measurement devices has dropped and the processing software has become more developed.
Utilizing the three paradigmatic approaches together provides a more articulated framework to explore the underlying cognitive, physiological and neurological patterns associated with design thinking. Through non-exhaustive illustrative research studies, we pointed out which characteristic of the design activity can be measured using techniques and tools from the cognitive, physiological or neurocognitive paradigm approach.
Results obtained from those three approaches to studying design thinking bring new challenges to design research. New models, new tools and new research questions emerge based on those results. By triangulating the data obtained, we are able to question existing design models, adapt those models and generate new ones describing design as an embodied activity that considers the designer’s mind, body and brain. New tools will be developed combining results from design studies and technologies and techniques from other research fields, such as brain–computer interfaces and brain–cognition interfaces along with AI and machine learning. Research questions stemming from an integrated approach to studying design thinking explore potential fundamental patterns of brain activation or physiological activity related to designing, as well as the effect of new tools to accompany the design activity and the relevance of new models to describe design thinking.
Acknowledgments
Any opinions, findings, and conclusions or recommendations expressed in this material are those of the authors and do not necessarily reflect the views of the National Science Foundation.
Financial support
The support of the US National Science Foundation, NSF Grant Nos. CMMI-1161715, CMMI-1400466, CMMI-1762415, EEC-1463873 and EEC-1929896 and the US Defense Advanced Research Projects Agency, DARPA Grant No. BAA 07-21 is acknowledged.


 Open access