


1. Introduction
Companies should consider the social consequences of their products before launching them, especially when a product is anticipated to disrupt people’s lives. In the long term, the product could have significant effects on well-being, social relationships, or even health. It should therefore not be taken lightly. Responsible innovation involves anticipating the impacts of a product early on to avoid negative consequences on people and society (De Saille, Reference De Saille2015). However, forecasting social phenomena on large time scales is a challenge due to the high level of uncertainty. For example, the smartphone caused long-term social impacts, such as attention deterioration among young people (van Velthoven, Powell, & Powell, Reference van Velthoven, Powell and Powell2018) or addiction problems. Early anticipation during development could have prevented or lessened this issue. However, it is likely that designers lack the will, reliable methods and expertise to anticipate these impacts. This leads to the question of how to characterize the possible social impacts of a disruptive product that does not yet exist on the market. The work presented in this article specifically focused on social impacts as defined by Burdge (Reference Burdge2015): “The influence of a product on the day-to-day quality of life of persons.” These impacts encompass various aspects such as employment, family relationships, individual health status, well-being, conflicts and crimes (Rainock et al., Reference Rainock, Everett, Pack, Dahlin and Mattson2018). However, for the purpose of focusing on long-term impacts, considerations related to user experience or ergonomics have been excluded, as they are not applicable to products that have not yet been defined and have more immediate effects on users.
Two main research fields that focus on evaluating future technologies have been identified: engineering design, at the product level and impact assessment, at societal scales. In the field of design science, there are evaluation methods that can predict the social impact of a new product. A simplified design process can be divided into three main steps: discover, design and evaluate (e.g. design thinking (Brown, Reference Brown2008) and V-cycle (ISO, 2018). The purpose of the evaluate step is to measure the performance of the product. It can be carried out by a company to test performance, usability, acceptability, market acceptance in advance or to determine whether a specification or regulation is met (quality requirements or standards imposed by governments as part of approval, for example). There are various methods used in the industry to evaluate the product and ensure that it will have the intended effect when it is launched. One category is user acceptance testing (UAT). Its purpose is to validate the relevance of the product to the user. For example, verify that a new product effectively improves the practice of an activity. Evaluation methods involving users are common and assess the effective use of the product, understanding and contribution. Because, according to Jørgensen (Reference Jørgensen1990), “Users’ knowledge is different from designers’ knowledge.” Therefore, it is important to go through this step which allows limiting the different biases and fixations of designers towards the actual usage of the product. Evaluating a new product is a process that takes place throughout its design and typically involves five stages: concept testing, prototype testing, pretest market, test market and launch (Ozer, Reference Ozer1999; Mahajan & Wind, Reference Mahajan and Wind1988). Some examples of methods are analogies (Davis, Reference Davis1985; Startup Cemetery, 2022), focus groups (McQuarrie & McIntyre, Reference McQuarrie and McIntyre1986), heuristic evaluation (Nielsen & Molich, Reference Nielsen and Molich1990), usability tests (Dumas, Dumas, & Redish, Reference Dumas, Dumas and Redish1999), multiattribute models (Green & Srinivasan, Reference Green and Srinivasan1990), purchase intention, A/B testing and experts opinion. Most of the methods mentioned assume that test participants are end-users, meaning that the group of volunteers for testing is considered representative of actual users. This bias is recognized and often limited during user testing by specific techniques. However, when the launch window for a product is far from the time of testing (few decades), changes in habits, culture and mindset become both significant and unpredictable. At this scale, it is no longer possible to have access to participants representative of end-users. Even if some design approaches, such as radical innovation design (Yannou, Reference Yannou2015; Yannou, Cluzel, & Farel, Reference Yannou, Cluzel and Farel2018), try to consider this aspect, product evaluation remains unsuitable for characterizing or assessing long-term social impacts.
On a larger scale, impact assessment methods aim to assess the overall effects of large-scale interventions such as policy measures or the deployment of new technologies (Becker, Reference Becker2001). They are often used in policymaking to assess impacts on themes such as environment, people, communities, social well-being, culture, economy or health. Vanclay (Reference Vanclay2003) identifies two objectives for impact assessment: To improve decision-making about interventions and their implementation and implement measures that minimize damage and maximize benefits. The success of an impact assessment study lies in its analysis of multiple alternatives and in its ability to propose recommendations that can be sustained to limit or avoid negative impacts and maximize positive effects. For example, like the Intergovernmental Panel on Climate Change (IPCC) reports. Thus, one of its most common uses is within the Environmental Impact Assessment (EIA) (Morgan, Reference Morgan2012), which is currently required in most countries around the world to validate bills or policies (the term has been internationally recognized since 1992 – United Nations, 1992). Regarding social aspects, the Social Impact Assessment (SIA) focuses on individuals, organizations and social systems (Becker, Reference Becker2001). Its main objective is to achieve a more sustainable and equitable environment. The SIA community considers all questions that affect individuals, directly or indirectly, relevant for evaluating social impact. SIA methods help identify the future social consequences of an intervention to achieve a more sustainable and equitable environment. Kreissl, Fritz, & Ostermeier (Reference Kreissl, Fritz and Ostermeier2015) propose a broader variant of the SIA by shifting from social aspects to societal aspects. For him, the term “societal” encompasses the analysis of everything that affects human, natural or artificial systems. Thus, the Societal Impact Assessment considers the potential of a technology to modify society (for example, the introduction of new energy sources). Another approach is Technology Assessment (TA), which examines the short- and long-term consequences of deploying a new technology (Banta, Reference Banta2009; Coates, Reference Coates1974). TA can be seen as a decision-making tool. The concept is based on the belief that all technological progress has ethical implications (Lecomte, Reference Lecomte and Jean2022). TA is interested in the dissemination of technologies, the factors leading to their acceptance and their role in society (Banta, Reference Banta2009). Estimating impacts is by nature speculative, but TA aims to control it through data, scientific knowledge and experience (Rip, Reference Rip2015). Therefore, Technology Assessment evaluates the effects, consequences and risks of a technology, but also has a predictive function that is useful for strategic planning. Unlike product evaluation, all these methods allow for the identification and consideration of a wide variety of impacts over varying time scales. However, they are most relevant when planned actions are well defined or even already engaged, and when the targeted population is known. These observations lead to the “Collingridge dilemma” (Worthington, Reference Worthington1982) which states that at the beginning of the development of a technology, its nature and how it will be used are still malleable, so its impacts cannot yet be precisely determined. When the consequences become apparent, the technology is well-established and becomes too difficult to change. Two commonly used techniques to limit this problem are technomoral scenarios and sociotechnical experiments. Technomoral scenarios involve imagining and exploring potential future scenarios in which the technology is widely used, whereas sociotechnical experiments involve creating a prototype of the technology and testing it in a real-world setting to observe its social impacts. Kudina & Verbeek (Reference Kudina and Verbeek2019) use the example of Google Glass to illustrate this dilemma and these techniques. However, as with product evaluation methods, in the context of a product that will be deployed in a very long time, these techniques remain limited because they cannot consider an extreme degree of uncertainty.
Futures studies is an approach to exploring how we will live in the future. It is also known as futures research, futurism, strategic foresight, futuristics, futures thinking, futuring or futurology. The goal of this field is to understand how the future may unfold by examining various factors, including technological advancements, social changes, economic developments, environmental shifts and political decisions. By analyzing possible future scenarios and trends, one can make more informed decisions in the present, anticipate potential challenges and opportunities and plan for a better future. Its methodology is systematic, interdisciplinary and holistic, taking into consideration complex systems. Within a company, the study of the future is used to identify potential opportunities or threats. This is referred to as strategic foresight (Godet & Durance, Reference Godet and Durance2011). Although it has similarities with impact assessment and product evaluation, it is not directly related to either field. This is because the focus is on exploring the future in general, rather than evaluating the impact of a specific product. At best, it can identify trends and issues that could shape the market in which the product could be sold.
Amara (Reference Amara1991), in The futures field: Searching for definitions and boundaries defines the concept of future with three characteristics: (i) The future is not predetermined. (ii) The future is not predictable, meaning that even if it were predetermined, it would be impossible to obtain enough information to describe it. (iii) What will happen in the future can be influenced by our actions today. Many future study experts and researchers (Bishop & Hines, Reference Bishop and Hines2012; Dator, Reference Dator and Bainbridge2011; Voros, Reference Voros2017; Boulding, Reference Boulding1990; Slaughter, Reference Slaughter2003; Hurley et al., Reference Hurley, Masini, Boulding, Eisler, Premchander, McCorduck, Kelly, Bateman, Sahtouris, Smith, Patindol, Jarva, Milojević and Groff2008) insist that the future must be pluralized into alternative futures. The main reason being that attempts to predict the future are generally false, and reality often lies in a combination of several alternatives. Most models are based on five classes of futures (Casti, Reference Casti2013 and Figure 1):
-
• Possible futures. All imaginable futures, including those that may involve currently unknown knowledge or technology.
-
• Plausible futures. Feasible futures that are not excluded by our current knowledge.
-
• Probable futures. Likely outcomes align with current trends but acknowledging that trends can shift.
-
• Preferable futures. Normative futures desired by individuals or organizations can influence present actions and knowledge to increase their plausibility or probability (e.g. climate change advocacy groups).
-
• Wild cards. Low-probability, high-impact events that occur too quickly for social systems to respond effectively. Examples include the September 11 attacks and the damage caused by Hurricane Katrina (Hiltunen, Reference Hiltunen2006 and Figure 1).
The futures cone adapted from Hancock & Bezold (Reference Hancock and Bezold1994) and Gall, Vallet, & Yannou (Reference Gall, Vallet and Yannou2022). Also known as the three Ps and a W model (Possible, Plausible, Probable and Wild Card).

Future studies seem to provide excellent techniques for contextualizing scenarios of the future. Various methods are used to give substance, realism and credibility to these scenarios (Spaniol & Rowland, Reference Spaniol and Rowland2019; Urry, Reference Urry2016; Godet & Durance, Reference Godet and Durance2011; Rhydderch, Reference Rhydderch2017). For example, ethnographic experiential future immerses participants in imaginary futuristic scenarios and tries to improve them by evaluating the emotions generated in participants. The science-fiction prototyping proposes using science-fiction principles to support exploration. Causal layered analysis (CLA) can be mentioned, which adopts a multilevel thinking process to ensure the coherence of imagined futures, or the trend analysis, which exploits trends to generate plausible or probable futures. Many other methods are used to study the future. These include – among many others – morphological analysis (Ritchey, Reference Ritchey2013; Johansen, Reference Johansen2018; Lamblin, Reference Lamblin2018), CLA (Inayatullah, Reference Inayatullah1998; Inayatullah, Reference Inayatullah2013; Inayatullah, Reference Inayatullah2017 2019; Gall et al., Reference Gall, Vallet and Yannou2022), Backcasting (Robinson, Reference Robinson1990), cross-impact analysis (Gordon, Reference Gordon and Project1994), technology roadmapping (Phaal, Farrukh, & Probert, Reference Phaal, Farrukh and Probert2004), technology forecasting (Quinn, Reference Quinn1967), or aspirational futures (Grandjean, Reference Grandjean2017). Ultimately, while future studies may not be directly suited to studying the probable long-term social impacts of a disruptive product, its methods and principles could be adapted to better contextualize the product and frame its impacts more effectively. Vettorello, Eisenbart, & Ranscombe (Reference Vettorello, Eisenbart and Ranscombe2022) tried to implement this way of thinking for decision-making in a promising way.
As observed, current evaluation techniques are insufficient for predicting the long-term social effects of a product that has not yet been deployed. Product evaluation is used to forecast the performance of a product, particularly its impact on users, and is commonly used for products set to be launched soon. On the other hand, impact assessment evaluates the effect of a law, environmental measure, or new technology on society on a larger scale. However, the methods used for impact assessment are often not tailored to individual products and are limited to known populations, which restricts their usefulness to relatively short time frames. Future studies and strategic foresight provide techniques and methods for exploring possible, plausible and probable futures in the long run. While the methods are not specifically designed for analyzing the social impact of a particular product, they can provide ways to address the temporal issues raised by product evaluation and impact assessment. Therefore, this article aims to explore the possibility of anticipating the social impacts of a disruptive product that does not yet exist on the market with a novel approach. The assumption is that using principles of future studies can create credible usage scenarios for the product. These scenarios could then be used as a context for questioning social sciences experts. In other words, the main hypothesis is that sociology experts can anticipate future social impacts by projecting themselves into the future, drawing on their knowledge and expertise.
To anchor this work to a concrete case study, the work presented here focuses on autonomous vehicles (AVs). An AV is a vehicle evolving on the road that can carry passengers and drive itself without any human intervention (inspired by “What is an Autonomous Vehicle?”, 2021). As this definition remains very generic, the authors added four conditions: (1) The vehicle is designed to transport passengers in priority. It can transport objects, but this should not be its primary function. (2) The vehicle has 1 to 9 seats (category M1 from United Nations Economic Commission for Europe, 2017). (3) The vehicle has an automation level of 4 or more on the SAE scale (SAE International, 2021). (4) The vehicle operates in a country with a high human development index (≥ 0.700) (Gibbs, Reference Gibbs2022; UNDP, 2020). Sources from a major automotive group estimate a 20-year timeline for the transition from combustion engines to electric vehicles. The shift to AVs may extend beyond this, possibly until 2050. This probable timeline considers technological advancements and legislation (ERTRAC, 2019; Gartner, 2020). There are already many studies that quantitatively analyze the effects of AVs on society, the economy and the environment. These studies examine topics such as traffic congestion, parking availability, vehicle speed or energy consumption (e.g., Narayanan, Chaniotakis, & Antoniou, Reference Narayanan, Chaniotakis and Antoniou2020; Soteropoulos, Berger, & Ciari, Reference Soteropoulos, Berger and Ciari2019) using numerical modeling. However, unlike these quantitative studies, the limitations of current research methods, as discussed in the previous paragraphs, have led to a lack of investigation into the social impacts of AVs. This is why the focus of this paper is on social impacts. Additionally, as Townsend (Reference Townsend2020) points out in Ghost Road, existing quantitative studies may look good on paper, but they may not hold up in the real world. Thus, the specific question:
How to construct a foundational framework to anticipate the social impacts of disruptive products that do not yet exist?
This work is an attempt to provide an innovative impact model called RUI that compiles and aggregates expert knowledge to anticipate the social impacts of AVs. Since it is impossible to evaluate the relevance of the impacts proposed by the model (open loop), this work focuses on constructing a robust model based on solid rationale and principles. At this early stage, the aim is not to test the model’s contribution in practical scenarios with designers but to create a coherent and justified framework. This model should then serve as a general foundation for building industrial tools specifically adapted for designers.
Section 2 explains the methodology used to build the RUI impact model. The steps taken to ensure the accuracy and robustness of the model are described. In Section 3, a detailed structure of the model is presented, providing an overview of its components and the relationships between them. The rationale behind the design choices is also explained. Section 4 details the addition of data, including expert input. The specific data sources utilized, the process of validating and refining the data, as well as the significance of expert input in enhancing the accuracy and relevance of the model, are covered. In Section 5, the accuracy of the model is discussed. In Section 6, the discussion and analysis of the results focus on the nature of the data added and the ability of the model to gather various impacts from experts. Finally, in Section 7, the potential of the RUI model to anticipate the social impacts of AVs and other disruptive products that do not yet exist is concluded. The key findings of the study are summarized, and practical future applications of the RUI model are highlighted.
2. Methodology
The following methodology is designed to create a social impact model that can serve as a base for a future industrial tool for designers. The objective is to suggest an approach for gathering knowledge on the potential social impacts of a yet-to-be-created disruptive product, with the AV case study as an example. The primary assumption is that, given proper stimulation (like specific AV usages, for instance, the ability to sleep while in transit and alone), social science experts can imagine possible impacts. The second hypothesis is that these impacts can then be collected and organized in databases for later use.
The RUI model was developed in two main stages. First, a preliminary version was created using some initial knowledge and research. Then, it was submitted to experts for feedback and further improvement.
In combination with the two previous hypotheses, various scientific literature was consulted to carefully craft a preliminary model composed of three main objects: The representations, the usages and the impacts (more detailed in the following sections).
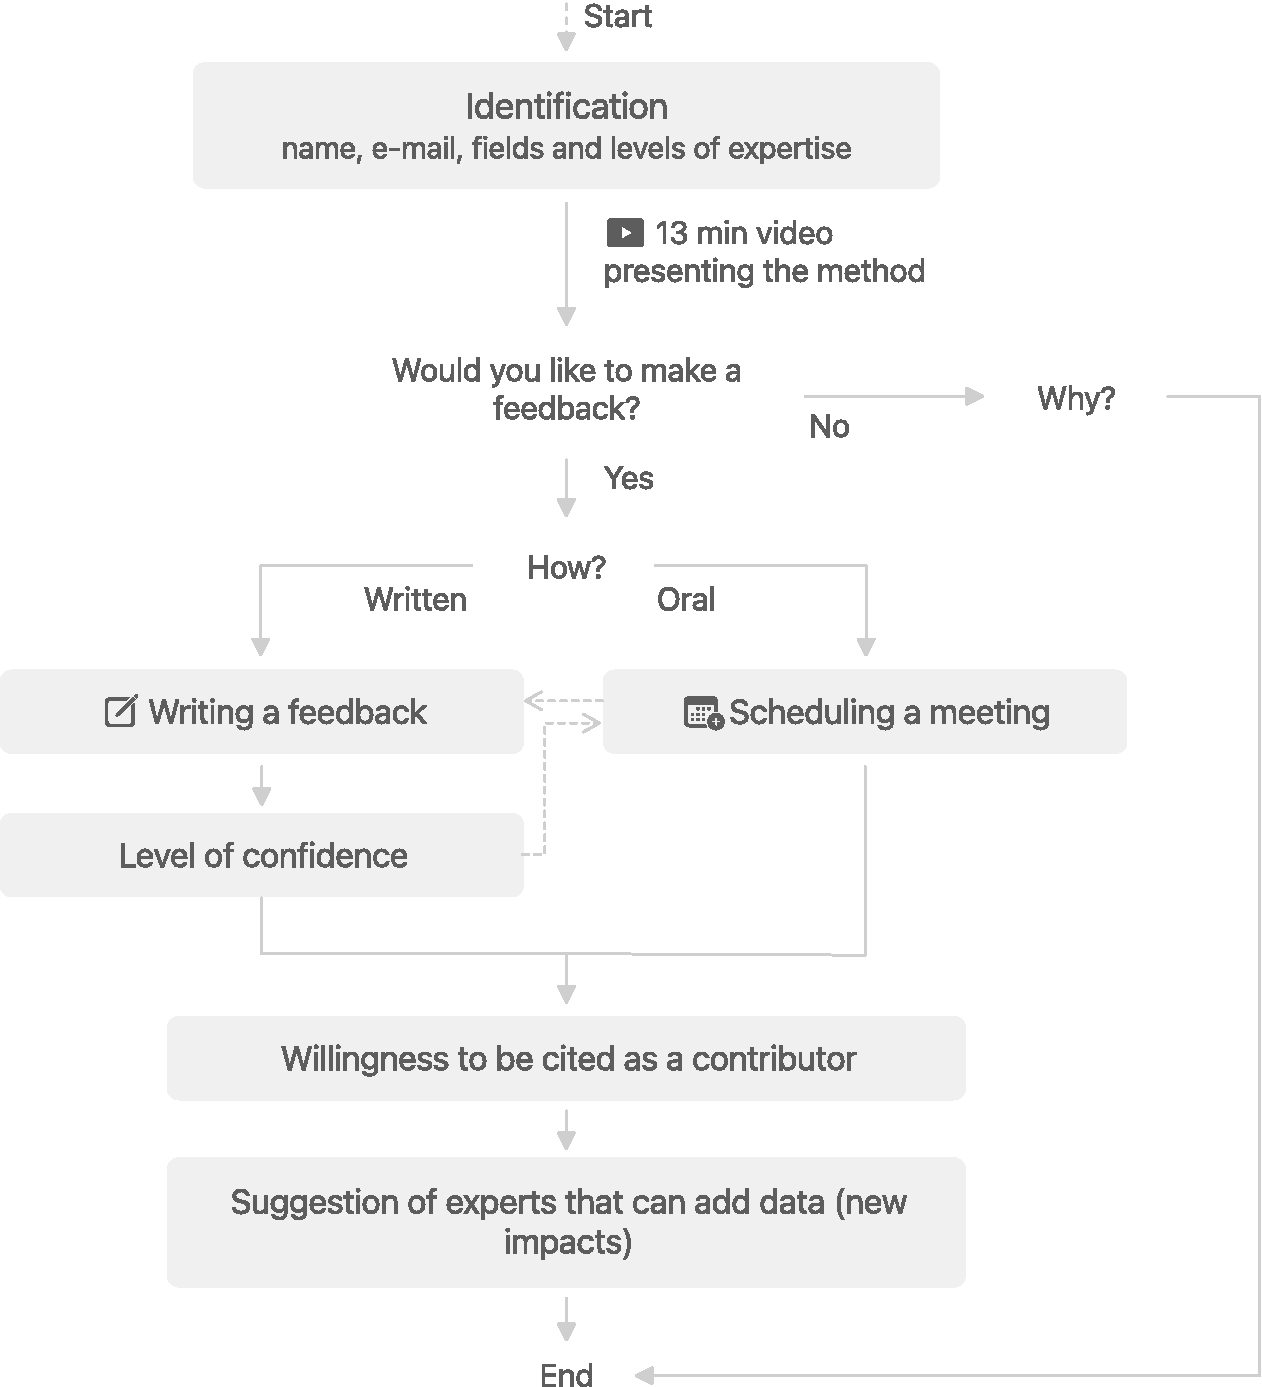
A protocol to gather feedback from experts has been carried out. The experts selected to review the model were primarily sociologists, as designers do not have expertise in social impacts, let alone the long-term evolution of social phenomena. However, the search has been expanded to include professionals in social sciences or individuals working with social mobility issues (specific criteria are shown in Section 3.7.2). To begin identifying these experts, multiple methods have been used, including posting on an automotive company social media group, interviewing researchers from labs to identify potential experts in their network, searching on social science laboratory websites and identifying research institutes working on mobility and its impacts, such as the Forum Vies Mobiles. Additional contacts have also been obtained through a “snowball effect,” where experts recommended other experts who recommended further experts. To gather feedback, an online questionnaire has been sent to capture constructive criticism. However, to ensure that experts understand the issues, it was important to provide them with a clear explanation of the model. To avoid monopolizing the experts’ time, a 13-minute video that presents the model concisely has been created (the video is available as supplementary material 1). The questionnaire allowed us to identify the expert and collect their feedback in plain text or via video conference according to their preferences. The logical structure of the questionnaire is illustrated in Figure 2.
Logical structure of the questionnaire sent to experts.
Nine experts gave feedback, resulting in 17 distinct remarks. To classify the remarks according to their importance, five tags were assigned: Fundamental (the validity of the model is being questioned, and a thorough revision is necessary), Major update (improvement of the model through a significant addition), Minor update (improvement of the model through minimal addition), Assumed (based on choices and assumptions, authors have not envisioned any update), and Advices (tips given by experts). Out of the 17 remarks, 9 were considered as assumed or advice, leaving 8 remarks to help authors update the model. You can find the list of experts and all these remarks in the supplementary materials 2 and 3.
This allowed us to identify the strengths and weaknesses of the model. After incorporating experts’ feedback, RUI model has been improved. At this point, it was a more robust theoretical model. This final model is explained in Section 3.
3. The RUI model
3.1. Structure
The main assumption when building the model was that sociologists, who are used to working with past or present phenomena, can use their knowledge to imagine possible long-term social effects of AVs (Lecomte Reference Lecomte, Yannou, Cahen, Thibaud and Etienne2023). The model needed to have several key features. First, it had to allow sociology experts to project themselves into future situations. Then, it had to collect, store, organize and summarize the knowledge of these experts, and finally make it easy to access through specific queries. Authors used interconnected databases because they are well-structured and easy to update. Each database corresponds to an object with a specific format. The three main objects of the model are representations, usages and impacts. Representations include all resources that represent an AV (such as a concept car, a functional shuttle or a science fiction movie). Usages are the basic actions – or usage functions linked to the passenger(s) – – made possible by the AV, such as sleeping or exercising in the vehicle. These usages are all extracted from the representations. Their purpose is to help experts project themselves into future situations. Lastly, Impacts are the possible consequences of usages according to experts, and corresponding to several social impact themes, such as health, well-being or employment.
The model consists of a set of five interconnected databases (see Figure 3). The first one, REPRESENTATION, is used to store and organize various representations of the AV (such as science fiction or existing prototype). Its main goal is to be able to extract usages made possible by the AV. Hence, the EXTRACTION database links usages to one to several representations. The USAGE database lists and characterizes all usages such as sleeping inside the vehicle during transportation or playing games with other passengers during transportation. It is from these representations that experts (like sociologists or urban planners for example) imagine potential impacts related to these usages, and therefore related to AV concepts. The IMPACT database contains all information provided by experts for characterizing an impact. It is connected to the INDICATOR database, which stores and defines all indicators of social impacts.
Databases and links of the RUI model.

The following sections provide details on the databases, including the objects and attributes that make them up. Three ontologies have been defined for representations, usages and impacts, and the authors established a protocol for extracting usages from representations. A protocol involving experts for adding impacts has also been created.
3.2. Representation database
This section presents a custom format to store, sort, exploit and trace existing representations of AVs that can then be used to extract usages. Exploiting many representations of different natures and origins as input material for the model seemed to be a good way of ensuring a large diversity of usages. This also helped to avoid biases the authors could have introduced if the usages came from their imagination. Using these representations to extract usages is further justified in Section 3.3.
A representation is a general category encompassing all types of artifacts, physical or virtual. It covers all types of externalization (Boujut & Laureillard, Reference Boujut and Laureillard2002). Seven attributes have been defined for a representation: (i) The reference Name of the representation. (ii) The Author (company or person). (iii) The Year of publication. (iv) The Resources to illustrate the representation (image, internet link, video). (v) A brief, factual Description. (vi) The Shape that can be: Design fiction object; Concept; Non-functional prototype; Functional prototype; Functional product; Film/TV series; Cartoons; Book; Internet article; Magazine; Comic book/Graphic novel; Software/Video game; Patent; Imagined usage; scientific work. (vii) The Maturity, inspired by Technology Readiness Levels (Tzinis, Reference Tzinis2015). The higher the level, the more realistic the representation is (level 1) Fiction: No willingness to be realistic; (level 2) Project/Vision: Willingness to be realistic but does not exist and (level 3) Real: Exists.
These attributes were determined inductively based on 74 existing representations of AVs found by internet searches or discussions with designers, engineers or futurists. Figure 4 presents three examples classified by Maturity. For more examples, an extract of the database is available in supplementary material 4.
Three examples of representations.

The initial 74 representations used in creating this format were selected for their diversity to avoid type-related bias. For example, depending solely on existing prototypes might not account for many possible usages in the next 30 years, unlike science fiction. Among the knowledge domains favorited, there are Science fiction (Murphy, Reference Murphy2020; Fischler & Longfellow, Reference Fischler and Longfellow2020; Britt, Reference Britt2016; Long, Reference Long2020), prospective documents, articles on AV history, articles on AV advances, reflections (Cherubini, Reference Cherubini2014; Veritasium, 2021), field analysis at Stellantis, patents and legal documents, student productions in design school (Strate memory, n.d) and scientific publications. Several keywords were also used in different search engines such as Google, Google Images, DuckDuckGo and Pinterest. Here are some examples of keywords used: “Self-driving car,” “autonomous car,” “autonomous vehicle,” “science-fiction,” “prospective,” “design-fiction,” “ethics,” “patent,” “concept,” “vision,” “imagination,” “scenario,” and “robo-taxi.”
The protocol for adding more representation involves two steps: (a) identifying a representation that could present at least one potential usage of the AV and (b) completing the seven attributes. No constraints have been imposed on adding representations, as the goal was to maximize diversity, much like a divergent phase in conception. As a result, no precise protocol has been formalized.
3.3. USAGE database
Scenario approaches, which are used in future studies, are known for addressing complex and uncertain issues (Mcgrail & Gaziulusoy, Reference Mcgrail and Gaziulusoy2014). Many works on scenarios attempt to envision the future of transportation (Gazibara, Reference Gazibara2011; Hannon et al., Reference Hannon, McKerracher, Orlandi and Ramkumar2016; Kaufmann & Ravalet, Reference Kaufmann and Ravalet2016; Urry, Reference Urry2016). Other approaches focus on individuals and their experiences. For example, Trommer et al. (Reference Trommer, Kolarova, Fraedrich, Kröger, Kickhöfer, Kuhnimhof, Lenz and Phleps2016) and Rohr et al. (Reference Rohr, Ecola, Zmud, Dunkerley, Black and Baker2016) create stories called “a day in the life of […]” to anticipate human factors and the evolution of social structures. However, due to the uncertainty, using detailed mobility scenarios (e.g. Fulton Suri & Marsh, Reference Fulton Suri and Marsh2000) is not suitable since they are generally adapted to known usages in known contexts. Instead, authors chose to use simple steps called “usages,” which allowed them to focus exclusively on new specific usage situations (see Bekhradi et al., Reference Bekhradi, Yannou, Cluzel and Vallette2017). According to the Larousse dictionary, a “usage” refers to the destination, function or use that can be made of something. The weak point of this approach is that it may lose the subtleties associated with a full journey description (see Al Maghraoui et al., Reference Al Maghraoui, Vallet, Puchinger and Yannou2019a). Nevertheless, the authors believe that considering a complete scenario with AVs would only add an additional degree of complexity without improving the plausibility of the scenarios.
A format to describe how AVs could be used in a precise and clear way has been created to assist experts (such as sociologists) in projecting themselves into the future. Instead of using user-centered methods like focus groups, interviews or user observations (Daae & Boks, Reference Daae and Boks2015; Al Maghraoui et al., Reference Al Maghraoui, Vallet, Puchinger and Yannou2019b), which could not guarantee that imagined usages from today would be accurate 30 years from now, an inductive method has been used. The authors built a common usage format with four coding attributes: (i) The Type distinguishes new usages introduced by AVs from existing or potential usages that will be significantly impacted by their deployment. These usages are referred to as new and augmented. New usage refers to a usage that does not exist at the time it is being extracted. For instance, if a vehicle picks up an object without any passenger, it is a new usage. Augmented usage, on the other hand, refers to a usage that already exists but has some new distinct elements. For example, moving from point A to point B with a vehicle while being the only passenger on board is an augmented usage. Although the usage itself is not new (since one can use a taxi service today), the fact that there is no driver is new. Therefore, the usage is considered augmented. The timeframe must be specified to accurately describe the usage. What may be new or uncommon now can quickly become commonplace in the future. The timeframe is established when a person extracts the usage from a representation (see Date attribute in the database EXTRACTION in Sections 3.1 and 3.4). (ii) The Subject attribute answers “Who or what performs the action?”. It can be Vehicle, Passenger(s), or External person(s). Let just make it clear that any action carried out by a vehicle is still serving a human. (iii) The Action attribute describes what the Subject does. An action is an infinitive phrase that describes a scene, a step, or an elementary task. It begins with an infinitive verb. For example, “Fetch an object” (for the subject: Vehicle) or “Work” (for the Passengers). When in doubt, it is recommended to use the simplest subject-action pair. For example, use “the passenger sleeps” instead of “the AV allows the passenger to sleep”. Additionally, it is important not to confuse the means of the action with the action itself. For example, if a science fiction representation shows an AV programmed to kill a person, the corresponding action is “to kill someone” and not “to hack the vehicle”. An additional attribute named (iv) Context can be added. For example, sleeping inside a vehicle is already possible today, but if the action takes place during transportation, the usage is now augmented. The Context can therefore be: “there is only one person inside the vehicle.” One or more contexts can be specified (logical AND). At this point, you may have noticed that Subject, Action and Context follow a logical sequence like a sentence: subject, verb, complement. The authors made this choice to simplify the understanding of usages. Table 1 shows seven examples of usages.
Seven examples of coded usages using the Type, Subject, Action and Context attributes

3.4. EXTRACTION database
It is important for the model to include a traceability of information. Three questions to be answered have been identified: (1) “Where did this usage data came from?”, (2) “Who was responsible for formatting it?” and (3) “When was the usage added?” An intermediate database called EXTRACTION has been created between representations and usages. This database allows for one or several representations to be linked to usage and includes two attributes to help track the data. The first attribute (i) Author is for the author of the link and the second attribute (ii) Date is for the date on which the link was entered. A usage can be linked multiple times to the same representation by different people. This new database allows for contextual information to be included in usage data to identify potential errors, such as improper formatting by a specific user. Figure 5 illustrates an example of the role played by the EXTRACTION database.
Example of usage extractions compiled into the EXTRACTION database.

3.5. IMPACT database
An impact is “a quantified evolution of an indicator caused by the advent of AVs to a given system.” The impacts format was created to meet four conditions: (1) incorporate the nuances identified by experts, (2) align with social sciences, (3) be accessible to non-experts and (4) allow for the addition of new social impacts on a regular basis. The study is focused solely on the impacts that occur during the use phase of AVs. Impacts that result from raw material extraction or recycling are not included. Additionally, impacts that are related to direct users’ perceptions, such as motion sickness or lack of comfort, were not considered as they are better evaluated using existing product evaluation methods (refer to Section 1).
There are different methods to describe impacts, such as the Logic Model (Practical Concepts Incorporated, 1979), the Theory of Change (Weiss, Reference Weiss1997), the Outcome Map (Earl et al., Reference Earl, Carden, Patton and Smutylo2001) or the Impact Management Project (The Impact Management Project, 2022; Fox & Ruff, Reference Fox and Ruff2021). The Impact Management Project (IMP) is a forum that was established in 2016 to develop a global understanding of how to measure, evaluate and report impacts on people and the environment. Based on a survey of over 2,000 practitioners, IMP has defined five dimensions of impact: What, Who, How much, Contribution and Risk (Five Dimensions of Impact, 2022). We have decided to adopt all dimensions of the IMP framework to define our impact format. Our approach was to draw inspiration from IMP and add new dimensions specific to the case of a disruptive product that does not yet exist on the market. We divided the IMP dimensions into seven impact attributes to create the IMPACT database.
The first dimension is “What”, which makes statements about what is happening and includes one link to the database INDICATOR, (i) the Trend and the (ii) Change. The indicator is the variable that is likely to change with the arrival of AVs, it is further described in Section 3.6. The evolution of the indicator is indicated by the Trend attribute, which can take two values: ↑ = increase or improvement; ↓ = decrease or deterioration. The option: → = constant has been added because it would no longer be an impact according to the definition. The change attribute contains additional and optional information provided by the expert on the indicator and the trend (see Section 3.7.2).
The second dimension is “Who” and details the individuals impacted. It has one attribute: (iii) the Subject, which provides Information about the person affected by the impact. The Subject may be different from the person specified in the usage database. For example, a passenger’s usage of AV may impact pedestrians. The question “Who is affected by the impact?” helps fill in this information.
The third dimension is “How much” and includes four quantitative attributes that can take discrete values between 1 and 3: (iv) The Intensity captures the evolution of the indicator if AVs are deployed in comparison with today. The approximation is that the contribution of AVs can be assimilated to the total intensity of change. It stems from the condition imposed in the usage format: usages are either new or increased by the deployment of AVs. The intensity scale is as follows: “Low” (1/3), “Medium” (2/3) and “High” (3/3). (v) Depth captures the approximate share of people matching the subject description and affected by the impact. For example, for the usage “working in the vehicle during transport,” if the indicator and trend are “improvement in physical condition” and the subject of the impact is “regular AV user,” then the Depth may be low because not all regular users will necessarily exercise. The Depth is highly dependent on the definition of the subject. Its scale is as follows: “Very few people” (1/3), “Several people” (2/3) and “Everyone” (3/3). (vi) Occurrence concerns the likely frequency of the impact. It is comparable to the notion of occurrence defined in the failure mode, effects and criticality analysis (FMEA) or to the notion of “likelihood” defined in the risk dimension of the Impact Management Project (IMP). The scale we have selected is as follows: “Rare” (1/3), “Often” (2/3) and “Systematic” (3/3). The final metric is (vii) Certainty. It measures the level of certainty the expert has regarding the causality between usage and impact. This metric is crucial in calculating the level of uncertainty for each impact and is linked to the Risk dimension of IMP. We have developed a scale as follows “Very uncertain” (1/3), “Not very confident” (2/3) and “Rather confident” (3/3). For all these quantitative attributes, the scales did not start at 0. Starting at 0 would suggest that there is no impact at all, which does not make sense. However, a positive extreme value has been added to Intensity, Depth and Occurrence: “High,” “Everyone,” and “Systematic,” respectively. Authors were inspired by De Singly (Reference De Singly2012), who stresses the importance of extreme values for questionnaires, even if they are less commonly used than other options. The exception is Certainty because it is impossible to be completely confident about impacts that will occur in several decades, so the highest value on this scale (“Rather confident”) is not considered certain.
The last dimension is “How”, which connects the impact to one or more usages. This dimension is characterized by its link with the USAGE database.
In addition to IMP dimensions, two attributes have been added to track the data (similarly to the EXTRACTION database for representations and usages): (viii) the Expert who imagined the impact and (ix) the Date when the impact was added. A last attribute named (x) Conditions allows for contextualizing an impact. This optional attribute is defined by a sentence starting with “If” that describes a condition to be met for the impact to be valid, according to the expert who establishes the link. Experts who define several conditions can also add combinatorial logics (AND/OR logic functions). The purpose of this attribute is to allow experts to specify the context of the impacts they imagine. This is fundamental to properly frame the sociological analysis of a situation and limit the “rigid” aspect of the coding system. The significance of this final attribute is based on the first feedback from experts, as shown in the supplementary material 2. An example of IMPACT database data is shown in Figure 6.
Example of impact linked to an indicator.

3.6. INDICATOR database
The Cambridge dictionary defines an indicator as follows: “something that shows what a situation is like.” The authors have added to this definition that an indicator can be qualitative or semi-quantitative, must fall under a social impact theme and must be able to increase or decrease. The 11 themes are described below.
-
• Population Changes. Immigration and emigration, relocation of families, presence of a seasonal leisure population, the arrival of temporary or permanent workers and changes in the community’s age structure.
-
• Family. Roles that families play in society, roles that individuals play within families and stress factors that lead to tense family relationships.
-
• Gender. Gender norms and expectations.
-
• Education. Access to education, dissemination of information, new knowledge by using a product.
-
• Stratification. Categorization and hierarchization of groups of people (on economic, religious and racial plans).
-
• Employment. Professional opportunities.
-
• Health and well-being. Health, well-being and safety (“a state of complete physical, mental and social well-being and not merely the absence of disease or infirmity” – Grad, Reference Grad2002).
-
• Human Rights. The protection and promotion of rights that are presumed to apply to everyone. Opportunities or obstacles for disadvantaged groups. For example, improving the accessibility of people with physical disabilities.
-
• Networks and communication. Formation of new relationships or increase or decrease in the strength of relationships
-
• Conflicts and crimes. Activities that go against formal and informal community rules and conflicts between individuals.
-
• Cultural Identity and Heritage. Lifestyles developed by a community and passed down from generation to generation, including customs, practices, places, objects, artistic expressions and values. For example, loss of language, desecration of sacred cultural sites or violation of cultural taboos.
The INDICATOR database lists attributes related to an indicator, including (i) the theme, (ii) the Name of the indicator and (iii) the Description. The Theme is inspired by Rainock et al. (Reference Rainock, Everett, Pack, Dahlin and Mattson2018) and identifies social phenomena influenced by products and technologies. 11 broad themes have been chosen. Themes can give experts ideas as noted by Al Maghraoui et al. (Reference Al Maghraoui, Vallet, Puchinger and Yannou2019b). Additionally, themes can help experts avoid imagining impacts beyond the scope of the study (refocusing). This can also aid experts in distinguishing between impact and usage (usage refers to an action made possible or increased by AVs, while impact refers to the influence of such actions on people). A more detailed description of the 11 themes can be found in supplementary material 5 (in French).
The Description provides written information about the indicator to avoid any misunderstandings. Once these attributes are filled in, they never change because an indicator is permanently defined. In contrast, attributes in the IMPACTS database are informed for each data point added by an expert. That is why the two databases have been separated. An example of INDICATOR database is shown in Figure 6.
3.7. Adding data
3.7.1. Usage extraction
The extraction consists of identifying and then codifying a usage from a representation (see Figure 7). This process can be followed by any person trained to use the model and does not require any expertise. To add an impact, the authors propose some recommendations: The first step is to identify a potential usage in a representation. The second step is to check its correspondence with the four AV conditions presented in the Section 1: (1) The vehicle is primarily designed to transport passengers with the ability to transport objects. (2) The vehicle has a seating capacity of 1 to 9 seats. (3) The vehicle has an automation level of 4 or higher on the SAE scale. (4) The vehicle operates in a country with a high human development index (≥ 0.700). It can be difficult to check these conditions because representations are sometimes not complete. In this situation: If one of the conditions has a clear negative answer (e.g. the vehicle has ten seats), then the usage should be rejected. If all four conditions have no clear answer, it is allowed (but not recommended) to add the usage. If at least one condition has a positive categorical response and all the others do not have a clear one, it is recommended to add the usage. Figure 7 shows a flowchart summarizing how to add a usage to the model.
Flowchart to follow to add a usage to the RUI model.

It is important to note that there may be a bias in the extraction of usages. The person conducting the extraction may unintentionally exclude unexpected, diverted or taboo usages (such as intimate relationships within the AV or illegal exchange of goods). This phenomenon can be worsened by the fact that the name of the person extracting the usage is recorded. Therefore, it is recommended that those extracting usages keep this bias in mind. An example of the process for adding a usage is presented in the supplementary material 6.
A total of 36 usages from 39 representations have been extracted following the protocol described in Figure 7.
3.7.2. Impact addition
The RUI model prioritizes the involvement of social scientists in determining social impacts, as they are considered the most competent and concerned in this area. In addition to social scientists, experts in Social Impact Assessment (SIA) or Social Life Cycle Analysis (S-LCA) were sought to complement the specialized views of sociologists and provide experience with a wide range of social impacts. Researchers who have worked on social impacts in the mobility field were also considered. To ensure diverse perspectives, experts in the 11 selected themes of social impacts were included, such as doctors and psychologists for “health and well-being,” geographers and urban planners for “demographic changes,” and lawyers for “human rights.” Designers, futurists, artists and science fiction authors were not included, as their strengths lie in imagining futures rather than establishing rigorous causal links between situations and social impacts.
A list of criteria was defined, and each potential expert had to satisfy at least one of these criteria.
-
• Sociologists. They are likely the most capable and qualified to evaluate social impacts.
-
• Impact assessment or social impact assessment experts. These experts have knowledge of a wide variety of social impacts, which can complement the specialized visions of sociologists.
-
• Researchers on social impacts on mobility. Some researchers work on social impacts in the field of mobility. They are familiar with this type of impact and with the issues and trends in mobility.
-
• Expertise in one of the 11 themes of social impacts. The social impact themes chosen are not solely related to sociology. Other people whose expertise pertains to one of these themes could also provide valuable information.
To consult experts, two options have initially been considered: conducting semi-structured interviews or proposing an online questionnaire. The online questionnaire has been chosen because it is more convenient for busy people and allows to interview more experts in less time. This approach also uses a consistent questioning protocol to ensure that all experts have the same information and understand the subject equally. Participants fill out the questionnaire themselves, which saves time and makes the process easier to implement in a company without requiring a trained experimenter. The questionnaire approach has its advantages, but it also has some limitations when compared to interviews. First, experts cannot be guided or corrected in real time, which may result in off-topic answers. Second, oral communication allows for more subtle nuances to be expressed. During an interview, the experimenter can also assist the expert in explaining and reformulating certain subtleties. Finally, scheduling appointments for interviews allows for a specific time slot during which experts can concentrate on the task at hand. With a questionnaire, people may not take the time to block out time to respond. These limitations were taken into consideration when designing the questionnaire but attempted to reduce their impact by testing it with ten nonexpert participants before launching the final version.
To build the questionnaires, two main resources have been used: How to Use Qualitative Methods in Evaluation by Quinn Patton (Reference Quinn Patton1987) and Le questionnaire by De Singly (Reference De Singly2012). The process of adding usage-impact links to databases is made of two steps: (1) presenting usage scenarios to experts and collecting the impacts they imagine through the questionnaire and (2) coding the data provided by experts to the databases, after the questionnaires are filled out. Dividing the process into two steps allows for more flexibility in constructing questionnaires with open-ended questions adapted to the nuances that experts may want to express. It enables experts to provide more contextualized impacts and greater depth of insight. Moreover, populating databases can be a tedious and error-prone task, particularly for people with a limited understanding of the model.
When creating the questionnaire, the authors defined three main drivers to ensure good quantity and quality of impacts:
-
1. Motivate experts to answer the questionnaire.
-
2. Keep the filling time short to avoid experts losing patience.
-
3. Have several different experts treat each usage.
The authors created questionnaire sessions to gather feedback on a set of usages within a specific timeframe. Each session has the following characteristics: A specific number of usages is set. Each participant evaluates five usages. Enough participants are included to ensure that each usage is evaluated by a single group of three experts (See Table 2). It is important to gather different opinions from experts and combine them to reach a consensus. This can help identify any biases or opinions disconnected from the usage. A limited response time is given. For example, a session with 10 usages will require at least 6 participants to make sure each usage is evaluated by a group of 3 experts. The time window for gathering responses could be one week. Table 2 shows how the usages are distributed among the 6 experts. Deducting from Table 2, expert 4 handles usages 1, 7, 8, 9 and 10.
Example of distribution of usage among experts within a session

From the perspective of the expert, there were two phases involved. The first phase was registration, which required watching a brief presentation video of the experience (a video is provided as supplementary material 1). After that, participants could choose to register or not. Registration involved providing personal information such as name, first name, email address, company and areas of expertise, and consenting to the storage of this data as part of the experience (in compliance with GDPR, see supplementary material 7). Finally, participants had to select one or more sessions.
The second phase was the session in which the impacts were imagined. At the start of each session, every expert was assigned a unique list of 5 usages. To begin filling in an impact, they simply needed to click on the corresponding usage in the e-mail sent to them (Figure 8). Please note that experts review the usages, not the representations. By doing so, their assessments are free from influence by the contextual elements of the representation, such as visuals or environment. Their focus is solely on the usage format as outlined in Section 3.3.
Solicitation email sent to a participant proposing 5 usages to be addressed.

Each hyperlink led to a questionnaire specifically generated for the participant, so he/she did not need to provide his personal information again. The participant could indicate several impacts per usage. The questions are presented in Table 3. Two types of questions were distinguished: open-ended and closed. Closed questions required respondents to choose from pre-formulated answers, while open-ended questions allowed respondents to answer freely (De Singly, Reference De Singly2012). The questions were formulated to be clear, specific and singular (Quinn Patton, Reference Quinn Patton1987, p124).
Set of questions asked in a questionnaire (for each usage clicked by an expert); * mandatory

The authors have chosen a combination of closed and open-ended questions to take advantage of their respective strengths. Closed questions are easier to categorize, while open-ended questions give experts more freedom to respond (Quinn Patton, Reference Quinn Patton1987, pp. 19 and 38). This aligns with the reasoning behind the Conditions attribute of the IMPACT database, which addresses the importance for experts to contextualize impacts (refer to Section 3.5). The advantage of conducting a semi-structured interview is twofold: the expert does not need to learn how to code an impact and he/she can add whatever level of detail he/she wants. Additionally, these sheets were provided to experts (inspired by Traverso et al., Reference Traverso, Valdivia, Luthin, Roche, Arcese, Neugebauer, Petti, D’Eusanio, Tragnone, Mankaa, Hanafi, Benoît Norris and Zamagni2021). These sheets include examples and extra resources. They serve two purposes: to prevent off-topic impacts and to inspire experts. You can find all 11 sheets in the supplementary material 5 (in French).
After the session, each participant who responded to the 5 assigned usages received a summary of the results in a PDF document as a “reward” for their participation. The goal was to share answers from other participants to fulfill their curiosity and assist them in finding experts to share ideas. The document showed the impacts generated during the session, classified by usage and impact theme. The final page contained the participants’ contact details, but the impacts were not linked to their creators. This approach was chosen to avoid any influence on the interpretation of the impacts due to the author who imagined them. The experts received this document via grouped email, so they could get to know each other and possibly exchange ideas. This summary provided important information and opportunities for experts to gain knowledge and contacts. Three syntheses are available in the supplementary material 8 (in French).
After the session was completed, the authors coded the information obtained from questionnaires into the appropriate databases. As De Singly (Reference De Singly2012) pointed out, the coding process involved translating interviewee language into digital language. Since the questionnaire included open text fields (Change, Subject, Conditions), coding this data was more complex than closed questions, as it required interpretation to establish connections within the databases. Figure 9 displays the correlations between the retrieved data (RAW IMPACT) and the IMPACT and INDICATOR databases of the RUI model.
Graphical representation of coding impacts extracted from questionnaires in the IMPACT and INDICATOR databases.

To summarize the different steps to follow to add new impacts to the RUI model, Figure 10 presents a recapitulative flowchart.
Flowchart to follow to add an impact to the RUI model.

All the sessions conducted lasted for one week each, covered 10 usages and involved at least 6 experts. Three sessions were organized to complete the databases. Given the difficulty of finding experts willing to give their time, each of them could register for multiple sessions. In total, 55 experts who met the criteria were contacted by email. Sixteen experts signed up for the different sessions, including 7 women and 9 men. Details regarding the confidentiality of personal data are provided in supplementary material 7.
Results for each session
The three proposed sessions took place between January 23 and February 10, 2023.
-
• SESSION 1 – From January 23 to 27
-
• SESSION 2 – From January 30 to February 3
-
• SESSION 3 – From February 6 to 10
Out of the 6 experts registered for SESSION 1, 49 impacts were kept from the list of 10 usages in session 1. Nine impacts were rejected because they were not social impacts.
Out of the 7 experts registered for SESSION 2, 51 impacts were kept from the list of 10 other usages. Three impacts were rejected.
Out of the 9 experts registered for SESSION 3, 39 impacts were kept from the list of 10 other usages. Two impacts were rejected.
Overall results
Of all the sessions, 139 impacts were selected. 14 were rejected. Out of the 30 usages presented to the experts, 24 were treated by at least three different experts (80%). Among the remaining six usages, five were treated by two experts and one by a single expert. Figure 11 shows the number of different experts per usage.
Number of different experts who have dealt with each usage (each usage is identified by a session and a number.

In Figure 12, it can be observed that the themes with the greatest impact are health and well-being and conflicts and crimes, with 40 and 37 impacts respectively. The theme of gender has no impact (although 7 women participated). The significant presence of the theme of conflicts and crimes (the category with the most indicators, 23) suggests that the failure modes and unforeseen uses of AVs have been taken into consideration, as concerns raised by sociologists interviewed in Section 2. Participant V, an expert in law who works on topics such as crime and prison, is not responsible for the results of the conflict and crimes category, because he provided only 38% of impacts in the theme. It has also been calculated that on average, each specific indicator was handled by 1.5 experts, meaning that several experts imagined similar impacts without consulting each other.
Number of impacts and indicators per theme.

Out of the 17 experts who registered, 16 participated. Some experts registered for multiple sessions. Figure 13 displays the number of contributions of each expert, as well as the number of sessions they participated in. It is evident that participants V and D were the most active participants. As a result, they have the greatest influence on the results (they account for slightly over 50%). They are also the two individuals who provided the most detailed responses.
Number of impacts per expert.

Additional details about participants are available in the supplementary material 3. The number of impacts per usage is shown in Figure 14.
Number of impacts per usage.

Examples of impacts
With all the accumulated data, it is difficult to conduct a comprehensive analysis of the results. The authors have chosen to take a few examples here by analyzing three usages. The three usages were selected with the highest impact/indicator ratio ( $ r $
) to show the greatest aggregated results. The three selected usages are presented in Table 4.
$ r $
) to show the greatest aggregated results. The three selected usages are presented in Table 4.
Selected usages to query the model.

Below are some examples of statements obtained querying the model. Raw results are available in supplementary material 10.
-
• If the AV allows the passenger to communicate with passengers in surrounding vehicles during transport, then it could be easier to report a problem (according to one sociologist and urban planner).
-
• If the AV allows the passenger to communicate with passengers in surrounding vehicles during transport, then it could significantly promote insults and threats among road users (according to one expert on ADAS ergonomics innovation).
-
• If the AV allows the passenger to communicate with passengers in surrounding vehicles during transport, then the number of social interactions could increase moderately (according to two sociologists and one ergonomist). Another sociologist thinks that the number of social interactions will not be impacted.
-
• If the AV allows the passenger to perform personal tasks during transport (e.g. a grocery list), then this will significantly increase the pressure on the passenger to perform more activities (according to two experts).
-
• If the AV allows the passenger to perform personal tasks during transport (e.g. a grocery list), then the available free time will be significantly and systematically increased (according to one expert).
-
• If an outsider can kill someone by taking control of the AV, then there will be a significant increase in the number of accidents (according to one psycho-ergonomist and specialist in mobility innovations).
These statements are given solely based on the attributes Indicator, Trend, Intensity, Occurrence and Expert. However, it is possible to go much further by considering, for example, the Certainty, the Depth or the textual details given by the participants (Change, Subject, Conditions). Supplementary material 10 provides more details.
3.8. Example of using the model
To illustrate the model’s potential uses, the following section discusses two types of queries enabled by the RUI database structure: (1) Queries to obtain a list of possible impacts resulting from selected usages. (2) Queries to obtain a list of usages likely to generate selected impacts. The first type can provide insight into the potential impacts of a concept. The second type, on the other hand, can help identify usages that are likely to generate undesirable impacts. To visualize how these consultation modes may be used within an industrial tool, a graphic interface prototype is presented in a video available in the supplementary material 9. As the model was designed to be versatile, its database structure provides flexibility for future use, making it adaptable for creating industry-specific tools (adapted to specific design phases, teams or specific companies).
3.8.1. Type 1: Impacts from usages
The first type of query involves selecting one or multiple usages and obtaining a list of potential impacts. Aggregation formulas can be established to provide a single aggregated impact by combining data for each indicator. Figure 15 provides an example of impact aggregation.
Example of impact aggregation using data from three experts.

Because all usages are linked to existing representations, it is also possible to select one of them as input to obtain the corresponding impacts.
For example, this first type of query could be used by designers or decision-makers, to verify that an AV concept is not likely to cause too many undesirable impacts. This could be referred to as simulation.
3.8.2. Type 2: Usages from impacts
The second type of query involves selecting one or several indicators and assigning a trend (positive or negative) to each. The goal of the model is to calculate the list of usages most likely to generate this selection. To do this, the average influence of usage on the selected impacts can be calculated using the average trend weighed by both intensity and certainty. Figure 16 provides an example of usage aggregation.
Example of usage aggregation corresponding to three impacts.

For instance, this second type of query could be used to assist designers in establishing the initial characteristics of a concept during the early design phase. This could be referred to as stimulation.
3.8.3. Product development process integration
This section shows how the RUI model could integrate into a product development process. Figure 17 suggests using RUI in a generic design process, similar to the Double Diamond (Design Council, 2005).
Two examples of RUI integration within a generic design process.

Consider an automobile manufacturer aiming to design an AV. The primary contribution of RUI (Type 2, Figure 17) is to stimulate designers or decision-makers by suggesting usages that they can employ to imagine initial concepts (Simon, Reference Simon1996). Unlike other stimulation methods (Al Maghraoui et al., Reference Al Maghraoui, Vallet, Puchinger and Yannou2019), these suggested usages are weighted by desired or undesired impacts identified by the manufacturer. See “Social impact strategy” in Figure 17.
The second contribution of RUI (Type 1, Figure 17) is to assess whether a concept envisioned by designers is likely to generate undesirable impacts, allowing for adjustments accordingly.
This model does not perform foresight in the strict sense but ensures alignment between concepts and the company’s long-term strategy. For example, if the company’s goal is to promote user health, the model can warn against concepts that might replace active transportation modes such as walking or cycling. The manufacturer can then consider these warnings and even anticipate potential regulations. With a forecast to 2050, the contribution lies not in the likelihood of the impact occurring but in considering its possibility. This use of RUI can address strategists, senior managers, product owners or designers. RUI can be used to design a product or service for shorter-term deployment, allowing an assessment of potential long-term consequences. Thus, the results can directly influence design choices.
These examples demonstrate how RUI can integrate into various subparts of existing design processes. While this article does not detail the form RUI would take in these examples (software platforms, physical cards, etc.), the authors are already developing two software tools based on RUI.
4. Discussion
4.1. Data analysis
After adding the initial dataset to the RUI model, the model was put into practice and preliminary results were obtained. The analysis prompted several questions, which will be addressed below.
First, observing the results, limitations related to the questionnaire approach can be highlighted. Out of a total of 151 impacts, 14 off-topic responses were obtained. While this value is low, it is significant (9%) and shows that the questionnaire can lead to misunderstandings and off-topic responses, unlike face-to-face interviews. However, the questionnaire approach allowed for the establishment of more valid connections (139) in a shorter time span compared to interviews. All participants, with few exceptions, responded quickly after the deadline (within a few days).
Second, in a qualitative interview, it is generally advised for the experimenter to adapt the vocabulary of the questions to the interlocutor. In this study, experts in sociology, psycho-ergonomics, urban planning, etc., were invited to answer the same questionnaire. As their fields are different, the concepts and terms used could have been understood differently. This limitation was observed through questions that three participants asked by email and phone. Ideally, the questionnaires should have been adapted to each expertise.
Third, asking open-ended questions in a questionnaire makes the responses highly dependent on the experimenter’s interpretations during coding (De Singly, Reference De Singly2012). Therefore, it is possible that some indicators do not perfectly match the nuanced responses of the participants.
Fourth, the objective of obtaining responses from at least 3 different experts per usage was not achieved (24 out of 30). As a recommendation, more redundancy should be preferred in the distribution of usages to compensate for unforeseen circumstances that prevent some participants from addressing their five usages.
Fifth, the three sessions allowed to identify 151 impacts (of which 139 were validated). The authors initially aimed for 30 impacts per session (10 usages $ \times $
3 experts), which makes a total of 90 impacts minimum. The objective was exceeded by 54%, thanks to the participants who did more than what was asked of them. This shows that the participants generally followed the instructions, and some even got into the game by providing additional responses (especially participants V, D and H). This interest indicates that this approach was not too tedious for the experts.
$ \times $
3 experts), which makes a total of 90 impacts minimum. The objective was exceeded by 54%, thanks to the participants who did more than what was asked of them. This shows that the participants generally followed the instructions, and some even got into the game by providing additional responses (especially participants V, D and H). This interest indicates that this approach was not too tedious for the experts.
Sixth, among the 11 themes of social impacts, the authors noticed the prevalence of the themes of health and well-being and conflicts and crimes both in terms of impacts and indicators. To explain this result: Perhaps these themes are easier to understand than themes like demographic changes or stratification, perhaps they are more generic than others, or perhaps they are more related to a usage-based approach. For example, it may be difficult to link an activity performed in a vehicle to population stratification, whereas impacts on health or well-being may be more evident. On the other end of the spectrum, the themes of gender and stratification did not receive much impact, if any at all. The previous hypotheses apply. The remaining 7 themes are of the same order of magnitude in terms of impacts and indicators. This shows that despite some extremes, the themes are rather well distributed. This could mean that the themes would need better descriptions in a future version (like Traverso et al., Reference Traverso, Valdivia, Luthin, Roche, Arcese, Neugebauer, Petti, D’Eusanio, Tragnone, Mankaa, Hanafi, Benoît Norris and Zamagni2021). For instance, a subdivision of the themes health and well-being and conflicts and crimes into sub-themes.
Seventh, common trends on indicators given by several experts were identified. For example, for the relationship between the usage “The passenger communicates with passengers of surrounding vehicles during transport” and the indicator “social interactions,” three experts believed that the trend would be positive (increase in social interactions), while another expert thought that social interactions would not evolve. Being able to access the nuances mentioned by the experts allowed for a more detailed understanding of the reasoning at work. The authors believe that this aspect of RUI could be a powerful feature for designers when used within a dedicated tool.
4.2. Validation
The RUI model presented is based on the idea that interviewing experts such as sociologists is a good way to gain knowledge about the potential social impacts of a disruptive product that does not exist yet on the market. Unfortunately, this hypothesis cannot be validated as is, due to the inability to determine with certainty the long-term social impacts of AVs and to compare them with the forecasts of the model. This is why the model was not designed with a prescriptive purpose, but rather as a guardrail to help avoid potential undesirable impacts early on. This way, the final decision always stays with the designer or decision maker.
This open-loop design required a qualitative process. During the model’s design (Section 2; Supplementary materials 1 and 2), nine experts in social sciences and sociology were consulted. These experts not only provided valuable feedback but also validated the model’s structure. By doing so, bias was minimized and the model was strengthened to the best of authors ability. After adding data, some concerns raised by the experts did not actually occur. For example, the model addressed “taboos” and “unexpected” usages as much as “ideal” or “planned” usages and sociologists were able to imagine impacts even with limited context. Moreover, the model’s information consolidation system is a crucial feature that involves cross-referencing information from multiple experts. This system prioritizes impacts that are agreed upon by multiple experts, without consultation. To enhance this function, a systematic impact addition protocol has been developed (Figure 11) to help the model converge towards knowledge supported by multiple experts. The experts also helped to implement one important feature of the model: As linking usages to impacts is difficult without context, a context attribute was added to the IMPACT database. Results confirm this need for experts, as 122 out of 139 impacts include a context. However, using elementary usages over complex mobility scenarios, which limits anticipation of chained usage impacts, is acknowledged as a limitation.
The model was not developed as a full-fledged design tool adapted to design processes. Therefore, integrating the RUI model into a functional tool would be the next obvious step to test its utility. This tool could add advanced query methods, such as case-based reasoning (Riesbeck & Schank, Reference Riesbeck and Schank1989; Leake, Reference Leake1996; Kolodner, Reference Kolodner2014) and include confidence attributes for experts, usages and impacts. This article focuses on the construction, rationale and principles of the RUI model. A subsequent article by the authors will focus on its integration into an industrial tool and its practical application within an automotive company.
5. Conclusion
This article introduces an innovative model named RUI for anticipating the social impacts of highly AVs and that can be used as a foundational framework for a future design tool. The model was developed with the help of nine social science experts to limit potential biases. Its main idea is to compile a list of AV usages based on various existing representations (such as science fiction and existing prototypes) and then use them to gather opinions from different experts in sociology, psycho-ergonomics, urbanism and other related fields to obtain social impact about the identified usages. The main motivation is that designers or decision-makers, who may not be experts in social impacts, can benefit from a model gathering knowledge from sociology experts and social phenomena, to avoid catastrophic impacts early on. However, at this early stage, the goal was not to test the model’s utility in practical scenarios with designers. Instead, the goal was to propose a robust framework that can serve as a foundation for future tool development. The model consists of five interlinked databases that allow for specific queries to be made. For example, you could ask, “What would be the impact of an AV designed to provide thrilling sensations to passengers?” Lastly, the model is designed to evolve and offers specific protocols for continuously adding new data.
In this article, the addition of a first set of data is presented. 74 representations were added, 36 usages were extracted and 139 impacts (from 88 indicators) were obtained. Three sessions involving 16 experts were conducted to gather these results. The obtained results show promising potential in using social sciences to anticipate possible social impacts of AVs. It was observed that the 16 experts envisioned impacts in 10 impact themes, and different experts anticipated similar impacts for given usages. This means the model can favor data consolidation. This is evidenced by the average number of different experts per indicator (1.5). Furthermore, some concerns that experts raised during the construction of the model have been resolved or partially resolved with the analysis of this first set of data. For example, the potential lack of variety in representations, the possible omission of taboo and misuse of AVs, the difficulty for experts to generate impacts without context and the bias in expert selection. Other concerns remain, such as the use of elementary usages instead of complex scenarios, but the approach assumes these issues. Nonetheless, the authors have not identified any fundamental limitations that could invalidate the model at this point.
Recalling the main hypothesis: Given proper stimulation (like specific AV usages), social science experts can imagine possible impacts. By creating the RUI model, the aim was to assist experts in projecting themselves into future scenarios (represented by usages), resulting in the successful generation of 139 impacts. Therefore, it can be stated that the hypothesis is partially validated, as the model has indeed enabled experts accustomed to analyzing present phenomena to imagine impacts in a distant future. It should be stated that no results could prove the accuracy of the impacts because the time scale (30 years) is too long to enable an accurate validation.
The RUI model draws inspiration from impact assessment methods by considering both broad and long-term social impacts. However, it does not aim to anticipate impacts precisely, but rather to stimulate reflection by presenting coherent links between possible usages and social impacts. The model has two key features that set it apart from other approaches. First, it takes inspiration from scenario methods used in future studies to deal with uncertainty. It explores numerous existing representations to consider a wide range of potential usages. The underlying idea is that, since it is difficult to predict which usages will be predominant, it is best to consider as many usages as possible. Second, the model relies on the expertise of social experts to generate coherent and possible impacts from the usages. The promising results highlighted in the case study of AVs demonstrate the potential of this new approach. Therefore, integrating it into an industrial tool or method, which could be compared to existing product evaluation and impact assessment methods, is a clear next step for authors. When other methods struggle to anticipate the social consequences of technology in the face of uncertainty and a high time scale, RUI could succeed in quickly anticipating many impacts. Even though the validity of these impacts remains uncertain, the strength of the model is to position itself as a safeguard intended to guide the reflections of decision-makers, policymakers or designers on their choices about future technologies. Generalizing the model to other disruptive products would also be particularly relevant, for example, to try to anticipate the long-term social impacts of augmented reality combined with generative IA.
For this model to be useful, it is important that different actors can take advantage of it. Two applications were illustrated in this paper: stimulation and simulation. However, it remains essential to discuss the roles and responsibilities of designers and decision-makers in strategies for long-term product deployment on a case-by-case basis. Such discussions will aid in developing tools that direct the resources proposed by RUI to appropriate areas within the decision-making and design process. The ultimate objective is to minimize undesirable impacts on society and individuals. The authors have embarked on defining a tool that integrates different impact models such as RUI. Through testing various metrics within an automotive company, the aim is to validate the effectiveness of the RUI model within industrial processes. By assessing the knowledge gained by users, examining the influence of the tool on their decision-making and evaluating the potential impact of their proposals, the authors hope to demonstrate that the RUI model can truly influence the industry. To go further, other applications of the model could also be useful for helping communities, urban planners, legislative bodies or governments to broaden their knowledge about the long-term impacts of potentially disruptive products.
Supplementary material
The supplementary material for this article can be found at http://doi.org/10.1017/dsj.2024.44.
Financial support
This research received no specific grant from any funding agency, commercial or not-for-profit sectors.


 Open access