

Skeletal pathologies, especially tibial dyschondroplasia (TD), are prevalent in all poultry and meat ducks are no exception. Like other poultry species, ducks have been genetically selected to bias increased growth rates, and in fact of all poultry, ducks are the fastest growing( Reference Cherry and Morris 1 ). Increased growth rates combined with nutrient-dense diets increase risk factors that lead to leg issues( Reference Waldenstedt 2 ). Many of these leg issues are due to rapid muscle growth that inadvertently put stress on the immature skeleton and cause a variety of skeletal deformities and disorders( Reference Brickett, Dahiya and Classen 3 ). These skeletal issues lead to an increase in mortality, financial loss, and result in poor animal well-being and welfare. A current line of thought to alleviate these leg issues is to slow weight gain in such a way as to promote mineralisation of the skeleton.
Dietary nutrient density is of the most important nutritional factors which have a significant effect on weight gain( Reference Zhao, Chen and Zhao 4 ) and walking ability( Reference Brickett, Dahiya and Classen 3 ) of poultry. Increasing dietary nutrient density accelerated weight gain of ducks( Reference Fan, Xie and Wang 5 ), but also resulted in higher incidence of gait abnormality( Reference Brickett, Dahiya and Classen 3 ). The intensive nutrition for rapid growth rate of weight in meat birds has been also suggested as the main cause of inadequate bone quality( Reference Williams, Waddington and Murray 6 ). Elliot & Edwards( Reference Elliot and Edwards 7 ) reported that feed withdrawal could remarkably decrease the incidence of TD of broiler chickens. Brickett et al.( Reference Brickett, Dahiya and Classen 3 ) noticed that a reduction in nutrient density of diets also alleviated the gait abnormality at 11 and 18 d of age in broilers. Therefore, it is possible that feeding a low-nutrient density (LND) diet may contribute to beneficial effects on tibia status for meat ducks.
Moreover, Ca plays critical roles in the development of bone and its strength for poultry( Reference Rath, Huff and Huff 8 ). Previous reports showed that increased dietary Ca improved tibia mineral contents and breaking strength in broiler chickens( Reference Abdulla, Loh and Akit 9 ). For the meat duck, Xie et al.( Reference Xie, Wang and Hou 10 ) found that the tibia ash of ducklings increased linearly or quadratically as dietary Ca increased from 3·0 to 12·0 g/kg. Ca deficiency and physical inactivity may retard bone mineralisation and be considered as a leading factor related to leg problems in poultry( Reference Onyango, Hester and Stroshine 11 , Reference Venäläinen, Valaja and Jalava 12 ). Thus, Ca-based supplements were used to improve bone health in domesticated birds( Reference Xie, Wang and Hou 10 , Reference Walk, Addo-Chidie and Bedford 13 ), and supplementation of Ca to promote tibial mineralisation for rapid growth ducks is justified.
Ca’s effect to improve skeletal health is likely due to its role in two physiological mechanisms. First, Ca promotes osteoblast proliferation and differentiation. Previous studies have shown that Ca-induced osteoblast activity is due to an increase in gene expression of both runt-related transcription factor 2 (Runx2) and osteocalcin in vitro ( Reference Aquino-Martínez, Artigas and Gámez 14 ). Second, Ca supplements decrease osteoclast activity to prevent bone reabsorption. The reduction in bone reabsorption is mainly due to a Ca-induced decrease in osteoclast number and activity( Reference Yoo, Kim and Song 15 ). Although very exciting findings in mammal, the role of Ca in osteoblast and osteoclast activity in meat ducks is currently not well understood. Therefore, our goals for this study were to first determine if an LND diet could slow weight gain and reduce tibia burden. Second, we set out to determine if a Ca supplement combined with an LND diet could affect osteoblast and/or osteoclast activity to increase tibial quality in meat ducks.
Methods
Experimental design and animal management
Care, handling and sampling procedures were approved by the Animal Care and Use Committee of Sichuan Agricultural University before initiation of the trial. A total of 720 1-d-old male Cherry Valley meat ducks, obtained from a local hatchery (Sichuan Mianying Breeding Duck Co. Ltd). All ducks were reared in cages (2·2×1·2×0·9 m) in a temperature- and humidity-controlled room and had free access to feed and water containing no detectable Ca throughout the experimental period.
Ducklings were all fed a standard commercial starter diet until day 14. At 15 d of age, all ducks were randomly divided into five treatment groups with eight replicate cages (eighteen ducks per cage, n 8 cages per experimental diet) for each treatment. The five experimental groups were as follows: (1) a standard nutrient density positive control (PC) containing 0·9 % Ca; (2) LND diet with 0·5 % Ca; (3) LND diet with 0·7 % Ca; (4) LND diet with 0·9 % Ca; (5) LND diet with 1·1 % Ca. The starter diet was formulated as suggested by China Agricultural Industry Standards( 16 ), which contained 12·15 MJ/kg metabolisable energy (ME), 200 g/kg crude protein (CP), 0·9 % Ca and 0·4 % available P; the PC and LND diets were also formulated according to the China Agricultural Industry Standards recommendations in which the contents of CP and essential nutrients such as limiting amino acids relative to ME were constant for 15–35 d (Table 1). The constant ME:CP ratio is equal to 167·59, which corresponded to PC and LND diets, respectively, containing 12·27 MJ/kg ME, 175 g/kg CP and 11·10 MJ/kg ME, 158 g/kg CP. The PC and LND diets possessed the same available P content (0·4 %) that recommended by China Agricultural Industry Standards. Diets were provided in pellet form, and the diameter of the pellets was 2 mm in the starter diet (1–14 d) and 3 mm in the grower diet (15–35 d). Body weight (BW) and feed intake were recorded at days 14 and 35, and feed:gain was calculated during the 35-d feeding period. The mortality due to leg deformations, which is defined as the percentage of mortality and culled ducks due to tibia deformations and fractures, also was recorded during feeding period on a pen basis.
Composition and analysis of the diets (DM basis)

PC, positive control; DDGS, distiller’s dried grains with solubles; AME, apparent metabolisable energy; CP, crude protein; TD, true digestibility.
* Provided per kg of diet: retinol, 2·06 mg; cholecalciferol, 0·041mg; vitamin E, 30·01 mg; thiamine, 1 mg; riboflavin, 3·9 mg; pyridoxine, 3·375 mg; vitamin B12, 0·01 mg; calcium pantothenate, 8·85 mg; folate, 0·5 mg; biotin, 0·1 mg; niacin, 49·25 mg.
† Provided per kg of diet: Cu (CuSO4.5H2O), 8 mg; Fe (FeSO4.7H2O), 80 mg; Zn (ZnSO4.7H2O), 90 mg; Mn (MnSO4.H2O), 70 mg; Se (NaSeO3), 0·3 mg; iodine (KI), 0·4 mg.
Sample collection
At the end of the experiment (day 35) ducks were euthanised by cervical dislocation. A total of eight birds (one duck per pen) were randomly selected for tibial histology and the incidence and severity of TD determination. Another eight ducks per treatment were fasted for 12 h before euthanasia and blood was collected via the jugular vein. Blood was centrifuged at 3500 g /15 min at 4°C to obtain serum and stored at −20°C for later analyses. The remaining ducks were euthanised and their left tibial bones (the proximal end) were dissected and immediately flash-frozen in liquid N2 for mRNA analyses. The right tibias were removed, cleared carefully all the muscle and connective tissue and the fresh weight determined. The length and diameter of the tibias were then measured using a vernier caliper. Tibial length was defined as the vertical distance from the most superior point on the medial tibial condyle to the most inferior point on the medial malleolus. Tibia diameter was defined as the vertical distance of midshaft of the left tibia.
Evaluation of tibial dyschondroplasia
TD score was assessed in tibias according to method of Edwards & Veltmann( Reference Edwards and Veltmann 17 ). Briefly, all right tibias were cut longitudinally at the proximal end, and the evaluation of the development of TD was performed using a score based on the total amount of plugs of cartilage (0=normal bones with no cartilage lesions, 1=cartilage developed in up to one third of the cut area, 2=cartilage developed in one third to one half of the cut area, 3=cartilage developed in more than one half of the cut area). The incidence of TD was calculated as a percentage with TD score >0 (no apparent TD) based on system of Edwards & Veltmann( Reference Edwards and Veltmann 17 ).
Tibia-breaking strength
The right tibias were used to the tibia-breaking strength analysis using three-point method with a TA-XTPlus Texture Analyser (TA.XT Plus; Stable Microsystems). The tibia was rested on two points with a gap of 50 mm and pressure was applied with pressure sensitive load cell (50 kg) at the center of the two points, and the blade perpendicularly hit the tibia at its midpoint at a test speed of 5 mm/s for a distance of 30 mm.
Defatted weight and density analysis
After undergoing the breaking strength determination, the bone fragments were collected and used for tibia defatted weight and tibia density evaluation based on a modified method described by Zhang et al.( Reference Zhang, Liao and Zeng 18 ). Briefly, the bone cavities fluid tibia was removed with absorbent paper, and the volume was measured based on quantum of water overflowing from a fully filled container when measured tibia is inserted in 100 ml measuring cylinders. Subsequently these tibias were air-dried for 24 h at room temperature, extracted by refluxing diethyl ether in a Soxhlet apparatus for 16 h, oven-dried at 108°C for 24 h for dry defatted bone weight determination, thus the tibia density (g/cm3) was calculated as: tibia defatted weight (g)/tibia volume (cm3).
Sternum ash content, and calcium and phosphorus concentration
Dry-defatted tibia was ashed in a muffle furnace at 550°C for 24 h and the ash was measured on the basis of the percentage of dry-defatted weight. Ca and P contents were determined through EDTA titration and ammonium metavanadate colorimetry, respectively, and values were also presented base on the basis of dry-defatted weight.
Histology and tartrate-resistant acid phosphatase staining
Tibias (n 8 per treatment group) were fixed with 4 % paraformaldehyde, decalcified with 10 % EDTA (Sigma), dehydrated, and embedded in paraffin wax. The paraffin blocks were cut into 5-μm-thick sections, stained with toluidine blue, mounted on slides and observed for histopathological signs. Tartrate-resistant acid phosphatase (TRAP) staining was also performed using the leukocyte acid phosphatase assay kit (Sigma Chemical Co.) according to instructions. The photomicrographs of bone sections were taken using a microscope (Nikon Eclipse TS100; Nikon Corporation) and an image analyzer (Media Cybernetics Image Pro-Plus) at a magnification of 100×. Assessment of bone static histomorphometric parameters were performed by an individual unaware of the treatment groups using Weibel grid technique. The static parameters measured included the percentage of trabecular area (%Tb.Ar), trabecular number; trabecular thickness (Tb.Th) and trabecular separation (Tb.Sp), osteoblast number per 1 mm2 bone area (Ob.N/B.Ar) and osteoclast number per 1 mm2 bone area (Oc.N/B.Ar). These protocols for bone histomorphometry have been described elsewhere( 16 ).
Blood analysis
Serum Ca, P concentration were measured with Bio-chemistry Analyzer (Yellow Springs Instrument Co. Inc.). Serum bioactive intact parathyroid hormone (PTH) and calcitonin (CT) level were measured using commercial ELISA kits gained from LifeSpan BioSciences Inc. And serum total vitamin D3 levels was measured using an enzyme linked protein binding assay kit (ALPCO Diagnostics) according to the manufacturer suggested protocol. In addition, bone turnover markers including serum alkaline phosphatase (ALP) activity, osteocalcin, bone morphogenetic protein 2 (BMP-2) and TRAP activity determination were also assessed by a commercial assay kit (Nanjing Jiancheng Bioengineering Institute) according to the manufacturer’s specifications.
Quantitation of mRNA using real-time PCR
Total RNA was extracted from frozen the proximal end of tibia according to the manufacturer’s specifications. The RNA quality (intact ribosomal RNA 28s/18s) was evaluated by agarose gel electrophoresis, and RNA concentrations were quantified using a spectrophotometer (NanoDrop 2000; Thermo Fisher Scientific Inc.). First-strand complementary DNA (cDNA) was reverse-transcribed from 200 ng of total RNA using the PrimeScript™ RT Reagent Kit (Takara). The obtained cDNA was used to determine the tibia mRNA levels of phosphate regulating endopeptidase homolog x-linked (Phex), dentin matrix protein 1 (Dmp1), sclerostin (Sost), alpha-type I collagen (COL1), ALP, osteocalcin, Runx2, cathepsin K, vacuolar-type H+-ATPase (V-ATPase), osteoprotegerin (OPG) and receptor activator of NF-κB (RANK). Primers were designed using Primer 3 and were shown in Table 2, subsequently, the quantitative RT-PCR was performed on an ABI 7500 Real-Time PCR detection system (Applied Biosystems) according to previously described procedures( Reference Zhang, Gilbert and Pan 19 ). The amplification program was 95°C/15 min, followed by forty cycles of 95°C/5 s and 60°C/30 s, and a final melting curve analysis. All reactions were run in duplicate, and a standard curve was generated to estimated reaction efficiency (slope) and gene expression. A total of three housekeeping genes (glyceraldehyde-3-phosphate dehydrogenase, ribosomal protein S9 and β-actin) were assessed for stability of expression using two separate cDNA from each treatment (data not shown). The glyceraldehyde-3-phosphate dehydrogenase and β-actin were selected as the reference genes, and a normalisation factor was obtained by calculating the geometric mean of the values of the selected reference genes, which was subsequently used to normalise the relative amounts of RNA of interest( Reference Vandesompele, De Preter and Pattyn 20 ).
The primers for quantitative real-time PCR
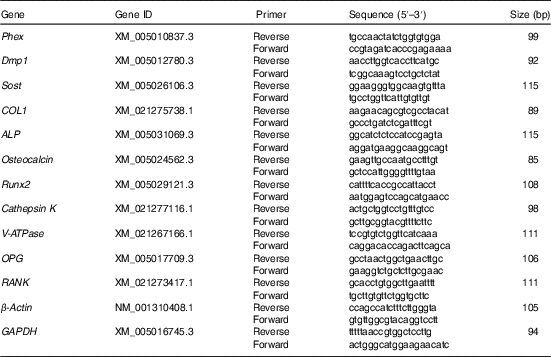
Phex, phosphate regulating endopeptidase homolog x-linked; Dmp1, dentin matrix protein 1; Sost, sclerostin; COL1, alpha-type I collagen; ALP, alkaline phosphatase; Runx2, runt-related transcription factor 2; V-ATPase, vacuolar-type H+-ATPase; OPG, osteoprotegerin; RANK, receptor activator of NF-κB; GAPDH, glyceraldehyde-3-phosphate dehydrogenase.
Statistical analysis
In this study, each pen was used as the experimental unit. Statistical power of 0·80 (80 %) was obtained by estimating forty ducks which were selected from each pen (eight ducks per treatment) when the minimally detectable effect size was 1·0 and the significance level was 0·05. The data were checked for normal distribution and homogeneity of variance using the Shapiro–Wilk and Levene’s tests, respectively, in SAS 8.1 (SAS Institute). Here, a $\sqrt {n{\plus}1} $
and an arcsine transformation were applied to mortality data and percentages of TD incidence, respectively. When the data were recognised as normally distributed and exhibited homogeneity of variance, data of 0·5, 0·7, 0·9 and 1·1 % Ca in LND diet groups were analysed using one-way ANOVA and Tukey’s post hoc test. Data of the PC diet group and 0·9 % Ca in the LND diet group were analysed with contrast analysis. Differences were considered significant when P was <0·05. Results were expressed as the means with their standard errors. SAS software was used to perform the statistical analysis, and graphic design were performed using GraphPad Prism 7.
$\sqrt {n{\plus}1} $
and an arcsine transformation were applied to mortality data and percentages of TD incidence, respectively. When the data were recognised as normally distributed and exhibited homogeneity of variance, data of 0·5, 0·7, 0·9 and 1·1 % Ca in LND diet groups were analysed using one-way ANOVA and Tukey’s post hoc test. Data of the PC diet group and 0·9 % Ca in the LND diet group were analysed with contrast analysis. Differences were considered significant when P was <0·05. Results were expressed as the means with their standard errors. SAS software was used to perform the statistical analysis, and graphic design were performed using GraphPad Prism 7.
Results
Body weight gain and intakes of food
No differences among the PC and LND groups in BW were observed at day 14. At day 35, the PC diet resulted in a higher BW, gain, and a better feed conversion ratio (P<0·05) compared with the LND diet with 0·9 % Ca groups. Regardless of percentage, Ca supplement in LND had no significant effect on BW, gain, feed intake and feed conversion ratio (Table 3).
Effect of graded calcium supplementation in low-nutrient density (LND) feed on duck performance (Mean values with their standard errors)

PC diet, standard nutrient density positive control diet.
* Significant difference in PC v. LND diet with 0·9 % Ca (one-way ANOVA, P<0·05, Tukey’s post hoc test).
Leg weakness and tibia characteristics
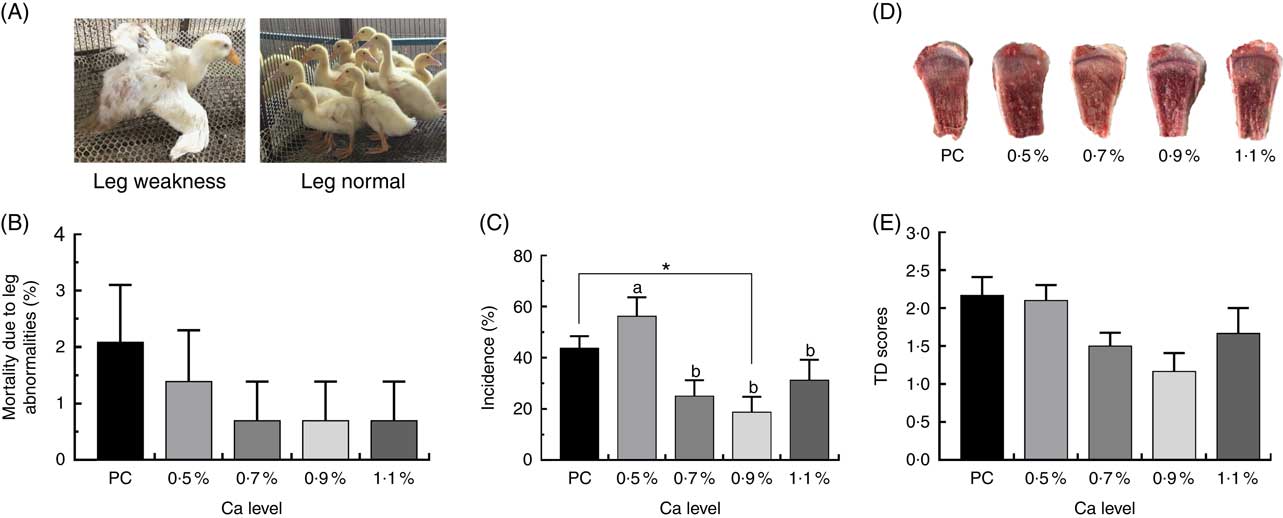
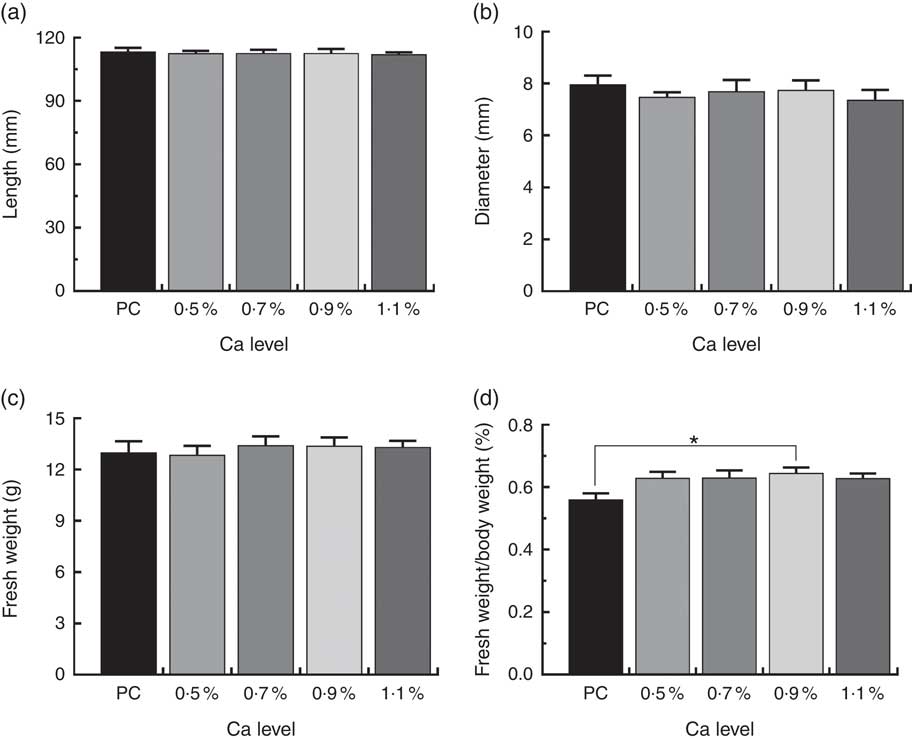
As illustrated in Fig. 1, birds fed the PC diet had slight higher mortality due to leg abnormalities and TD score (P>0·05), and remarkably higher the incidence of TD (P<0·05) compared with those fed the LND diet with 0·9 % Ca. When compared with the 0·5 % Ca LND diet group, addition of 0·7 and 0·9 % Ca in the the LND diet slightly decreased the leg abnormality and score of TD, and supplementation of ≥0·7 % Ca in the LND diet significantly decreased the incidence of TD. Ca supplementation in the LND diet significantly increased the ratio of tibia fresh weight and BW (P<0·05), but had no remarkable effect on length, diameter and fresh weight of tibia (P>0·05) (Fig. 2).
Mortality due to leg abnormalities (A, B), incidence of tibial dyschondroplasia (TD) (C) and TD score (D, E) of meat ducks that received a positive control (PC) diet, and four low-nutrient density (LND) diets with 0·5, 0·7, 0·9 and 1·1 % Ca, respectively. Values are means, with their standard errors represented by vertical bars (one-way ANOVA, P<0·05, Tukey’s post hoc test). * Significant difference in PC v. LND diet with 0·9 % Ca. a,b Mean values with unlike letters were significantly different among four LND diets with 0·5, 0·7, 0·9 and 1·1 % Ca (P=0·036).
Tibia length (a), tibia diameter (b), fresh weight (c) and relative fresh weight (d) of meat ducks that received a positive control (PC) diet, and four low-nutrient density (LND) diets with 0·5, 0·7, 0·9 and 1·1 % Ca, respectively. Values are means, with their standard errors represented by vertical bars (one-way ANOVA, P<0·05, Tukey’s post hoc test). * Significant difference in PC v. LND diet with 0·9 % Ca.
Serum calcium, phosphorus and calciotropic hormones
The levels of serum Ca, P and calciotropic hormones are shown in Table 4. The LND diet with 0·5 % Ca showed significantly (P<0·05) lower serum Ca levels and significantly (P<0·05) increased serum PTH and vitamin D3 levels compared with other LND diet groups. The ≥0·7 % Ca supplement added to the LND diet significantly (P<0·05) increased serum Ca content and decreased serum PTH and total vitamin D3 levels. None of the experimental diets had any effect on the serum levels of P or CT during this trial.
Effect of graded calcium supplementation in low-nutrient density (LND) feed on serum calcium, phosphorus and calciotropic hormones (Mean values with their standard errors)

PC diet, standard nutrient density positive control diet; PTH, parathyroid hormone; CT, calcitonin.
a,b Mean values with unlike superscript letters were significantly different among four LND diets with 0·5, 0·7, 0·9 and 1·1 % Ca (one-way ANOVA, P<0·05, Tukey’s post hoc test).
* Significant difference in PC v. LND diet with 0·9 % Ca.
Mineral deposition
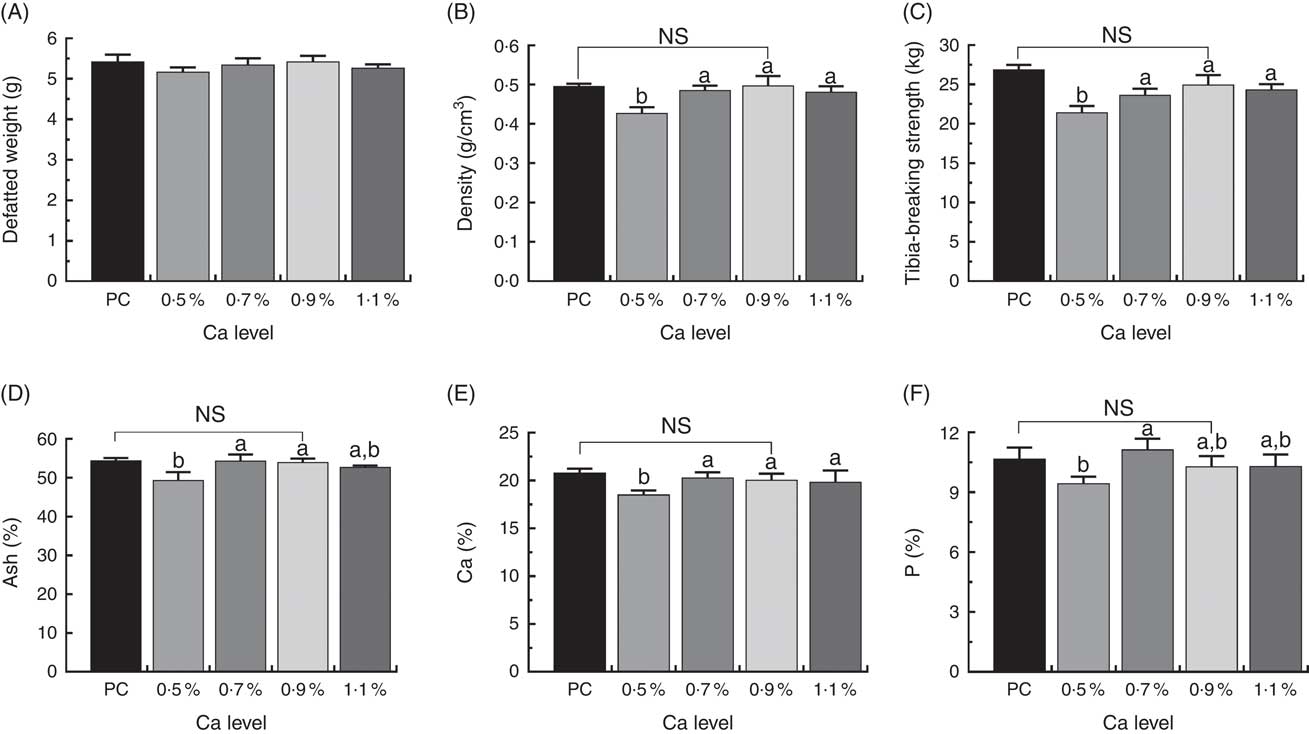
Tibial defatted weight (g) was comparable among all the treatments, and birds fed LND diets with 0·9 % Ca did not exhibit apparent increases in mineral content, density and strength of whole tibia compared with those fed the PC diet. However, the LND diet with 0·5 % Ca decreased tibia density (g/cm3), ash (%), Ca (%), P (%) and tibia-breaking strength (kg) relative to other LND diets (P>0·05) (Fig. 3).
Tibia defatted weight (A), tibia density (B), tibia-breaking strength (C), tibia ash (D), tibia calcium (E) and tibia phosphorus (F) level of meat ducks that received a positive control (PC) diet, and four low-nutrient density (LND) diets with 0·5, 0·7, 0·9 and 1·1 % Ca, respectively. Values are means, with their standard errors represented by vertical bars (one-way ANOVA, P<0·05, Tukey’s post hoc test). NS, not significant difference in PC v. LND diet with 0·9 % Ca. a,b Mean values with unlike letters were significantly different among four LND diets with 0·5, 0·7, 0·9 and 1·1 % Ca (P<0·05).
Histology of the tibia
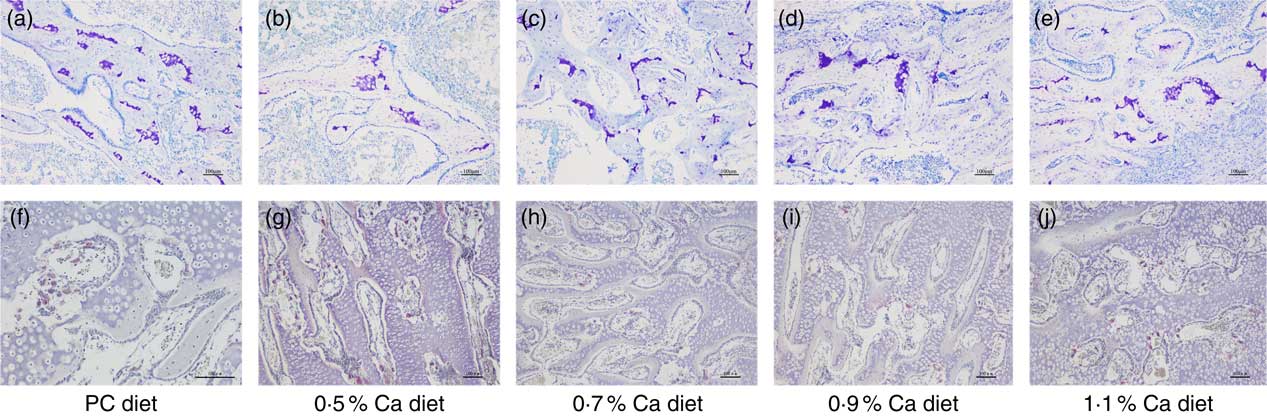
Observations of tibia sections taken from the cancellous bone of proximal tibia showed that the bone marrow space was more occupied by the trabecular bone structure in a relatively uniform manner, and they formed a well-connected network within the cancellous bone in the LND diet with 0·7, 0·9 and 1·1 % Ca (Fig. 4(a)–(e)). In addition, a few osteoclasts in the inner surface of the cancellous bone and around the trabeculae were also seen in the 0·7, 0·9 and 1·1 % Ca LND diets groups (Fig. 4(f)–(j)), these cells were characterised as being TRAP-positive.
Toluidine blue staining (a–e) and tartrate-resistant acid phosphatase staining (f–j) of proximal tibia cancellous bone of meat ducks that received a positive control (PC) diet, and four low-nutrient density diets with 0·5, 0·7, 0·9 and 1·1 % Ca, respectively. Original magnification: ×100.
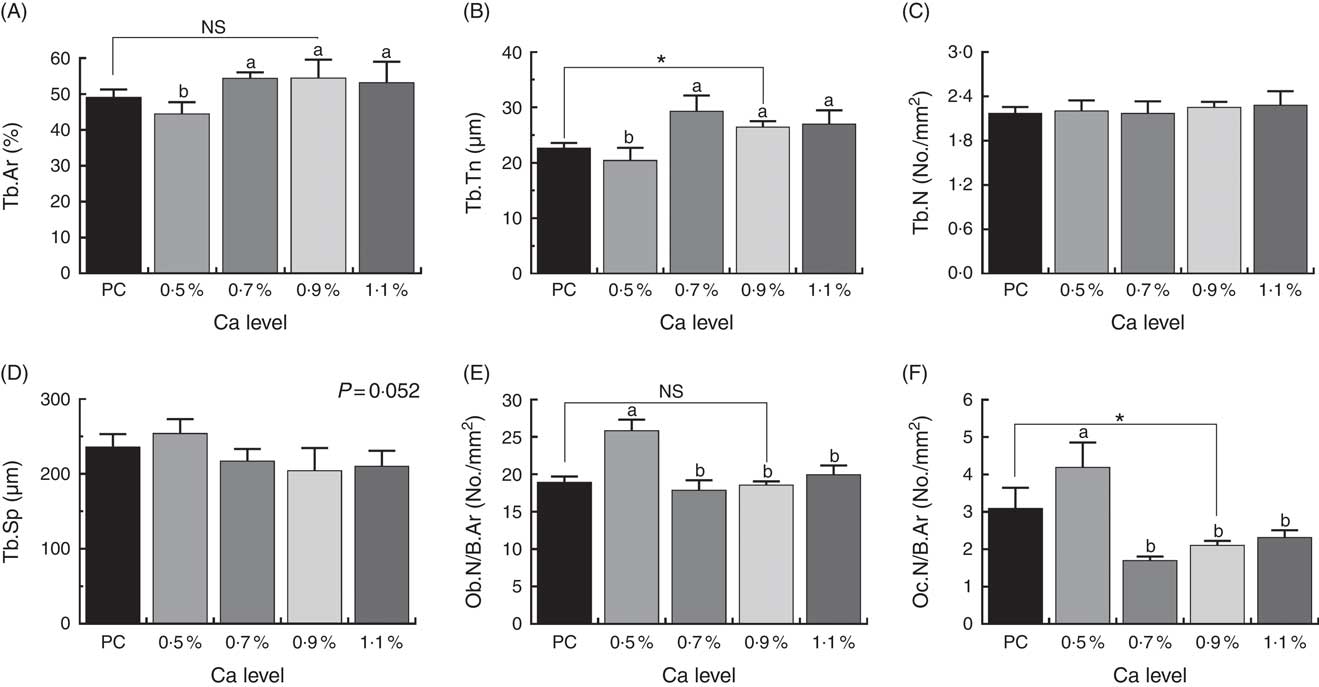
Structural histomorphometric parameters of tibia
Histomorphometric parameters of cancellous bone of proximal tibia are shown in Fig. 5. The LND diet with 0·9 % Ca significantly increased Tb.Th and decreased Oc.N/B.Ar of the proximal tibia compared with the PC diet (P<0·05). Also, the addition of 0·7, 0·9 and 1·1 % Ca in the LND diet significantly increased the %Tb.Ar and Tb.Th (P<0·05), and decreased Tb.Sp (P=0·052), Ob.N/B.Ar and Oc.N/B.Ar of the proximal tibia (P<0·05) compared with the 0·5 % Ca LND diet.
Tibial microstructure analyses including percentage of trabecular area (%Tb.Ar) (A), trabecular thickness (Tb.Th) (B), trabecular number (Tb.N) (C), trabecular separation (Tb.Sp) (D), osteoblast number per 1 mm2 bone area (Ob.N/B.Ar) (E) and osteoclast number per 1 mm2 bone area (Oc.N/B.Ar) (F) of meat ducks that received a positive control (PC) diet, and four low-nutrient density (LND) diets with 0·5, 0·7, 0·9 and 1·1 % Ca, respectively. Values are means, with their standard errors represented by vertical bars (one-way ANOVA, P<0·05, Tukey’s post hoc test). NS, not significant difference. * Significant difference in PC v. LND diet with 0·9 % Ca. a,b Mean values with unlike letters were significantly different among four LND diets with 0·5, 0·7, 0·9 and 1·1 % Ca (P<0·05).
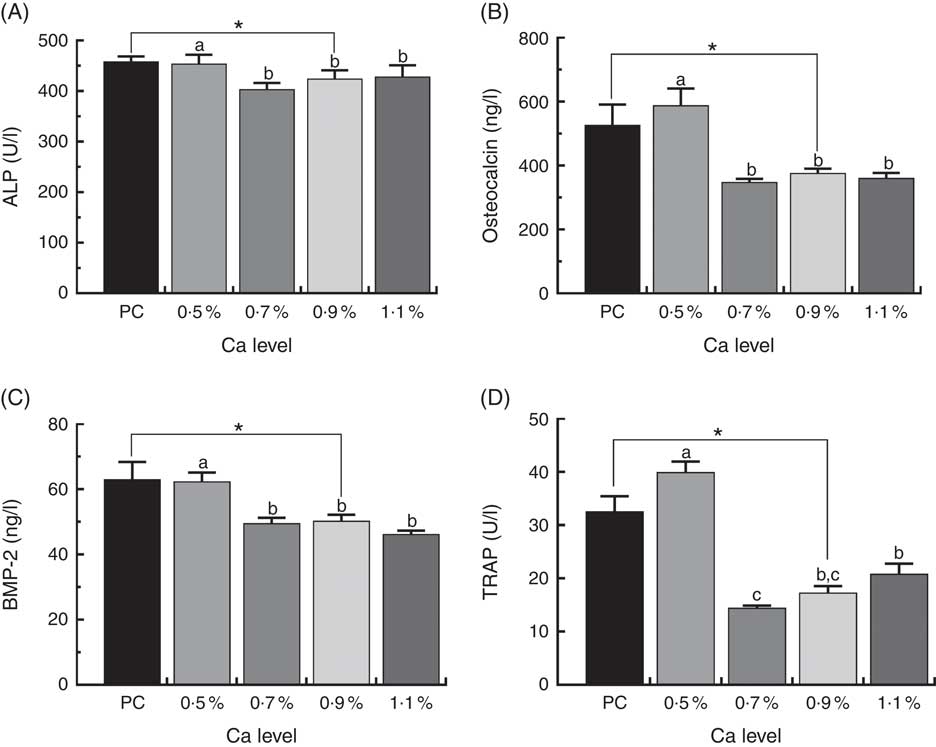
Biomarkers of bony matrix turnover of serum
Biomarkers in duck serum are shown in Fig. 6. Serum osteocalcin and BMP-2 level, ALP and TRAP activity was much higher in the ducks fed the PC diet than whose fed the LND diet with 0·9 % Ca (P<0·05). Supplementation with ≥0·7 % Ca in the LND diet decreased serum ALP activity (P>0·05), and significantly declined serum osteocalcin, BMP-2 and TRAP activity (P<0·05) compared with the 0·5 % Ca LND diet.
Serum concentrations of alkaline phosphatase (ALP) (A), osteocalcin (B), bone morphogenetic protein 2 (BMP-2) (C) and tartrate-resistant acid phosphatase (TRAP) (D) of meat ducks that received a positive control (PC) diet, and four low-nutrient density (LND) diets with 0·5, 0·7, 0·9 and 1·1 % Ca, respectively. Values are means, with their standard errors represented by vertical bars (one-way ANOVA, P<0·05, Tukey’s post hoc test). * Significant difference in PC v. LND diet with 0·9 % Ca. a,b,c Mean values with unlike letters were significantly different among four LND diets with 0·5, 0·7, 0·9 and 1·1 % Ca (P<0·05).
Expression of osteocyte-specific marker genes
The expressions of osteocyte-specific gene Phex, Dmp1 and Sost in the tibial proximal metaphysis in ducks are shown in Fig. 7. Addition of ≥0·7 % Ca in the LND diet up-regulated osteocyte-specific gene expression compared with the 0·5 % Ca LND diet. In particular, the mRNA expression level of Dmp1 and Sost was both approximately 1·5-fold higher than that of the 0·5 % Ca LND diet group. Furthermore, in the 0·9 % Ca LND diet group, the expression level of Sost significantly increased compared with that of the PC diet group (Fig. 7(C)).
mRNA expression of phosphate regulating endopeptidase homolog x-linked (Phex) (A), dentin matrix protein 1 (Dmp1) (B) and sclerostin (Sost) (C) of meat ducks that received a positive control (PC) diet, and four low-nutrient density (LND) diets with 0·5, 0·7, 0·9 and 1·1 % Ca, respectively. Values are means, with their standard errors represented by vertical bars (one-way ANOVA, P<0·05, Tukey’s post hoc test). NS, not significant difference. * Significant difference in PC v. LND diet with 0·9 % Ca. a,b Mean values with unlike letters were significantly different among four LND diets with 0·5, 0·7, 0·9 and 1·1 % Ca (P<0·05).

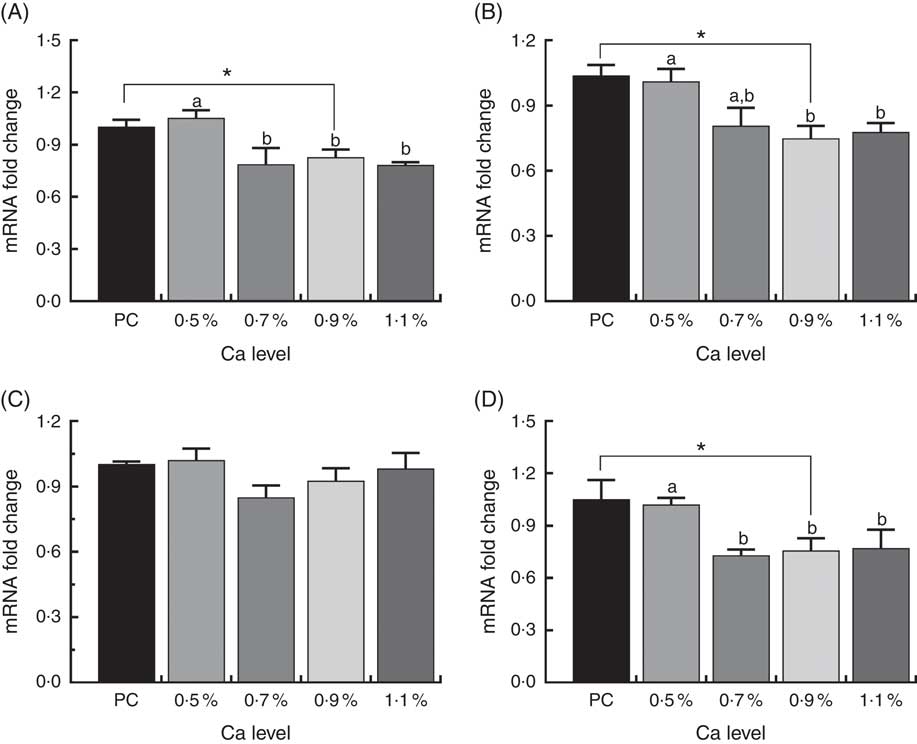
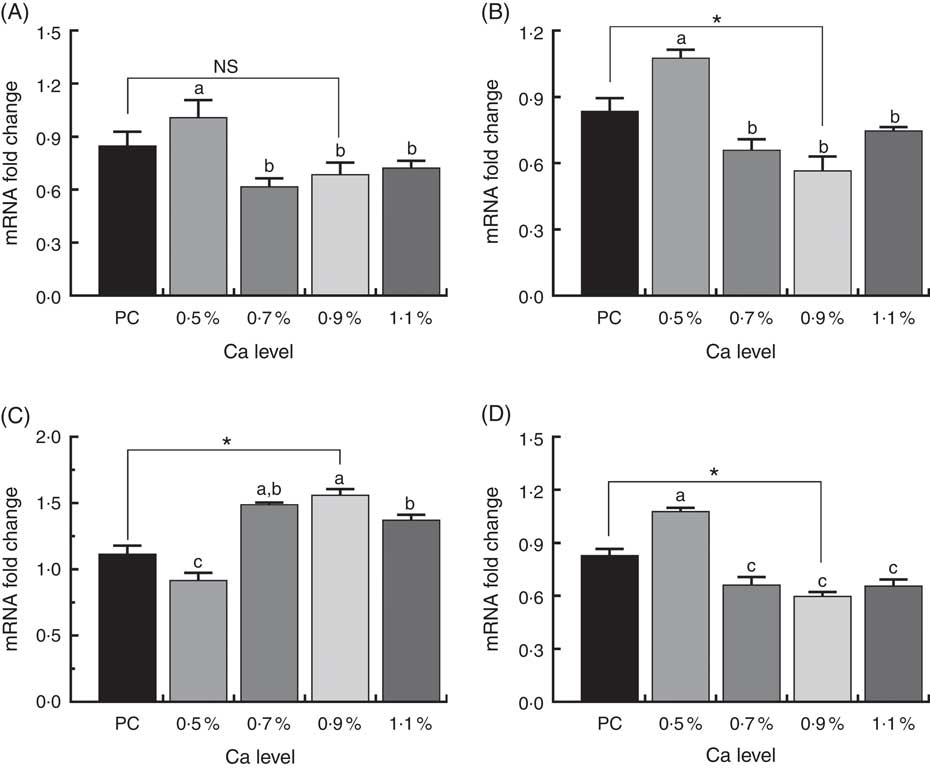
Expression of osteoblastogenesis marker genes
As shown in Fig. 8, in the 0·7, 0·9 and 1·1 % Ca LND diet groups mRNA expression of Runx2, COL1 and osteocalcin were down-regulated compared with that in the 0·5 % Ca LND diet group. Also, the mRNA expression level of Runx2, COL1 and osteocalcin of the 0·9 % Ca LND diet group was also significantly decreased compared with the PC diet group. None of the experimental diets had any effect on the transcriptional levels of ALP during this trial.
mRNA expression of runt-related transcription factor 2 (Runx) (A), type I collagen (COL1) (B), alkaline phosphatase (ALP) (C) and osteocalcin (D) of meat ducks that received a positive control (PC) diet, and four low-nutrient density (LND) diets with 0·5, 0·7, 0·9 and 1·1 % Ca, respectively. Values are means, with their standard errors represented by vertical bars (one-way ANOVA, P<0·05, Tukey’s post hoc test). * Significant difference in PC v. LND diet with 0·9 % Ca. a,b Mean values with unlike letters were significantly different among four LND diets with 0·5, 0·7, 0·9 and 1·1 % Ca (P<0·05).
Osteoclast-specific and osteoprotegerin/receptor activator of NF-κB genes expression
The expression of osteoclast-specific genes V-ATPase, cathepsin K and OPG/RANK in the proximal metaphysis of duck tibia are shown in Fig. 9. We observed a highly significant decrease in V-ATPase, cathepsin K and RANK expression, but markedly up-regulated OPG mRNA expression in the 0·7, 0·9 and 1·1 % Ca LND diet groups compared to in the 0·5 % Ca LND diet group. When compared with the PC diet, the 0·9 % Ca LND diet significantly increased OPG mRNA expression and significantly decreased cathepsin K and RANK expression in this study.
mRNA expression of vacuolar-type H+-ATPase (V-ATPase) (A), cathepsin K (B), osteoprotegerin (OPG) (C) and receptor activator of NF-κB (RANK) (D) of meat ducks that received a positive control (PC) diet, and four low-nutrient density (LND) diets with 0·5, 0·7, 0·9 and 1·1 % Ca, respectively. Values are means, with their standard errors represented by vertical bars (one-way ANOVA, P<0·05, Tukey’s post hoc test). NS, not significant difference. * Significant difference in PC v. LND diet with 0·9 % Ca. a,b,c Mean values with unlike letters were significantly different among four LND diets with 0·5, 0·7, 0·9 and 1·1 % Ca (P<0·05).
Discussion
By examining the effect of graded Ca supplementation in LND feed on tibia composition and bone turnover in meat ducks, we putted forward the LND diets with at least 0·7 % could reduce bone turnover and increase tibial quality of meat ducks for the first time, and the principal outcome from this study was that the LND diet increased the tibial relative weight and decreased the incidence of TD compared with the PC diet, and LND diets with ≥0·7 % Ca significantly improved tibia composition and microscopic structures of the tibia and decreased bone turnover, which subsequently increased tibial quality for 35-d-old meat ducks. It is important for treating several leg diseases and further improvement meat duck production.
Throughout the poultry industry, increasing nutrient density has brought about significant improvements in growth performance. The direct effect of nutrient density on weight gain has been shown in meat ducks( Reference Cherry and Morris 1 ). Our current study has corroborated these observations in that higher nutrient density (PC diet) induced heavier weights in meat ducks. However, pursuing for rapid growth is also widely thought to be associated with increased leg problems of birds( Reference Shim, Karnuah and Mitchell 21 ). Detection of mortality due to leg abnormalities, the incidence and severity of TD in the current study suggested that the PC diet resulted in higher mortality and incidence of TD compared with the 0·9 % Ca LND diet (Fig. 1). Similar findings were reported by Elliot & Edwards( Reference Elliot and Edwards 7 ) and Brickett et al.( Reference Brickett, Dahiya and Classen 3 ) who observed increasing of dietary nutrient density or feed intake could remarkably increase in TD incidence or gait abnormality in broiler chicks.
Increasing the relative tibial fresh weight was also noticed in the 0·9 % Ca LND diet relative to the PC diet, the accompanying parallels morphological parameters and fresh weight seen in this study does suggest low BW as a main cause (Fig. 2). It is well-established that the relationship between body mass and organ size is crucial to our understanding of animal physiology, because physical scaling rules determine the structural and functional consequences of changes in size and therefore exert a profound effect on organismal form( Reference Schmidt-Nielsen 22 ). In the modern meat duck industry, artificial selection has resulted in developmental trade-offs; reallocation of resources to maximise nutrient absorption and muscle mass has coincided with a relative decrease in the size of other organs, including bone( Reference Tickle, Paxton and Rankin 23 ). If so, an increase in relative tibia fresh weight could be considered to be a contributing factor in decreasing tibia load and leg problems of meat ducks.
Ca has important biological roles in the development of bone and its strength for poultry( Reference Rath, Huff and Huff 8 ), suboptimal levels of dietary Ca reduced tibia ash in broiler chickens( Reference Coto, Yan and Cerrate 24 ), and sufficient amounts of Ca significantly promoted mineral deposition in bone( Reference Theobald 25 ). Given this, the National Research Council( 26 ) and the China Agricultural Industry Standards( 16 ) estimate for the Ca and available P requirement of grower ducks (15–35 d) are 0·6, 0·35, 0·85, 0·4 %, respectively. In the current study, we observed that birds fed 0·5 % Ca in the LND diet decreased tibial ash and Ca and P content. These observations suggested that lower concentrations of Ca (0·5 %) in the LND diet were adverse to the development of the tibia and increased the incidence of TD. Here, the improper ratios (5:4) in the LND diet with 0·5 % Ca were probably a causative factor for leg abnormalities. In line with the current findings, Edwards & Veltmann( Reference Edwards and Veltmann 17 ) reported that diets containing high P and low Ca levels led to higher incidence of TD in young chicks. Alternatively, increased Ca levels in LND diets (0·7 % Ca or greater) significantly increased the mineralisation of the tibia as well as increased the tibial density and strength in meat ducks, and concurrently decreased the incidence and score of TD in this study.
Observations of proximal tibia showed that the bone marrow space was more occupied by the trabecular bone structure in a relatively uniform manner, and they formed a well-connected network within the cancellous bone in the LND diet with 0·7, 0·9 and 1·1 % Ca. Furthermore, histomorphometric results also suggested that the LND diet with 0·5 % Ca resulted in a loss of cancellous bone, that was characterised by decreased %Tb.Ar and Tb.Th, and increased Tb.Sp. Our observations are consistent with previous studies. For example, Iwamoto et al.( Reference Iwamoto, Takeda and Sato 27 ) showed that a low (0·1 % v. normal 0·5 %) Ca diet reduced cancellous bone volume of young rats. Lv et al.( Reference Lv, Yang and Ma 28 ) reported that feeding a 3·35 % Ca diet improved bone quality of caged layers via an increase in the %Tb.Ar and Tb.Th, and significantly decreasing Tb.Sp compared with their low-Ca diet (1·27 %).
We have shown that an LND diet that has at least 0·7 % Ca decreased serum ALP, TRAP and osteocalcin levels. ALP and osteocalcin secreted by osteoblasts and was essential for bone mineralisation( Reference Cepelak and Cvoriscec 29 ). Increased ALP and osteocalcin levels in serum has been observed in conditions such as rapid bone loss and fracture risk, which reflects the acceleration of osteoblastic activity and bone turnover( Reference Ross, Kress and Parson 30 , Reference Kanbur, Derman and Sen 31 ). The decreased serum ALP and osteocalcin levels in ≥0·7 % Ca in the LND diet implied that abundant osteoblasts were transformed into osteocytes, because both were mainly secreted by osteoblasts and not osteocytes( Reference Cepelak and Cvoriscec 29 ). TRAP, an important bone resorption marker, was highly correlated with resorptive activity in disorders of bone metabolism( Reference Li, Hao and Wu 32 ). Previous studies have shown that TRAP was significantly elevated in patients with osteoporosis and had a significant negative correlation with bone mineral density( Reference Halleen, Ylipahkala and Alatalo 33 ). In addition, immunohistochemical evidence in bone tissue also showed that ≥0·7 % Ca in the LND diet decreased TRAP activity, Ob.N/B.Ar and Oc.N/B.Ar relative to the 0·5 % Ca group. Thus, our data indicate that ≥0·7 % Ca in the LND diet probably decreased bone turnover with decreased osteoblastic and osteoclastic recruitment and subsequently decreased ash, Ca and P content of tibia( Reference Peterson, Eurell and Kelley 34 ).
Osteoblasts are primary cells related to bone mineralisation, which is defined as a biological process of Ca and P in the shape of hydroxyapatite deposition within or outside the osteocytes. Here, as with hydroxyapatite deposition osteoblasts become surrounded by hydroxyapatite, and they reach their differentiation endpoint, switching to an osteocyte phenotype, which is characterised by Phex, Dmp1 and Sost( Reference Bonewald 35 ). The present study demonstrated that the LND diet with ≥0·7 % Ca induced Phex, Dmp1 and Sost mRNA expression, suggesting that more osteoblasts evolved into osteocytes in tibial tissue. Accordingly, the osteoclast-specific genes, including especially osteocalcin, COL1 and ALP, are involved in the formation, metabolism and regeneration of bone( Reference Xiong, Yang and Feng 36 ). BMP-2, an important growth factor, modulates osteoblast differentiation through stimulating osteoblast-related transcriptional factors, including Runx2( Reference Li, Hao and Wu 32 ). Many studies have shown that Ca induced BMP-2 and Runx2 mRNA expression, and genes related to osteoblast development, such as osteocalcin and COL1 in ovariectomised rats( Reference Yoo, Kim and Song 15 ) as well as in bone marrow-derived mesenchymal stem cell( Reference Aquino-Martínez, Artigas and Gámez 14 ). Our findings conflict previous reports in that we showed that ≥0·7 % Ca in the LND diet decreased serum BMP-2 level, tibial Runx2, COL1, ALP and osteocalcin mRNA expression, suggesting ≥0·7 % Ca supplement in the LND diet restrained osteoblast differentiation and depressed the BMP-2/Runx2 signalling pathway. These observations could be related to lower bone turnover rate and, therefore, the increased tibial mass observed. Similar observations were made in response to 1·8–16·2 mM Ca ions that down-regulated in Runx2, COL1 and ALP mRNA in human dental pulp cells( Reference An, Gao and Ling 37 ). Binding these results, ≥0·7 % Ca in the LND diet possibly depressed bone formation in meat ducks.
Osteoclasts have been shown previously to be responsible for bone resorption through secreting proteases( Reference Everts, Delaissé and Korper 38 ) and hydrogen ions (H+)( Reference Riihonen, Supuran and Parkkila 39 ), which was regulated by V-ATPases and cathepsin K( Reference Fujisaki, Tanabe and Suzuki 40 ). Increased V-ATPases and cathepsin K activity have been used as valuable indicators of intense resorption. The present study demonstrated that the LND diet with ≥0·7 % Ca decreased V-ATPases and cathepsin K mRNA expression compared with the LND diet with ≥0·5 % Ca group. These results were in agreement with those of previous studies showing that the presence of high extracellular concentrations of Ca decreased mRNA expression of cathepsin K ( Reference Shin, Kim and Kim 41 ). TRAP is an Fe-binding protein that is highly expressed in osteoclasts and induced in differentiation of osteoclasts( Reference Sapkota, Li and Choi 42 ). Receptor activator of NF-κB ligand (RANKL) binds to the RANK to induce the differentiation and fusion of osteoclast precursor cells, whereas OPG acts as a decoy receptor by blocking the interaction of RANKL and RANK( Reference Yamamoto, Udagawa and Matsuura 43 ). Our results shown that the LND diet with ≥0·7 % Ca decreased serum TRAP activity and RANK mRNA expression, but up-regulated OPG transcript level in relative to the 0·5 % Ca the LND diet, indicated that the LND diet with ≥0·7 % Ca inhibited osteoclast proliferation and differentiation. TRAP staining and histomorphometric examination also directly suggested that the LND diet with ≥0·7 % Ca could decreased the number of osteoclast. This observation is in agreement with the findings of Yoo et al.( Reference Yoo, Kim and Song 15 ) which showed that increasing dietary Ca significantly decreased RANK transcription level and TRAP staining compared with the low Ca group. It is probably due to the high Ca concentrations directly stimulated osteoclast apoptosis or/and inhibited osteoclast differentiation( Reference Mentaverri, Yano and Chattopadhyay 44 ), and low dietary Ca:P ratio might alter the homoeostasis of Ca metabolism and be associated with increased serum PTH concentration, which may cause increased bone resorption( Reference Kemi, Karkkainen and Rita 45 ). Based on these findings, it is suggested that the LND diet with ≥0·7 % Ca may decrease osteoclastogenesis and inhibit bone resorption for 35-d-old ducks.
There were two questions need be further illuminated in the present study. First, this result showed that the 1·1 % Ca LND diet surprisingly increased the TD score but not compromised the tibia mineral deposition and strength. This was probably caused by the inappropriate Ca:P ratio and/or the sensibility of these cells in the proximal metaphysis response to this ratio. Tatara et al.( Reference Tatara, Majcher and Krupski 46 ) reported that the proximal metaphysis of tibia takes on the most intensive metabolic processes and the cells here are highly sensitive to numerous dietary fluctuation in whole tibia. Second, when compared with the PC diet, the LND diet with 0·9 % Ca significantly decreased serum biomarkers of bony matrix turnover, osteoclast- and osteoblast-specific genes expression and subsequently increased Tb.Th of the proximal metaphysis of tibia, demonstrated that reducing nutrient density may decrease bone turnover and promote Tb.Th, and as a consequence decreased the incidence of TD. Whereas it is beyond our expectation that the birds fed LND diets with 0·9 % Ca not exhibited apparently increased in mineral content, density and strength of whole tibia compared with those fed the PC diet. Some factors including the sensibility of cells’ response to nutrients could probably be potential contributors( Reference Tatara, Majcher and Krupski 46 ). These will be both investigated in future studies.
In conclusion, LND diets reduced BW and the incidence of TD, and an LND diet with ≥0·7 % Ca enhanced tibia composition, microarchitecture and breaking force. Furthermore, ≥0·7 % supplementation in the LND diet decreased serum biomarkers of bone matrix turnover and expression of genes related to bone formation and absorption. These findings provide proof that an LND diet with ≥0·7 % Ca decreased bone turnover, which subsequently increased tibial quality for 35-d-old meat ducks.
Acknowledgements
The authors thank the Modern Agri-industry Technology Research System (CARS-42-10). for financial support. The authors thank Gregory Fraley for the revision of English.
Financial support was provided by Modern Agri-industry Technology Research System (CARS-42-10).
H. Z., Q. Z. and K. Z. designed the research. H. Z., Q. Z., Y. X. and Z. S. conducted the research. H. Z., S. B. and X. D. collected and analysed data. H. Z., J. W. and K. Z. wrote the paper.
The authors declare that there are no conflicts of interest.
Supplementary material
For supplementary material/s referred to in this article, please visit https://doi.org/10.1017/S0007114518002556


