


Highlights
-
• Individual differences affect how people speak despite proficiency limitations.
-
• Cognitive functioning, not age, predicts proficiency in the dominant language.
-
• Aging effects may be masked by cognitive functioning in older adults.
-
• Language knowledge and education predict proficiency in the nondominant language.
-
• Linguistic submeasures correlated across languages and showed dominance effects.
1. Introduction
Speaking requires accessing knowledge from various linguistic domains, including vocabulary, syntax, morphology, and phonology, and coordinating their activation to enable fluent language production, which also requires organizing and planning ideas and thoughts. Speaking in a less proficient or nondominant language likely imposes greater cognitive demands than speaking in a stronger or dominant language. Although different cognitive mechanisms may enable production in each language, it is also likely that many shared mechanisms affect production in both languages. Comparisons across languages produced by the same bilingual speakers can offer unique insights into the cognitive mechanisms that underlie language proficiency in bilinguals and monolinguals alike.
Although many studies have documented language dominance effects, surprisingly little is known regarding which aspects of spontaneous language are critical for obtaining higher versus lower proficiency ratings. For example, it is well documented that bilinguals can name pictures faster and with fewer errors (Hanulová et al., Reference Hanulová, Davidson and Indefrey2011; Runnqvist et al., Reference Runnqvist, Strijkers, Sadat and Costa2011) and also produce fewer grammatical errors in their dominant than their nondominant language (Pirvulescu et al., Reference Pirvulescu, Pérez-Leroux, Roberge, Strik and Thomas2014). However, it is not known if more proficient speakers also talk faster or to what extent the production of errors is critical (i.e., not all proficient speakers speak quickly, and even the most proficient speakers occasionally produce some types of speech errors). This lack of knowledge is likely due to the difficulty of studying spontaneous language production. Utterances must be elicited, transcribed, and then coded for relevant linguistic properties, and for bilinguals, this must be done in a comparable manner for two languages. Recent years have brought a surge of interest in automated analyses of language, but these have yet to be applied to bilinguals, which present many challenges. Many automatic transcribers cannot accurately transcribe language samples produced by speakers with nonnative accents, and deriving equivalent measures across languages is also challenging (e.g., measures of grammatical complexity in particular might be difficult to equate across languages).
An additional consideration is that many individual differences might affect how a person talks, and proficiency in both languages might be affected by demographic, developmental, cognitive, personality, and cultural factors that are not necessarily related to language proficiency per se. Consistent with this possibility, one study examined narrative language samples in bilingual kindergarteners and found that kindergartners who produced longer utterances in one language also did so in the other (Bedore et al., Reference Bedore, Peña, Gillam and Ho2010). Furthermore, children who produced longer utterances tended to also produce more utterances and use more different words, and this was true in both languages the children spoke.
Similar considerations must apply in the analysis of how aging affects bilingual proficiency. In conversational language samples, older adults spoke for longer periods of time (Pereira et al., Reference Pereira, Gonçalves, Goulart, Tarrasconi, Kochhann and Fonseca2019), with longer utterances, produced more fillers (Horton et al., Reference Horton, Spieler and Shriberg2010), and more semantic paraphasias (Marini et al., Reference Marini, Boewe, Caltagirone and Carlomagno2005) than younger adults (see Mortensen et al., Reference Mortensen, Meyer and Humphreys2006 for a review). Longitudinal analyses of spontaneous language samples showed that as people aged, they spoke more slowly and repeated more words (Beier et al., Reference Beier, Chantavarin and Ferreira2023). Age effects can also vary with task demands, topics, or goals. In one study, older adults spoke more than younger adults about personal topics but not when describing a picture (James et al., Reference James, Burke, Austin and Hulme1998). Older-old adults also talked more than younger-old adults, but aging-related changes do not necessarily reflect cognitive decline, e.g., older adults may talk more because they have different communicative priorities (Pushkar et al., Reference Pushkar, Basevitz, Arbuckle, Nohara-LeClair, Lapidus and Peled2000). Furthermore, some aging effects, especially on speaking rate, may be confounded by overall health (Ramig, Reference Ramig1983) or may be due to changes in control over movement timing of articulators (Tremblay et al., Reference Tremblay, Sato and Deschamps2017).
Education level can also affect how people talk. Researchers examined the effects of age and education on spontaneous language samples in three groups of adults, including young (ages 18–35), middle-aged (ages 36–50), and older adults (ages 51–76; Mulder & Hulstijn, Reference Mulder and Hulstijn2011). In this study, participants produced monologues in a role-play based on a picture prompt. Participants with postsecondary education produced more words, more utterances, and fewer grammatical errors than those without postsecondary education, but aging effects were not significant. Education effects have also been found in a simple picture description task, where speakers with lower education levels produced shorter and less complete picture descriptions than speakers with higher education levels (MacKenzie, Reference MacKenzie2000).
Cognitive functioning is another individual difference that can affect different aspects of language production, including planning and fluency. For example, people with lower verbal IQ (WAIS-R Comprehension, Similarities, and Vocabulary) produced more inadvertent repetitions in a sentence repetition task (Engelhardt et al., Reference Engelhardt, McMullon and Corley2019). Greater interference in the Stroop task was associated with the production of more repair disfluencies (stopping and restarting an utterance with a different word or phrase; Engelhardt et al., Reference Engelhardt, Nigg and Ferreira2013). Individuals with cognitive impairment due to Alzheimer’s disease spoke with reduced lexical diversity compared to controls (Ahmed et al., Reference Ahmed, Haigh, de Jager and Garrard2013; Berisha et al., Reference Berisha, Wang, LaCross and Liss2015; Kavé & Goral, Reference Kavé and Goral2016), as did individuals with mild cognitive impairment who also produced fewer and shorter words and shorter video clip descriptions (Reeves et al., Reference Reeves, Williams, Blacker and Woods2023).
The studies reviewed above used a variety of methods to elicit speech, including picture description, role playing, and a picture-verb sentence production task. Bilingual proficiency level is often assessed with Oral Proficiency Interviews (OPIs), which may also be especially useful for identifying individual differences in speaking ability and for revealing the cognitive mechanisms underlying language production. OPIs require speakers to answer a variety of questions that increase in complexity as the interview progresses in order to test the limits of communicative competence. Bilinguals can be interviewed in both languages, providing a unique opportunity to examine speaker-dependent and language dominance-dependent language markers.
This study examined OPIs of older Spanish-English bilinguals to determine which linguistic and nonlinguistic factors best predict proficiency in the dominant versus the nondominant languages. Although OPIs have excellent construct validity, they do not provide specific information about which aspects of language production lead to higher proficiency scores in each language, which can be revealed by examining relationships between linguistic submeasures and OPI scores in each language. Specifically, we examined measures of vocabulary (number of different words), syntax (mean length utterance in words), talking speed (words per minute), verbosity (total utterances), language knowledge or monitoring failures (errors), and fluency (revisions, repetitions, and filled pauses or RRFPs). To provide further evidence for the validity of the OPI as a test of language proficiency, we asked which of these linguistic submeasures exhibited significant language dominance effects. We also asked whether age would survive as a predictor of OPI scores after accounting for cognitive functioning (the Dementia Rating Scale [DRS]; Mattis, Reference Mattis1988). This question would help to address a critical limitation in existing studies, which often included only one of these two variables (Breier et al., 2023; Horton et al., Reference Horton, Spieler and Shriberg2010; James et al., Reference James, Burke, Austin and Hulme1998). Finally, given the unique opportunity to examine both bilinguals’ languages, we asked which linguistic submeasures are correlated across languages, which would suggest shared underlying cognitive abilities and individual differences that affect language production in general.
2. Methods
2.1. Participants
Twenty-eight Spanish-English bilinguals aged 64–90 (M = 77.0, SD = 8.5) who participated in the study by Weissberger et al. (Reference Weissberger, Wierenga, Bondi and Gollan2012) were included in this study. All were cognitively healthy at the time of testing based on their performance on the DRS (Mattis, Reference Mattis1988). Nineteen participants also completed more extensive cognitive, neurological, and neuropsychological exams as part of their participation in the longitudinal study at the UCSD Alzheimer’s Disease Research Center (ADRC). Eleven of the nineteen remained healthy for as long as they were followed by the ADRC (on average 6.4 years after their participation in the study), while 8 were diagnosed with Alzheimer’s Disease (AD; about 4 years later; Garcia & Gollan, Reference Garcia and Gollan2024). All 28 participants scored between 131 and 142 (maximum score is 144) on the Dementia Rating Scale (see Table 1 and Figure S1 in the Supplementary Materials; a score of ≤130 is within normal limits for this demographic; Weissberger et al., Reference Weissberger, Salmon, Bondi and Gollan2013).
Participant characteristics

Note: MINT = Multilingual Naming Test (maximum score = 68); OPI = Oral Proficiency Interview (maximum score = 10).
Seventeen of the 28 bilinguals were English-dominant, reported first being exposed to English at age 4.1 years on average (SD = 3.7), and reported using English about 81.4% of the time (SD = 16.2%). On average, these English-dominant bilinguals had lived in a Spanish-speaking country for 2.0 years (SD = 2.4). The remaining 11 bilinguals were Spanish-dominant, reported first being exposed to English at age 9.9 (SD = 7.4) on average, reported currently using English only 36.8% of the time (SD = 26.8%), and had lived in a Spanish-speaking country for an average of 25.5 years (SD = 20.6).
2.2. Materials and procedures
The research protocol was approved by the UCSD Institutional Review Board in accordance with the Helsinki Declaration. Participants first completed a Language History Questionnaire. Those who were recruited from the community then completed the DRS in their self-reported dominant language. Bilinguals enrolled in the ADRC completed the DRS during their annual neuropsychological evaluation (and we used the score from whichever administration date was closest to the time of participation in this study). Bilinguals then completed the OPI and the Multilingual Naming Test (MINT; Gollan et al., Reference Gollan, Weissberger, Runnqvist, Montoya and Cera2012) in each language in counterbalanced order (between participants with both tests given in English first and then in Spanish, or vice versaFootnote 1).
2.2.1. Oral proficiency interview
The OPI included five questions and a picture description in each language. The questions increased in difficulty to elicit a variety of language skills, with the last two questions eliciting higher-level language skills (e.g., complex sentence structure, defending an opinion). Participants were interviewed by a proficient native Spanish-English bilingual. A score of 1–10 was assigned to each interview by two raters (Gollan et al., Reference Gollan, Weissberger, Runnqvist, Montoya and Cera2012). A third rater assigned scores only when there was a discrepancy of two or more points between the initial two raters. An average of all the raters’ scores was taken to assign each interview a final score. The OPI scores were then used to determine language dominance.
The OPIs were transcribed by 6 proficient Spanish-English bilinguals. Each interview was transcribed by one research assistant and checked by another to ensure transcription accuracy. If the two transcribers could not reach a consensus on a part of the transcription, a third transcriber was consulted. Once a transcript was deemed accurate, one of three trained bilinguals formatted the transcript for the analysis software. We used the Systematic Analysis of Language Transcripts (SALT; Miller & Iglesias, Reference Miller and Iglesias2020) software to extract linguistic measures from the language samples. The SALT reports provide measures in both English and Spanish of lexical diversity (e.g., number of different words; NDW), speaking speed (e.g., words per minute; WPM), syntactic complexity (e.g., mean length utterance in words; MLU, calculated by adding together all words a person produced divided by the number of utterances), errors, and a measure that combines revisions, repetition, and filled pauses, abbreviated as RRFPs (or “mazes” according to the SALT terminology to measure speaking fluency and planning ability; Bedore et al., Reference Bedore, Fiestas, Peña and Nagy2006; Fagan, Reference Fagan1982; Loban, Reference Loban1976). The RRFP measure was calculated by dividing the total number of RRFPs by the total number of words plus RRFPs. Utterances included independent clauses with modifiers if produced (i.e., subordinate clauses). Finally, the percentage of utterances with errors measures linguistic knowledge and the ability to monitor speech for errors while also planning and producing speech. This included word-level errors (e.g., I *is in my house), extra words (e.g., After I got glasses, I saw *more better), and utterance-level errors (e.g., They *came store went), and omissions (e.g., I went *(to) the store).
2.2.2. Multilingual naming test (MINT)
The MINT (Gollan et al., Reference Gollan, Weissberger, Runnqvist, Montoya and Cera2012) has 68 black-and-white line drawings. The test starts with easy items and difficulty increases as the test progresses. Responses were counted as correct if produced spontaneously or with a semantic cue (i.e., a prompt that provides information about the meaning of the target word).
2.2.3. Dementia rating scale (DRS; Mattis, Reference Mattis1988)
The DRS is a standardized 144-point mental status test with subscales for Attention (37 points; including forward and backward digit span, ability to follow commands, and visual search tasks), Initiation and Perseveration (37 points; includes semantic fluency, copying and maintaining movements modeled by experimenter, and copying designs), Construction (6 points; includes copying shapes and writing your name), Conceptualization (39 points; requires participants to identify abstract and concrete similarities and differences between words and shapes), and Memory (25 points; includes orientation questions [i.e., date, current president, etc.], sentence recall, word recognition, and visual memory). The DRS takes about 10–15 minutes to administer in healthy older adults.
2.2.4. Mini-mental state examination (Folstein et al., Reference Folstein, Folstein and McHugh1975)
The Mini-Mental State Examination (MMSE) is a brief screener that assesses orientation to time and place, attention and concentration, recall, language, and visual construction. This test takes about 8 minutes to administer. A cutoff score of 24/30 was recommended by Folstein et al. (Reference Folstein, Folstein and McHugh1975) to differentiate impaired and healthy older adults.
2.3. Preprocessing and analyses
Analysis 1 consisted of running exploratory correlations between overall OPI scores, demographic variables, cognitive tests, and linguistic submeasures to identify factors that may explain unique variance in OPI scores. Variables that were correlated with OPI scores were then entered into a linear backward regression model with OPI scores as the dependent variable. OPI scores were treated as a continuous (rather than ordinal) variable because the resulting score was an average taken from 2 to 3 raters. These models examined which variables explained unique variance in the overall OPI scores in each language. Analysis 2 consisted of repeated measures ANOVAs with each language as a repeated factor for each submeasure to determine which linguistic submeasures were sensitive to the effects of language dominance. Finally, Analysis 3 consisted of between-language correlations for each linguistic submeasure while controlling for age to examine which linguistic submeasures were subject to individual differences.
3. Results
3.1. Measures of overall cognitive ability (MMSE versus DRS)
DRS scores were correlated with four measures including overall proficiency (OPI) scores in both languages (dominant r = .571, p < .001; nondominant r = .396, p < .05), and speaking speed (WPM) in both languages (dominant r = .508, p < .05; nondominant r = .466, p < .05). However, the MMSE (which takes less time to administer than the DRS) was not significantly correlated with OPI scores (or any other measure) (all ps ≥ .288; see Table 2); thus, we focused our analyses below on the more thorough DRS measure.
Pearson correlations between overall oral proficiency interview scores in each language, demographic variables, and cognitive test scores

† p ≤ .10, *p ≤ .05, **p ≤ .01.
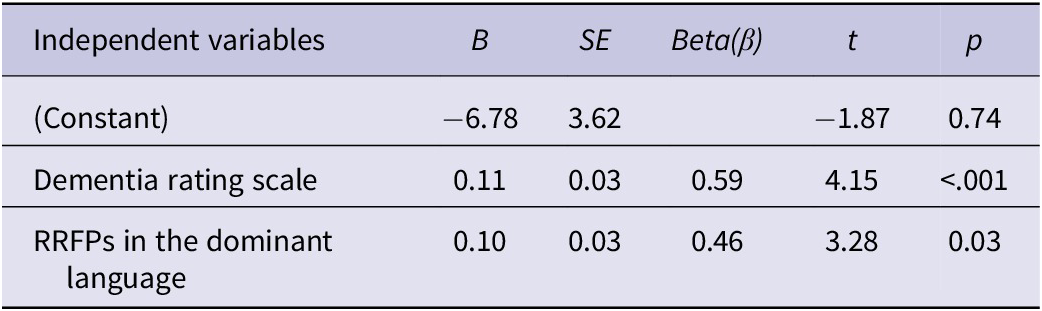
Backwards regression results using demographic and linguistic variables to predict Oral Proficiency Interview scores in the dominant language

Note: The table below shows the final model after removing age and education. R 2 = .540, F(2.23) = 13.52, p < .001.
3.2. Analysis 1: What predicts proficiency?
3.2.1. Dominant language
In the dominant language, DRS scores and age were significantly correlated with OPI scores, and education effects were marginal. Looking at linguistic submeasures, only one correlation was significant, and not in an expected direction; speakers who produced more RRFPs were rated as more proficient overall (r = .571, p = .002; see Figure 1) than those who produced fewer RRFPs in the dominant language. Importantly, people who produced more RRFPs were not doing so because they were speaking faster, i.e., RRFPs and speaking speed were not significantly correlated (r = .009, p = .964). A backward regression analysis with a criterion set at a probability of F-to-remove of greater than or equal to .10 including DRS, age, education, and RRFPs showed that DRS scores, B = .110, t(25) = 4.15, p < .001 and RRFPs, B = .102, t(25) = 3.278, p = .003 together explained 50% of the variance in OPI scores in the dominant language. Age and education effects were removed from the model. See Table 3 for full model results.
Dominant language correlation table and scatter plots.
Note: .p < .10, *p < .05, **p < .01, ***p < .001.

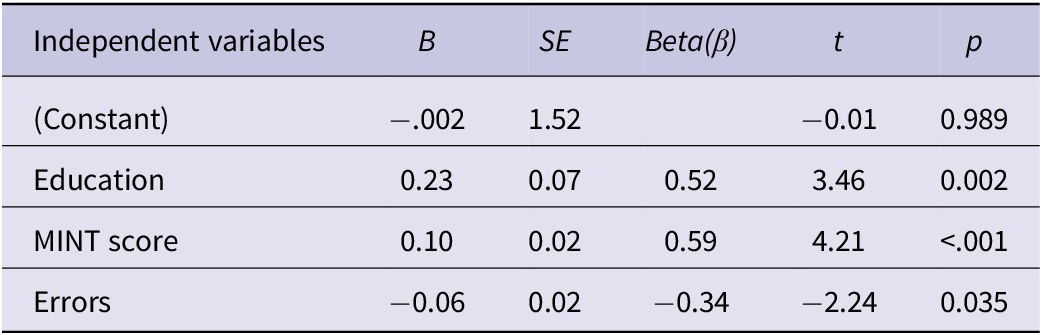
Backwards regression results using demographic and linguistic variables to predict Oral Proficiency Interview scores in the nondominant language

Note: The table below shows the final model after removing total utterances and number of different words. R 2 = .569, F(3.22) = 9.668, p < .001.
3.2.2. Nondominant language
In the nondominant language, age was not significantly correlated with OPI scores, but DRS scores and vocabulary/MINT scores were, and education was marginal. Several linguistic submeasures were correlated with overall OPI scores in the nondominant language, including (in order of significance, see Figure 2) errors, lexical diversity (NDW), and total utterances. However, in the backwards regression analysis only MINT scores, B = .10, t(25) = 4.21, p < .001, years of education, B = .23, t(25) = 3.46, p = .002, and errors, B = −.06, t(25) = −2.24, p = .035 were significant, and together explained 51% of the variance, while DRS scores, total utterances, and NDW were removed from the model. See Table 4 for full model results.
Nondominant language correlation table and scatter plots.
Note: .p < .10, *p < .05, **p < .01, ***p < .001.

3.2.3. Speaking rate
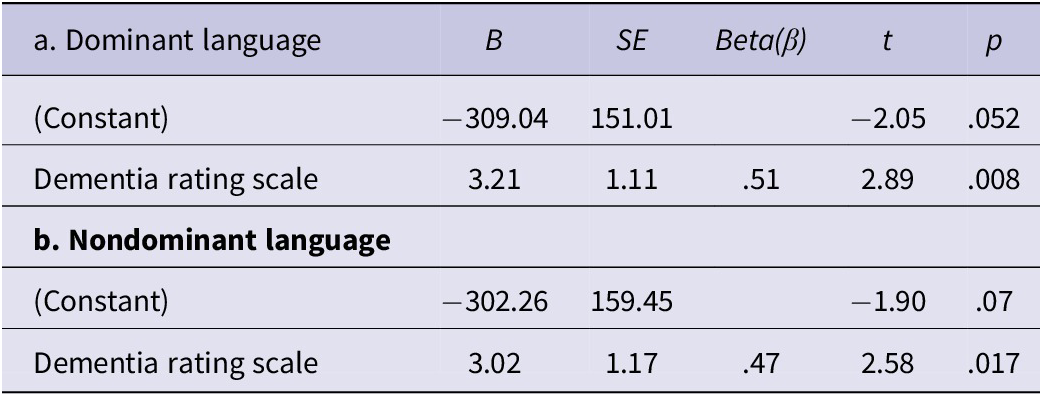
Since several papers reported age effects on speaking rate (Beier et al., Reference Beier, Chantavarin and Ferreira2023; Duchin & Mysak, Reference Duchin and Mysak1987; Horton et al., Reference Horton, Spieler and Shriberg2010), and in the analyses above, age did not explain unique variance when entered into a model with cognitive functioning (DRS) scores. We asked a follow-up question, which was if age effects on speaking rate might be more robust even after controlling for cognitive functioning. Speaking rate (WPM) slowed with increased age in both the dominant (r = −.427, p = .023) and nondominant language (r = −.423, p = .025), and DRS scores were positively correlated with speaking rates in both the dominant (r = .508, p = .008) and nondominant languages (r = .466, p = .017). However, a backward regression analysis showed that only DRS scores significantly predicted speaking rate in the dominant language, B = 3.21, t(25) = 2.89, p = .008, while the effect of age was removed. Similarly, DRS predicted speaking rate in the nondominant language, B = 3.02, t(25) = 2.58, p = .017, but age was removed from the model. See Table 5a,b for full model results.
Backwards regression results include variables that were significantly correlated with speaking speed in the (a.) dominant language and (b.) nondominant language

Note: Only DRS remained as a significant predictor in both models, while age was removed. R 2 = .258, F(1.24) = 8.36, p = .008 and R 2 = .217, F(1.24) = 6.64, p = .017, respectively.
3.3. Analysis 2: Validating the OPI with linguistic submeasures
Language dominance effects are shown in Figure 3. Bilinguals named more pictures in the dominant than in the nondominant language, F(1.27) = 48.89, ηp 2 = .644, p < .001, and many linguistic submeasures produced significant language dominance effects. Bilinguals spoke faster, F(1.27) = 27.98, ηp 2 = .509, p < .001, produced more different words, F(1.27) = 15.49, ηp 2 = .365, p = < .001, longer utterances, F(1.27) = 7.45, ηp 2 = .217, p = .011, and marginally more utterances, F(1.27) = 3.56, ηp 2 = .116, p = .07, in the dominant than in the nondominant language. Conversely, bilinguals produced more RRFPs, F(1.27) = 27.83, ηp 2 = .508, p < .001, and more utterances with errors, F(1.27) = 33.00, ηp 2 = .550, p < .001 in the nondominant than the dominant language.
Mean and interquartile range for each linguistic submeasure by language.
Note: †p < .10, *p < .05, **p < .01, ***p < .001.

3.4. Analysis 3: Do individual differences affect how people talk in both languages?
Figure 4 shows partial correlations between OPI scores and linguistic submeasures from the OPI in each language while controlling for age, and for comparison, we also included MINT scores. The correlations between overall OPI scores in the dominant and nondominant language remained significant after controlling for age (r = .535, p = .004), and all other linguistic submeasures were also significantly correlated across languages. In order of correlation strength, RRFPs, (r = .768, p < .001), total utterances, (r = .725, p < .001), NDW (r = .702, p < .001), WPM (r = .628, p < .001), and MLU(r = .546, p = .003) were all correlated across languages. By contrast, picture naming scores (i.e., the MINT; r = .269, p = .175) and the percentage of utterances with errors (r = .258, p = .194) were not correlated across languages.
Partial correlations between the linguistic submeasures in the dominant and nondominant languages controlling for age. To depict the strength of the correlation, the residuals of a univariate ANOVA for each variable are plotted below.
Note: *p < .05, **p < .01, ***p < .001.

3.4.1. Lexical diversity and verbosity
Though we found little overlap in which linguistic submeasures predicted OPI scores in the dominant versus in the nondominant languages, several similarities between linguistic submeasures emerged within each language. Specifically, total utterances, speaking speed (WPM), and lexical diversity (NDW) were significantly correlated in all possible combinations (see Figures 2 and 3). That is, (a) people who produced a greater number of utterances, also produced a greater amount of different words in both the dominant (r = .803, p < .001) and nondominant languages (r = .804, p < .001), (b) people who produced a greater number of utterances also spoke faster in both the dominant (r = .501, p = .007) and the nondominant languages (r = .467, p = .012), and c) people who talked fast also used many different words in both the dominant (r = .547, p = .003) and nondominant language (r = .495 p = .007).
4. Discussion
In this study, we asked which factors predict proficiency in both languages of older Spanish-English bilinguals. In the dominant language, older-old speakers were rated as less proficient and spoke more slowly than younger-old speakers, but age effects were not significant after accounting for cognitive functioning scores. No other measure was significantly correlated with OPI scores in the dominant language with just one exception that ran opposite to the expected direction (speakers who produced more RRFPs were rated as more proficient, though this was primarily driven by revisions). In the nondominant language, age was not significantly correlated with overall proficiency scores, and speakers with higher cognitive functioning scores were rated as more proficient and spoke marginally faster but not after accounting for productive vocabulary (MINT) scores, which were strong predictors of proficiency (see also De Jong et al., Reference De Jong, Steinel, Florijn, Schoonen and Hulstijn2012). The ability to produce error-free speech and higher education level also explained unique variance in predicting overall proficiency scores in the nondominant language.
Additionally, we observed both persistence of individual traits within bilinguals’ two languages and significant language dominance effects on those same traits. Most linguistic submeasures were significantly correlated across languages (see Figure 4) except vocabulary scores and production of errors, but virtually all measures exhibited significant and highly robust language dominance effects (see Figure 3). Finally, although different linguistic submeasures predicted proficiency in each language, in both languages, fast talkers also tended to speak more and with greater linguistic diversity (see similar within language correlations in Bedore et al., Reference Bedore, Peña, Gillam and Ho2010).
4.1. Aging versus cognition effects
Previous studies reported significant aging-related changes in how people talk but few asked if age effects might have reflected other cognitive changes associated with aging. Of the six aging studies reviewed above, half did not measure cognitive ability (Breier et al., 2023; Horton et al., Reference Horton, Spieler and Shriberg2010; James et al., Reference James, Burke, Austin and Hulme1998), and two used just a brief cognitive screener (Pereria et al., 2019; Marini et al., Reference Marini, Boewe, Caltagirone and Carlomagno2005). One used a more thorough test (used by the Canadian armed forces) and like this study found that age effects were not significant after controlling for cognitive ability (Gold et al., Reference Gold, Andres, Arbuckle and Schwartzman1988). The present study used two measures to examine cognitive functioning. The MMSE has 11 questions with a maximum score of 30, while the DRS has 36 questions that measure functioning across 5 cognitive domains with a maximum score of 144. In this study, only the DRS significantly predicted proficiency scores. Our results suggest that it is critical to use more thorough cognitive measures to distinguish the effects of age from subtle changes in cognitive functioning that may be present in some but not in other older participants.
A unique aspect of this study was the fact that some participants were followed longitudinally (see also Beier et al., Reference Beier, Chantavarin and Ferreira2023), and subsequently, several participants were diagnosed with dementia. Thus, it might seem that aging effects would have been more robust if our sample had a lower rate of participants with subsequent cognitive decline. To consider this possibility, we repeated the analyses predicting OPI scores in the dominant language (see Table 3) excluding the participants (n = 8) who were later diagnosed with AD. Analysis of this subset (n = 20) provided no indication that aging effects might be more robust without participants who declined in subsequent years; DRS scores (r = .666, p = .003) were still highly correlated, and age was marginally correlated (r = .407, p = .075) with OPI scores in the dominant language, and DRS scores (B = .103, t(17) = 2.898, p = .012) but not age effects (B = −.019, t(17) = −1.147, p = .271) significantly predicted dominant language OPI scores when entered together in a single model.Footnote 2 Given the high base rates of AD pathology (46%) in adults over 70 years old (Kern et al., Reference Kern, Zetterberg, Kern, Zettergren, Waern, Hoglund, Andreasson, Wetterberg, Borjesson-Hanson, Blennow and Skoog2018), and the rapid increase in pathology prevalence after age 70 (prevalence doubles every 5 years from ages 65–90; Corrada et al., Reference Corrada, Brookmeyer, Paganini-Hill, Berlau and Kawas2010), it seems possible that some previously reported aging effects may have reflected subtle cognitive decline associated with preclinical AD and should not have been attributed to healthy aging (McDonough et al., Reference McDonough, Bischof, Kennedy, Rodrigue, Farrell and Park2016; Sliwinski et al., Reference Sliwinski, Lipton, Buschke and Stewart1996).
4.2. What is proficiency in the dominant versus in the nondominant language?
A major question of interest in this study was what cognitive and linguistic abilities underlie proficiency in the bilinguals’ two languages. Although cognitive ability was significantly correlated with OPI scores in both languages, backward regression models revealed no overlap in which predictors survived to best predict proficiency in each language. An important consideration is the more restricted range of scores in the dominant versus the nondominant languages. In the dominant language, OPI scores varied between 7.0 and 10.0 (with all but one score between 8 and 10, with SDs of 0.6–0.7). By contrast, in the nondominant language, OPI scores varied between 4.5 and 9.3 (and SDs were larger; see Table 1). Linguistic submeasures also showed less variability in the dominant than in the nondominant language. While the differences in proficiency ranges between languages may have contributed to different measures predicting proficiency in each language, additional possible reasons why we obtained differences between languages with respect to which measures best predicted overall OPI scores can be considered.
The DRS was administered in the bilinguals’ dominant language. As such, it might seem that the robust correlation between the DRS and overall OPI scores in the dominant language could be an artifact of linguistic submeasures in the DRS. In particular, the DRS includes one semantic fluency trial (supermarket items), which is known to be correlated with OPI scores (Neveu et al., submitted). To test if the correlation between DRS and OPI scores might have been driven by semantic fluency scores (rather than by cognitive abilities in general), we examined if the number of supermarket items produced in the semantic fluency trial in the DRS was itself correlated with OPI scores. This analysis was restricted to a subset of 22 participants for whom we had individual DRS subtest scores. In this subset of participants, DRS scores were still correlated with OPI scores in the dominant language (r = .492, p = .02).Footnote 3 Critically, the number of supermarket items produced was not significantly correlated with OPI scores in the dominant language (r = −.116, p = .607). Thus, we suggest that the explanatory power of the DRS for explaining individual differences in OPI scores was likely not driven by the use of the same language to administer the DRS. Instead, other aspects of cognitive functioning or the combination of several domains of cognition (see description of DRS subtests above) may be more strongly predictive of the ability to proficiently formulate and produce spoken language as needed to express thoughts in the dominant language.
Another unexpected predictor of overall OPI scores in the dominant language was the production of revisions, repetitions, and filled pauses; more proficient speakers produced more RRFPs. This is a counterintuitive result, given that RRFPs are types of disfluencies. For example, Beier et al. (Reference Beier, Chantavarin and Ferreira2023) suggested that increased repetitions reflect processing difficulties associated with increased age. Production of more RRFPs in the nondominant language was also associated with increased likelihood of later being diagnosed with Alzheimer’s disease (Garcia & Gollan, Reference Garcia and Gollan2024). To better understand why RRFPs predicted proficiency in the dominant language, we examined revisions, repetitions, and filled pauses separately. Bilinguals who produced more revisions in the dominant language were rated as more proficient (r = .482, p = .009). Repetitions and filled pauses were not significantly correlated with OPI scores (ps ≥ .16). Revisions may have been used to add new or more complex information to utterances, thus leading to higher ratings. Revising one’s speech requires the speaker to detect a problem and formulate a replacement to correct it, and producing revisions may be used to maintain speech continuity for the ease of the listener (Lake et al., Reference Lake, Humphreys and Cardy2011). A last possibility is that increased disfluencies in highly proficient speakers could reflect the use of more grammatically complex structures (but note this correlation only approached significance, r = .360, p = .06; see Figure 2).
Proficiency in the nondominant language was predicted by measures of productive vocabulary (MINT), errors, and education level. It is counterintuitive that education predicted proficiency only in the nondominant language, given that bilinguals were educated primarily in their dominant language. However, this finding is consistent with previous work in which older adults with higher education levels were more likely to learn and maintain a novel language (Blumenfeld et al., Reference Blumenfeld, Quinzon, Alsol and Riera2017). The correlation between MINT scores and OPI scores in the nondominant language also replicates previous findings (Gollan et al., Reference Gollan, Weissberger, Runnqvist, Montoya and Cera2012; Garcia & Gollan, Reference Garcia and Gollan2021) and demonstrates that vocabulary is central to proficiency. Without adequate vocabulary knowledge in the target language, speakers may fail to communicate or make errors in order to do so (De Jong et al., Reference De Jong, Steinel, Florijn, Schoonen and Hulstijn2012). Finally, the production of errors explained unique variance in predicting OPI scores only in the nondominant language. Errors produced in the dominant language might have primarily reflected accidental slips (that all speakers produce occasionally regardless of proficiency level), while in the nondominant language, the production of errors was more likely to reflect a lack of knowledge/proficiency. Thus, speaking in the nondominant language requires adequate knowledge in both lexical and grammatical domains. While this is of course, also true in the dominant language, these abilities are more likely to be at or closer to ceiling levels in the dominant language, which opens the possibility for other predictors (e.g., cognitive ability) to explain more variance.
4.3. Evidence for individual differences: Why do people talk how they talk?
Apart from speech errors and MINT scores, which constitute relatively pure measures of language-specific knowledge, all linguistic submeasures of the OPI were highly correlated across languages. Even OPI scores themselves were significantly correlated across languages, and this correlation was significant even when controlling for DRS scores (r = .444, p = .026; as were all the between language correlations shown in Figure 2 with rs ranging from .540 to .784, and ps from .01 to < .001). Thus, it seems that many aspects of language production are subject to individual differences that will be displayed in both languages for a given speaker. The robust relationship between these measures, even after controlling for DRS scores, could suggest that between-language correlations in OPI submeasures are driven by factors unrelated to cognitive functioning per se (e.g., aspects of personality; Feldstein & Sloan, Reference Feldstein and Sloan1984), or that the DRS does not measure all relevant aspects of cognitive functioning (the DRS was designed to differentiate cognitively healthy from impaired older adults; Monsch et al., Reference Monsch, Bondi, Salmon, Butters, Thal, Hansen, Weiderholt, Cahn and Klauber1995, and to stage dementia progression; Vitaliano et al., Reference Vitaliano, Breen, Russo, Albert, Vitiello and Prinz1984).
However, previous studies with young adult talkers also reported significant between-language correlations for speech rate (Bradlow et al., Reference Bradlow, Kim and Blasingame2017, Reference Bradlow, Blasingame and Lee2018, Reference Bradlow2019). Reading speed is also correlated between languages for bilinguals. Kuperman et al. (Reference Kuperman, Siegelman, Schroeder, Acartürk, Alexeeva, Amenta, Bertram, Bonandrini, Brysbaert, Chernova, Da Fonseca, Dirix, Duyck, Fella, Frost, Gattei, Kalaitzi, Lõo, Marelli and Usal2023) examined eye movements and the ability to answer comprehension questions in bilingual readers of English as a second language with 11 different native languages and found that reading rate was highly correlated across languages (r = .75, p < .001), but the ability to answer comprehension questions was much more language specific. This resembles our finding of nonsignificant correlations between languages for MINT scores and the production of errors. Kuperman and colleagues proposed that individual bilinguals use the same reading strategy in both their languages (e.g., frequency of word skipping), while reading comprehension relies on a different set of skills (i.e., language-specific skills). Bradlow and colleagues recorded Mandarin-English and Korean-English bilinguals producing sentences in each of their languages. Native speakers then listened to the productions in a sentence-in-noise recognition task, which allowed researchers to calculate an intelligibility score for each talker. Intelligibility scores were significantly lower in the second language than in the native language, but intelligibility scores were also correlated across languages; people who produced more intelligible speech in their native language also produced more intelligible speech in their second language (Bradlow et al., Reference Bradlow, Blasingame and Lee2018). The generalization of cross-linguistic correlations across such different tasks (from silent reading to linguistic submeasures in an open-ended interview) and across multiple age groups, invites further investigation and supports Bradlow et al.’s (Reference Bradlow, Blasingame and Lee2018) proposal that such correlations may reflect central cognitive processes and deeper levels of planning that are not language specific (Bedore et al., Reference Bedore, Peña, Gillam and Ho2010).
Importantly, while we observed high correlations between languages (see Figure 4), the linguistic submeasures were also highly sensitive to language dominance (see Figure 3). In previous work, we assumed the OPI is the gold standard because it is more comprehensive than most objective measures (e.g., naming tests only measure expressive vocabulary and lexical decision tests only measure the ability to accurately distinguish between real words and nonwords, but neither of these provide information about grammatical knowledge). To earn the highest score (10), speakers must function “like a highly educated native speaker,” (Gollan et al., Reference Gollan, Weissberger, Runnqvist, Montoya and Cera2012) raising the possible criticism that the OPI measures education level as much as it does proficiency level. Although education was only marginally correlated with OPI scores in both languages, it was a robust predictor of proficiency in the nondominant language in the backward regression analysis. But this is not necessarily a problem given that both the ability to communicate in everyday scenarios and the ability to communicate complex ideas must be evaluated to obtain a complete assessment of a speaker’s communicative competence. Thus, although the OPI assesses the ability to function in everyday scenarios and also pushes bilinguals to use higher-order language skills that may not be necessary in day-to-day life (Hulstijn, Reference Hulstijn2024), this is necessary to determine the range of topics in which a speaker can function. High levels of education may typically be needed to communicate about topics that are not needed in daily life. Note, however, that if so, education effects should have been significant in both languages in this study. Thus, an alternative possibility is that more educated individuals are also more likely to have or actively seek opportunities to gain proficiency in a nondominant language (Neveu & Gollan, Reference Neveu and Gollan2024). In addition to providing a comprehensive assessment of proficiency level, another advantage of the OPI is that it is relatively straightforward to match across languages for difficulty, which is far from trivial (Hulstijn, Reference Hulstijn2012; Peña, Reference Peña2007). Similar to previous studies, we found that more proficient bilinguals spoke faster (Baese-Berk & Morrill, Reference Baese-Berk and Morrill2015; Guion et al., Reference Guion, Flege, Liu and Yeni-Komshian2000), with more different words (Treffers-Daller, Reference Treffers-Daller2011), with longer utterances, and with fewer errors, repetitions, revisions, and filled pauses. The results of this study thus validate the use of the OPI as a comprehensive measure of language proficiency.
5. Limitations
Though the OPI provides a rich language sample, and each speaker provided well above the amount of speech considered necessary to conduct the types of analyses reported herein (i.e., 50 utterances or more; see Pezold et al., Reference Pezold, Imgrund and Storkel2020) we had a relatively small number of participants. A larger study might detect both significant age effects and effects of cognitive functioning. Similarly, our relatively small sample size might explain why so few variables explained unique variance in predicting overall OPI scores in the dominant language (although note that our sample was quite heterogeneous with respect to age and education level). Though detailed analysis of spontaneous speech is labor intensive, more automated methods of analysis are emerging and may shed additional light (but see Hitczenko et al., Reference Hitczenko, Mittal and Goldrick2021) on relationships between aging and speech production, particularly if robust measures of cognitive functioning can be included in such studies.
6. Conclusion
Together with previous studies, the results of this study suggest that proficient language production reflects the combined forces of language-specific and talker-specific characteristics, including higher-level cognitive processing and at all processing levels, from formulation to articulation across the lifespan. Similar language-independent individual differences in cognitive processing may underlie differences between individual talkers, regardless of idiosyncratic properties of the specific languages, whether for producing intelligible speech or coherent, highly rated, spoken utterances during an interview. Additionally, rather than reflecting age-related changes per se, some changes in how people talk that were previously associated with aging (e.g., slowed speech) might instead reflect changes in cognitive functioning, which can be detected with more thorough cognitive assessment (but is seldom included in studies of cognitive aging). Finally, while some aspects of speaking in the nondominant language might be sensitive to future cognitive decline in bilinguals (Garcia & Gollan, Reference Garcia and Gollan2024), overall production of the dominant language is more closely tied to cognitive functioning, whereas production of the nondominant language reflects language-specific knowledge.
Supplementary material
The supplementary material for this article can be found at http://doi.org/10.1017/S1366728925000343.
Data availability statement
Data used in this study are available at Open Science Framework at https://osf.io/2pqe8/?view_only=3bad5aea216943d8b3713cafb54095c2.
Acknowledgements
We thank the participants, staff, and volunteers at the UCSD Shiley-Marcos ADRC for their ongoing commitment to the research program. We thank the team of research assistants that transcribed all the language samples. We thank Matthew Goldrick, PhD, for feedback on this article. We thank Jan Hulstijn, PhD, for an insightful and thought-provoking review.
Funding statement
This work was supported by NIH grants P30-AG062429, AG076415, T32-DC007361, and AG077915 and by an NSF BCS grant 1923065.
Competing interests
The authors declare no competing interests exist.


 Open access