


1. Introduction
Creatures such as fish, bats, insects and birds generate aerodynamic or hydrodynamic lift, propulsion and manoeuvring forces by oscillating their appendages, such as fins or wings. For decades, these natural systems have served as a primary source of inspiration for biomimetic robotic designs capable of swimming or flying (Raj & Thakur Reference Raj and Thakur2016; Duraisamy, Kumar Sidharthan & Nagarajan Santhanakrishnan Reference Duraisamy, Kumar Sidharthan and Nagarajan Santhanakrishnan2019; Phan & Park Reference Phan and Park2020; Bao et al. Reference Bao, Shi, Duan, Guo and Li2023; Othman et al. Reference Othman, Zekry, Saro-Cortes, Lee and Wissa2023). These biological structures are often defined by their flexibility, thickness, and ability to undergo significant deformations. The force generation mechanism is affected by a number of factors, such as the kinematics of the flapping foils (e.g. amplitude, frequency and stroke mode) (Shoele & Zhu Reference Shoele and Zhu2010; Wang, Tang & Zhang Reference Wang, Tang and Zhang2022), structure flexibility and its interaction with fluid (Zhu Reference Zhu2007), and foil–foil interplay (Zhu et al. Reference Zhu, He and Zhang2014a ; Gungor, Khalid & Hemmati Reference Gungor, Khalid and Hemmati2022).
To better understand the physical mechanism of bio-inspired swimming/flying and improve its performance, numerous investigations have been conducted to explore the fluid dynamics and fluid–structure interactions of flapping foils. These explorations date back to the theoretical studies on rigid foils (Theodorsen Reference Theodorsen1935; Garrick Reference Garrick1936). Since then, particularly in the past few decades, the fluid dynamics and near-body flow field around the rigid foil doing heaving, pitching or combined motion have been extensively studied through experiments (Triantafyllou, Triantafyllou & Gopalkrishnan Reference Triantafyllou, Triantafyllou and Gopalkrishnan1991; Godoy-Diana, Aider & Wesfreid Reference Godoy-Diana, Aider and Wesfreid2008; Bohl & Koochesfahani Reference Bohl and Koochesfahani2009), numerical simulations (Zhu Reference Zhu2006; Das, Shukla & Govardhan Reference Das, Shukla and Govardhan2016; Andersen et al. Reference Andersen, Bohr, Schnipper and Walther2017) and theoretical analysis (Triantafyllou, Triantafyllou & Grosenbaugh Reference Triantafyllou, Triantafyllou and Grosenbaugh1993; Fernandez-Feria Reference Fernandez-Feria2016).
Compared with the rigid models, flexible foils exhibit higher similarity with the biological structure, attracting more interest from scientists, and tremendous effort has been spent on this issue. Through various investigations, it is commonly accepted that structural chord-wise flexibility attributes to highly efficient force generation through flapping motions. For example, by experimentally exploring the performance of a flexible panel undergoing leading-edge pitching motion, Dewey et al. (Reference Dewey, Boschitsch, Moored, Stone and Smits2013) reported up to $100{-}200\,\%$
and
$100{-}200\,\%$
and $100\,\%$
enhancement in thrust generation and propulsive efficiency, respectively, compared with a rigid panel. Other studies that investigate this problem include physical experiments (e.g. Yamamoto et al. Reference Yamamoto, Terada, Nagamatu and Imaizumi1995; Heathcote et al. Reference Heathcote, Martin and Gursul2003; Quinn, Lauder & Smits Reference Quinn, Lauder and Smits2014; Iverson et al. Reference Iverson, Rahimpour, Lee, Kiwata and Oshkai2019) and numerical simulations (Alben Reference Alben2008; Tang & Lu Reference Tang and Lu2015; Olivier & Dumas Reference Olivier and Dumas2016), and all demonstrate a similar beneficial effect. Two physical explanations have emerged to explain this phenomenon: (i) flexibility leverages resonance to maximise plate/fin amplitude (Quinn, Lauder & Smits Reference Quinn, Lauder and Smits2015; Fernandez-Feria & Alaminos-Quesada Reference Fernandez-Feria and Alaminos-Quesada2021); and (ii) flexibility tunes aerodynamic variables such as camber and angle of attack to maximise the thrust-to-drag ratio (Kang et al. Reference Kang, Aono, Baik, Bernal and Shyy2013; Floryan & Rowley Reference Floryan and Rowley2018; Eldredge & Jones Reference Eldredge and Jones2019).
$100\,\%$
enhancement in thrust generation and propulsive efficiency, respectively, compared with a rigid panel. Other studies that investigate this problem include physical experiments (e.g. Yamamoto et al. Reference Yamamoto, Terada, Nagamatu and Imaizumi1995; Heathcote et al. Reference Heathcote, Martin and Gursul2003; Quinn, Lauder & Smits Reference Quinn, Lauder and Smits2014; Iverson et al. Reference Iverson, Rahimpour, Lee, Kiwata and Oshkai2019) and numerical simulations (Alben Reference Alben2008; Tang & Lu Reference Tang and Lu2015; Olivier & Dumas Reference Olivier and Dumas2016), and all demonstrate a similar beneficial effect. Two physical explanations have emerged to explain this phenomenon: (i) flexibility leverages resonance to maximise plate/fin amplitude (Quinn, Lauder & Smits Reference Quinn, Lauder and Smits2015; Fernandez-Feria & Alaminos-Quesada Reference Fernandez-Feria and Alaminos-Quesada2021); and (ii) flexibility tunes aerodynamic variables such as camber and angle of attack to maximise the thrust-to-drag ratio (Kang et al. Reference Kang, Aono, Baik, Bernal and Shyy2013; Floryan & Rowley Reference Floryan and Rowley2018; Eldredge & Jones Reference Eldredge and Jones2019).
Beyond uniform and constant flexibility, spatially varying and time-dependent structural stiffness, often employed by biological swimmers through muscle control to enhance performance, also plays a pivotal role in the effectiveness of flapping foils. Floryan & Rowley (Reference Floryan and Rowley2020) modelled a passively flexible foil with distributed flexibility, finding that thrust gain can be achieved by tuning the stiffness distribution to activate resonance or by concentrating stiffness towards its leading edge. Efficiency improvement, however, is only enabled by concentrating stiffness away from the leading edge at low motion frequency. Yudin et al. (Reference Yudin, Floryan and Van Buren2023) and Shi et al. (Reference Shi, Xiao and Zhu2020) studied the swimming performance of flexible flapping plates with time-varying flexibility. Both studies found that oscillating stiffness has a significant impact on thrust generation, while its effect on propulsive efficiency is comparatively smaller.
All the studies mentioned above focus on inextensible, bending-dominated foils. There is another category of biological structures – stretching-dominated, compliant bio-membranes used by creatures like bats, flying squirrels, and lemurs. Compliant bio-membranes are characterised by negligible thickness, zero bending stiffness, and high stretchability. Investigations on this type of structure are still at initial stages (Tiomkin & Raveh Reference Tiomkin and Raveh2021). There are several studies concentrating on the static aerodynamic response of bat-inspired membrane foils mounted in uniform steady flows (Waldman & Breuer Reference Waldman and Breuer2017) or confined flows (Li et al. Reference Li, Jaiman, Lei and Liu2024). Other studies emphasise the unsteady flow-structure interactions of flapping membrane foils. For example, Tregidgo, Wang & Gursul (Reference Tregidgo, Wang and Gursul2013) presents an experimental analysis about the impact of angle of attack upon a membrane foil’s elastic deformation, and the resultant flow field. Schunk, Swartz & Breuer (Reference Schunk, Swartz and Breuer2017) explore the influence of aspect ratio and stroke pattern on force generation of a flapping bat-inspired membrane wing through experiments. Cheney et al. (Reference Cheney, Rehm, Swartz and Breuer2022) examine the function of small muscles embedded in the armwing membrane of Jamaican fruit bats, finding that actively modulating the wing’s compliance is able to control its camber and achieve drag reduction.
Similar to the bending-dominated foils, how structural compliance (or flexibility) affects the propulsive performance is also a hot topic for membrane foils. A number of works on this issue have demonstrated that the compliance significantly enhances the lift/thrust generation and propulsive efficiency (Attar et al. Reference Attar, Gordnier, Johnston, Romberg and Parthasarathy2011; Jaworski & Gordnier Reference Jaworski and Gordnier2012, Reference Jaworski and Gordnier2015). More recently, Joshi et al. (Reference Joshi, Jaiman, Li, Breuer and Swartz2020) examined the flapping dynamics of a full-scale bat wing by using a three-dimensional variational fluid-flexible multi-body numerical framework, revealing that the flexible wings generate more unsteady lift compared to the rigid counterpart owing to the high wing-tip velocity due to the elastic deformation of the wings. Through a two-dimensional potential flow model with small-amplitude deflections, Tzezana & Breuer (Reference Alon Tzezana and Breuer2019) identified a thrust–drag transition of a flapping membrane wing in a free stream, which is accompanied by a wake mode transition. Nevertheless, these investigations mostly consider linearly elastic material within the small strains regime, which seriously limits accurate description of the large deformation of most biological membrane structures (e.g. bat wing; Swartz et al. Reference Swartz, Groves, Kim and Walsh1996) that are hyperelastic (nonlinear). Furthermore, all the existing bio-inspired membranes are tethered in a uniform stream while making prescribed motions, which is not the case for their natural counterparts, whose membrane wings or fins are free to move horizontally. Even though there are numerous investigations on the self-propelled locomotion of bending-dominated flapping foils (Peng, Huang & Lu Reference Peng, Huang and Lu2018; Lin et al. Reference Lin, Wu, Zhang and Yang2020; Benetti Ramos et al. Reference Benetti Ramos, Marquet, Bergmann and Iollo2021; Chao, Jia & Li Reference Chao, Jia and Li2024), such attempts in the context of stretching-dominated membrane foils are still rare.
Therefore, high-fidelity free-locomotion simulations on the fluid–hyperelastic interaction are required to grasp the deformation mechanism of membrane foils and its influence on the propulsive performance. We herein present a numerical study by coupling fluid dynamics and hyperelasticity within the immersed boundary framework (Peskin Reference Peskin2002) to examine the propulsive capability of a self-propelled compliant membrane foil undergoing prescribed pitching motion. We are particularly interested in the nonlinear interplay between the hyperelastic structure and fluid. The results could pave the way for the development of more efficient bio-inspired systems, and even be used directly to guide the prototype design.
The remainder of this paper is organised as follows. The mathematical formulation and numerical method are first presented in § 2. The numerical model validation is then described in § 3, followed by the discussion of detailed results in §§ 4–7. Finally, concluding remarks are addressed in § 8.
(a) Schematic of a compliant foil undergoing prescribed pitching motion in a stagnant fluid. The long dashed line indicates the reference state, and the solid line is the deformed foil; $\boldsymbol{r}_c$
is the relative displacement vector of the centroid to the reference state, and
$\boldsymbol{r}_c$
is the relative displacement vector of the centroid to the reference state, and $y_c$
is the normal component of
$y_c$
is the normal component of $\boldsymbol{r}_c$
. (b) A representative schematic showing tension–strain curves for linear elasticity and the Gent model.
$\boldsymbol{r}_c$
. (b) A representative schematic showing tension–strain curves for linear elasticity and the Gent model.

2. Mathematical formulations
As displayed in figure 1, we consider a one-dimensional hyperelastic membrane foil immersed in a stagnant fluid. The chord-wise length $c$
(i.e. the distance between the leading and trailing ends) is a constant. Compared to
$c$
(i.e. the distance between the leading and trailing ends) is a constant. Compared to $c$
, the foil thickness is negligible. The structure is initially pre-stretched by ratio
$c$
, the foil thickness is negligible. The structure is initially pre-stretched by ratio $\lambda _0=c/L$
, in which
$\lambda _0=c/L$
, in which $L$
is the natural length. The material features zero-bending rigidity and nonlinear stretching behaviour, so we use the two-parameter Gent model (Das, Breuer & Mathai Reference Das, Breuer and Mathai2020; Mathai et al. Reference Mathai, Das, Naylor and Breuer2023) to describe the tension–deformation relationship, i.e.
$L$
is the natural length. The material features zero-bending rigidity and nonlinear stretching behaviour, so we use the two-parameter Gent model (Das, Breuer & Mathai Reference Das, Breuer and Mathai2020; Mathai et al. Reference Mathai, Das, Naylor and Breuer2023) to describe the tension–deformation relationship, i.e.
 \begin{equation} \tau =\frac {GJ_m(\lambda -\lambda ^{-2})}{J_m-I_1+3}, \end{equation}
in which $G$
denotes the material shear modulus,
$G$
denotes the material shear modulus, $J_m$
is the locking parameter, and
$J_m$
is the locking parameter, and $I_1$
denotes the first invariant of the left Cauchy–Green deformation gradient tensor. For this uniaxial stretching scenario, we have
$I_1$
denotes the first invariant of the left Cauchy–Green deformation gradient tensor. For this uniaxial stretching scenario, we have $I_1=\lambda ^2+2\lambda ^{-1}$
, where
$I_1=\lambda ^2+2\lambda ^{-1}$
, where $\lambda$
is the stretch ratio. In the present study,
$\lambda$
is the stretch ratio. In the present study, $J_m$
is chosen to be infinitely large such that
$J_m$
is chosen to be infinitely large such that $\tau =G(\lambda -\lambda ^{-2})$
.
$\tau =G(\lambda -\lambda ^{-2})$
.
The leading edge is fixed transversely and free to move in the axial direction. To propel itself forwards, the foil will perform a prescribed pitching motion in which the trailing edge rotates periodically around the leading edge with frequency $\omega$
. As shown in figure 1(a), the long dashed line indicates the prescribed motion, while the solid line represents the actual state of the foil counting on the structural passive deformation.
$\omega$
. As shown in figure 1(a), the long dashed line indicates the prescribed motion, while the solid line represents the actual state of the foil counting on the structural passive deformation.
To describe the passive deformation, we employ a structural dynamic equation defined in a Lagrangian coordinate system (attached to the foil), which is written as
 \begin{align} m_c\frac {\partial ^2\boldsymbol{X}(s,t)}{\partial t^2}=\frac {\partial }{\partial s}\left (G\lambda _0(1-\lambda ^{-3})\frac {\partial \boldsymbol{X}(s,t)}{\partial s} \right )+\boldsymbol{F}(s,t)+m_c\boldsymbol{g}, \end{align}
in which $m_c$
represents the line density of the foil,
$m_c$
represents the line density of the foil, $\boldsymbol{X}\equiv (x,y)$
is the instantaneous position within the Eulerian reference of the structural particle whose arc distance to the leading edge along the foil is
$\boldsymbol{X}\equiv (x,y)$
is the instantaneous position within the Eulerian reference of the structural particle whose arc distance to the leading edge along the foil is $s:\in [0,c]$
,
$s:\in [0,c]$
, $\boldsymbol{F}\equiv (F_x,F_y)$
is the hydrodynamic load,
$\boldsymbol{F}\equiv (F_x,F_y)$
is the hydrodynamic load, $\boldsymbol{g}\equiv g\boldsymbol{e}$
is the gravitational acceleration vector, and the stretch ratio
$\boldsymbol{g}\equiv g\boldsymbol{e}$
is the gravitational acceleration vector, and the stretch ratio $\lambda$
is expressed as
$\lambda$
is expressed as $\lambda _0(\partial \boldsymbol{X}/\partial s\boldsymbol{\cdot }\partial \boldsymbol{X}/\partial s)^{1/2}$
. Appendix A contains more details about (2.2). The boundary conditions are
$\lambda _0(\partial \boldsymbol{X}/\partial s\boldsymbol{\cdot }\partial \boldsymbol{X}/\partial s)^{1/2}$
. Appendix A contains more details about (2.2). The boundary conditions are
 \begin{align} y\big |_{s=0}&=0, \end{align}
 \begin{align} \boldsymbol{X}\big |_{s=c}-\boldsymbol{X}\big |_{s=0}&=c\bigl [\cos (\theta), \sin(\theta)\bigr ], \\[9pt] \nonumber \end{align}
in which $\theta =\tilde {\theta }\sin (\omega t)$
represents the cyclic trajectory of the pitching motion.
$\theta =\tilde {\theta }\sin (\omega t)$
represents the cyclic trajectory of the pitching motion.
The hydrodynamic load $\boldsymbol{F}$
will be accessed by solving the incompressible Navier–Stokes equations, i.e.
$\boldsymbol{F}$
will be accessed by solving the incompressible Navier–Stokes equations, i.e.
 \begin{align} \rho _f\left (\frac {\partial \boldsymbol {u}}{\partial t}+\boldsymbol{\nabla }\boldsymbol{\cdot }(\boldsymbol {u}\boldsymbol {u})\!\right )&=-\boldsymbol{\nabla }p+\rm \mu\, {\nabla} ^2\boldsymbol {u}+\boldsymbol {f}, \end{align}
 \begin{align} \boldsymbol{\nabla }\boldsymbol{\cdot }\boldsymbol {u}&=0, \end{align}
in which $\rho _f$
stands for fluid density,
$\rho _f$
stands for fluid density, $\boldsymbol {u}$
is the fluid velocity vector,
$\boldsymbol {u}$
is the fluid velocity vector, $p$
is the pressure,
$p$
is the pressure, $\rm \mu$
is the dynamic viscosity of fluid, and
$\rm \mu$
is the dynamic viscosity of fluid, and $\boldsymbol {f}$
is the momentum forcing to satisfy the no-penetration boundary condition on the foil. All fluid variables are defined in the Eulerian coordinate system
$\boldsymbol {f}$
is the momentum forcing to satisfy the no-penetration boundary condition on the foil. All fluid variables are defined in the Eulerian coordinate system $\boldsymbol{x}\equiv (x,y)$
. The fluidic and structural equations are solved independently and then coupled by using a feedback scheme within the direct-forcing immersed boundary framework (Peskin Reference Peskin2002; Bi & Zhu Reference Bi and Zhu2019). In this approach, the hydrodynamic load (i.e. fluid–structure interaction force) can be obtained through a penalty algorithm that matches the solutions from the two equations.
$\boldsymbol{x}\equiv (x,y)$
. The fluidic and structural equations are solved independently and then coupled by using a feedback scheme within the direct-forcing immersed boundary framework (Peskin Reference Peskin2002; Bi & Zhu Reference Bi and Zhu2019). In this approach, the hydrodynamic load (i.e. fluid–structure interaction force) can be obtained through a penalty algorithm that matches the solutions from the two equations.
For normalisation, we choose the fluid density $\rho _f$
, foil chord length
$\rho _f$
, foil chord length $c$
, and
$c$
, and $\omega c$
as characteristic density, length and velocity, respectively. Unless otherwise specified, normalised variables share the same symbol with their dimensional counterparts, for simplicity. Therefore, the dimensionless forms of (2.2) and (2.5) become
$\omega c$
as characteristic density, length and velocity, respectively. Unless otherwise specified, normalised variables share the same symbol with their dimensional counterparts, for simplicity. Therefore, the dimensionless forms of (2.2) and (2.5) become
 \begin{equation} R\frac {\partial ^2\boldsymbol{X}(s,t)}{\partial t^2}=\frac {\partial }{\partial s}\left (\textit{Ae}\,\lambda _0(1-\lambda ^{-3})\frac {\partial \boldsymbol{X}(s,t)}{\partial s} \right )+\boldsymbol{F}(s,t)+\textit{Fr}\,\boldsymbol{e} \end{equation}
and
 \begin{equation} \frac {\partial \boldsymbol{u}}{\partial t}+\boldsymbol{\nabla }\boldsymbol{\cdot}(\boldsymbol{u}\boldsymbol{u})=-\boldsymbol{\nabla }p+\frac {1}{\textit{Re}}{\nabla} ^2\boldsymbol{u}+\boldsymbol{f}, \end{equation}
in which the mass ratio $R$
, aeroelastic number
$R$
, aeroelastic number $\textit{Ae}$
, Reynolds number
$\textit{Ae}$
, Reynolds number $\textit{Re}$
and Froude number
$\textit{Re}$
and Froude number $\textit{Fr}$
are defined by
$\textit{Fr}$
are defined by
 \begin{equation} R=\frac {m_c}{\rho _fc}, \quad Ae=\frac {G}{\rho _fc^3\omega ^2}, \quad {Re}=\frac {\rho _fc^2\omega }{\rm \mu }, \quad Fr=\frac {m_cg}{\rho _fc^2\omega ^2}. \end{equation}
For numerical methodology, the Navier–Stokes equations are handled with the conventional fractional step method (Kim, Baek & Sung Reference Kim, Baek and Sung2002) on a staggered Cartesian grid. In this method, the fluid velocity and pressure are decoupled with the LU decomposition. Hereby, a provisional velocity field is first updated by using the prior fluidic information. The obtained velocity field is then used for pressure update by solving the Poisson equation. Finally, the velocity field can be corrected with the pressure to fulfil the continuity constraint.
The structure is uniformly discretised with $N$
Lagrangian nodes. Herein, the cell size is
$N$
Lagrangian nodes. Herein, the cell size is $\Delta s=c/(N-1)$
. The tension-related term of (2.7) is accessed with the centred finite difference approximation, i.e.
$\Delta s=c/(N-1)$
. The tension-related term of (2.7) is accessed with the centred finite difference approximation, i.e.
 \begin{align} \varPhi (\boldsymbol{X}_i) &= \frac {\partial }{\partial s}\left (\textit{Ae}\,\lambda _0(1-\lambda _i^{-3})\frac {\partial \boldsymbol{X}_i}{\partial s} \right ) \nonumber\\ &= \frac {\textit{Ae}\,\lambda _0}{\Delta s^2}\left ((1-\lambda _{i+1/2}^{-3})(\boldsymbol{X}_{i+1}-\boldsymbol{X}_i)-(1-\lambda _{i-1/2}^{-3})(\boldsymbol{X}_{i}-\boldsymbol{X}_{i-1}) \right )\!,\quad \nonumber\\ i &= 2,\ldots, N-1, \end{align}
in which $\lambda _{i+1/2}=\lambda _0\,|\boldsymbol{X}_{i+1}-\boldsymbol{X}_{i}|/\Delta s$
. An explicit Runge–Kutta method is employed for the time-marching of the structural equation with time interval
$\lambda _{i+1/2}=\lambda _0\,|\boldsymbol{X}_{i+1}-\boldsymbol{X}_{i}|/\Delta s$
. An explicit Runge–Kutta method is employed for the time-marching of the structural equation with time interval $\Delta t$
:
$\Delta t$
:
 \begin{equation} \left \{ \begin{aligned} &\boldsymbol{m}_1=\Delta t\,\boldsymbol{V}^n,\, \boldsymbol{k}_1=\frac {\Delta t}{R}\big (\varPhi (\boldsymbol{X}^n)+\boldsymbol{F}^n+\textit{Fr}\,\boldsymbol{e}\big ), \\&\boldsymbol{m}_2=\Delta t\,(\boldsymbol{V}^n+0.5\boldsymbol{k}_1),\, \boldsymbol{k}_2=\frac {\Delta t}{R}\big (\varPhi (\boldsymbol{X}^n+0.5\boldsymbol{m}_1)+\boldsymbol{F}^n+\textit{Fr}\,\boldsymbol{e}\big ),\\&\boldsymbol{m}_3=\Delta t\,(\boldsymbol{V}^n+0.5\boldsymbol{k}_2),\, \boldsymbol{k}_3=\frac {\Delta t}{R}\big (\varPhi (\boldsymbol{X}^n+0.5\boldsymbol{m}_2)+\boldsymbol{F}^n+\textit{Fr}\,\boldsymbol{e}\big ),\\&\boldsymbol{m}_4=\Delta t\,(\boldsymbol{V}^n+\boldsymbol{k}_3),\, \boldsymbol{k}_4=\frac {\Delta t}{R}\big (\varPhi (\boldsymbol{X}^n+\boldsymbol{m}_3)+\boldsymbol{F}^n+\textit{Fr}\,\boldsymbol{e}\big ),\\&\boldsymbol{X}^{n+1}=\boldsymbol{X}^n+\frac {\boldsymbol{m}_1+2\boldsymbol{m}_2+2\boldsymbol{m}_3+\boldsymbol{m}_4}{6},\,\boldsymbol{V}^{n+1}=\boldsymbol{V}^n+\frac {\boldsymbol{k}_1+2\boldsymbol{k}_2+2\boldsymbol{k}_3+\boldsymbol{k}_4}{6}, \end{aligned} \right . \end{equation}
in which the subscript indicates time index, and $\boldsymbol{V}$
represents structural velocity, i.e.
$\boldsymbol{V}$
represents structural velocity, i.e. $\partial \boldsymbol{X}/\partial t$
.
$\partial \boldsymbol{X}/\partial t$
.
All simulations of this study will be performed in a rectangular domain measuring $40c\times 10c$
. The longitudinal size
$40c\times 10c$
. The longitudinal size $40c$
is sufficiently large to ensure that the foil does not move out of the domain. Symmetric boundary conditions are used at the far-field boundaries. Based on the sensitivity study in Appendix C, uniform grids with
$40c$
is sufficiently large to ensure that the foil does not move out of the domain. Symmetric boundary conditions are used at the far-field boundaries. Based on the sensitivity study in Appendix C, uniform grids with $\Delta x=\Delta y=0.01$
are used in the vicinity of the foil, and the time step (
$\Delta x=\Delta y=0.01$
are used in the vicinity of the foil, and the time step ( $\Delta t$
) is set to be
$\Delta t$
) is set to be $0.0002$
throughout the study. Moreover, we choose the number of Lagrangian points (
$0.0002$
throughout the study. Moreover, we choose the number of Lagrangian points ( $N$
) along the foil to be
$N$
) along the foil to be $150$
.
$150$
.
3. Relaxation test of the membrane foil
In this section, free vibration of the membrane foil in stagnant fluid will be simulated first, then the numerical results are compared with theoretical predictions. As displayed in the inset of figure 2, the foil is subject to a gravitational field and released from a flat configuration (initial state). The body undergoes underdamped oscillation due to the viscous effect of fluid until reaching its steady or static state (a catenary).
Not involving any prescribed motion, the reference velocity for this scenario is hereby replaced by $\mu /(\rho _f c)$
. Accordingly, the coefficients of (2.7) and (2.8) should be redefined, except
$\mu /(\rho _f c)$
. Accordingly, the coefficients of (2.7) and (2.8) should be redefined, except $R$
. Specifically,
$R$
. Specifically, $\textit{Re}$
is assigned to unity, and
$\textit{Re}$
is assigned to unity, and $\textit{Ae}$
and
$\textit{Ae}$
and $\textit{Fr}$
physically represent the ratios of elasticity and gravity to viscosity, i.e.
$\textit{Fr}$
physically represent the ratios of elasticity and gravity to viscosity, i.e.
 \begin{equation} Ae=\frac {G\rho _fc}{\rm \mu }, \quad Fr=\frac {m_cg\rho _fc^2}{\rm \mu ^2}. \end{equation}
(a) Time evolution of the vertical location of the foil’s central point during the free vibration. (b) Static shapes of the foil under gravity; the solid line represents the theoretical prediction, and the dashed line indicates the numerical result.

Two simulations with $Ae=30,\ \textit{Fr}=3$
(case 1) and
$Ae=30,\ \textit{Fr}=3$
(case 1) and $\textit{Ae}=300,\ \textit{Fr}=20$
(case 2) will then be conducted. Other parameters are
$\textit{Ae}=300,\ \textit{Fr}=20$
(case 2) will then be conducted. Other parameters are $\lambda _0=1.05$
,
$\lambda _0=1.05$
, $R=5.0$
. According to the derivation of Appendix A, the normalised natural frequencies for these two cases can be calculated by
$R=5.0$
. According to the derivation of Appendix A, the normalised natural frequencies for these two cases can be calculated by
 \begin{equation} \omega _n=\unicode{x03C0} \sqrt {\frac {\textit{Ae}\,(\lambda _0-\lambda _0^{-2})}{R+R_a}}, \end{equation}
in which $R_a$
indicates the added mass of the foil vibrating in quiescent fluid, which is approximated to
$R_a$
indicates the added mass of the foil vibrating in quiescent fluid, which is approximated to $0.68$
(Minami Reference Minami1998).
$0.68$
(Minami Reference Minami1998).
With these relaxation tests, the natural frequencies can also be measured with the logarithmic decrement ( $\delta$
) of the decaying trajectory as shown in figure 2(a), i.e.
$\delta$
) of the decaying trajectory as shown in figure 2(a), i.e. $\omega _n=\sqrt {4\unicode{x03C0} ^2+\delta ^2}/T$
. The obtained natural frequencies turn out to be
$\omega _n=\sqrt {4\unicode{x03C0} ^2+\delta ^2}/T$
. The obtained natural frequencies turn out to be $2.8$
and
$2.8$
and $8.9$
for these two cases, which are close to the theoretical ones (
$8.9$
for these two cases, which are close to the theoretical ones ( $2.6$
and
$2.6$
and $8.7$
) calculated by (3.2). Moreover, the static states of the foil from the numerical simulations are presented in figure 2(b). According to Appendix B, the static shapes can also be theoretically predicted by the following formulations:
$8.7$
) calculated by (3.2). Moreover, the static states of the foil from the numerical simulations are presented in figure 2(b). According to Appendix B, the static shapes can also be theoretically predicted by the following formulations:
 \begin{align} x(s)&=\frac {H\lambda _0^2s}{G(\lambda _0^3+2)} +\frac {3H}{m_cg(\lambda _0^3+2)}\left (\sinh ^{-1}\left (\frac {m_cgc}{2H}\right )-\sinh ^{-1}\left (\frac {0.5m_cgc-m_cgs}{H}\right )\right )\!, \end{align}
 \begin{align} y(s)&=\frac {\lambda _0^2(m_cgcs-m_cgs^2)}{2G(\lambda _0^3+2)}+\frac {3\left (\sqrt {H^2+(0.5m_cgc)^2}-\sqrt {H^2+(0.5m_cgc-m_cgs)^2}\right )}{m_cg(\lambda _0^3+2)}, \end{align}
 \begin{align} \frac {m_cgc}{2H} &=\sinh \left (\frac {(\lambda _0^3+2)m_cgc}{6H}-\frac {\lambda _0^2m_cgc}{6G} \right )\!. \end{align}
As displayed, the geometry shapes of the static foils from the numerical simulation match well with those from the theoretical analysis. The maximum difference, which takes place at the mass centre ( $s=0.5$
), is less than
$s=0.5$
), is less than $0.2\,\%$
, verifying the accuracy of the hyperelastic solver again.
$0.2\,\%$
, verifying the accuracy of the hyperelastic solver again.
4. Velocity crisis in pitching motion
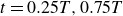
We next examine the propulsive performance of the membrane foil making purely pitching motion. Table 1 lists the variables involved in the simulations. The emphasis of this research is on the influence of the structural compliance and pitching amplitude on the system dynamics, so parametric studies on these two variables are conducted by varying $\textit{Ae}$
and
$\textit{Ae}$
and $\tilde {\theta }$
over proper ranges. Specifically,
$\tilde {\theta }$
over proper ranges. Specifically, $\textit{Ae}$
ranges from
$\textit{Ae}$
ranges from $1.0$
(relatively soft foil) to
$1.0$
(relatively soft foil) to $100$
(stiff one), and
$100$
(stiff one), and $\tilde {\theta }$
lies in
$\tilde {\theta }$
lies in $[2\unicode{x03C0} /36,7\unicode{x03C0} /36]$
in radians. The above variable domains are determined via pilot tests, through which we found that when
$[2\unicode{x03C0} /36,7\unicode{x03C0} /36]$
in radians. The above variable domains are determined via pilot tests, through which we found that when $\textit{Ae}$
reaches
$\textit{Ae}$
reaches $100$
, the foil is stiff enough to be treated as a rigid structure, so it is meaningless to go beyond
$100$
, the foil is stiff enough to be treated as a rigid structure, so it is meaningless to go beyond $100$
; when
$100$
; when $Ae\lt 1$
or
$Ae\lt 1$
or $\tilde {\theta }\gt 7\unicode{x03C0} /36$
, high-order structural deformation can be triggered easily, resulting in considerable high-order fluctuation in the generated aerodynamic force, which will significantly undermine the propulsion stability of the flapping system; for
$\tilde {\theta }\gt 7\unicode{x03C0} /36$
, high-order structural deformation can be triggered easily, resulting in considerable high-order fluctuation in the generated aerodynamic force, which will significantly undermine the propulsion stability of the flapping system; for $\tilde {\theta }\lt 2\unicode{x03C0} /36$
, the resultant propulsive speed is too small for mechanism exploration. Other parameters are set to be constant. Specifically, following Tzezana & Breuer (Reference Alon Tzezana and Breuer2019), the pre-stretch ratio
$\tilde {\theta }\lt 2\unicode{x03C0} /36$
, the resultant propulsive speed is too small for mechanism exploration. Other parameters are set to be constant. Specifically, following Tzezana & Breuer (Reference Alon Tzezana and Breuer2019), the pre-stretch ratio $\lambda _0$
equals
$\lambda _0$
equals $1.05$
. The mass ratio
$1.05$
. The mass ratio $R$
is chosen to be
$R$
is chosen to be $0.2$
, such that the acceleration period is shortened, which saves computational time and domain size. Finally, the frequency-based Reynolds number
$0.2$
, such that the acceleration period is shortened, which saves computational time and domain size. Finally, the frequency-based Reynolds number $\textit{Re}$
is fixed at
$\textit{Re}$
is fixed at $200$
, while a parametric study on
$200$
, while a parametric study on $\textit{Re}$
is provided in § 6. There is no gravitational effect, so
$\textit{Re}$
is provided in § 6. There is no gravitational effect, so $\textit{Fr}$
is set to be zero. Hereafter, all simulation results are extracted when the system reaches a steady state.
$\textit{Fr}$
is set to be zero. Hereafter, all simulation results are extracted when the system reaches a steady state.
Summary of parameters used in the current study.

(a) Mean velocity $V_a$
versus
$V_a$
versus $\textit{Ae}$
for various pitching amplitudes
$\textit{Ae}$
for various pitching amplitudes $\tilde {\theta }$
; the filled symbols indicate the optimal cases in terms of velocity. (b) Comparison between the optimal cases (filled bars) and the corresponding rigid cases. (c) Power expenditure
$\tilde {\theta }$
; the filled symbols indicate the optimal cases in terms of velocity. (b) Comparison between the optimal cases (filled bars) and the corresponding rigid cases. (c) Power expenditure $P$
versus
$P$
versus $\textit{Ae}$
. (d) Cost of transport versus
$\textit{Ae}$
. (d) Cost of transport versus $\textit{Ae}$
.
$\textit{Ae}$
.

We present the propulsive performance of the system in figure 3 in terms of average propulsive speed $V_a$
, average power expenditure
$V_a$
, average power expenditure $P$
, and cost of transport (COT), which are defined by
$P$
, and cost of transport (COT), which are defined by
 \begin{equation} V_a=\frac {\int _TV(t)\,{\rm d}t}{T}, \quad P=\frac {\int _T\int _\varGamma \boldsymbol{F}(t,s)\boldsymbol{\cdot}\boldsymbol{V}(t,s)\,{\rm d}s\,{\rm d}t}{T}, \quad {\textrm {COT}}=\frac {P}{TV_a}. \end{equation}
Here, $T=2\unicode{x03C0} /\omega$
is the period,
$T=2\unicode{x03C0} /\omega$
is the period, $\varGamma$
represents the Lagrangian domain attached to the foil,
$\varGamma$
represents the Lagrangian domain attached to the foil, $\boldsymbol{V}(t,s)$
is the instantaneous velocity vector of the foil, and
$\boldsymbol{V}(t,s)$
is the instantaneous velocity vector of the foil, and $V(t)$
is the spatial average value of the horizontal component of
$V(t)$
is the spatial average value of the horizontal component of $\boldsymbol{V}$
.
$\boldsymbol{V}$
.
Figure 3(a) shows the variation of $V_a$
with
$V_a$
with $\textit{Ae}$
. Results of rigid foil (labelled by
$\textit{Ae}$
. Results of rigid foil (labelled by $\infty$
) are also displayed for reference. As displayed, the effect of compliance is significantly different from that of bending-dominated foils. In that scenario, the performance of flapping foil is optimal at an intermediate flexibility, after which as the foil gets stiffer, the performance will gradually decline, converging to the level of the rigid case. In this scenario, however, after hitting an optimal point (marked by filled symbols), the velocity will undergo an abrupt collapse before converging to the rigid case. We refer to this phenomenon as ‘velocity crisis’. One exception is the sequence for
$\infty$
) are also displayed for reference. As displayed, the effect of compliance is significantly different from that of bending-dominated foils. In that scenario, the performance of flapping foil is optimal at an intermediate flexibility, after which as the foil gets stiffer, the performance will gradually decline, converging to the level of the rigid case. In this scenario, however, after hitting an optimal point (marked by filled symbols), the velocity will undergo an abrupt collapse before converging to the rigid case. We refer to this phenomenon as ‘velocity crisis’. One exception is the sequence for $\tilde {\theta }=2\unicode{x03C0} /36$
, where the velocity variation is trivial due to the small amplitude, so the velocity crisis is inconspicuous. Higher
$\tilde {\theta }=2\unicode{x03C0} /36$
, where the velocity variation is trivial due to the small amplitude, so the velocity crisis is inconspicuous. Higher $\tilde {\theta }$
tends to cause a more pronounced velocity crisis, and there is even a secondary collapse when
$\tilde {\theta }$
tends to cause a more pronounced velocity crisis, and there is even a secondary collapse when $\tilde {\theta }$
is higher than
$\tilde {\theta }$
is higher than $5\unicode{x03C0} /36$
.
$5\unicode{x03C0} /36$
.
A closer inspection shows that for all cases that we consider here, most flexible foils fail to create higher propulsive speed than the rigid ones due to the velocity crisis except in a few cases before the collapse. The greatest flexibility-induced velocity improvement always takes place just before the collapse, as indicated by filled symbols, except for the case $\tilde {\theta }=2\unicode{x03C0} /36$
. We present the largest improvement rate for various
$\tilde {\theta }=2\unicode{x03C0} /36$
. We present the largest improvement rate for various $\tilde {\theta }$
in figure 3(b), where empty bars represent the velocity of rigid cases, while filled bars are the optimal cases. (Notice that
$\tilde {\theta }$
in figure 3(b), where empty bars represent the velocity of rigid cases, while filled bars are the optimal cases. (Notice that $\tilde {\theta }=2\unicode{x03C0} /36$
is not involved here because there is no velocity peak within the range that we consider in this case.) It shows that the flexible membrane foil has the potential to achieve a
$\tilde {\theta }=2\unicode{x03C0} /36$
is not involved here because there is no velocity peak within the range that we consider in this case.) It shows that the flexible membrane foil has the potential to achieve a $20{-}30\,\%$
increase in velocity when the pitching amplitude is relatively small (e.g.
$20{-}30\,\%$
increase in velocity when the pitching amplitude is relatively small (e.g. ${\leqslant}5\unicode{x03C0} /36$
), whereas this value for large-amplitude cases is only at the level of
${\leqslant}5\unicode{x03C0} /36$
), whereas this value for large-amplitude cases is only at the level of $10\,\%$
.
$10\,\%$
.
Figures 3(c) and 3(d) present the energetics of this process. Not surprisingly, the overall trend is that larger pitching amplitude and flexibility tend to cost more energy $P$
. Exceptions are the abrupt expenditure jumps accompanied by the velocity collapse. This implies the same physical origin behind the two phenomena. As a result, the cost of transport also experiences a jump within the same regime, leading to the most inefficient locomotion. Indeed, it is seen that the rigid foil always has the lowest COT, meaning that the system becomes less efficient when flexibility steps in, which is contradictory to the observation for bending-dominated flapping foils as discussed in § 1. This is mainly attributed to the fact that the flexible deformation for membrane foils is rooted in tangential stretching, not in the form of adaptive deformation in the transverse direction, such that the aforementioned efficiency enhancement mechanisms that are valid for bending-dominated foils lack a foundation to exist in the current scenario.
$P$
. Exceptions are the abrupt expenditure jumps accompanied by the velocity collapse. This implies the same physical origin behind the two phenomena. As a result, the cost of transport also experiences a jump within the same regime, leading to the most inefficient locomotion. Indeed, it is seen that the rigid foil always has the lowest COT, meaning that the system becomes less efficient when flexibility steps in, which is contradictory to the observation for bending-dominated flapping foils as discussed in § 1. This is mainly attributed to the fact that the flexible deformation for membrane foils is rooted in tangential stretching, not in the form of adaptive deformation in the transverse direction, such that the aforementioned efficiency enhancement mechanisms that are valid for bending-dominated foils lack a foundation to exist in the current scenario.
To summarise, the advantage of flexible membrane foils over rigid ones lies in the velocity enhancement. But this is only accomplished before the velocity collapse, and with a compromise of efficiency. Therefore, unlocking the secret of the velocity crisis is a prerequisite for fully exploiting this advantage in bio-inspired systems, and will probably shed light on how natural systems circumvent or control this crisis.
Time histories of the spatial average velocity of the foil $V$
within a cycle for (a)
$V$
within a cycle for (a) $Ae=3,5$
and
$Ae=3,5$
and $\tilde{\theta }=5\unicode{x03C0} /36$
, and (b)
$\tilde{\theta }=5\unicode{x03C0} /36$
, and (b) $Ae=2,3,5$
and
$Ae=2,3,5$
and $\tilde{\theta }=7 \unicode{x03C0} /36$
. The time history of the pitch angle
$\tilde{\theta }=7 \unicode{x03C0} /36$
. The time history of the pitch angle $\theta$
(normalised by the pitch amplitude
$\theta$
(normalised by the pitch amplitude $\tilde {\theta }$
) is also presented.
$\tilde {\theta }$
) is also presented.

5. Physical insights
We then proceed to explore the underlying physics of the velocity collapse. First, the focus will be placed on the sequence for $\tilde {\theta }=5\unicode{x03C0} /36$
, which causes a noticeable collapse. Figure 4(a) plots time histories of the foil velocity during a motion cycle for the ante-collapse (
$\tilde {\theta }=5\unicode{x03C0} /36$
, which causes a noticeable collapse. Figure 4(a) plots time histories of the foil velocity during a motion cycle for the ante-collapse ( $Ae=3$
) and post-collapse (
$Ae=3$
) and post-collapse ( $Ae=5$
) cases of this sequence. The black solid line indicates the pitch angle. It is found that the velocity drop from the ante-collapse to the post-collapse case is initiated in the recovery phase, but lasts until the downstroke or upstroke phase. We then calculate the time-averaged velocity drops during these two phases, which turn out to be
$Ae=5$
) cases of this sequence. The black solid line indicates the pitch angle. It is found that the velocity drop from the ante-collapse to the post-collapse case is initiated in the recovery phase, but lasts until the downstroke or upstroke phase. We then calculate the time-averaged velocity drops during these two phases, which turn out to be $0.22$
and
$0.22$
and $0.11$
, respectively. This means that the velocity collapse is mostly contributed from the velocity drop during the recovery phase. Given the fact that the velocity collapse mainly takes place in the recovery phase where the trailing edge moves back to the equilibrium position and simultaneously pushes fluid backwards for thrust production, it is expected that the velocity collapse is likely originated from thrust collapse during this period. As shown in figure 4(b), we obtain the same observation for the sequence
$0.11$
, respectively. This means that the velocity collapse is mostly contributed from the velocity drop during the recovery phase. Given the fact that the velocity collapse mainly takes place in the recovery phase where the trailing edge moves back to the equilibrium position and simultaneously pushes fluid backwards for thrust production, it is expected that the velocity collapse is likely originated from thrust collapse during this period. As shown in figure 4(b), we obtain the same observation for the sequence $\tilde {\theta }=7\unicode{x03C0} /36$
, whose mean velocity drops of recovery and downstroke or upstroke phase are
$\tilde {\theta }=7\unicode{x03C0} /36$
, whose mean velocity drops of recovery and downstroke or upstroke phase are $0.25$
and
$0.25$
and $0.05$
, respectively.
$0.05$
, respectively.
Velocity increase rate $\varepsilon$
(green symbols) and time-averaged net force
$\varepsilon$
(green symbols) and time-averaged net force $F_n$
over the recovery phase (red symbols) versus
$F_n$
over the recovery phase (red symbols) versus $\textit{Ae}$
for (a)
$\textit{Ae}$
for (a) $\tilde {\theta }=5\unicode{x03C0} /36$
and (b)
$\tilde {\theta }=5\unicode{x03C0} /36$
and (b) $\tilde {\theta }=7\unicode{x03C0} /36$
. Here,
$\tilde {\theta }=7\unicode{x03C0} /36$
. Here, $\varepsilon$
and
$\varepsilon$
and $F_n$
are calculated by (5.1) and (5.2).
$F_n$
are calculated by (5.1) and (5.2).

The thrust collapse can be substantiated by figure 5, in which we plot the time-averaged net aerodynamic force in the propulsive direction over the recovery phase ( $F_n$
) for various
$F_n$
) for various $\textit{Ae}$
, and for illustration, the propulsive velocity increase rate
$\textit{Ae}$
, and for illustration, the propulsive velocity increase rate $\varepsilon$
is also presented. Here,
$\varepsilon$
is also presented. Here, $F_n$
and
$F_n$
and $\varepsilon$
are calculated by
$\varepsilon$
are calculated by
 \begin{equation} F_n=\frac {1}{2}\left (\int _{0.25T}^{0.5T}\int _0^1F_x\,{\rm d}s\,{\rm d}t+\int _{0.75T}^T\int _0^1F_x\,{\rm d}s\,{\rm d}t\right )/(0.25T) \end{equation}
and
 \begin{equation} \varepsilon =\left(V_a-V_a^{\ast }\right)/V_a^{\ast }, \end{equation}
where $F_x$
is the horizontal fluid–structure interacting force density, and
$F_x$
is the horizontal fluid–structure interacting force density, and $V_a^{\ast }$
is the propulsive velocity for the rigid foil. As displayed, the velocity crisis coincides with the force collapse, indicating that insufficient thrust during the recovery phase is the main cause of the velocity stall. The thrust generation is closely related to the beat speed of the foil, which depends on the coupling of the prescribed pitching motion and the passive structural deformation. In what follows, therefore, we compare the foil deformation patterns of various
$V_a^{\ast }$
is the propulsive velocity for the rigid foil. As displayed, the velocity crisis coincides with the force collapse, indicating that insufficient thrust during the recovery phase is the main cause of the velocity stall. The thrust generation is closely related to the beat speed of the foil, which depends on the coupling of the prescribed pitching motion and the passive structural deformation. In what follows, therefore, we compare the foil deformation patterns of various $\textit{Ae}$
in order to disclose the underlying physics of the thrust collapse.
$\textit{Ae}$
in order to disclose the underlying physics of the thrust collapse.
Figure 6 presents the body deformation for the sequence for $\tilde {\theta }=5\unicode{x03C0} /36$
. Snapshots at various time instants are all rotated back to the horizontal level and superimposed for illustration. The green solid, green dashed, red solid and red dashed profiles represent the foil shapes at
$\tilde {\theta }=5\unicode{x03C0} /36$
. Snapshots at various time instants are all rotated back to the horizontal level and superimposed for illustration. The green solid, green dashed, red solid and red dashed profiles represent the foil shapes at $t=0.25T,0.5T,0.75T,T$
, respectively. As displayed, the foil is spindle-shaped for all cases of this sequence, meaning that it is in the first mode (half sine) deformation. However, each case exhibits distinct vibratory characteristics in respect of amplitude (which decreases with
$t=0.25T,0.5T,0.75T,T$
, respectively. As displayed, the foil is spindle-shaped for all cases of this sequence, meaning that it is in the first mode (half sine) deformation. However, each case exhibits distinct vibratory characteristics in respect of amplitude (which decreases with $\textit{Ae}$
) and phase, which both have tremendous influence on the beat speed.
$\textit{Ae}$
) and phase, which both have tremendous influence on the beat speed.
Instantaneous configurations of the foil within a pitching cycle. The green solid line represents the foil’s geometric shape at $t=0.25T$
, the green dashed line for
$t=0.25T$
, the green dashed line for $t=0.5T$
, the red solid line for
$t=0.5T$
, the red solid line for $t=0.75T$
, the red dashed line for
$t=0.75T$
, the red dashed line for $t=T$
, and the other dark solid lines are for other time instants. All snapshots are pulled back to the horizontal position for better illustration, and their original version is provided in figure 7 as reference. Here,
$t=T$
, and the other dark solid lines are for other time instants. All snapshots are pulled back to the horizontal position for better illustration, and their original version is provided in figure 7 as reference. Here, $\tilde {\theta }=5\unicode{x03C0} /36$
.
$\tilde {\theta }=5\unicode{x03C0} /36$
.

Instantaneous configurations of the foil within a pitching cycle, for $\tilde {\theta }=5\unicode{x03C0} /36$
.
$\tilde {\theta }=5\unicode{x03C0} /36$
.

For the case $Ae=3$
, the foil has the largest deformation (the most curved cambers indicated by the green/red solid lines) right at the beginning of the recovery phase,
$Ae=3$
, the foil has the largest deformation (the most curved cambers indicated by the green/red solid lines) right at the beginning of the recovery phase, $t=0.25T,0.75T$
, and gets less deformed at the end of the phase,
$t=0.25T,0.75T$
, and gets less deformed at the end of the phase, $t=0.5T,T$
(indicated by the green/red lines). Even though this process may not be monotonic, its overall dynamic is in phase with the prescribed motion. The implication is that extra beat speed is created by this passive deformation, leading to a velocity enhancement compared with the rigid foil. For the case
$t=0.5T,T$
(indicated by the green/red lines). Even though this process may not be monotonic, its overall dynamic is in phase with the prescribed motion. The implication is that extra beat speed is created by this passive deformation, leading to a velocity enhancement compared with the rigid foil. For the case $Ae=5$
, however, the passive deformation seems out of phase with the prescribed motion, resulting in a beat speed loss during the recovery phase, which can be the main reason for the thrust (herein velocity) collapse at
$Ae=5$
, however, the passive deformation seems out of phase with the prescribed motion, resulting in a beat speed loss during the recovery phase, which can be the main reason for the thrust (herein velocity) collapse at $Ae=5$
. This phenomenon can also be interpreted from the perspective of energy transfer. When
$Ae=5$
. This phenomenon can also be interpreted from the perspective of energy transfer. When $Ae=3$
, the elastic energy of the foil is released and converted to the kinetic energy of jet flow during the recovery phase, whereas when
$Ae=3$
, the elastic energy of the foil is released and converted to the kinetic energy of jet flow during the recovery phase, whereas when $Ae=5$
, the foil gains elastic energy from the fluid field. Therefore, the foil deformation in the case
$Ae=5$
, the foil gains elastic energy from the fluid field. Therefore, the foil deformation in the case $Ae=3$
exerts a positive effect on the thrust generation, while the case
$Ae=3$
exerts a positive effect on the thrust generation, while the case $Ae=5$
has a negative effect. Moreover, even though the negative effect still exists in cases
$Ae=5$
has a negative effect. Moreover, even though the negative effect still exists in cases $Ae=9$
and
$Ae=9$
and $15$
as shown in figure 6, its intensity is diminishing due to the reduced passive deformation amplitude as the foil gets stiffer. This explains why after the collapse, the velocity
$15$
as shown in figure 6, its intensity is diminishing due to the reduced passive deformation amplitude as the foil gets stiffer. This explains why after the collapse, the velocity $V_a$
quickly recovers and converges to the rigid case.
$V_a$
quickly recovers and converges to the rigid case.
We then utilise the vertical displacement of the foil centroid ( $y_c$
) in figure 6 to quantify the passive deformation, where
$y_c$
) in figure 6 to quantify the passive deformation, where $y_c$
is a proper indicator for the structural deformation because only the first mode is observed in these cases. Physically, it represents the normal component of the displacement of the centroid relative to the undeformed state (reference state) as indicated in figure 1(a), i.e.
$y_c$
is a proper indicator for the structural deformation because only the first mode is observed in these cases. Physically, it represents the normal component of the displacement of the centroid relative to the undeformed state (reference state) as indicated in figure 1(a), i.e. $y_c=\boldsymbol{r}_c\boldsymbol{\cdot }\boldsymbol{n}$
,
$y_c=\boldsymbol{r}_c\boldsymbol{\cdot }\boldsymbol{n}$
, $\boldsymbol{n}=[{\rm sin}(\theta ),{\rm cos}(\theta )]$
. Here, the dynamic of
$\boldsymbol{n}=[{\rm sin}(\theta ),{\rm cos}(\theta )]$
. Here, the dynamic of $\boldsymbol{r}_c$
depends on the nonlinear interplay of the natural hyperelasticity and external fluid load. So
$\boldsymbol{r}_c$
depends on the nonlinear interplay of the natural hyperelasticity and external fluid load. So $y_c$
measures the foil’s deviation magnitude from its reference state when deformed. Figure 8(a) plots the time histories of
$y_c$
measures the foil’s deviation magnitude from its reference state when deformed. Figure 8(a) plots the time histories of $y_c$
for various
$y_c$
for various $\textit{Ae}$
in this sequence. It shows that as
$\textit{Ae}$
in this sequence. It shows that as $\textit{Ae}$
increases, the foil tends to undergo more complicated fluctuation, in that other than the prescribed motion frequency, higher-order frequency stemming from the nonlinearity steps in. Notwithstanding the complexity, the boundary values of
$\textit{Ae}$
increases, the foil tends to undergo more complicated fluctuation, in that other than the prescribed motion frequency, higher-order frequency stemming from the nonlinearity steps in. Notwithstanding the complexity, the boundary values of $y_c$
of the recovery phases are insightful to approximate the overall effect of the passive deformation upon the beat speed. Herein, we define a new variable
$y_c$
of the recovery phases are insightful to approximate the overall effect of the passive deformation upon the beat speed. Herein, we define a new variable $\chi$
as
$\chi$
as
 \begin{equation} \chi =\frac {1}{2}\left (\frac {y_c(0.25T)-y_c(0.5T)}{0.25T}-\frac {y_c(0.75T)-y_c(T)}{0.25T} \right )\!. \end{equation}
Here, $\chi$
represents the average time change rate of
$\chi$
represents the average time change rate of $y_c$
during the recovery phases, and thus can be considered as an additional beat speed exerted by the passive deformation. Higher
$y_c$
during the recovery phases, and thus can be considered as an additional beat speed exerted by the passive deformation. Higher $\chi$
means a more beneficial effect on the beat speed, and negative
$\chi$
means a more beneficial effect on the beat speed, and negative $\chi$
indicates a diminishing effect. We present this quantity versus
$\chi$
indicates a diminishing effect. We present this quantity versus $\textit{Ae}$
in figure 8(b), together with the velocity increase rate
$\textit{Ae}$
in figure 8(b), together with the velocity increase rate $\varepsilon$
. As expected, the two quantities share the same trend, suggesting that the added beat speed
$\varepsilon$
. As expected, the two quantities share the same trend, suggesting that the added beat speed $\chi$
induced by the foil deformation is a predominant factor determining the propulsive performance. Quantitatively, this confirms our previous findings: it is the increased beat speed (
$\chi$
induced by the foil deformation is a predominant factor determining the propulsive performance. Quantitatively, this confirms our previous findings: it is the increased beat speed ( $\chi \gt 0$
) of flexible foils that leads to the velocity enhancement compared with the rigid one, and the propulsive velocity collapse is caused by the collapse of beat speed.
$\chi \gt 0$
) of flexible foils that leads to the velocity enhancement compared with the rigid one, and the propulsive velocity collapse is caused by the collapse of beat speed.
(a) Time histories of $y_c$
for various
$y_c$
for various $\textit{Ae}$
. (b) Velocity increase rate
$\textit{Ae}$
. (b) Velocity increase rate $\varepsilon$
(green symbols) and added beat speed
$\varepsilon$
(green symbols) and added beat speed $\chi$
(red symbols) versus
$\chi$
(red symbols) versus $\textit{Ae}$
. Here,
$\textit{Ae}$
. Here, $\chi$
is defined by (5.3), and
$\chi$
is defined by (5.3), and $\tilde {\theta }=5\unicode{x03C0} /36$
.
$\tilde {\theta }=5\unicode{x03C0} /36$
.


Instantaneous configurations of the foil within a pitching cycle, for $\tilde {\theta }=7\unicode{x03C0} /36$
.
$\tilde {\theta }=7\unicode{x03C0} /36$
.

Next, we demonstrate the foil deformation for the sequence for $\tilde {\theta }=7\unicode{x03C0} /36$
in figure 9. There are mainly two differences compared with the previous sequence for
$\tilde {\theta }=7\unicode{x03C0} /36$
in figure 9. There are mainly two differences compared with the previous sequence for $\tilde {\theta }=5\unicode{x03C0} /36$
. First, the body fails to exhibit a perfect spindle shape as before because of considerable tangential displacement along the membrane foil. Second, the second deformation mode (full sine) is triggered at some instants marked with blue profiles. Despite the differences, the physical mechanism of the velocity collapse that we concluded in the previous sequence is still valid here. Specifically, at
$\tilde {\theta }=5\unicode{x03C0} /36$
. First, the body fails to exhibit a perfect spindle shape as before because of considerable tangential displacement along the membrane foil. Second, the second deformation mode (full sine) is triggered at some instants marked with blue profiles. Despite the differences, the physical mechanism of the velocity collapse that we concluded in the previous sequence is still valid here. Specifically, at $Ae=2$
, the overall foil deformation during the recovery phase is in phase with the pitching motion, leading to the maximum propulsive velocity as shown in figure 3(a). After that, the velocity collapse happens at
$Ae=2$
, the overall foil deformation during the recovery phase is in phase with the pitching motion, leading to the maximum propulsive velocity as shown in figure 3(a). After that, the velocity collapse happens at $Ae=3$
, where the deformation is approximately out of phase with the pitching motion. Similarly, we present the time evolution of
$Ae=3$
, where the deformation is approximately out of phase with the pitching motion. Similarly, we present the time evolution of $y_c$
for various
$y_c$
for various $\textit{Ae}$
, and the variation of
$\textit{Ae}$
, and the variation of $\varepsilon$
and
$\varepsilon$
and $\chi$
with
$\chi$
with $\textit{Ae}$
in figure 11 for this sequence. It is seen that the collapse of
$\textit{Ae}$
in figure 11 for this sequence. It is seen that the collapse of $\varepsilon$
more or less coincides with the steep drop of
$\varepsilon$
more or less coincides with the steep drop of $\chi$
from a positive value to a negative one, and the two quantities trend upwards to zero simultaneously. The correlation of
$\chi$
from a positive value to a negative one, and the two quantities trend upwards to zero simultaneously. The correlation of $\varepsilon$
and
$\varepsilon$
and $\chi$
approximately aligns with the pattern that we have previously observed.
$\chi$
approximately aligns with the pattern that we have previously observed.
Same as figure 8 but for $\tilde {\theta }=7\unicode{x03C0} /36$
.
$\tilde {\theta }=7\unicode{x03C0} /36$
.

However, it is necessary to point out that the consistency of the change trends of these two quantities is undermined compared with figure 8(b). This may be attributed to the increased complexity of foil deformation, particularly the involvement of the second mode. In this sense, the dynamics of the foil centroid ( $y_c$
) alone is insufficient to capture the deformation of the entire structure, thus is unable to quantify the impact of passive deformation upon the beat speed as precisely as before. Therefore, the definition of added beat speed needs to be revised by incorporating the dynamics of the foil as a whole, which will be our future exploration.
$y_c$
) alone is insufficient to capture the deformation of the entire structure, thus is unable to quantify the impact of passive deformation upon the beat speed as precisely as before. Therefore, the definition of added beat speed needs to be revised by incorporating the dynamics of the foil as a whole, which will be our future exploration.
(a) The mean velocity $V_a$
versus
$V_a$
versus $\textit{Ae}$
for various Reynolds numbers. (b) The velocity collapse amplitude
$\textit{Ae}$
for various Reynolds numbers. (b) The velocity collapse amplitude $A_v$
as indicated in (a), and the corresponding collapse of the added beat speed
$A_v$
as indicated in (a), and the corresponding collapse of the added beat speed $A_\chi$
.
$A_\chi$
. $\tilde {\theta }=5\unicode{x03C0} /36$
.
$\tilde {\theta }=5\unicode{x03C0} /36$
.

6. Effect of Reynolds number
Since the system is self-propelled, the propulsive-speed-based Reynolds number is case-dependent in the present work, and its highest value is approximately $50$
according to figure 3(a). This value is within the locomotion regime of micro-swimmers, but lower than that of bats. One may raise the following question: how does the viscosity affect the velocity crisis? In this section, therefore, we provide results of further investigation into the effect of Reynolds number upon the propulsive speed of the membrane foil. For this study, we fix the pitching amplitude at
$50$
according to figure 3(a). This value is within the locomotion regime of micro-swimmers, but lower than that of bats. One may raise the following question: how does the viscosity affect the velocity crisis? In this section, therefore, we provide results of further investigation into the effect of Reynolds number upon the propulsive speed of the membrane foil. For this study, we fix the pitching amplitude at $5\unicode{x03C0} /36$
, and
$5\unicode{x03C0} /36$
, and $\textit{Re}$
varies over
$\textit{Re}$
varies over $200\leqslant {Re}\leqslant 800$
. Figure 12(a) presents the average velocity
$200\leqslant {Re}\leqslant 800$
. Figure 12(a) presents the average velocity $V_a$
versus
$V_a$
versus $\textit{Ae}$
for various
$\textit{Ae}$
for various $\textit{Re}$
. It shows that increasing
$\textit{Re}$
. It shows that increasing $\textit{Re}$
tends to improve the locomotion speed
$\textit{Re}$
tends to improve the locomotion speed $V_a$
due to the reduced viscous drag. However, the velocity collapsing and rebounding points (
$V_a$
due to the reduced viscous drag. However, the velocity collapsing and rebounding points ( $\textit{Ae}$
at which the collapse and rebound happen) remain unchanged as
$\textit{Ae}$
at which the collapse and rebound happen) remain unchanged as $\textit{Re}$
varies. This implies that the viscous effect exerts negligible influence on the phase of the passive structural deformation of the membrane foil. Notwithstanding this, the collapse amplitude
$\textit{Re}$
varies. This implies that the viscous effect exerts negligible influence on the phase of the passive structural deformation of the membrane foil. Notwithstanding this, the collapse amplitude $A_v$
(velocity difference of the ante- and post-collapse cases,
$A_v$
(velocity difference of the ante- and post-collapse cases, $Ae=3$
and
$Ae=3$
and $Ae=5$
, respectively) grows gradually as
$Ae=5$
, respectively) grows gradually as $\textit{Re}$
increases, as shown in figure 12(b), meaning that higher
$\textit{Re}$
increases, as shown in figure 12(b), meaning that higher $\textit{Re}$
tends to create more pronounced velocity collapse. This can be attributed to the increased added beat speed collapse (
$\textit{Re}$
tends to create more pronounced velocity collapse. This can be attributed to the increased added beat speed collapse ( $A_\chi =\chi (Ae=3)-\chi (Ae=5)$
) between the two cases according to our previous analysis.
$A_\chi =\chi (Ae=3)-\chi (Ae=5)$
) between the two cases according to our previous analysis.
The instantaneous vorticity contours of wake patterns for $\tilde {\theta }=5\unicode{x03C0} /36$
. The blue and red contours, respectively, represent anticlockwise and clockwise rotating vortices. All snapshots are extracted at
$\tilde {\theta }=5\unicode{x03C0} /36$
. The blue and red contours, respectively, represent anticlockwise and clockwise rotating vortices. All snapshots are extracted at $t=T$
.
$t=T$
.

Same as figure 13 but for $\tilde {\theta }=7\unicode{x03C0} /36$
.
$\tilde {\theta }=7\unicode{x03C0} /36$
.

7. Wake patterns
Vortex formation and organisation are issues of central importance to flapping foils because they directly affect the propulsive force generation. We present the vortex-shedding behaviours of the flapping foil in this section, and we are particularly interested in the impact of the velocity collapse on the wake pattern. Figure 13 presents the vorticity contours of wake structures for various $\textit{Ae}$
in the sequence
$\textit{Ae}$
in the sequence $\tilde {\theta }=5\unicode{x03C0} /36$
. It demonstrates that most cases in this sequence create a reversed von Kármán vortex street in the wake, in which a pair of vortices with opposite signs are alternately shed per oscillation period, forming a row of anticlockwise-rotating vortices located above the centreline, and the other row of clockwise-rotating vortices below the centreline. One exception is the velocity collapse case, in which a chaotic vortical structure is obtained. This is physically reasonable because the absence of flow velocity (accordingly, the Strouhal number is close to infinity) makes vortices concentrate around the foil, rather than quickly diffusing downstream.
$\tilde {\theta }=5\unicode{x03C0} /36$
. It demonstrates that most cases in this sequence create a reversed von Kármán vortex street in the wake, in which a pair of vortices with opposite signs are alternately shed per oscillation period, forming a row of anticlockwise-rotating vortices located above the centreline, and the other row of clockwise-rotating vortices below the centreline. One exception is the velocity collapse case, in which a chaotic vortical structure is obtained. This is physically reasonable because the absence of flow velocity (accordingly, the Strouhal number is close to infinity) makes vortices concentrate around the foil, rather than quickly diffusing downstream.
Figure 14 shows the wake patterns for $\tilde {\theta }=7\unicode{x03C0} /36$
. Apart from the reversed von Kármán vortex street, two other wake patterns are obtained: the deflected reversed von Kármán vortex street, and the 2P wake, with two vortex pairs being shed per oscillation period. The 2P wake can be attributed to the increased pitching amplitude (Zhu et al. Reference Zhu, He and Zhang2014b
). It is also interesting to note that the velocity collapse in this sequence does not cause chaotic vortices in the wake. We attribute this to the fact that its residual velocity after the collapse is not as negligible as the previous sequence as shown in figure 3(a).
$\tilde {\theta }=7\unicode{x03C0} /36$
. Apart from the reversed von Kármán vortex street, two other wake patterns are obtained: the deflected reversed von Kármán vortex street, and the 2P wake, with two vortex pairs being shed per oscillation period. The 2P wake can be attributed to the increased pitching amplitude (Zhu et al. Reference Zhu, He and Zhang2014b
). It is also interesting to note that the velocity collapse in this sequence does not cause chaotic vortices in the wake. We attribute this to the fact that its residual velocity after the collapse is not as negligible as the previous sequence as shown in figure 3(a).
Wake patterns with different pitching amplitude $\tilde {\theta }$
and aeroelastic number
$\tilde {\theta }$
and aeroelastic number $\textit{Ae}$
. The red triangles represent reversed von Kármán wake, blue diamonds indicate 2P wake, pink circles indicate deflected reversed von Kármán wake, and dark stars mean chaotic wake.
$\textit{Ae}$
. The red triangles represent reversed von Kármán wake, blue diamonds indicate 2P wake, pink circles indicate deflected reversed von Kármán wake, and dark stars mean chaotic wake.

Throughout the parameter space that we consider, we identified only the aforementioned four distinct wake patterns. Figure 15 shows the phase diagram for the four typical wake patterns in the $\tilde {\theta }{-}Ae$
plane. Notice that some cases in the sequence
$\tilde {\theta }{-}Ae$
plane. Notice that some cases in the sequence $3\unicode{x03C0} /36$
are assigned no symbols, and sequences smaller than
$3\unicode{x03C0} /36$
are assigned no symbols, and sequences smaller than $3\unicode{x03C0} /36$
are not presented here. This is because the viscous effect in these cases is overwhelmingly strong such that vortices are quickly dissipated away once shed. As a result, there is no discernible vortical structure in the wake. The figure shows that most cases exhibit reversed von Kármán wake, which is consistent with the observation of Peng et al. (Reference Peng, Sun, Yang, Xiong, Wang and Wang2022) that flapping foils tend to create either reversed von Kármán or deflected wake in the quasi-steady state where the thrust is balanced by drag. Exceptions are those near the velocity collapse region. For example, 2P wakes are produced when the velocity is about to collapse at
$3\unicode{x03C0} /36$
are not presented here. This is because the viscous effect in these cases is overwhelmingly strong such that vortices are quickly dissipated away once shed. As a result, there is no discernible vortical structure in the wake. The figure shows that most cases exhibit reversed von Kármán wake, which is consistent with the observation of Peng et al. (Reference Peng, Sun, Yang, Xiong, Wang and Wang2022) that flapping foils tend to create either reversed von Kármán or deflected wake in the quasi-steady state where the thrust is balanced by drag. Exceptions are those near the velocity collapse region. For example, 2P wakes are produced when the velocity is about to collapse at $Ae=3$
for the sequences for
$Ae=3$
for the sequences for $\tilde {\theta }=6\unicode{x03C0} /36$
and
$\tilde {\theta }=6\unicode{x03C0} /36$
and $7\unicode{x03C0} /36$
. However, the 2P wake may also be seen when the propulsive velocity reaches a high level such as in the case
$7\unicode{x03C0} /36$
. However, the 2P wake may also be seen when the propulsive velocity reaches a high level such as in the case $Ae=2,\ \tilde {\theta }=7\unicode{x03C0} /36$
. So there is no direct connection between the two issues. Nevertheless, the wake is likely to get chaotic as the foil completely stalls.
$Ae=2,\ \tilde {\theta }=7\unicode{x03C0} /36$
. So there is no direct connection between the two issues. Nevertheless, the wake is likely to get chaotic as the foil completely stalls.
Distributions of time-averaged fluid velocity $V_r$
relative to the foil in the axial direction, where
$V_r$
relative to the foil in the axial direction, where $V_r$
is defined by (7.1).
$V_r$
is defined by (7.1).

The influence of wake patterns upon the propulsive capacity can be reflected by the time-averaged downstream flow that they induce. Thrust is produced when the downstream flow is in the form of jet flow, while trivial thrust or drag can be created if it has the form of a drag wake. In figure 16, we present the time-averaged horizontal flow velocity ( $V_r$
) relative to the foil from a sampling window as shown in figure 13(d). The window moves together with the foil and
$V_r$
) relative to the foil from a sampling window as shown in figure 13(d). The window moves together with the foil and $V_r$
is defined by
$V_r$
is defined by
 \begin{equation} V_r(\boldsymbol{x})=\frac {\displaystyle\int _T \left(u_x(t,\boldsymbol{x})+V(t)\right )\,{\rm d}t}{T}, \end{equation}
in which $u_x$
denotes the instantaneous horizontal fluid velocity, and
$u_x$
denotes the instantaneous horizontal fluid velocity, and $V$
is the propulsive speed of the foil whose direction is opposite to that of the
$V$
is the propulsive speed of the foil whose direction is opposite to that of the $x$
axis. The ante- and post-collapse cases (i.e.
$x$
axis. The ante- and post-collapse cases (i.e. $Ae=3,5$
for
$Ae=3,5$
for $\tilde {\theta }=5\unicode{x03C0} /36$
, and
$\tilde {\theta }=5\unicode{x03C0} /36$
, and $Ae=2,5$
for
$Ae=2,5$
for $\tilde {\theta }=7\unicode{x03C0} /36$
) encompass the four wake patterns that we have identified, so only these four cases are considered here. As shown in figure 16(a), the reversed von Kármán vortex street is able to induce a clear jet flow such that considerable propulsive velocity is achieved for the ante-collapse case
$\tilde {\theta }=7\unicode{x03C0} /36$
) encompass the four wake patterns that we have identified, so only these four cases are considered here. As shown in figure 16(a), the reversed von Kármán vortex street is able to induce a clear jet flow such that considerable propulsive velocity is achieved for the ante-collapse case $\tilde {\theta }=5\unicode{x03C0} /36$
. Its post-collapse case accompanied by a chaotic wake (see figure 13
d), however, tends to create a reverse flow region (see figure 16
b) instead, which severely undermines the thrust generation and propulsive speed. For
$\tilde {\theta }=5\unicode{x03C0} /36$
. Its post-collapse case accompanied by a chaotic wake (see figure 13
d), however, tends to create a reverse flow region (see figure 16
b) instead, which severely undermines the thrust generation and propulsive speed. For $\tilde {\theta }=7\unicode{x03C0} /36$
, a bifurcated jet flow is obtained in figure 16(c) due to the 2P wake of the ante-collapse case. The jet flow becomes weaker and asymmetric in figure 16(d), leading to the velocity collapse.
$\tilde {\theta }=7\unicode{x03C0} /36$
, a bifurcated jet flow is obtained in figure 16(c) due to the 2P wake of the ante-collapse case. The jet flow becomes weaker and asymmetric in figure 16(d), leading to the velocity collapse.
8. Conclusions
The interaction of hyperelastic membrane with fluid is common in nature, particularly in the flying motion of many animals. High-fidelity modelling of this problem is important for not only behavioural biology research but also the development of efficient bio-inspired robots. Yet studies of this kind are rare. Therefore, we present a numerical exploration to fill this gap.
First, the governing equation of a biomimetic hyperelastic membrane foil is formulated within a Lagrangian coordinate system by using free-body analysis, then it is coupled with Navier–Stokes equations within an immersed boundary framework that enables convenient treatment of largely deformed interface. An explicit Runge–Kutta method is employed for the time-marching of the nonlinear structural equation. The accuracy of the developed numerical model is validated through relaxation tests of a hyperelastic filament in ambient fluid subject to gravitational field. The simulation results are consistent with theoretical predictions, showing good accuracy of the model.
By using the fluid–structure interaction model, we then investigate the hyperelastic characteristics of a bio-inspired membrane foil doing periodic pitching motion in fluid for self-propulsion. A parametric study is conducted to explore the effect of pitching amplitude and membrane compliance (characterised by the aeroelastic number). The frequency-based Reynolds number, pre-stretch ratio and mass ratio between the foil and fluid are all kept unchanged. Unlike the traditional bending-dominated flapping foils whose propulsive performance will certainly be improved once the foil (unless the structure is super-flexible) undergoes passive deformation, the compliant membrane foil displays very complicated characteristics depending on its compliance. Specifically, the propulsive performance can be improved on some occasions when the passive deformation is in phase with the active pitching motion because of the increased beat speed. Otherwise, the two motions might be out of phase on other occasions, leading to a beat speed loss. As a result, the system is significantly undermined in its propulsive capability, and even gets stuck in a velocity crisis. Moreover, parametric study on Reynolds number $\textit{Re}$
suggests that higher
$\textit{Re}$
suggests that higher $\textit{Re}$
tends to magnify the velocity crisis. Finally, four wake patterns of the flapping membrane foil are successfully identified, and their connection with the propulsion performance is illustrated.
$\textit{Re}$
tends to magnify the velocity crisis. Finally, four wake patterns of the flapping membrane foil are successfully identified, and their connection with the propulsion performance is illustrated.
Despite the mechanism of the propulsive improvement and crisis that has been disclosed, it is still a challenge to predict the foil deformation mode in advance given its structural properties and the kinematics of the prescribed motion due to the sophisticated and nonlinear fluid–structure interactions. Moreover, the solid–fluid density ratio $R$
and pre-stretch ratio
$R$
and pre-stretch ratio $\lambda _0$
are also crucial factors determining the hyperelasticity of the foil. The effect of these parameters is not considered in this work. Clearly, the present study is only the start to further explore hyperelastic swimmers. Much more work still needs to be done. Last but not least, it is unclear whether natural systems such as bats are also faced with this crisis, and if so, what active control strategy or passive structural property has evolved to circumvent the velocity crisis. These unsolved issues will be our future research directions.
$\lambda _0$
are also crucial factors determining the hyperelasticity of the foil. The effect of these parameters is not considered in this work. Clearly, the present study is only the start to further explore hyperelastic swimmers. Much more work still needs to be done. Last but not least, it is unclear whether natural systems such as bats are also faced with this crisis, and if so, what active control strategy or passive structural property has evolved to circumvent the velocity crisis. These unsolved issues will be our future research directions.
Acknowledgement
We thank V. Mathai from the University of Massachusetts Amherst for inspiring the direction.
Funding
We gratefully acknowledge financial support from the Max Planck Society, and the German Research Foundation (DFG) from grants 521319293, 540422505, 550262949. We also thank the HPC systems of Max Planck Computing and Data Facility (MPCDF) for allocation of computational time.
Declaration of interests
The authors report no conflict of interest.
Appendix A. Free-body analysis
As displayed in figure 17, a uniform extensible cable with zero bending stiffness hangs between two fixed points $A$
and
$A$
and $B$
at the same level. The structure is initially pre-stretched by ratio
$B$
at the same level. The structure is initially pre-stretched by ratio $\lambda _0=c/L$
. Here,
$\lambda _0=c/L$
. Here, $s\in [0,c]$
stands for the arc length of any arbitrary particle along the cable from point
$s\in [0,c]$
stands for the arc length of any arbitrary particle along the cable from point $A$
at its initial state. The corresponding values at its natural and deformed state are
$A$
at its initial state. The corresponding values at its natural and deformed state are $s_0\in [0,L]$
and
$s_0\in [0,L]$
and $\zeta$
, respectively. Consider a small free body of length
$\zeta$
, respectively. Consider a small free body of length $\Delta s$
of the cable at location
$\Delta s$
of the cable at location $s$
, as shown in figure 17(a). The dynamic equation of the free body is given by
$s$
, as shown in figure 17(a). The dynamic equation of the free body is given by
 \begin{align} m_c\frac {\partial ^2 x(s)}{\partial t^2}\,\Delta s&=\tau \frac {\partial x(s)}{\partial \zeta }+\frac {\partial }{\partial s}\left (\tau \frac {\partial x(s)}{\partial \zeta }\right )\Delta s-\tau \frac {\partial x(s)}{\partial \zeta }+F_x\,\Delta s, \end{align}
 \begin{align} m_c\frac {\partial ^2 y(s)}{\partial t^2}\,\Delta s&=\tau \frac {\partial y(s)}{\partial \zeta }+\frac {\partial }{\partial s}\left (\tau \frac {\partial y(s)}{\partial \zeta }\right )\Delta s-\tau \frac {\partial y(s)}{\partial \zeta }+F_y\,\Delta s-m_cg\,\Delta s. \end{align}
Schematic of an extensible one-dimensional foil and its free-body diagram on force balance.

After cancelling out $\Delta s$
, the above equations can be written in the vector form
$\Delta s$
, the above equations can be written in the vector form
 \begin{equation} m_c\frac {\partial ^2 \boldsymbol{X}(s)}{\partial t^2}=\frac {\partial }{\partial s}\left (\tau \frac {\partial \boldsymbol{X}(s)}{\partial \zeta }\right )+\boldsymbol{F}(s)+m_c\boldsymbol{g}. \end{equation}
Note that
 \begin{equation} \frac {\partial \boldsymbol{X}(s)}{\partial \zeta }=\frac {\partial \boldsymbol{X}(s)}{\partial s}\boldsymbol{\cdot }\frac {\partial s}{\partial s_0}\boldsymbol{\cdot }\frac {\partial s_0}{\partial \zeta }= \frac {\partial \boldsymbol{X}(s)}{\partial s}\frac {\lambda _0}{\lambda }, \end{equation}
where $\lambda$
represents the stretch ratio, equal to
$\lambda$
represents the stretch ratio, equal to $\partial \zeta /\partial s_0$
.
$\partial \zeta /\partial s_0$
.
Furthermore, the Gent hyperelastic model yields
 \begin{equation} \tau =G(\lambda -\lambda ^{-2}). \end{equation}
Upon substitution of (A4) and (A5) into (A3), the resultant governing equation becomes
 \begin{equation} m_c\frac {\partial ^2 \boldsymbol{X}(s)}{\partial t^2}=\frac {\partial }{\partial s}\left (G\lambda _0 (1-\lambda ^{-3})\frac {\partial \boldsymbol{X}(s)}{\partial s}\right )+\boldsymbol{F}(s)+m_c\boldsymbol{g}, \end{equation}
where
 \begin{equation} \lambda =\lambda _0\frac {\partial \zeta }{\partial s}=\lambda _0\,\sqrt {\frac {\partial \boldsymbol{X}}{\partial s}\boldsymbol{\cdot }\frac {\partial \boldsymbol{X}}{\partial s}}. \end{equation}
Under the circumstance of free vibration with small deformations, the horizontal stretch is negligible, and only the vertical deflection matters, so the above equation can be reduced to a wave equation,
 \begin{equation} m_c\frac {\partial ^2 y(s)}{\partial t^2}=G\big(\lambda _0-\lambda _0^{-2}\big)\frac {\partial ^2 y(s)}{\partial s^2}, \end{equation}
whose natural frequency $\omega _n$
equals
$\omega _n$
equals $n\unicode{x03C0}\, \sqrt {G(\lambda _0-\lambda _0^{-2})/m_c}\big /c,\ n=1,2,3,\ldots$
.
$n\unicode{x03C0}\, \sqrt {G(\lambda _0-\lambda _0^{-2})/m_c}\big /c,\ n=1,2,3,\ldots$
.
Appendix B. Hyperelastic catenary
In this appendix, we explore the natural shape of a pre-stretched Gent cable under the gravitational effect of hanging between two fixed points. As shown in figure 17(b), we consider a span of cable between point $A$
and location
$A$
and location $s$
, and formulate all forces acting on this cable span. Here,
$s$
, and formulate all forces acting on this cable span. Here, $H$
and
$H$
and $V$
indicate the bracing forces of point
$V$
indicate the bracing forces of point $A$
. The static equations read
$A$
. The static equations read
 \begin{align} \tau \frac {{\rm d }x(s)}{{\rm d\zeta} }&=H \quad \text{(balance of force in $x$ direction)}, \end{align}
 \begin{align} \tau \frac {{\rm d }y(s)}{{\rm d\zeta} }&=V-m_cgs \quad \text{(balance of force in $y$ direction)}, \end{align}
 \begin{align} \left (\frac {{\rm d }x(s)}{{\rm d} \zeta }\right )^2&+\left (\frac {{\rm d }y(s)}{{\rm d} \zeta } \right )^2=1 \quad \text{(geometric constraint)}, \end{align}
 \begin{align} \tau =G&\left (\lambda _0\frac {{\rm d\zeta} }{{\rm d}s}-\left (\lambda _0\frac {{\rm d\zeta} }{{\rm d}s}\right )^{-2}\right ) \quad \text{(tension-deformation relation)}. \\[15pt] \nonumber \end{align}
We square both sides of (B1) and (B2), and superpose them, leading to
 \begin{equation} \tau ^2=H^2+(V-m_cgs)^2. \end{equation}
Since $|{\rm d\zeta} /{\rm d}s-1|$
is a trivial number for small deformations, (B4) can be approximated by
$|{\rm d\zeta} /{\rm d}s-1|$
is a trivial number for small deformations, (B4) can be approximated by
 \begin{equation} \tau -G\left (\lambda _0-\frac {1}{\lambda _0^2}\right )=G\left (\lambda _0+\frac {2}{\lambda _0^2}\right )\left (\frac {{\rm d\zeta} }{{\rm d}s}-1\right )\!. \end{equation}
Therefore we obtain
 \begin{equation} \frac {{\rm d\zeta} }{{\rm d}s}=\frac {\lambda _0^2\tau +3G}{\left(\lambda _0^3+2\right)G}. \end{equation}
Then we have
 \begin{equation} \frac {{\rm d}x}{{\rm d}s}=\frac {{\rm d}x}{{\rm d\zeta} }\frac {{\rm d\zeta} }{{\rm d}s}=\frac {H}{\tau }\frac {\lambda _0^2\tau +3G}{\left(\lambda _0^3+2\right)G}=\frac {H\lambda _0^2}{\left(\lambda _0^3+2\right)G}+\frac {3H}{\left(\lambda _0^3+2\right)\sqrt {H^2+(V-m_cgs)^2}} \end{equation}
and
 \begin{equation} \frac {{\rm d}y}{{\rm d}s}=\frac {{\rm d}y}{{\rm d\zeta} }\frac {{\rm d\zeta} }{{\rm d}s}=\frac {V-m_cgs}{\tau }\frac {\lambda _0^2\tau +3G}{\left(\lambda _0^3+2\right)G}=\frac {\left(V-m_cgs\right)\lambda _0^2}{\left(\lambda _0^3+2\right)G}+\frac {3\left(V-m_cgs\right)}{\left(\lambda _0^3+2\right)\!\sqrt {\!H^2\!+\!\left(V\!-m_cgs\right)^2}}. \end{equation}
By integrating the above two equations over $s$
and using the boundary condition at
$s$
and using the boundary condition at $s=0$
, one finds the explicit expressions for
$s=0$
, one finds the explicit expressions for $x$
and
$x$
and $y$
, i.e.
$y$
, i.e.
 \begin{align} x(s)&=\frac {H\lambda _0^2s}{G\left(\lambda _0^3+2\right)} +\frac {3H}{m_cg\left(\lambda _0^3+2\right)}\left (\sinh ^{-1}\left (\frac {V}{H}\right )-\sinh ^{-1}\left (\frac {V-m_cgs}{H}\right )\right )\!, \end{align}
 \begin{align} y(s)&=\frac {\lambda _0^2(Vs-0.5m_cgs^2)}{G\left(\lambda _0^3+2\right)}+\frac {3 \left(\sqrt {H^2+V^2}-\sqrt {H^2+\left(V-m_cgs\right)^2}\right )}{m_cg\left(\lambda _0^3+2\right)}. \end{align}
The two unknowns $H$
and
$H$
and $V$
are determined by the boundary conditions at point
$V$
are determined by the boundary conditions at point $B$
:
$B$
: $x(c)=l$
,
$x(c)=l$
, $y(c)=0$
. Indeed,
$y(c)=0$
. Indeed, $V$
can be easily obtained through the system symmetry, equalling
$V$
can be easily obtained through the system symmetry, equalling $0.5m_cgc$
, which automatically satisfies
$0.5m_cgc$
, which automatically satisfies $y(c)=0$
. Plugging
$y(c)=0$
. Plugging $V=0.5m_cgc$
into
$V=0.5m_cgc$
into $x(c)=l$
, one finds
$x(c)=l$
, one finds $H$
by solving the equation
$H$
by solving the equation
 \begin{equation} \frac {m_cgc}{2H}=\sinh \left (\frac {lm_cg(\lambda _0^3+2)}{6H}-\frac {\lambda _0^2m_cgc}{6G} \right )\!. \end{equation}
(a) Time histories of the propulsive speed of the foil within a period for various grid sizes, $\Delta t=0.0002$
. (b) Time histories of the propulsive speed of the foil within a period for various time steps,
$\Delta t=0.0002$
. (b) Time histories of the propulsive speed of the foil within a period for various time steps, $\Delta x=\Delta y=0.01$
. The number of Lagrangian points along the foil is
$\Delta x=\Delta y=0.01$
. The number of Lagrangian points along the foil is $N=150$
.
$N=150$
.

Vorticity contours for the cases $\Delta x,\Delta y=0.01$
and
$\Delta x,\Delta y=0.01$
and $\Delta x,\Delta y=0.006$
at time instant
$\Delta x,\Delta y=0.006$
at time instant $t=0.8T$
.
$t=0.8T$
.

Appendix C. Sensitivity study
Here, we present a sensitivity study about the spatial and temporal steps to find their proper values for subsequent simulations. The baseline case here is selected as $Ae=20,\ \tilde {\theta }=5\unicode{x03C0} /36,\ R=0.2,\ \lambda _0=1.05,\ {Re}=800$
. Figure 18(a,b) plot time evolutions of the foil’s speed within a pitching cycle for various grid sizes and time steps, respectively. These show that the speed evolution is not sensitive to the grid size and time step if they are sufficiently small. Moreover, figure 19 presents the wake vorticity distributions for the two cases where the fluidic grid size is sufficiently small, showing that the vorticity is adequately resolved. Based on these tests, the grid size
$Ae=20,\ \tilde {\theta }=5\unicode{x03C0} /36,\ R=0.2,\ \lambda _0=1.05,\ {Re}=800$
. Figure 18(a,b) plot time evolutions of the foil’s speed within a pitching cycle for various grid sizes and time steps, respectively. These show that the speed evolution is not sensitive to the grid size and time step if they are sufficiently small. Moreover, figure 19 presents the wake vorticity distributions for the two cases where the fluidic grid size is sufficiently small, showing that the vorticity is adequately resolved. Based on these tests, the grid size $\Delta x, \Delta y$
and time step
$\Delta x, \Delta y$
and time step $\Delta t$
are chosen to be
$\Delta t$
are chosen to be $0.01$
and
$0.01$
and $0.0002$
, respectively.
$0.0002$
, respectively.


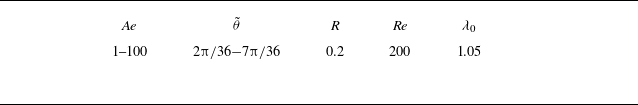


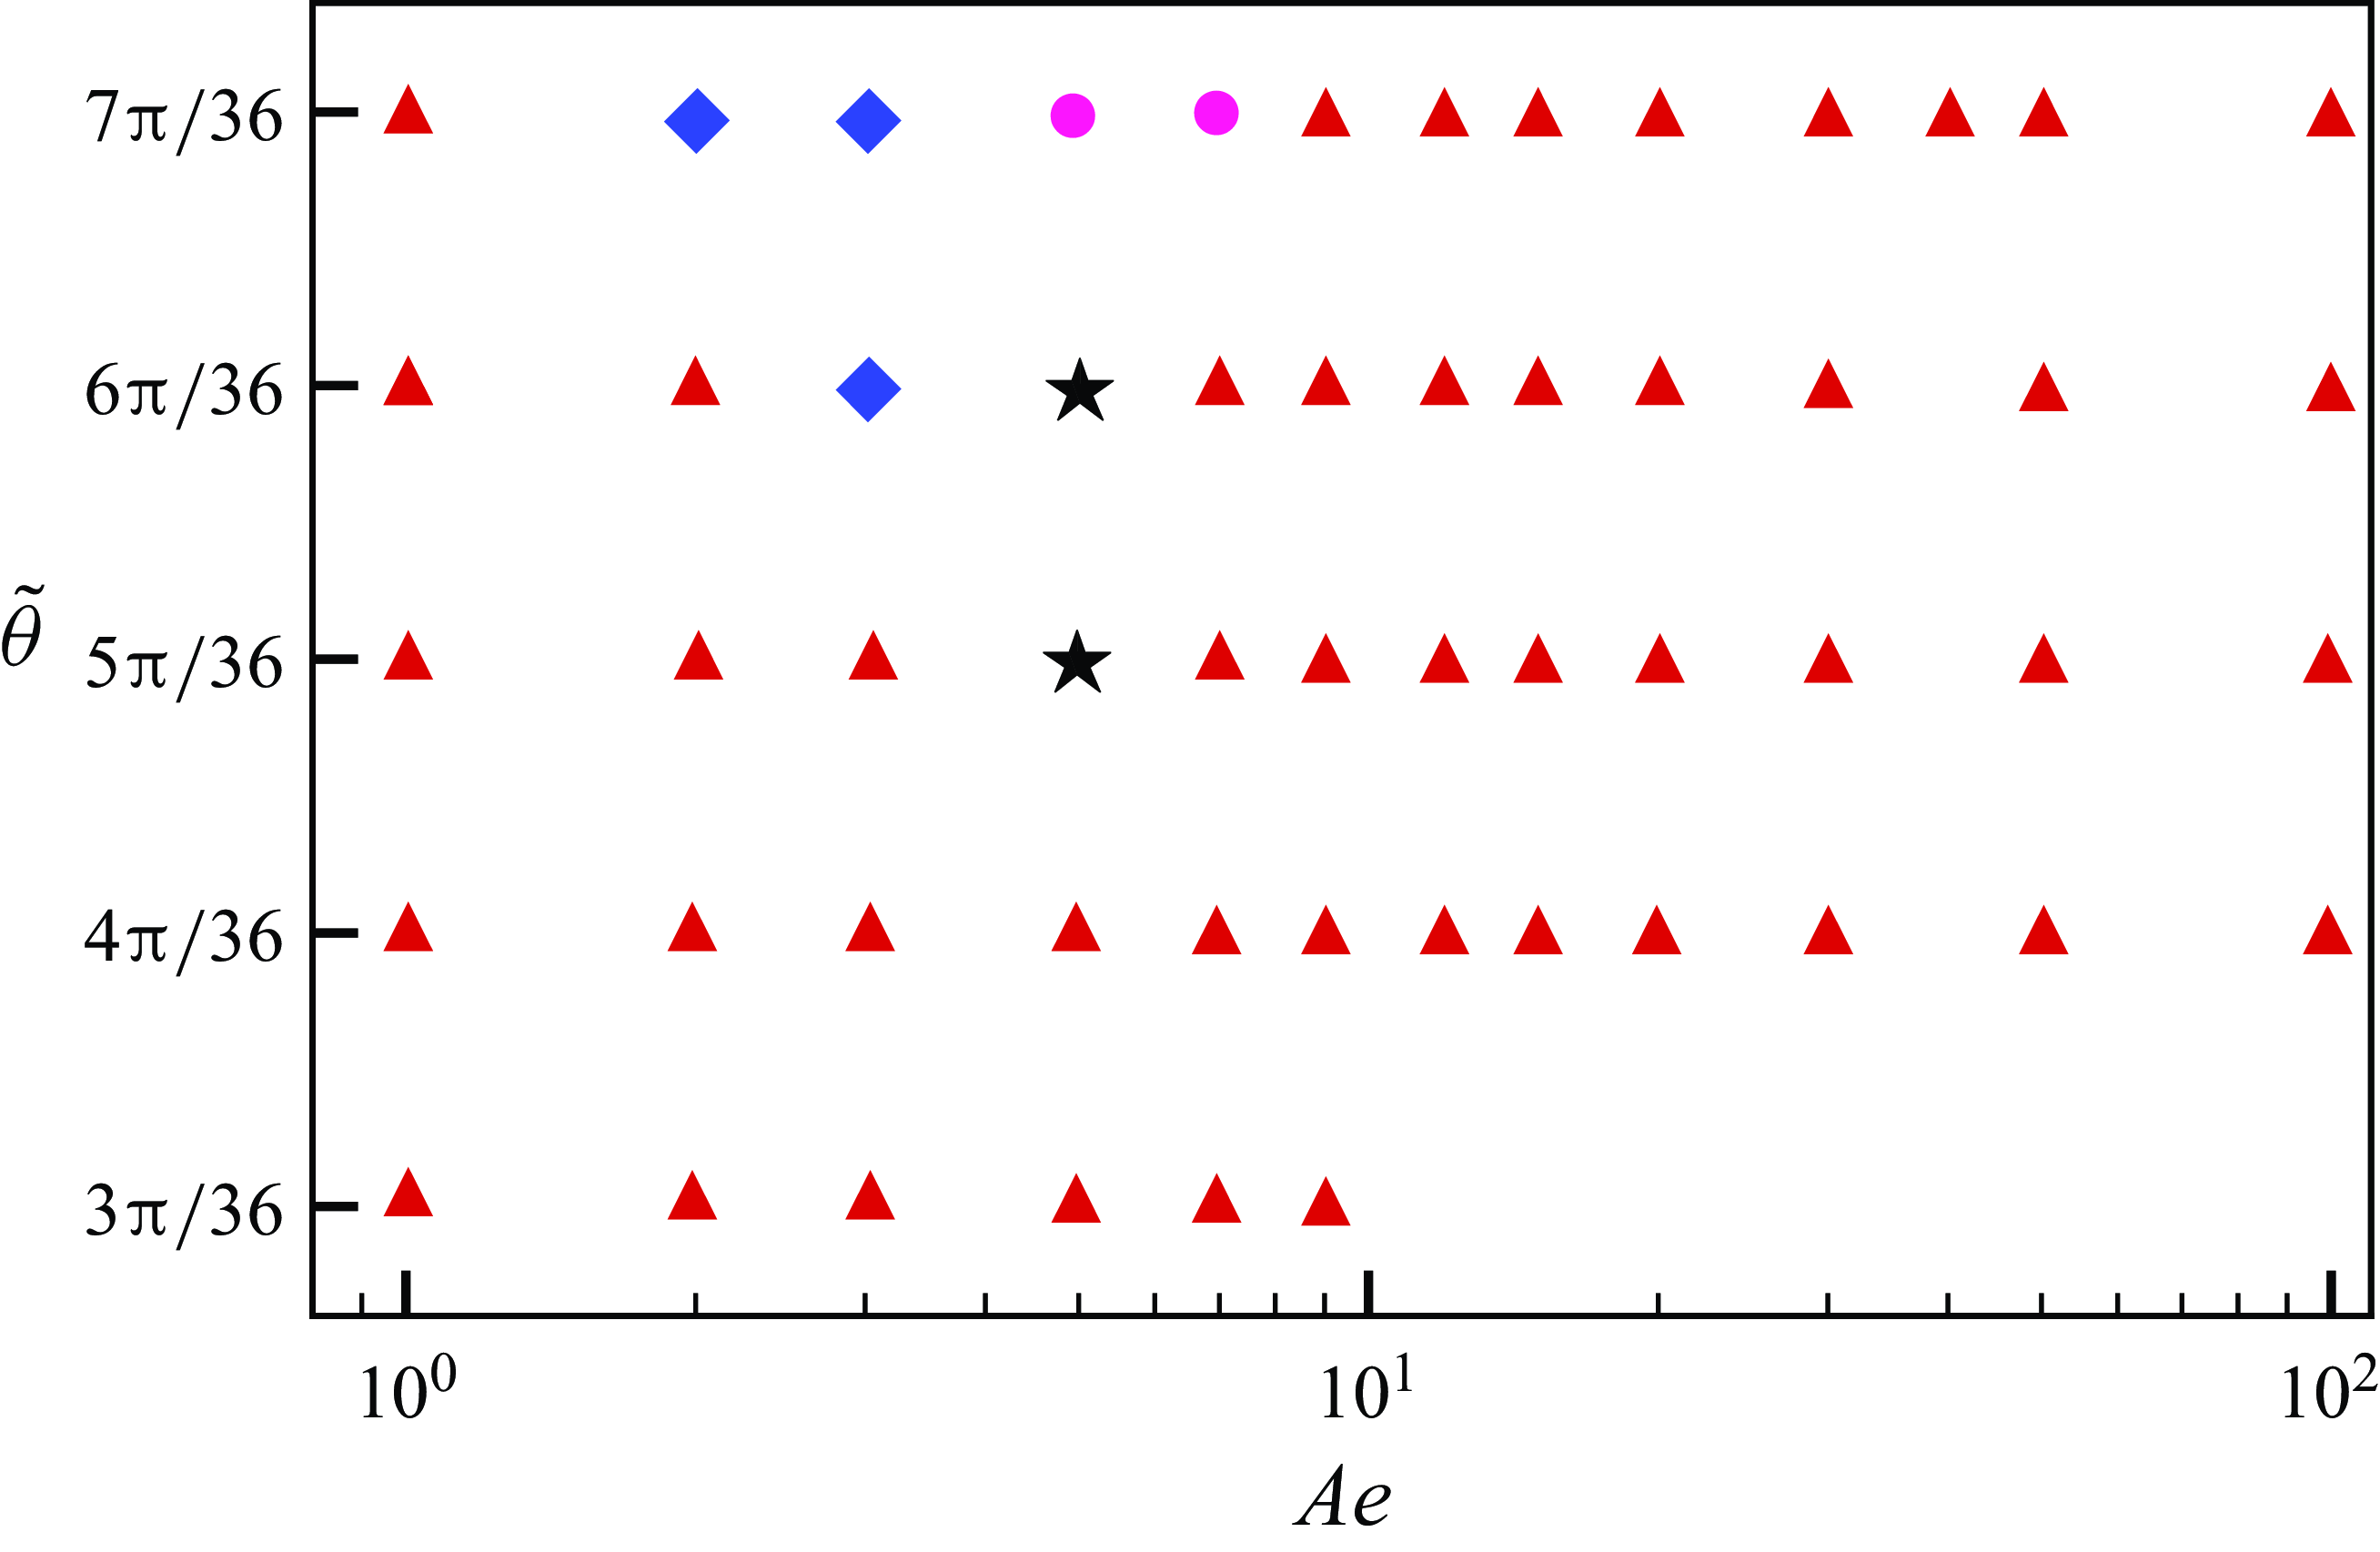


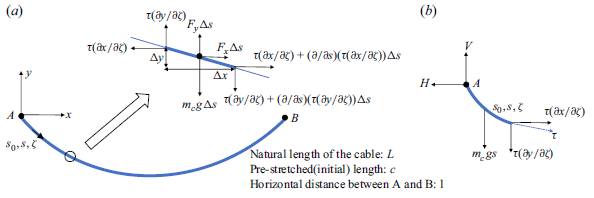
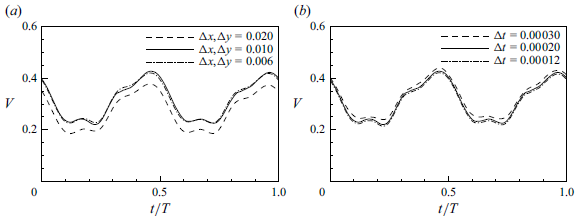


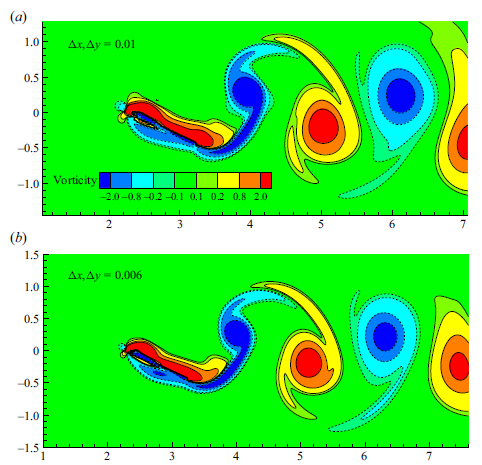


 Open access