

Introduction
Pregnancy and lactation are times of additional demand for Ca. During pregnancy, Ca is transferred across the placenta for fetal skeletal mineralisation, and, during lactation, Ca is supplied to the mammary gland for secretion into breast milk (Figs. 1(a) and (b)). Most fetal Ca accretion takes place during the second half of pregnancy; the accretion rate is about 50 mg/d at 20 weeks of gestation and increases to about 330 mg/d at 35 weeks(Reference Forbes1). The infant contains about 20–30 g Ca at birth(Reference Prentice and Bates2). On average, about 200 mg Ca/d is secreted into breast milk at peak lactation, and can be as much as 400 mg/d in some individuals(Reference Prentice, Pettifor, Juppner and Glorieux3). In theory, this additional maternal requirement for pregnancy and lactation could be met through mobilisation of Ca from the skeleton, increased intestinal Ca absorption efficiency, enhanced renal Ca retention or greater dietary Ca intake. The extent to which any or all of these apply, the underpinning biological mechanisms and the possible consequences for maternal and infant bone health in the short and long term are the focus of the present review. The complexities in the methodological aspects of interpreting the literature in this area are highlighted. The inter-individual variation in the response to pregnancy and lactation is also reviewed, with particular attention given to the influences of maternal Ca intake and vitamin D status.
Schematic diagrams summarising differences in calcium flux, compared with non-pregnant non-lactating women (NPNL), during pregnancy (a), lactation (b) and post-lactation (c). Thicker arrows denote an increase from NPNL; dashed arrows denote a decrease from NPNL.

Methodological considerations
There are many considerations that must be taken into account for a critical appraisal of the literature on Ca physiology and metabolism in human pregnancy and lactation. Among these are design and technical issues relating to: study protocols and subject selection; the measurement of skeletal mineral content, density and size; the physiological changes in weight, plasma volume and glomerular filtration rate; the complexities of dietary assessment; and the measurement of Ca balance and intestinal absorption. These are discussed below. The use of animal models might be expected to overcome some of these difficulties. However, although there is a large literature on pregnancy and lactation in many different animal species, there is no single animal model that closely mimics the physiological changes in human Ca and bone metabolism. Data from the animal literature, therefore, are not considered in the present review but summaries of the evidence can be found elsewhere(Reference Kovacs and Kronenberg4, Reference Kovacs5).
Study designs, baseline and reference data
When interpreting studies of Ca economy in pregnancy and lactation it is essential to consider the study design and the limitations this may impose. Longitudinal study designs, in which serial measurements are made prospectively on the same individual, are the most informative. This is because the likely changes in bone measurements, biochemical markers, dietary intakes and Ca absorption and excretion within an individual are relatively small compared with the range of absolute values in the population. Cross-sectional studies are less able to detect such changes unless the sample size is very large. In addition, retrospective studies are more difficult to interpret because of potential confounding by factors that may not be accurately recalled such as previous weight, factors affecting vitamin D status or use of hormone contraception. In studies of lactation retrospective studies are rarely able to adequately capture the specifics of infant feeding practice, compounded by a lack of consistent definitions for the term ‘lactation’ which can cover a range of breast-feeding behaviours that differ in duration of exclusive and partial lactation, number of feeds per d, and the timing and extent of complementary feeding(Reference Prentice, Pettifor, Juppner and Glorieux3, Reference Sowers, Crutchfield and Jannausch6, Reference Prentice, Laskey, Jarjou, Bonjour and Tsang7).
The most stringent study design is to collect data from women before they become pregnant and to follow them until after lactation has stopped and when sufficient time has elapsed for any permanent effects to become apparent. Serial measurements are required over the same period of time in a comparable group of women who are neither pregnant nor lactating and have not been so recently (non-pregnant non-lactating; NPNL), in order to account for potential variation due to increasing age, weight change and instrument performance(Reference Laskey and Prentice8–Reference Naylor, Iqbal and Fledelius13). In addition, it is important to include a comparative group of non-breast-feeding (NBF) women measured serially after parturition in order to differentiate between the effects of lactation and those of a recent pregnancy in breast-feeding (BF) mothers(Reference Laskey and Prentice8). Although useful for the interpretation of longitudinal studies, it is important to recognise that data from NPNL and NBF women should not be used to make judgements about long-term benefits or detriments of reproduction on maternal Ca economy because, depending on the population being studied, such groups may include women who are less able to conceive(Reference Sowers14) and/or those with differing socio-economic and lifestyle backgrounds.
In practice, such an ideal study is challenging and difficult to achieve. As a result, many researchers have used more limited designs. For studies of metabolic changes in pregnancy, measurements made in the first or second trimester have commonly been used to provide reference data for each individual. Such studies, although valuable, cannot provide information about any post-conception changes that occur very early in pregnancy. Similarly, data collected in the weeks after delivery cannot be used to quantify the net response to pregnancy unless the possible effects of lactation are considered for BF subjects. For studies of lactation, measurements obtained early in the postpartum period (generally within 1 or 2 weeks) have often been used as the initial reference point with serial measurements thereafter. Such studies cannot be used to draw definitive conclusions about the net effects of pregnancy and lactation, because the influence of a recent pregnancy may still be apparent at the initial ‘baseline’ value. Additional complexities arise in the design of lactation studies because of the need to make serial measurements at specified intervals. Typically, these have been set variously relative to the day of delivery (i.e. at set times after delivery), stage of lactation (for example, at peak lactation and/or cessation of lactation) or lactational amenorrhoea (for example, time to first menses).
Measures of bone mineral content, density and size
Studies of Ca economy during pregnancy and lactation require estimates of change in skeletal Ca content. Bone consists of an organic matrix strengthened by deposits of Ca and other minerals; the skeleton contains about 99 % of the total amount of Ca in the body(Reference Ilich and Kerstetter15). The skeleton of an adult woman contains approximately 1 kg Ca(Reference Widdowson, Dickerson, Comar and Bronner16). There are two types of bone: cortical and trabecular(Reference Marks, Odgren, Bilezikian, Raisz and Rodan17) and their distribution ensures that a bone can withstand forces without breaking. Cortical bone is dense and compact, found mainly in the shafts of long bones and surrounding other bones, for example, vertebrae, and mostly has mechanical and protective functions. Trabecular bone has an open spongy structure, is found in the ends of long bones and throughout other bones, and is more metabolically active. There is a greater ratio of trabecular:cortical bone in the axial skeleton (spine and hip) and in distal regions of the appendicular skeleton (wrists and ankles) than in the shafts of the long bones. The response of bone to physiological and environmental stimuli can differ between regions of the skeleton. It is important, therefore, to obtain information from several skeletal sites when considering the effects of pregnancy and lactation on Ca economy and bone health.
There are several methods for the in vivo determination of human bone mineral content (BMC), density and size. The most commonly used method is dual-energy X-ray absorptiometry (DXA)(Reference Prentice, Davies and Cole18, Reference Laskey19). DXA has largely replaced dual-photon absorptiometry (DPA), which used radioisotopes rather than X-rays as the source of ionising radiation. DXA and DPA measure BMC, bone area (BA) and areal bone mineral density (aBMD; equivalent to BMC/BA in g/cm2). These provide information about the total amount of mineral present, the size and areal density of bone in the scanned regions, all of which contribute to bone strength(Reference Orwoll20). Most or nearly all researchers report only aBMD because this is the variable that is measured with the greatest precision and is most widely used clinically. However, interpretation is more difficult when DXA data are not reported in full and may account for some of the inconsistencies in results and conclusions between different studies. Estimates of Ca content, and the contribution of the skeleton to Ca economy, are obtained by making assumptions about the proportion of Ca present in the mineral phase of human bone, generally considered to be about 38 %(Reference Olausson, Laskey and Goldberg11). In addition, there are systematic differences in aBMD measurements between different DXA manufacturers.
The reproducibility of DXA is good; the CV of aBMD varies from 1 to 3 %, depending on scanning system and skeletal sites(Reference Laskey, Prentice and Hanratty21). This allows relatively small changes in aBMD within individuals to be detected with confidence. DXA instruments have been optimised for measurements in adults. Several systems have introduced software to enable measurements to be made in infants and children. However, although there are studies that have considered the accuracy and precision of DXA for use in infants(Reference Koo22), there is a lack of consistency between different systems. Estimates of neonatal and infant bone accretion and comparisons of results generated with different instruments, therefore, are problematic and must be viewed with caution(Reference Prentice, Laskey and Goldberg23, Reference Jarjou, Prentice and Sawo24).
There are several points that should be considered when interpreting DXA data. First, values derived by absorptiometry represent an integration over the whole of the organ within the skeletal envelope in the region being scanned and cannot distinguish between cortical, trabecular and non-osseous tissue (for example, within the medullary cavity). Second, aBMD represents the X-ray attenuation within a two-dimensional projection of a three-dimensional structure and is not a measure of true density. As a consequence, aBMD is dependent on bone volume, and bones with the same volumetric density but of different size can have different aBMD(Reference Prentice, Parsons and Cole25–Reference Prentice, Schoenmakers and Laskey27). This can be addressed to some extent by adjusting for bone and body size, for example, using a regression method(Reference Prentice, Parsons and Cole25) or algorithms(Reference Adams and Shaw26, Reference Molgaard, Thomsen and Prentice28, Reference Fewtrell29). Because of this volume effect, the interpretation of aBMD in longitudinal studies can be complicated, especially when there are changes in bone size, for example, during growth or, potentially, in pregnancy or lactation. In such studies, BA can be used to adjust BMC for bone size (BA-adjusted BMC) and the influence of body weight and weight change considered separately(Reference Olausson, Laskey and Goldberg11). Third, the skeleton is responsive to changes in body weight (the greater the weight gain the greater the BMC and aBMD)(Reference Olausson, Laskey and Goldberg11). Finally, because of technicalities associated with bone-edge detection, BA, and hence BMC and aBMD, is influenced by the amount of mineral present and the depth of overlying soft tissue and may change slightly when the mineral content or the tissue depth changes (the greater the mineral present or overlying tissue, the greater the BA)(Reference Prentice, Schoenmakers and Laskey27, Reference Laskey, Murgatroyd and Prentice30). Bone edge detection effects are therefore likely to accompany bone mineral mobilisation/replenishment and changes in body weight and, although generally small, need to be considered when interpreting longitudinal data.
Another X-ray technique for measuring bone mineral and size is quantitative computed tomography (QCT). In contrast to DXA and DPA, QCT measures volumetric bone mineral density (vBMD; g/cm3) and distinguishes between regions of cortical and trabecular bone. In addition, this method measures cross-sectional BA and can provide information about bone shape and the biomechanical properties of the skeleton. Peripheral QCT (pQCT) is designed specifically to measure appendicular skeletal sites, such as the bones of the forearm (radius and ulna) and the leg (tibia, fibula and femur). The reproducibility of vBMD measurements by pQCT is about 2–5 %(Reference Veitch, Findlay and Ingle31).
Quantitative ultrasound (QUS) is a third technique used for studying bone. Two QUS variables are generally reported: broadband ultrasound attenuation (BUA), which is a measure of the energy lost when ultrasound passes through bone mineral and soft tissue, and velocity or speed of sound, through bone. Although these variables are regarded as proxy measures for bone density, the validity of this assumption is uncertain, especially during pregnancy in the presence of peripheral oedema(Reference Johansen and Stone32). In addition, the reproducibility of QUS is relatively poor(Reference Laskey and Prentice33–Reference Njeh, Hans and Li35) which limits its use in longitudinal studies.
DXA, DPA, QCT and pQCT are based on ionising radiation. The radiation dose received during a set of DXA, DPA or pQCT scans is, in general, similar to the daily exposure to background radiation(Reference Adams and Shaw26, Reference Blake, Naeem and Boutros36, Reference Njeh, Fuerst and Hans37), while that received from QCT is higher(Reference Kalender38). Although the dose of radiation is low, whole-body and axial skeletal sites of pregnant women generally are not scanned using DXA, DPA or QCT for research purposes, in order to minimise unnecessary exposure of the fetus and because the results cannot distinguish between maternal and fetal tissues. Peripheral X-ray techniques in which the fetus is not exposed to additional radiation, such as forearm absorptiometry(Reference Black, Topping and Durham39–Reference More, Bettembuk and Bhattoa42) and pQCT(Reference Wisser, Florio and Neff43), are used for studies in pregnant women.
Measures of bone turnover, mineral metabolism and excretion
Supporting information on the contribution of bone metabolism to Ca economy during pregnancy and lactation can be obtained through studies of bone turnover markers. In addition, indices of mineral metabolism, and calciotropic and other hormones, are useful for identifying underlying mechanisms.
Bone undergoes continuous turnover through the actions of bone-resorbing osteoclasts and bone-forming osteoblasts(44). Within a single bone-remodelling unit, osteoclasts erode an area of the mineralised surface to produce a resorption cavity. Over a period of time, this is refilled by bone matrix secreted by osteoblasts, which is subsequently mineralised. In the young adult, the process of bone resorption and formation is usually tightly coupled. This results in overall maintenance of the skeleton with little net change in mineral content(Reference Prentice45). Bone mineral accretion occurs when bone formation exceeds resorption, for example, during growth. Bone mineral loss occurs when resorption exceeds formation, for example, during age-related bone loss.
Markers of bone resorption include collagen breakdown products such as crosslinks (for example, deoxypyridinoline), hydroxyproline and segments of the N-telopeptide (NTx) or C-telopeptide (CTx). Deoxypyridinoline and hydroxyproline are measured in urine; NTx and CTx may be measured in either urine or blood. Markers of bone formation measured in blood include products of osteoblastic synthesis of new bone matrix, such as N- and C-propeptides of type I collagen (P1NP and P1CP, respectively), and proteins involved in osteoblast function such as osteocalcin and bone-specific alkaline phosphatase (ALP). In studies of pregnancy, the use of assays that are specific for bone-specific ALP is essential because in addition to total ALP derived from extra-skeletal sources, the placenta produces an isoenzyme of ALP which is excreted into the circulation.
There are several well-established laboratory techniques for the analysis of markers of mineral metabolism and calciotropic hormones, including sensitive and specific immunoassays and HPLC. These topics are covered more fully elsewhere(Reference Bilezikian, Raisz and Martin46). Technical variations often mean there are difficulties in drawing comparisons between results generated with different assay methods or in different laboratories because of a lack of methodological standardisation for many of the indices relating to mineral and bone metabolism. In addition, there is biological variation in the measured concentration of many of these factors due to circadian rhythms, the pattern of breast-feeding, and the effects of periodic exogenous influences such as recent food intake. For example, the plasma concentration and urinary output of CTx is higher at night than in the afternoon(Reference Hannon and Eastell47), plasma prolactin concentration is raised after a breast-feed(Reference Riordan and Auerbach48) and urinary hydroxyproline excretion is increased temporarily after ingestion of animal protein(Reference Gasser, Celada and Courvoisier49). Interpretation of urinary markers is further complicated by the variety of urine collection methods that are used, such as a random spot sample, the first void of the day, or a timed collection over a set period, most commonly 2 or 24 h. The choice of collection method should be dictated by the specific question being addressed. For example, studies of urinary Ca output require 24 h collections with no restrictions on eating habits, whereas studies of renal phosphate reabsorption require a 2 h collection under fasting conditions. Thus the interpretation of biochemical data may depend on the time and conditions when samples were collected. Ideally, samples should be collected in a standardised way with respect to time of day, recent food intake, and time elapsed since the last meal and/or breast-feed.
A further complication is that the concentrations of blood-borne analytes in pregnancy are affected by the increase in plasma volume and resulting haemodilution. Albumin concentration has been used as a proxy measure to derive a correction factor for haemodilution(Reference Kaur, Godber and Lawson50, Reference Olausson, Laskey and Smith51) but such corrections are not universally applied. Pregnancy is also accompanied by an increase in glomerular filtration rate, which can affect the interpretation of urinary measures. Other factors that need to be considered when interpreting biochemical data during pregnancy and lactation are most notably the need to distinguish between the contribution of the fetus, placenta and mammary gland to bone markers and hormones in the maternal circulation(Reference Kovacs and Kronenberg4, Reference Naylor, Iqbal and Fledelius13, Reference Kaur, Godber and Lawson50). Such issues are rarely discussed in published reports, and studies need to be reviewed with this in mind.
Calcium intake, absorption and balance
Measurements of Ca intake, absorption and balance are important when considering Ca economy in pregnancy and lactation, but can be challenging for subjects and investigators, and difficult to interpret(Reference Weaver, Weaver and Heaney52).
Many techniques are used to assess dietary Ca intake(Reference Boushey, Weaver and Heaney53). All dietary assessment methods, such as weighed records, diaries, FFQ, diet histories and 24 h recalls have their advantages and disadvantages for use in different subject and population groups. No method is appropriate for all situations and the choice depends on what aspect of the diet is under scrutiny: for example, the description of habitual diet, monitoring dietary change, quantifying nutrient intakes, identifying food sources or characterising eating patterns and food groups(Reference Rutishauser, Black, Gibney, Vorster and Kok54, Reference Goldberg, New and Bonjour55). There are relatively few foods that are rich sources of Ca and some are consumed infrequently. A combination of dietary assessment techniques may be needed to provide a more detailed indication of customary Ca intake, especially in populations where milk and milk products are not major components of the diet(Reference Prentice, Laskey and Shaw56). In addition, drinking water and some condiments, flavourings, medicines and over-the-counter preparations and supplements may contain substantial amounts of Ca. Although assessments of Ca intake should include the contribution from these sources, it is uncommon for such information to be routinely collected in dietary studies and surveys, or for the necessary compositional information to be included in food databases. It is important therefore to appreciate fully the dietary assessment methods used when comparing Ca intakes of pregnant and lactating women in different studies.
The absorption of Ca from foods depends on many factors, both endogenous, such as the efficiency of absorption in the intestine and the production of gastric acid, and exogenous, such as vitamin D status (25-hydroxyvitamin D (25OHD) via intake or sun exposure) and the consumption of dietary components that enhance or inhibit Ca absorption(Reference Heaney57). The retention of dietary Ca also depends on the extent to which Ca is excreted through faeces, urine and sweat. The traditional Ca balance study, which measures the difference between intake and output, requires collection of all food consumed and all excretory products over a period of several weeks. In practice, Ca excretion in sweat is rarely quantified but an estimate applied. The use of stable isotopes of Ca (48Ca, 44Ca, 42Ca) allows for the direct quantification of intestinal Ca absorption efficiency over 1–4 d without the need for faecal collections(Reference DeGrazia, Ivanovich and Fellows58). Ca absorption efficiency can also be determined by more indirect methods, such as quantifying the effect of an oral Ca load on plasma Ca concentration and urinary Ca excretion(Reference Weaver, Rothwell and Wood59). Such methods require advanced data-modelling and assumptions about variables that are difficult to measure(Reference O'Brien, Donangelo and Zapata60). There is a lack of information about the validity of these models, estimates and assumptions when applied to pregnancy and lactation.
Calcium economy in pregnancy and lactation: review of the evidence
Maternal bone mineral mobilisation: bone mineral studies
Bone mineral studies have provided evidence that bone mineral mobilisation occurs during human pregnancy and lactation with replenishment of skeletal mineral in the later stages of lactation and after breast-feeding has stopped (Fig. 1). Tables 1–5 and Figs. 2–4 summarise the published results from longitudinal studies in Caucasian women, with Ca intakes close to recommendations, that have investigated whole-body and regional changes in bone mineral measured as change in aBMD or BA-adjusted BMC using DPA or DXA. It was not possible to include change in BMC without correction for BA because few authors provide this information, but where such data are available they have been incorporated in the text. Similarly, the results of the few studies that have used pQCT, QCT or ultrasound are not included in the tables but described in the text. In addition, it has not been possible to provide estimates of the variation between individuals in these studies because insufficient data were provided in most cases. It should also be noted that relatively few studies included comparisons with contemporaneous NPNL controls or, in studies of lactation, comparisons between BF and NBF mothers.
Mean changes (%) in bone mineral at different sites, measured with dual-energy X-ray absorptiometry (DXA) or dual-photon absorptiometry (DPA), between pre-pregnancy (PRE) and up to 6 weeks postpartum (POST)†

NPNL, non-pregnant, non-lactating; NBF, non-breast-feeding; BA, bone area; BMC, bone mineral content; RS, radius shaft; RW, radius wrist; aBMD, areal bone mineral density; QCT, quantitative computed tomography. Statistically significant: * P ≤ 0·05, ** P ≤ 0·01, *** P ≤ 0·001, NS, non-significant, as indicated in original papers.
†All data are for measurements without correction for changes in body weight.
‡ Bone mineral data taken from paper.
§ Bone mineral data derived from tables or figures in paper.
‖ Implausible values? (see text).
¶ Data adjusted for weight.
†† In women of pre-pregnant BMI < 19·8 kg/m2.
‡‡ In women of pre-pregnant BMI 19·8–26·0 kg/m2.
§§ In women of pre-pregnant BMI > 26·0 kg/m2.
‖ ‖ Note: value of − 3·5 % cited in abstract is incorrect.
¶¶ Derived from the original paper by authors of the present review from whole-body scan divided into subregions.
††† Given the small sample size, the original authors concluded that there is a tendency for a decrease in bone mineral status at the spine, but not at the femoral neck or radial shaft.
Mean changes (%) in bone mineral during 3–6 months lactation at different sites, measured with dual-energy X-ray absorptiometry (DXA) or dual-photon absorptiometry (DPA)†

NPNL, non-pregnant, non-lactating; NBF, non-breast-feeding; aBMD, areal bone mineral density; RW, radius wrist; BMC, bone mineral content; BA, bone area; RS, radius shaft; QCT, quantitative computed tomography. Statistically significant: * P ≤ 0·05, ** P ≤ 0·01, *** P ≤ 0·001, NS, non-significant, as indicated in original papers.
† Data are for measurements without correction for changes in body weight, unless specified.
‡ Bone mineral data taken from paper.
§ Bone mineral data derived from tables or figures in paper.
‖ Derived by authors from whole-body scan divided into subregions.
¶ Data adjusted for weight.
Mean net changes (%) in bone mineral at 12 months postpartum at different sites measured with dual-energy X-ray absorptiometry (DXA) or dual-photon absorptiometry (DPA)†

NPNL, non-pregnant, non-lactating; NBF, non-breast-feeding; aBMD, areal bone mineral density; RW, radius wrist; BA, bone area; BMC, bone mineral content; RS, radius shaft. Statistically significant: *P ≤ 0·05, **P ≤ 0·01, ***P ≤ 0·001, NS, non-significant, as indicated in original papers.
† Data are for measurements without correction for changes in body weight.
‡ Bone mineral data taken from paper.
§ Bone mineral data derived from tables or figures in paper.
‖ Bromocryptine after 6 months.
Mean net changes (%) in bone mineral at different sites, measured with dual-energy X-ray absorptiometry (DXA), between early lactation and post-lactation†

NPNL, non-pregnant, non-lactating; NBF, non-breast-feeding; aBMD, areal bone mineral density; BA, bone area; BMC, bone mineral content; RW, radius wrist; RS, radius shaft. Statistically significant: ** P ≤ 0·01, *** P ≤ 0·001, NS, non-significant, as indicated in original papers.
† All data are for measurements without correction for changes in body weight, unless specified.
‡ Bone mineral data taken from paper.
§ Data adjusted for weight.
Mean net changes (%) in bone mineral at different sites measured with dual-energy X-ray absorptiometry (DXA) after resumption of menses†

NPNL, non-pregnant, non-lactating; NBF, non-breast-feeding; aBMD, areal bone mineral density; RS, radius shaft. Statistically significant: * P ≤ 0·05, ** P ≤ 0·01, *** P ≤ 0·001, NS, non-significant, as indicated in original papers.
† All data are for measurements without correction for changes in body weight.
‡ Bone mineral data taken from paper.
§ Bone mineral data derived from tables or figures in paper.
Mean percentage change in bone area-adjusted bone mineral content (BA-adjusted BMC) during pregnancy (pre-pregnancy to 2 weeks postpartum; ▒; n 34) and in non-pregnant, non-lactating (NPNL) controls (□; n 84). Values are means, with standard errors represented by vertical bars. WB, whole body; LS, lumbar spine; TH, total hip; FN, femoral neck. Data taken from Olausson et al. (Reference Olausson, Laskey and Goldberg11).

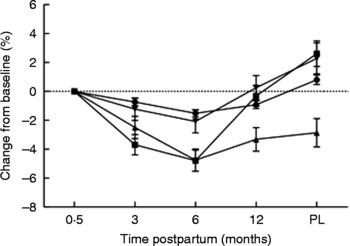
Percentage changes in bone area-adjusted bone mineral content from baseline (2 weeks postpartum) to 3, 6 and 12 months postpartum and 3 months post-lactation (PL) for women lactating > 9 months (n 20). (●), Whole body; (■), lumbar spine; (▲), femoral neck; (▾), trochanter. Values are means, with standard errors represented by vertical bars. Modified from data published by Laskey & Prentice(Reference Laskey and Prentice8).
Percentage changes in bone area-adjusted bone mineral content at the spine from baseline (2 weeks postpartum) to 3, 6 and 12 months postpartum and post-lactation (PL) (12 months postpartum or 3 months post-lactation for mothers who breast-fed for more than 9 months). Subjects are grouped according to length of lactation: < 3 months (●; n 12); 3–6 months (■; n 13); 6–9 months (▲; n 14); > 9 months (▾; n 20); formula feeders (non-breast-feeding; ♦; n 11). A group of twenty-two non-pregnant non-lactating controls (○) was studied in parallel. Values are means, with standard errors represented by vertical bars. Modified from data published by Laskey & Prentice(Reference Laskey and Prentice8).

The mean changes in bone mineral in Tables 1–5 are presented for the different skeletal sites as given in, or derived from, the original papers, before any adjustment for the weight changes associated with pregnancy or lactation, unless stated. When used to study change over time within an individual, the value unadjusted for weight change provides a measure of net or actual change in mineral content, and therefore of Ca mobilisation from or accretion into the skeleton, provided that there is no accompanying change in bone size. Adjustment for weight change allows the effects of pregnancy and lactation on the skeleton to be considered independently of weight effects(Reference Olausson, Laskey and Goldberg11).
Pregnancy
Most longitudinal studies have demonstrated a decrease in bone mineral or no significant change at one or more skeletal sites from before pregnancy to up to 6 weeks postpartum (Table 1 and Fig. 2). Collectively, the mean change in whole-body bone mineral reported in the literature ranges between studies from a significant decrease of − 2·0 % to a non-significant change of +0·5 %. One study divided pre-pregnant women into underweight, normal weight and overweight categories and found a significant interaction with BMI(Reference Butte, Ellis and Wong61). A − 2·0 % decrease in maternal whole-body bone mineral equates approximately to the mobilisation of about 25 g Ca, sufficient to account for much of the Ca needed during pregnancy for fetal bone accretion(Reference Olausson, Laskey and Goldberg11).
Significant decreases or non-significant changes in bone mineral are also reported in different regions of the skeleton. Collectively, the majority of these studies observed a decrease at one or more skeletal sites, with the mean change ranging between studies from − 4·5 to − 0·9 % at the lumbar spine, − 3·6 to +1·8 % at total hip, − 4·8 to − 1·2 % at the trochanter, − 2·4 to +1·2 % at the femoral neck, − 3·8 to +1·3 % at the radial shaft and − 3·8 to +1·3 % at the radius. One study reported much larger decreases in bone mineral at the whole-body, lumbar spine and femoral neck than other studies, averaging − 13·4, − 9·2 and − 7·8 %, respectively(Reference Fiore, Pennisi and DiStefano62). These changes are implausibly large compared with other studies, suggesting there may have been a technical problem. A few studies have measured peripheral sites using DXA during pregnancy. Some showed a significant change in bone mineral at the distal radius from mid-pregnancy to shortly after delivery(Reference Kolthoff, Eiken and Kristensen41, Reference More, Bettembuk and Bhattoa42), whereas others did not(Reference Black, Topping and Durham39, Reference Kent, Price and Gutteridge40).
The data in Table 1 are from investigations using DXA and DPA(Reference Sowers, Crutchfield and Jannausch6, Reference Olausson, Laskey and Goldberg11–Reference Naylor, Iqbal and Fledelius13, Reference Black, Topping and Durham39, Reference More, Bettembuk and Bhattoa42, Reference Butte, Ellis and Wong61–Reference Ritchie, Fung and Halloran67). The one study using pQCT of the distal radius reported a significant decrease in vBMD between the first and last trimester of pregnancy in the trabecular region but not in the cortical region of the bone(Reference Wisser, Florio and Neff43). In one study that used QCT(Reference Ritchie, Fung and Halloran67), vBMD of the lumbar spine increased by 0·6 % (NS) between pre-pregnancy and shortly after delivery. Studies that used QUS of the heel(Reference Fiore, Pennisi and DiStefano62, Reference Gambacciani, Spinetti and Gallo68–Reference Paparella, Giorgino and Maglione73) or the hand(Reference Tranquilli, Giannubilo and Corradetti74–Reference Aguado, Revilla and Hernandez76) reported significant mean decreases in BUA and/or velocity of sound during pregnancy ranging from − 14·5 to − 1·0 %.
The extent to which the skeletal changes observed in longitudinal studies of pregnant women are due to pregnancy per se rather than factors such as ageing and changes in weight can only be gauged in those studies where NPNL controls have been studied contemporaneously(Reference Sowers, Crutchfield and Jannausch6, Reference Olausson, Laskey and Goldberg11, Reference Ulrich, Miller and Eyre12, Reference Kaur, Pearson and Godber64, Reference Drinkwater and Chesnut65). For example, ageing may explain most if not all of the changes observed at the femoral neck but not at other skeletal sites(Reference Olausson, Laskey and Goldberg11). In addition, decreases in measured BMC or aBMD could be explained either fully or partially by an increase in scanned bone size. An increase in BA may result from periosteal apposition or, as described earlier, from technical artifacts caused by changes in the orientation of the scanned bone relative to the X-ray beam and/or changes in bone edge detection. Evidence that skeletal dimensions may be increased by pregnancy comes from a study of older women which demonstrated a positive correlation between parity and BA of the whole-body and femoral neck(Reference Specker and Binkley77). In such circumstances the use of change in BMC, aBMD or BA-adjusted BMC as a measure of change in skeletal mineral content may be insecure.
On an individual basis, the skeletal response to pregnancy is highly variable, with some women experiencing substantial bone mineral loss from one or more skeletal sites while other women have no change or gain bone mineral. For example, the change in bone mineral of the spine ranged from − 7·0 to +3·5 % in a study of women in Finland(Reference Holmberg-Marttila and Sievanen66) and from − 13·6 to +5·0 % among women in the UK(Reference Olausson, Laskey and Goldberg11). Such wide differences are unlikely to reflect statistical or technical artifacts because of the high precision and reproducibility of absorptiometry. The reasons for the observed variation between women are not understood, but the limited evidence suggests that genetic, endocrinological and nutritional factors before or during pregnancy may influence the response(Reference Prentice, Pettifor, Juppner and Glorieux3). For example, substantial increases in bone mineral have been reported in women entering pregnancy after a period of extended lactation compared with those entering pregnancy from the NPNL state(Reference Laskey and Prentice78, Reference Sowers, Randolph and Shapiro79). Women with a low BMI before conception were shown to have greater increases in aBMD at the hip(Reference Sowers, Crutchfield and Jannausch6) and greater decreases in whole-body BMC than other women(Reference Butte, Ellis and Wong61). Pregnant women with the greatest weight gain have been reported to have smaller decreases in bone mineral in line with the relationships seen in NPNL women, but not at all sites(Reference Olausson, Laskey and Goldberg11) and not in all studies(Reference Ulrich, Miller and Eyre12, Reference Naylor, Iqbal and Fledelius13). Such increases may result from increased loading on the skeleton due to the increased weight or may reflect technical artifacts caused by increases in tissue depth and changes in bone edge detection(Reference Olausson, Laskey and Goldberg11, Reference Naylor, Iqbal and Fledelius13). The potential influences of maternal Ca intake and vitamin D status on an individual's skeletal response to pregnancy are discussed later.
3–6 months lactation
Longitudinal studies among BF Caucasian women have reported either no significant change or decreases in bone mineral from shortly after delivery to between 3 and 6 months of lactation (Table 2 and Fig. 3). Collectively, the mean change in whole-body aBMD, BA-adjusted BMC or BMC reported in the literature ranges from − 0·5 to − 1·0 %, which for a typical woman averaged over a 3-month period equates to about 50–100 mg/d(Reference Prentice, Pettifor, Juppner and Glorieux3), sufficient to make a substantial contribution to the Ca needed for breast-milk production during that time. Table 2 shows that the reported mean changes in bone mineral in different studies ranges from − 7·5 to − 2·8 % at the lumbar spine, − 4·2 to − 1·5 % at the total hip (trochanter = − 3·7 to − 0·6 %; femoral neck = − 7 to − 2·4 %), − 5·0 to +0·3 % at radial wrist and − 0·1 to +0·6 % at radial shaft(Reference Prentice, Laskey, Jarjou, Bonjour and Tsang7, Reference Laskey and Prentice8, Reference Kolthoff, Eiken and Kristensen41, Reference More, Bettembuk and Bhattoa42, Reference Pearson, Kaur and San63, Reference Ritchie, Fung and Halloran67, Reference Akesson, Vahter and Berglund71, Reference Karlsson, Obrant and Karlsson80–Reference Sowers, Corton and Shapiro89). In the one study that used QCT of the lumbar spine, a decrease of − 9 % in vBMD was observed during the first 2 months of lactation(Reference Ritchie, Fung and Halloran67). A study using pQCT reported a significant decrease of − 4 % in vBMD of the trabecular bone region of the radial wrist during the first 6 months of lactation(Reference Dobnig, Kainer and Stepan90). Studies of BF women in non-Caucasian populations (Japanese, Chinese and Chilean) reported mean changes (using DXA) from shortly after delivery to between 3 and 6 months of lactation in aBMD in the range − 7 to − 2·9 % at the lumbar spine(Reference Chan, Nelson and Leung91–Reference Yasumizu, Nakamura and Hoshi93) and − 3 % in aBMD at the femoral neck(Reference Lopez, Gonzalez and Reyes94). These values are similar to those changes reported in Caucasian populations listed in Table 2. However, the Chilean study reported no change in aBMD at the lumbar spine during the first 6 months in BF women(Reference Lopez, Gonzalez and Reyes94), which contrasts with the decrease in aBMD commonly found in Caucasian women.
These skeletal changes reported during the first 3–6 months of lactation in BF women appear to be due to lactation rather than to pregnancy because they differ from those of NBF mothers, with the possible exception of the femoral neck(Reference Lopez, Gonzalez and Reyes94). On average, NBF women show either no postpartum change in BMC, aBMD or BA-adjusted BMC(Reference Laskey, Prentice and Hanratty21, Reference More, Bettembuk and Bhattoa42, Reference Pearson, Kaur and San63, Reference Karlsson, Obrant and Karlsson80, Reference Kalkwarf, Specker and Bianchi83, Reference Affinito, Tommaselli and di Carlo85, Reference Hayslip, Klein and Wray88, Reference Sowers, Corton and Shapiro89, Reference Chan, Nelson and Leung91, Reference Honda, Kurabayashi and Yahata92, Reference Lopez, Gonzalez and Reyes94) or a significant increase of up to 2 % at the spine(Reference Polatti, Capuzzo and Viazzo82, Reference Kalkwarf and Specker86), trochanter(Reference Laskey and Prentice8) and whole body(Reference Laskey and Prentice8, Reference Hopkinson, Butte and Ellis81) by 3–6 months postpartum. It is possible that such increases in NBF women may reflect a reversal of the decreases in bone mineral that occurred during pregnancy.
The magnitude of the bone mineral changes reported among BF women has been shown to depend on the pattern of breast-feeding adopted; women who breast-feed for longer tend to have more pronounced decreases in the first 3–6 months postpartum than those who breast-feed for a shorter period of time (Fig. 4)(Reference Laskey and Prentice8, Reference Hopkinson, Butte and Ellis81, Reference Sowers, Corton and Shapiro89, Reference Yasumizu, Nakamura and Hoshi93). This may reflect differences in breast-feeding practice, such as the intensity and frequency of suckling episodes, the volume of breast milk produced and the timing of the introduction of complementary and supplementary feeds(Reference Prentice, Laskey, Jarjou, Bonjour and Tsang7, Reference Laskey, Prentice and Hanratty21). There is considerable variation between individuals in the skeletal response in the early months postpartum, even among women who breast-feed for similar lengths of time. For example, in a study of women in Cambridge, UK, who breast-fed exclusively for 3 months, the changes in BA-adjusted BMC observed in the lumbar spine varied from − 8·5 to +1·2 %(Reference Prentice, Laskey, Jarjou, Bonjour and Tsang7). The changes in bone mineral experienced by an individual woman during lactation also vary considerably from one skeletal site to another with little correlation between them(Reference Laskey and Prentice8). The reasons for this variation are not fully understood. In the study of Cambridge women above, the volume of breast milk consumed by the infant and maternal height were identified as explanatory variables for change in BA-adjusted BMC at the spine(Reference Laskey, Prentice and Hanratty21). Most studies have shown that weight and weight change are not significant predictors of change in BMC, aBMD or BA-adjusted BMC during lactation(Reference Laskey and Prentice8, Reference Laskey, Prentice and Hanratty21) or have only a modest effect and only partially account for the skeletal changes observed(Reference Kolthoff, Eiken and Kristensen41, Reference Karlsson, Obrant and Karlsson80–Reference Polatti, Capuzzo and Viazzo82, Reference Kalkwarf, Specker and Ho95, Reference Kalkwarf96). Genetic and hormonal variation may also have an influence on changes in bone mineral postpartum; relationships have been noted with polymorphisms in the oestrogen receptor and parathyroid hormone (PTH) receptor-1 genes(Reference Jones97) but not of the vitamin D receptor gene(Reference Laskey, Prentice and Hanratty21, Reference Jones97, Reference Holmberg-Marttila, Sievanen and Jarvinen98). The possible influences of maternal Ca intake and vitamin D status on the skeletal response to lactation are discussed later.
Lactation for >6 months
The decrease in bone mineral among BF women appears, in general, to be reversed in later lactation and after lactation has stopped (Figs. 3 and 4). This may be related to the reduced requirement for additional Ca, to a diminution of the stimuli associated with breast-feeding, or to hormonal changes related to the return of ovulation and menstruation. To date, it has not been possible to distinguish between these possibilities because inter-related factors such as breast-milk output, number of breast-feeds per d, length of lactation, plasma oestradiol concentration and duration of amenorrhoea tend to be predictive of the magnitude of change in bone mineral when considered separately but not in the presence of each other(Reference Prentice, Laskey, Jarjou, Bonjour and Tsang7, Reference Laskey and Prentice8, Reference Kalkwarf and Specker86, Reference Sowers, Scholl and Harris99). Bone mineral at the femoral neck, however, tends to remain significantly lower than after delivery, but the magnitude of the difference is less than at 3–6 months of lactation and similar to decreases observed in NBF and NPNL women over the same period of time(Reference Laskey and Prentice8). It seems likely, therefore, that this reduction in women who have recently breast-fed is related to ageing and not to lactation(Reference Olausson, Laskey and Goldberg11, Reference Laskey, Prentice and Hanratty21).
Table 3 presents values for the mean change in aBMD or BA-adjusted BMC from shortly after delivery to 12 months postpartum. These studies involved Caucasian women who had breast-fed for variable amounts of time, from about 3 months to >18 months(Reference Laskey and Prentice8, Reference Kolthoff, Eiken and Kristensen41, Reference More, Bettembuk and Bhattoa42, Reference Pearson, Kaur and San63, Reference Karlsson, Obrant and Karlsson80, Reference Affinito, Tommaselli and di Carlo85, Reference Sowers, Corton and Shapiro89). At 12 months postpartum, in BF women who had lactated for 3–12 months, aBMD was lower at the spine(Reference More, Bettembuk and Bhattoa42), wrist(Reference More, Bettembuk and Bhattoa42) and trochanter(Reference Pearson, Kaur and San63) compared with before pregnancy. No net change was observed at any site in NBF women in these studies(Reference More, Bettembuk and Bhattoa42, Reference Pearson, Kaur and San63). As can be appreciated from Table 3, there is considerable variation that may be explained partly by differences in the mean duration of lactation, and by the fact that, in some studies, a proportion of the women were still breast-feeding and/or may not have resumed menstruation.
Longitudinal studies >6 months postpartum in non-Caucasian lactating women are rare. One study reported that aBMD at the lumbar spine in exclusively BF Chinese women (for at least 3 months) was − 1 % lower at 12 months postpartum compared with baseline (within 1 week postpartum)(Reference Chan, Nelson and Leung91). However, aBMD at the trochanter and femoral neck had returned to values similar to those at baseline. There are few studies of BF women in populations where breast-feeding beyond 12 months is common. Data from a traditional African society in The Gambia, where women typically breast-feed for 18–24 months and experience lactational amenorrhoea for many months, show only partial reversal of skeletal changes by 12 months postpartum(Reference Jarjou100, Reference Jarjou, Laskey, Sawo, Goldberg, Prentice, Prentice, Filteau and Simondon101). Whether such women experience further increases later in lactation, once menstruation resumes, or after breast-feeding stops is a subject of ongoing research.
Post-lactation and resumption of menses
Table 4 presents data on mean change in aBMD or BA-adjusted BMC from early lactation to after breast-feeding had stopped(Reference Laskey and Prentice8, Reference Akesson, Vahter and Berglund71, Reference Polatti, Capuzzo and Viazzo82), and Table 5 presents changes in aBMD from early lactation to after the resumption of menses(Reference Kolthoff, Eiken and Kristensen41, Reference Ritchie, Fung and Halloran67, Reference Holmberg-Marttila, Sievanen and Laippala102). In general, these studies showed either no significant net difference or an increase in bone mineral in BF women relative to 2 weeks postpartum at most skeletal sites other than the femoral neck. Several months after the cessation of lactation or the resumption of menses, no distinction in bone mineral could be drawn between BF and NBF women(Reference Laskey and Prentice8, Reference Holmberg-Marttila, Sievanen and Laippala102). Thus, long-term changes in bone mineral observed in BF women post-lactation may be due to having been pregnant and not to lactation per se. However, as discussed earlier, definitive studies of the net changes in bone mineral due to pregnancy and lactation require prospective investigations throughout a whole reproductive cycle within an individual mother from pre-pregnancy to post-lactation or post-amenorrhoea. To date, there have been few such studies(Reference More, Bettembuk and Bhattoa42, Reference Pearson, Kaur and San63, Reference Holmberg-Marttila and Sievanen66, Reference Ritchie, Fung and Halloran67). In one study using QCT, no net change in trabecular bone of the spine was observed 5 months after the resumption of menses (approximately 13 months after delivery) compared with before pregnancy, although some women were still lactating at the time(Reference Ritchie, Fung and Halloran67). Another study of five women from before pregnancy until 1 year after resumption of menses (13–23 months after delivery) showed no net change in aBMD at the spine, femoral neck and distal radius for those who had lactated for less than 12 months. Two women who lactated longer than 12 months had lower aBMD at the femoral neck, spine and distal radius compared with before pregnancy(Reference Holmberg-Marttila and Sievanen66).
Maternal bone mineral mobilisation: bone turnover studies
Supporting evidence for bone mineral mobilisation during human pregnancy and lactation with later replenishment of bone mineral (Fig. 1) comes from biochemical and stable-isotope studies of bone turnover.
Pregnancy
Ca kinetic measurements using the stable isotope 48Ca have demonstrated increases in Ca bone turnover during pregnancy and pronounced upward shifts in both accretion and resorption rates(Reference Heaney and Skillman103). In a study of fifteen young pregnant women from mid-pregnancy and nine non-pregnant age-matched controls, Ca accretion, resorption and turnover increased steadily from mid-pregnancy to a peak in the last 10 weeks of pregnancy to levels that were approximately twice non-pregnant levels(Reference Heaney and Skillman103). Longitudinal biochemical studies have demonstrated significant increases in plasma or urinary markers of bone turnover during pregnancy compared with before conception. Elevations in bone resorption markers (NTx, CTx, deoxypyridinoline) have been detected as early as the first trimester of pregnancy, well before fetal Ca accretion reaches its peak in the third trimester(Reference Ulrich, Miller and Eyre12, Reference Naylor, Iqbal and Fledelius13, Reference Black, Topping and Durham39). In contrast, no significant increases in markers of bone formation (P1CP, P1NP and bone-specific ALP) have been reported before the third trimester(Reference Ulrich, Miller and Eyre12, Reference Naylor, Iqbal and Fledelius13, Reference Black, Topping and Durham39, Reference Kaur, Godber and Lawson50). Markers of bone resorption and bone formation reach their highest concentration during the last trimester of pregnancy(Reference Ulrich, Miller and Eyre12, Reference Naylor, Iqbal and Fledelius13, Reference Black, Topping and Durham39, Reference Wisser, Florio and Neff43, Reference Kaur, Godber and Lawson50, Reference Fiore, Pennisi and DiStefano62, Reference Akesson, Vahter and Berglund71, Reference Pluskiewicz75, Reference Paoletti, Orru and Floris104–Reference More, Bhattoa and Bettembuk109). Osteocalcin is an exception, because its concentration decreases significantly during pregnancy(Reference Ulrich, Miller and Eyre12, Reference Naylor, Iqbal and Fledelius13, Reference Ritchie, Fung and Halloran67, Reference Polatti, Capuzzo and Viazzo82, Reference Paoletti, Orru and Floris104, Reference Yoon, Lee and Choi106) or remains unchanged(Reference More, Bhattoa and Bettembuk109, Reference Gallacher, Fraser and Owens110). It has been suggested that this may be due to increased placental clearance(Reference Rodin, Duncan and Quartero111) or to production of osteocalcin fragments(Reference Naylor, Iqbal and Fledelius13). The usefulness of osteocalcin as an indicator of bone turnover during pregnancy, therefore, has been questioned(Reference Naylor, Iqbal and Fledelius13). However, lower concentrations have been reported in women classified as ‘slow losers’ on the basis of change in forearm trabecular vBMD during pregnancy, and the authors speculated that reduced osteocalcin concentrations may facilitate bone formation(Reference Wisser, Florio and Neff43).
Lactation and postpartum
Longitudinal studies in both BF and NBF women have demonstrated elevations in markers of both bone formation and resorption in the first weeks postpartum compared with measurements made in the same individual before pregnancy(Reference Black, Topping and Durham39, Reference Ritchie, Fung and Halloran67, Reference Paoletti, Orru and Floris104, Reference More, Bhattoa and Bettembuk109), in late pregnancy(Reference Vargas Zapata, Donangelo and Woodhouse112), 1 year after delivery(Reference Prentice, Jarjou and Stirling113), post-weaning(Reference Akesson, Vahter and Berglund71, Reference Cross, Hillman and Allen87) or 1 year after resumption of menses(Reference Holmberg-Marttila, Leino and Sievanen114). In cross-sectional studies higher concentrations of bone turnover markers than in NPNL women have been reported during the first weeks postpartum(Reference Yasumizu, Nakamura and Hoshi93, Reference Paoletti, Orru and Floris104, Reference Kent, Price and Gutteridge115, Reference Casanueva, Flores-Quijano and Frike116). The patterns of change in the various bone turnover markers postpartum are influenced by lactation; at the same time points BF women have higher concentrations of all markers than NBF mothers(Reference Yamaga, Taga and Minaguchi72, Reference Chan, Nelson and Leung91, Reference Kalkwarf, Specker and Ho95, Reference Casanueva, Flores-Quijano and Frike116, Reference Sowers, Eyre and Hollis117). The extent to which these changes are driven directly by blood ionised Ca, calciotropic hormones, lactation stimuli or reproductive hormones is not known. One study showed that both the duration of exclusive BF and length of postpartum amenorrhoea were positively associated with high concentrations of both bone formation and resorption markers measured after resumption of menses(Reference Holmberg-Marttila, Leino and Sievanen114).
In general, markers of bone resorption decrease after a few weeks postpartum in both BF and NBF mothers whereas bone formation markers remain elevated or increase further before declining(Reference More, Bhattoa and Bettembuk109, Reference Holmberg-Marttila, Leino and Sievanen114). These temporal differences may account for the observed sequence of changes in bone mineral postpartum, with bone mineral mobilisation occurring when resorption exceeds formation and replenishment when formation exceeds resorption. A recent study has found increases in both bone resorption and formation markers, together with bone loss in lactating women(Reference Carneiro, Prebehalla and Tedesco118). The authors concluded that bone loss in lactation was different from pathological bone loss (where there is a decoupling of formation and resorption) and speculated that complete osteoblast differentiation and osteoid mineralisation do not occur during lactation, but after lactation stops.
Longitudinal studies in Caucasian BF women breast-feeding for >6 months show that at 12 months postpartum concentrations of markers of bone formation were still higher than before pregnancy(Reference Paoletti, Orru and Floris104, Reference More, Bhattoa and Bettembuk109), whereas bone resorption markers are similar to concentrations before pregnancy(Reference Paoletti, Orru and Floris104, Reference More, Bhattoa and Bettembuk109). Thus, bone resorption markers reach concentrations similar to before pregnancy earlier than do bone formation markers. No differences in bone turnover markers between BF and NBF women have been found at 12 months postpartum(Reference Affinito, Tommaselli and di Carlo85, Reference Chan, Nelson and Leung91), 18 months postpartum(Reference Sowers, Eyre and Hollis117), or 6 months after resumption of menses(Reference Krebs, Reidinger and Robertson84). In Gambian women, who breast-feed for >1 year, osteocalcin was still higher at 78 weeks postpartum than shortly after delivery, whereas deoxypyridinoline had declined rapidly during the first 3 months and then remained low(Reference Prentice, Jarjou and Stirling113).
Bone mineral mobilisation: osteoporosis and fractures
Further evidence for bone mineral mobilisation comes from rare cases of osteoporotic fragility fractures, often vertebral, that occur during late pregnancy and in lactation. The aetiology is unknown, although in one study nine of eleven subjects had at least one of the traditional risk factors for osteoporosis, including low body weight, family history of fragility fractures or osteoporosis, low vitamin D status or smoking. Data from this study suggested that women with a low aBMD before pregnancy were at increased risk of fracture in late pregnancy or postpartum(Reference O'Sullivan, Grey and Singh119). However, it has also been reported that fragility fractures in pregnancy and lactation can occur in the absence of low aBMD(Reference Rousiere, Kahan and Job-Deslandre120). There is little evidence that osteoporosis of pregnancy and lactation is related to diet(Reference Gruber, Gutteridge and Baylink121, Reference Smith and Phillips122).
No prospective studies have investigated if there is an increased risk of osteoporosis in later life that can be attributed to pregnancy or lactation. Findings from retrospective studies investigating relationships between parity, lactation history and bone mineral measurements in pre- and postmenopausal women are inconsistent. Studies report positive associations between parity or lactation history and greater bone mineral(Reference Specker and Binkley77, Reference Aloia, Vaswani and Yeh123–Reference Schnatz, Barker and Marakovits127), an inverse association(Reference Lissner, Bengtsson and Hansson128, Reference Wardlaw and Pike129) or no significant association(Reference Specker and Binkley77, Reference Henderson, Sowers and Kutzko130, Reference Paton, Alexander and Nowson131). Secondary analysis of survey data from the third National Health and Nutrition Examination Survey (NHANES III) of 819 women aged 20–25 years indicated that those who had been pregnant as adolescents had the same BMD as women pregnant as adults and as nulliparous women. Those who had breast-fed as adolescents had higher BMD than those who had not breast-fed(Reference Chantry, Auinger and Byrd132).
Regarding relationships between parity or lactation history and hip fracture incidence in later life, however, most studies suggest either no association or a protective effect. Studies have reported no association with parity(Reference Alderman, Weiss and Daling133), reduced hip fracture incidence with increasing parity(Reference Hoffman, Grisso and Kelsey134–Reference Michaelsson, Baron and Farahmand136), and an association between longer duration of lactation and lower risk of hip fracture(Reference Alderman, Weiss and Daling133, Reference Kreiger, Kelsey and Holford137–Reference Cumming and Klineberg139). There are very few data in non-Caucasian populations in developing countries, but retrospective studies have found no associations between aBMD and parity or lactation history in Bangladeshi or Sri Lankan women(Reference Chowdhury, Sarkar and Roy140, Reference Lenora, Lekamwasam and Karlsson141), and no differences in bone dimensions between South African Bantu women who had had two or fewer children compared with seven or more(Reference Walker, Richardson and Walker142). One study found a greater aBMD and reduced prevalence of osteoporotic fracture in multiparous compared with nulliparous postmenopausal Colombian women(Reference Cure-Cure, Cure-Ramirez and Teran143).
Intestinal absorption and renal excretion of calcium
Studies of Ca absorption efficiency and renal Ca excretion have demonstrated that physiological contributions to maternal Ca economy are made by increased absorption in pregnancy, decreased excretion in lactation and both increased absorption and decreased excretion post-lactation (Fig. 1).
Pregnancy
Ca absorption efficiency increases approximately 2-fold during pregnancy in association with increased expression of enterocytic Ca-binding protein(Reference Prentice, Pettifor, Juppner and Glorieux3, Reference Ritchie, Fung and Halloran67, Reference Cross, Hillman and Allen144). As with bone resorption, this increase occurs before the third trimester, ahead of peak fetal bone accretion, and is, therefore, likely to be in anticipation of, rather than being driven by, the increased requirement for Ca(Reference Gertner, Coustan and Kliger145). The increase in 24 h urinary Ca excretion during pregnancy(Reference Prentice, Pettifor, Juppner and Glorieux3, Reference Naylor, Iqbal and Fledelius13, Reference Ritchie, Fung and Halloran67, Reference Cross, Hillman and Allen144) is considered to be due to the combined effects of the increase in intestinal Ca absorption and the higher glomerular filtration rate associated with pregnancy and not to a change in fractional renal Ca reabsorption(Reference Prentice, Pettifor, Juppner and Glorieux3, Reference Pitkin146, Reference Kent, Price and Gutteridge147). Fasting Ca excretion, corrected for creatinine clearance, is normal or decreased(Reference Prentice, Pettifor, Juppner and Glorieux3, Reference Heaney and Skillman103).
Lactation and postpartum
By 2–3 months postpartum in both BF and NBF mothers, intestinal Ca absorption returns to values close to those observed pre-pregnancy or in early gestation(Reference Ritchie, Fung and Halloran67, Reference Vargas Zapata, Donangelo and Woodhouse112, Reference Cross, Hillman and Allen144, Reference Kalkwarf, Specker and Heubi148), although there is evidence that fractional absorption is significantly higher in BF women who have resumed menstruation compared with those who have not at the same stage postpartum(Reference Kalkwarf, Specker and Heubi148). Urinary Ca excretion also returns from the high levels of pregnancy to values close to those observed pre-pregnancy or in NPNL women(Reference Naylor, Iqbal and Fledelius13, Reference Prentice149). The decrease in urinary Ca output partly reflects the reduction in glomerular filtration rate after parturition(Reference Kovacs150). Some studies, but not all(Reference Lippuner, Zehnder and Casez151), have shown that urinary Ca output of BF mothers during the first 3–6 months of lactation is lower than that of NBF mothers at the same stage postpartum or of NPNL women(Reference Chan, Nelson and Leung91, Reference Kent, Price and Gutteridge115, Reference Prentice, Jarjou and Cole152).
Compared with NPNL women, in BF women who lactate for 6–12 months or more, lactation has been associated with decreases in urinary Ca excretion(Reference Ritchie, Fung and Halloran67, Reference Prentice, Jarjou and Stirling113) or no difference(Reference Klein, Moser-Veillon and Douglass153). Post-lactation has been associated with decreases in urinary Ca excretion(Reference Kent, Price and Gutteridge115, Reference Cross, Hillman and Allen144) or no difference(Reference Kalkwarf, Specker and Ho95) and with increases in intestinal Ca absorption efficiency(Reference Kalkwarf, Specker and Heubi148). Differences in the timing of the return of menses may complicate these findings(Reference Prentice, Pettifor, Juppner and Glorieux3); these effects are not apparent several months after breast-feeding has ceased(Reference Specker, Vieira and O'Brien154).
Fetal calcium accretion and breast-milk calcium secretion
There is wide variation in fetal Ca accretion and in breast-milk Ca secretion, the other components of maternal Ca economy. Relatively little is known about the Ca content of the fetal skeleton other than that derived directly from studies of stillborn fetuses(Reference Ziegler, O'Donnell and Nelson155–Reference Apte and Iyengar157) and indirectly from maternal Ca balance studies(Reference Heaney and Skillman103) and measures of skeletal size in studies of fetal growth and development among neonates of different gestational age, with assumptions made about bone composition(Reference Fomon and Nelson156). Studies of neonatal and infant bone mineral using single-photon absorptiometry (SPA) and, more recently, DXA have added to the literature(Reference Jarjou, Prentice and Sawo24, Reference Koo, Bush and Walters158–Reference Harvey, Javaid and Poole162) but many assumptions have to be made (see Introduction) and there are ongoing difficulties with the technology and associated software that can lead to problems with interpretation(Reference Sawyer, Bachrach and Fung163). Evaluation of methodologies against a neonatal pig model have improved confidence in the DXA technique for assessing total Ca and mineral content of small babies(Reference Koo, Hammami and Hockman164, Reference Koo, Massom and Walters165) but these have not been conducted for all instruments. Nevertheless, variations in fetal bone accretion at different stages of gestation, between individuals and between different pregnancies in the same mother, need to be considered in studies of maternal Ca economy in pregnancy.
After the colostral phase, breast-milk Ca concentration is relatively constant during the first 3 months of lactation, averaging about 200–300 mg/l (5·0–7·5 mmol/l) depending on the population(Reference Prentice, Laskey, Jarjou, Bonjour and Tsang7), but declines progressively thereafter(Reference Prentice, Laskey, Jarjou, Bonjour and Tsang7, Reference Vaughan, Weber and Kemberling166, Reference Laskey, Prentice and Shaw167). The concentration of Ca in breast milk is independent of the volume of milk produced(Reference Prentice, Laskey, Jarjou, Bonjour and Tsang7, Reference Jarjou, Goldberg and Coward168), and variation in both results in wide differences in breast-milk Ca secretion between individual mothers and between populations at the same time postpartum(Reference Prentice, Laskey, Jarjou, Bonjour and Tsang7, Reference Jarjou, Goldberg and Coward168). The reasons for these differences are not known, although genetic effects may play a role; for example, polymorphisms in the PTH/PTH-related protein (PTHrP) receptor 1 gene have been associated with differences in breast-milk Ca concentration(Reference Jones, Laskey, Rushworth, Goldberg, Prentice, Prentice, Filteau and Simondon169). PTHrP may be one determinant of breast-milk Ca concentration, because associations have been shown with the concentration of PTHrP in breast milk(Reference Uemura, Yasui and Yoneda170, Reference Seki, Kato and Sekiya171) and in plasma(Reference DeSantiago, Alonso and Halhali172). However, Ca is associated with the casein, phosphate and citrate fractions of human milk and it is probable that the major determinants of breast-milk Ca concentration are those that regulate the concentration of these components(Reference Kent, Arthur and Mitoulas173). Studies investigating the possible influence of maternal Ca intake and vitamin D status are described later.
Regulation of calcium metabolism in pregnancy and lactation
Pregnancy
Longitudinal studies have demonstrated that the total plasma concentration of Ca (the sum of ionised and protein-bound fractions) decreases during pregnancy compared with before pregnancy or in early gestation(Reference Ulrich, Miller and Eyre12, Reference Black, Topping and Durham39, Reference Wisser, Florio and Neff43, Reference Ritchie, Fung and Halloran67). This may reflect the increase in plasma volume, as indicated by the fall in plasma albumin(Reference Black, Topping and Durham39, Reference Kovacs150). However, the concentration of ionised Ca, the tightly regulated fraction in the circulation, is unchanged between early and late pregnancy(Reference Wisser, Florio and Neff43) and remains within the range found in NPNL women(Reference Kovacs150).
Of the calciotropic hormones, PTH is reported to be either unchanged during pregnancy(Reference Ritchie, Fung and Halloran67, Reference More, Bhattoa and Bettembuk109, Reference Cross, Hillman and Allen144) or significantly decreased(Reference Naylor, Iqbal and Fledelius13, Reference Black, Topping and Durham39). There is evidence to suggest that, following a nadir in early gestation, plasma PTH concentration increases during pregnancy relative to the first trimester(Reference Prentice, Pettifor, Juppner and Glorieux3, Reference Wisser, Florio and Neff43, Reference O'Brien, Donangelo and Zapata60).
In contrast, an increase in plasma 1,25-dihydroxyvitamin D (1,25(OH)2D) concentration is apparent in the first trimester in studies using NPNL women as reference(Reference Ritchie, Fung and Halloran67, Reference Cross, Hillman and Allen144, Reference Gertner, Coustan and Kliger145, Reference Kumar, Cohen and Silva174). Plasma concentrations of 1,25(OH)2D continue to rise during pregnancy, and in late pregnancy are several-fold higher than before pregnancy(Reference Ritchie, Fung and Halloran67, Reference Cross, Hillman and Allen144) and early gestation(Reference O'Brien, Donangelo and Zapata60, Reference Ritchie, Fung and Halloran67, Reference Uemura, Yasui and Kiyokawa107, Reference Vargas Zapata, Donangelo and Woodhouse112, Reference Cross, Hillman and Allen144, Reference Gertner, Coustan and Kliger145, Reference Kumar, Cohen and Silva174–Reference Reiter, Braunstein and Vargas178). However, the concentration of D-binding protein (DBP) also increases, and as such the proportion of free to bound 1,25(OH)2D is only elevated in the last trimester(Reference Kovacs5). Thus the assumption that the increase in 1,25(OH)2D may account for the enhanced intestinal Ca absorption efficiency at that time(Reference Ritchie, Fung and Halloran67, Reference Vargas Zapata, Donangelo and Woodhouse112, Reference Cross, Hillman and Allen144) is unlikely to be the explanation. Renal synthesis of 1,25(OH)2D is enhanced during pregnancy due to increased stimulation of renal 1-α-hydroxylase activity, the enzyme that converts 25OHD to 1,25(OH)2D(Reference Evans, Bulmer and Kilby179). 1,25(OH)2D is also present in the placenta and is produced by the fetus and both may contribute to the increased concentrations in the maternal circulation(Reference Evans, Bulmer and Kilby179). However, the contribution from these extrarenal sources is unlikely to be great; negligible plasma 1,25(OH)2D concentrations have been reported in an anephric woman during pregnancy(Reference Turner, Barré and Benjamin180).
The mechanism behind the increase in 1,25(OH)2D production is not clear. In general, PTH is the key hormone that stimulates renal 1,25(OH)2D synthesis. However, because PTH concentration is lowered or unchanged in pregnant women, it is unlikely to be primarily responsible for the increase in 1,25(OH)2D seen in pregnancy(Reference Prentice, Pettifor, Juppner and Glorieux3), although it remains responsive to changes in Ca load(Reference Kent, Price and Gutteridge147). Although hormones, such as oestrogen, prolactin, growth hormone and insulin-like growth factor-I, have the ability to induce 1-α-hydroxylase activity(Reference Kumar, Cohen and Silva174, Reference Halhali, Villa and Madrazo175, Reference Gomez181), it is likely that PTHrP has a key role(Reference Prentice, Pettifor, Juppner and Glorieux3, Reference Evans, Bulmer and Kilby179, Reference Hosking182). This activates the PTH/PTHrP receptor and therefore exhibits PTH-like effects, including stimulation of renal 1,25(OH)2D production(Reference Hosking182, Reference Wysolmerski and Stewart183). Increased concentrations of PTHrP are detected in the plasma of pregnant women, probably originating from fetal, placental and mammary tissues(Reference Kovacs and Kronenberg4), and its concentration rises by about two-fold from early to late pregnancy(Reference Gallacher, Fraser and Owens110, Reference Ardawi, Nasrat and BA'Aqueel176). PTHrP may also have other roles in pregnancy, such as regulating placental Ca transport and modulating bone turnover(Reference Kovacs150, Reference Horwitz, Tedesco and Sereika184).
The physiological function of calcitonin during pregnancy is not fully understood. It may have a role in promoting renal Ca excretion(Reference Kovacs185) and in protecting the maternal skeleton from excessive resorption(Reference Stevenson, Hillyard and MacIntyre186). The response of calcitonin to pregnancy, however, appears to be highly variable(Reference Prentice, Pettifor, Juppner and Glorieux3, Reference Pitkin, Reynolds and Williams187). Some studies observed increases of more than two-fold between the first and last trimesters(Reference Ardawi, Nasrat and BA'Aqueel176) while others report no change(Reference Wisser, Florio and Neff43, Reference Ritchie, Fung and Halloran67).
Other possible regulators in pregnancy of changes in Ca metabolism through their actions on the skeleton include insulin-like growth factor-I, human placental lactogen, osteoprotegerin (OPG) and the ratio of OPG to other circulating components of the OPG/RANKL/RANK (OPG/receptor activator of NF-κB/receptor activator of NF-κB ligand) system, all of which increase during pregnancy(Reference Naylor, Iqbal and Fledelius13, Reference Paoletti, Orru and Floris104, Reference Naylor, Rogers and Fraser105, Reference Uemura, Yasui and Kiyokawa107, Reference Khosla188, Reference Yano, Shibata and Mizuno189). The maternal concentrations of insulin-like growth factor-I(Reference Naylor, Iqbal and Fledelius13, Reference O'Brien, Donangelo and Zapata60, Reference Vargas Zapata, Donangelo and Woodhouse112), oestrogen and human placental lactogen(Reference Paoletti, Orru and Floris104) are positively correlated with markers of bone formation and bone resorption, and insulin-like growth factor-I with net Ca balance(Reference O'Brien, Donangelo and Zapata60). However, no relationships have been observed during pregnancy between changes in, or absolute values of, plasma OPG, or its ratio to RANKL, and any markers of bone turnover(Reference Naylor, Rogers and Fraser105, Reference Uemura, Yasui and Kiyokawa107) or BMD(Reference Naylor, Rogers and Fraser105). Overall the importance of the many different hormones, growth factors and cytokines in pregnancy and their interactions with Ca metabolism are still to be established.
Lactation and postpartum
After delivery, total plasma Ca concentration returns towards a value similar to that before pregnancy(Reference Black, Topping and Durham39, Reference Ritchie, Fung and Halloran67, Reference Kent, Price and Gutteridge115, Reference Kovacs150), possibly in parallel with the return of plasma volume to pre-pregnancy levels. BF women tend to have higher total and ionised plasma Ca concentrations than before pregnancy, during pregnancy or in NPNL women(Reference Prentice, Pettifor, Juppner and Glorieux3) but similar to those observed in NBF mothers at the same stage postpartum(Reference Prentice, Pettifor, Juppner and Glorieux3, Reference Kalkwarf, Specker and Ho95).
The plasma concentration of PTH during the first few months postpartum is similar to(Reference Ritchie, Fung and Halloran67, Reference Krebs, Reidinger and Robertson84) or slightly decreased(Reference Chan, Nelson and Leung91, Reference Prentice, Jarjou and Stirling113, Reference Specker, Tsang and Ho190, Reference Sowers, Zhang and Hollis191) compared with before pregnancy or shortly after delivery. The plasma concentration of 1,25(OH)2D is also either unchanged(Reference Ritchie, Fung and Halloran67, Reference Uemura, Yasui and Kiyokawa107) or slightly decreased(Reference Prentice, Jarjou and Stirling113, Reference Sowers, Zhang and Hollis191) compared with pre-pregnancy or those of NPNL women. Increases in 1,25(OH)2D concentration during the first months postpartum in both BF and NBF mothers have been reported(Reference Krebs, Reidinger and Robertson84). In general, BF women tend to have lower plasma PTH concentrations but higher 1,25(OH)2D concentrations than NBF women at the same time postpartum(Reference Krebs, Reidinger and Robertson84, Reference Kalkwarf, Specker and Ho95, Reference Kalkwarf, Specker and Heubi148, Reference Sowers, Zhang and Hollis191, Reference Hillman, Sateesha and Haussler192). However, BF mothers nursing twins have elevated plasma concentrations of both PTH and 1,25(OH)2D compared with those nursing single infants(Reference Greer, Lane and Ho193). Elevated PTH and 1,25(OH)2D have been reported in BF women relative to early lactation and to NPNL women during the later stages of lactation and after breast-feeding stops(Reference Kalkwarf, Specker and Bianchi83, Reference Kalkwarf, Specker and Ho95, Reference More, Bhattoa and Bettembuk109, Reference Prentice, Jarjou and Stirling113, Reference Kent, Price and Gutteridge115, Reference Cross, Hillman and Allen144, Reference Specker, Tsang and Ho190, Reference Sowers, Zhang and Hollis191), although the pattern is not consistent. The increases in PTH and 1,25(OH)2D may play a role in the replenishment of bone mineral post-lactation through their effects on intestinal absorption and renal retention of Ca.
The plasma concentration of calcitonin decreases during the first months postpartum in both BF and NBF women compared with shortly after delivery(Reference Krebs, Reidinger and Robertson84). The concentration in BF women has been reported to be higher than in NPNL women in some studies(Reference Prentice, Jarjou and Stirling113, Reference Dahlman, Sjoberg and Bucht194) but not others(Reference Ritchie, Fung and Halloran67, Reference Krebs, Reidinger and Robertson84, Reference Greer, Tsang and Searcy195) and to be raised in mothers nursing twins(Reference Greer, Tsang and Searcy195). No changes have been observed in later lactation(Reference Ritchie, Fung and Halloran67, Reference Krebs, Reidinger and Robertson84).
In general, the early postpartum changes in PTH, 1,25(OH)2D and calcitonin do not correlate with breast-milk Ca content or with changes in maternal bone mineral and bone turnover markers(Reference Ritchie, Fung and Halloran67, Reference Krebs, Reidinger and Robertson84, Reference Sowers, Zhang and Hollis191). This suggests that the Ca homeorrhesis of lactation is not driven by the three classical calciotropic hormones, and that Ca loss into breast milk drives the hormonal response and other factors that direct the Ca flux out of and into bone in response to lactation. However, Ca supplementation is associated with the expected lowering effects on PTH and 1,25(OH)2D(Reference Kalkwarf, Specker and Ho95) indicating that Ca homeostatic mechanisms are intact and capable of regulating plasma Ca concentrations(Reference Prentice, Pettifor, Juppner and Glorieux3, Reference Kalkwarf, Specker and Ho95).
An indicator of PTH activity is nephrogenous cyclic AMP production. No differences have been found between women who have recently ceased breast-feeding and either non-lactating control women or those who have not recently been pregnant(Reference Kalkwarf, Specker and Ho95, Reference Kent, Price and Gutteridge115, Reference Kent, Price and Gutteridge147). It is considered probable that a key regulator of Ca and bone metabolism during the first weeks of lactation is PTHrP. This is produced by the lactating mammary gland, possibly under the influence of prolactin, and is released into the maternal bloodstream and into breast milk(Reference Lippuner, Zehnder and Casez151, Reference Sowers, Hollis and Shapiro196). The plasma concentration is high after delivery and declines over time, possibly in association with the decrease in prolactin concentration and the return of menstruation(Reference Dobnig, Kainer and Stepan90, Reference Sowers, Hollis and Shapiro196). PTHrP is elevated in BF women compared with NBF women(Reference Sowers, Hollis and Shapiro196, Reference Grill, Hillary and Ho197) and in those who have weaned their infants(Reference Lippuner, Zehnder and Casez151) in the first weeks after delivery. However, it is virtually undetectable at 6 months postpartum even in women who continue to breast-feed(Reference Sowers, Zhang and Hollis191). Higher concentrations of PTHrP have been shown to correlate with greater reductions in maternal aBMD at the lumbar spine and femoral neck postpartum(Reference Sowers, Hollis and Shapiro196) but not in established lactation(Reference Dobnig, Kainer and Stepan90). The key role for PTHrP in the first months of lactation is further supported by a clinical case report of a woman with PTH deficiency whose requirement for Ca and 1,25(OH)2D therapy decreased during breast-feeding, a circumstance that was attributed to elevated PTHrP concentrations(Reference Mather, Chik and Corenblum198). However, the biology of PTHrP is complex and the evidence for its role in human lactation is inconsistent and needs further investigation.
Other hormonal changes of lactation may be involved in regulating Ca and bone metabolism in BF women. For example, lactation is associated with increased prolactin concentrations, which suppress the hypothalamic–pituitary–ovarian axis resulting in low oestrogen concentrations and amenorrhoea(Reference Howie, McNeilly and Houston199). Both prolactin and oestrogen have recognised direct effects on Ca and bone metabolism and may be involved in Ca homeorrhesis. It is notable that, in respect to low oestrogen concentrations, lactation has parallels with the postmenopausal period, also a time when mineral is mobilised from the skeleton. The changes in bone mineral during the first few months of lactation, therefore, may be related, at least in part, to low oestrogen concentrations(Reference Kolthoff, Eiken and Kristensen41, Reference Kalkwarf, Specker and Bianchi83, Reference Affinito, Tommaselli and di Carlo85, Reference Kalkwarf and Specker86). However, NPNL women of reproductive age who are oestrogen deficient as a result of gonadotrophin-releasing hormone (GnRH) agonist therapy have higher Ca excretion, suppressed PTH and 1,25(OH)2D, i.e. a pattern that does not resemble the metabolic response to lactation(Reference Kovacs and Kronenberg4, Reference Kovacs185).
Influence of maternal dietary calcium intake on maternal calcium economy and the bone health of mother and child
The extent to which Ca economy is dependent on maternal Ca intake has been the subject of much debate. In theory, the Ca required for fetal skeletal mineralisation and for incorporation into breast milk could be supplied by an increase in dietary Ca intake. However, there is no evidence that pregnant or lactating women experience a physiological drive to increase Ca intake. Higher Ca intakes among BF than NBF mothers have been reported in some studies(Reference Laskey, Prentice and Hanratty21, Reference Chan, Nelson and Leung91) and, in some cultures, special foods are prepared for women during the puerperium that may temporarily increase Ca intake together with other key nutrients(Reference Moser, Reynolds and Acharya200). However, these are not universal findings (for example, Prentice et al. (Reference Prentice, Laskey and Shaw56)) and an increase in dietary Ca intake is not a recognised characteristic of human pregnancy and lactation.
Several observational studies have investigated the possible influence of maternal dietary Ca intake on Ca economy and, more specifically, on the bone health of the mother and child. There have been relatively few controlled supplementation trials that have studied the relationships directly and thus minimised the likelihood of confounding from socio-economic and other factors. The available evidence is reviewed below. The possible influence of maternal Ca intake (both dietary intake and supplements) on other maternal and child health outcomes, such as blood pressure, body composition and lipid profile, are beyond the scope of the present review but recent summaries can be found elsewhere(Reference Bergel and Belizan201–205).
Influence on the mother in pregnancy
For women in the UK and USA with a Ca intake close to recommendations, changes in maternal bone mineral using DXA during pregnancy appear to be independent of dietary Ca intake, as shown by observational studies(Reference Sowers, Crutchfield and Jannausch6, Reference Olausson, Laskey and Goldberg11). In contrast, observational studies among populations where Ca intakes are low suggest that the skeletal response may be dependent on maternal Ca intake. A detailed longitudinal study of bone Ca turnover during pregnancy and lactation in Brazilian women (mean Ca intake 463 mg/d) found significant positive associations with dietary Ca intake in early and late pregnancy and in early lactation; a higher Ca intake was associated with improved Ca balance(Reference O'Brien, Donangelo and Zapata60). A study in Mexico reported smaller increments in bone turnover markers from the second to third trimester and lower NTx in pregnant women with a higher dietary intake (average intake about 500 mg/d). Two studies using ultrasound have reported that pregnant women consuming less than 1000 mg Ca/d in Spain(Reference Aguado, Revilla and Hernandez76) or less than 568 ml (1 pint) of milk/d in the UK(Reference Javaid, Crozier and Harvey69) had a greater decrease in calcaneal bone ultrasound measures during pregnancy than those women with higher intakes, although in the UK study neither an overall correlation with milk intake nor a relationship with Ca supplement use was observed.
There have been few Ca supplementation studies of pregnant women that have investigated directly the effect of maternal Ca intake in pregnancy on bone mineral and the results are inconsistent. A randomised, double-blind, placebo-controlled Ca supplementation study (1500 mg Ca/d as calcium carbonate) of Gambian women (mean intake about 350 mg Ca/d) from 20 weeks of pregnancy to parturition demonstrated, contrary to expectations, lower BA-adjusted BMC of the hip measured at 2 weeks postpartum in the Ca-supplemented group(Reference Jarjou, Laskey and Sawo206). This, combined with more accentuated lactational bone changes that were observed at the lumbar spine, distal radius and whole body, and the accompanying biochemical effects, suggest that the Ca supplement in pregnancy had disrupted the processes of adaptation to the habitually low Ca intake of these women. A non-blinded randomised supplementation study among thirty-six Chinese women (mean baseline dietary intake 480 mg Ca/d) allocated to remain on their habitual diet (group I) or supplemented with milk powder (containing 350 mg Ca/d; group II) or both milk powder and 600 mg Ca/d as calcium carbonate (950 mg Ca/d in total; group III) from 18 weeks pregnancy to 6 weeks postpartum reported a higher aBMD at 45d postpartum of the whole body and spine in group III v. group I, and of the spine in group II v. group I. There was no difference between the groups at the hip(Reference Liu, Qiu and Chen207). Some of the differences between the Gambian and Chinese studies may relate to the fact that the outcome measures were obtained in the Gambian study several weeks after supplementation was stopped, whereas the data in the Chinese study were collected at the end of the supplementation period. The reported increase may, therefore, have reflected a bone remodelling transient and the effect may have been temporary. Furthermore, there is no indication of whether the Chinese women were, or had been, lactating. A study of pregnant Indian women(Reference Raman, Rajalakshmi and Krishnamachari208), from an area with a habitual Ca intake of about 300 mg/d(Reference Krishnamachari and Iyengar209), found a tendency towards an increase in hand bone density and significant increase of the fourth metacarpal bone as assessed by radiodensitometry in those who were supplemented with 600 mg Ca/d (as calcium lactate) from 20 weeks pregnancy to term compared with women receiving 300 mg/d or placebo.
The expected effects of an increase in Ca intake on bone resorption have been noted in studies of pregnant women. Pregnant Mexican women experienced a 14 % reduction in the bone resorption marker NTx after supplementation for 12 d(Reference Janakiraman, Ettinger and Mercado-Garcia210). This parallels findings from the Chinese supplementation study described above in which lower hydroxyproline excretion was observed in the supplemented groups at the end of the treatment period(Reference Liu, Qiu and Chen207). These studies provide further evidence that the physiological response to a higher Ca load remains effective during pregnancy. However, rare cases of life-threatening milk alkali syndrome (hypercalcaemia, metabolic alkalosis and renal insufficiency) during or after pregnancy have been reported in women consuming large quantities of Ca-containing supplements as antacids(Reference Gordon, McMahon and Hamblin211) or combining moderate antacid consumption with a high dietary Ca intake(Reference Caplan, Miller and Silva212). Total Ca intakes of 2500 mg/d have not been shown to cause milk alkali syndrome(213), and this is reflected in the recent tolerable upper intake levels set by the Institute of Medicine in 2010 of 2500 mg/d for pregnant or lactating women aged 19–50 years(214).
Influence on the mother in lactation
Observational and supplementation studies have demonstrated that the skeletal response to lactation is independent of the BF mother's Ca intake(Reference Prentice149). Most observational studies of BF women have shown no significant relationship between dietary Ca intake and changes in bone mineral during lactation(Reference Laskey, Prentice and Hanratty21, Reference Kolthoff, Eiken and Kristensen41, Reference Sowers, Randolph and Shapiro79, Reference Sowers, Corton and Shapiro89, Reference Lopez, Gonzalez and Reyes94). Similarly, controlled supplementation studies have demonstrated little or no effect of increases in Ca intake on changes in bone mineral, intestinal Ca absorption efficiency, renal Ca handling or Ca metabolism during or after lactation(Reference Polatti, Capuzzo and Viazzo82, Reference Kalkwarf, Specker and Bianchi83, Reference Cross, Hillman and Allen87, Reference Kalkwarf, Specker and Ho95, Reference Kalkwarf, Specker and Heubi148) even among Gambian women with a very low dietary Ca intake(Reference Prentice, Jarjou and Stirling113, Reference Prentice, Jarjou and Cole152, Reference Fairweather-Tait, Prentice and Heumann215). Transient effects of Ca supplements on aBMD have been reported in BF women during and after lactation(Reference Polatti, Capuzzo and Viazzo82, Reference Kalkwarf, Specker and Bianchi83) but these are also observed in NBF and NPNL women and are likely to be due to the expected alterations in bone remodelling, similar to those seen when Ca is used as an anti-resorptive agent in older women(Reference Prentice, Pettifor, Juppner and Glorieux3).
Adolescent mothers may be an exception, although the evidence is inconclusive. In a US dietary intervention study from 2 to 16 weeks postpartum in which forearm BMC was measured by SPA, control BF adolescents on their normal diet of 900 mg Ca/d had a 10 % decrease in BMC. In contrast, experimental adolescent and adult BF groups who received dietary advice to increase daily Ca intake through dairy products and other Ca-rich foods and supplements (to ≥ 1600 and 1200 mg Ca/d, respectively) had no significant decreases (3 and 5 %, respectively)(Reference Chan, McMurry and Westover216). In a Gambian study, no significant effect of age (teenage v. adult women) was observed on changes in BA-adjusted BMC of the radius measured by SPA or biochemistry during lactation among BF women randomised to receive a Ca supplement (714 mg Ca/d) for 12 months(Reference Prentice, Jarjou and Stirling113, Reference Prentice, Jarjou and Cole152).
There is evidence that Ca intake during pregnancy may influence the mother's response to lactation. In the Gambian study described earlier among women with a low Ca intake in a population where breast-feeding is continued for 18–24 months, there was evidence that Ca supplementation (1500 mg/d) during the latter half of pregnancy resulted in more pronounced lactational bone mineral mobilisation from the lumbar spine and distal radius measured up to 12 months postpartum(Reference Jarjou, Laskey and Sawo206). The Ca-supplemented group also had biochemical changes measured at 13 weeks of lactation consistent with greater turnover of mineral between the maternal skeleton and the extracellular pool, and greater urinary Ca excretion. These effects may represent a disruption of the processes of adaptation to a low dietary Ca intake and research is ongoing to determine whether they are temporary or remain after breast-feeding stops.
Observational studies and the wide inter-individual and geographical variations in breast-milk Ca concentration have suggested that breast-milk Ca content may be influenced by maternal Ca intake during lactation or during the previous pregnancy(Reference Ortega, Martinez and Quintas217, Reference Prentice, Dibba and Jarjou218). However, Ca supplementation studies of women during lactation(Reference Kalkwarf, Specker and Bianchi83, Reference Prentice, Jarjou and Cole152), and more recently during pregnancy(Reference Jarjou, Prentice and Sawo24), have demonstrated that breast-milk Ca concentration is independent of maternal Ca intake, even amongst women with very low Ca intakes. In addition, because breast-milk Ca secretion is regulated by the casein, phosphate and citrate components, it is now recognised that maternal Ca intake is unlikely to influence breast-milk Ca secretion directly(Reference Kent, Arthur and Mitoulas173).
Influence on the mother in later life
Few studies have investigated whether a low Ca intake during pregnancy and lactation increases the risk of postmenopausal osteoporosis(Reference Prentice, Pettifor, Juppner and Glorieux3). In studies that have attempted to look for interactions between Ca intake and reproductive history, no associations have been identified(Reference Kleerekoper, Peterson and Nelson219). However, African women with low habitual dietary Ca intake, high parity and long lactation periods are not at increased risk of fragility fractures in old age compared with Western women(Reference Walker, Richardson and Walker142, Reference Aspray, Prentice and Cole220–Reference Walker222).
Influence on the child
Early studies of body Ca content of newborn infants suggest that fetal Ca accretion is influenced by maternal nutrition(Reference Apte and Iyengar157). Infants born to mothers from a poor socio-economic community in India had lower bone density, assessed by radiodensitometry within 48 h of birth, in the arms and legs than infants born to matched controls from a more affluent group(Reference Krishnamachari and Iyengar209). Infants born to mothers supplemented with Ca, either 300 or 600 mg/d, during pregnancy had higher radiographic bone density of their arms and legs than those born to controls, but there was no difference between the supplemented groups(Reference Raman, Rajalakshmi and Krishnamachari208). A DXA study has suggested that infants in rural areas of The Gambia have lower whole-body BMC, and hence total body Ca content, than infants of the same age in Western populations(Reference Jarjou, Prentice and Sawo24). However, the extent to which these results in Indian and African women reflect low maternal Ca intakes as opposed to small maternal and fetal size associated with poor general nutrition is unclear. The Gambian study also showed that Ca supplementation (1500 mg/d) of the mothers during pregnancy had no significant effect on fetal bone mineral accretion, as measured by SPA and DXA at 2 weeks, or on birth weight and other anthropometry(Reference Jarjou, Prentice and Sawo24). An intervention study in the USA showed a higher whole-body BMC 2d after delivery in the offspring of women in the lowest quintile of dietary Ca intake ( < 600 mg/d) randomised to receive 2000 mg Ca/d in pregnancy compared with those given placebo and those with higher dietary Ca intakes(Reference Koo, Walters and Esterlitz223). In addition, studies looking at dietary determinants of birth weight and fetal bone dimensions have suggested that there are positive associations between fetal growth and bone mineral and Ca-rich foods, such as dairy products(Reference Chan, McElligott and McNaught224, Reference Chang, O'Brien and Nathanson225). It is possible therefore that, in the Indian and Gambian studies, shortages of other nutrients may have prevented a response to the increased maternal Ca intake, but suggests that Ca alone does not limit fetal bone accretion in these populations(Reference Prentice, Laskey and Goldberg23). However, it is possible that a low maternal Ca intake may be limiting in mothers with poor vitamin D status, but to date there have been no studies directly exploring this possibility.
Based on a small number of studies, there are conflicting indications about whether maternal Ca intake during pregnancy influences the bone mineral accretion of the child in the long term. An observational study in India among women with a low Ca intake reported that women with a higher frequency of intake of Ca-rich foods during pregnancy had children with higher BMC and aBMD of the spine and whole body at 6 years of age than mothers with lower intakes of Ca-rich foods(Reference Ganpule, Yajnik and Fall226). However, in an Australian longitudinal study, no association was found between maternal dietary intake of Ca during pregnancy and aBMD at the spine, hip or whole body of their children at 8 years of age(Reference Jones, Riley and Dwyer227). Additionally, in the Gambian study described above(Reference Jarjou, Prentice and Sawo24), there was no evidence of a beneficial effect of Ca supplementation in pregnancy on skeletal dimensions as measured by crown–heel length and head circumference at 12 months of age(Reference Jarjou, Prentice and Sawo24) or on stature at age 5–10 years(Reference Hawkesworth, Sawo and Fulford228).
Influence of maternal vitamin D status on calcium economy and bone health of mother and child
Vitamin D is essential for Ca and bone metabolism, and maternal vitamin D status is important during pregnancy and lactation in the context of maternal and infant bone health. Vitamin D is supplied by endogenous skin synthesis under the action of UVB light and by the diet. The contribution of each source to vitamin D supply depends on many factors, including those that influence cutaneous synthesis, such as skin exposure to sunlight, season, latitude, weather and atmospheric pollution, and those that influence oral intake, such as food fortification and supplementation practices(Reference Prentice229). Vitamin D status is generally assessed by measuring plasma 25OHD, a long-lived metabolite of vitamin D that is considered to reflect vitamin D supply from skin synthesis and the diet(Reference Prentice, Goldberg and Schoenmakers230, 231). A summary of the evidence relating maternal vitamin D status to bone health outcomes is presented below. The possible influence of maternal vitamin D status on other health outcomes for the mother and child, such as pre-eclampsia, premature or complicated delivery, insulin sensitivity, immune function, cancer and CVD risk, and the current debate on the definition of vitamin D adequacy based on 25OHD measurements are beyond the scope of the present review but recent summaries can be found elsewhere(214, Reference Prentice, Goldberg and Schoenmakers230–Reference Hollis, Johnson and Hulsey234).
Influence on the mother
There is no evidence that the biological requirement for vitamin D is increased by pregnancy and lactation because only small amounts of vitamin D and its metabolites cross the placenta or are transferred into breast milk(Reference Kovacs5, 213, Reference Specker235). Frank clinical vitamin D deficiency in adults causes osteomalacia, hypocalcaemia and secondary hypoparathyroidism; there is no evidence to suggest that this worsens during pregnancy(Reference Kovacs5). In theory, poor vitamin D status during pregnancy and lactation, at 25OHD concentrations above those associated with clinical vitamin D deficiency, might compromise Ca homeorrhesis, such as the ability to increase intestinal Ca absorption and renal Ca retention, and might lead to a more exaggerated maternal skeletal response and compromise the mother's bone health. However, the extent to which this is the case is not known. Few studies have investigated the possible interaction between vitamin D status and maternal Ca and bone metabolism during pregnancy and lactation. One observational study reported that British women who were pregnant during the winter had greater reductions in QUS bone variables than those pregnant during the summer, suggesting an interaction with vitamin D status(Reference Javaid, Crozier and Harvey69).
Maternal vitamin D status during lactation also influences the concentration of breast-milk vitamin D metabolites. Vitamin D (cholecalciferol and ergocalciferol) transfers readily into breast milk from the maternal circulation, 25OHD less so and 1,25(OH)2D hardly at all(Reference Kovacs5). The concentrations of vitamin D and its metabolites in breast milk parallel those in the mother's circulation, but at lower concentrations. In US women, the breast-milk concentration of vitamin D increased 10-fold to a peak within 48 h of a single exposure to UVB radiation at 1·5 minimal erythmal dose and remained above baseline levels for at least 2 weeks(Reference Greer, Hollis and Cripps236, Reference Hollis237). These changes closely paralleled the concentrations of maternal serum vitamin D but were lower by approximately 10- to 15-fold. Similarly, oral supplementation with vitamin D3 or D2 has been shown to increase the vitamin D content of breast milk, with smaller increases in 25OHD(Reference Basile, Taylor and Wagner238–Reference Wagner, Hulsey and Fanning240). Very high concentrations were measured when vitamin D was given at therapeutic doses during pregnancy to treat an underlying clinical disorder(Reference Greer, Hollis and Napoli241). These data, and those from animal studies, suggest that only unmetabolised vitamin D is found in significant quantities in milk and thus is the predominant dietary form of vitamin D available to the exclusively breast-fed infant(Reference Greer, Hollis and Cripps236).
It is also plausible that maternal vitamin D status might influence the incorporation of Ca into breast milk. However, no association between breast-milk Ca concentration and maternal vitamin D status (25OHD) was observed in a study of British and Gambian women(Reference Prentice, Yan and Jarjou242), and no differences in breast-milk Ca were observed between US mothers who consumed 50 μg/d (2000 IU/d) or 100 μg/d (4000 IU/d) supplemental vitamin D between 1 and 4 months of lactation compared with historical controls consuming 10 μg/d (400 IU/d)(Reference Basile, Taylor and Wagner238).
Influence on the child
Fetal 25OHD, as measured in cord blood, mirrors that in the maternal circulation, at similar or slightly lower concentrations. Therefore, maternal vitamin D status in pregnancy is the key determinant of neonatal vitamin D status(Reference Kovacs5, Reference Specker243, Reference Cockburn, Belton and Purvis244), and, together with infant UVB skin exposure and the limited supply through breast milk, of vitamin D status in the first months of life(Reference Specker, Vieira and O'Brien154, 213, 231, Reference Specker243, Reference Pawley and Bishop245). Vitamin D deficiency in the pregnant mother is associated with congenital rickets, craniotabes and hypocalcaemia in the newborn, and rickets in infancy(213, 214, 231, Reference Specker243). There is evidence that maternal vitamin D status during pregnancy at 25OHD concentrations above that associated with clinical deficiency may influence fetal and infant bone growth and dental development(231, Reference Specker243), although the data are conflicting. Birth weight and neonatal BMC and bone turnover have been related to season of birth in countries where maternal vitamin D status is seasonally dependent(Reference McGrath, Keeping and Saha246–Reference Namgung, Tsang and Lee248). Positive associations have been reported between birth weight and length and maternal vitamin D intake(Reference Mannion, Gray-Donald and Koski249) and infant vitamin D status(Reference Weiler, Fitzpatrick-Wong and Veitch250) among infants in Canada; however, these observations were confounded by maternal milk intake because Canadian milk is fortified with vitamin D. Infants of Australian mothers who were vitamin D deficient at 28–32 weeks of pregnancy (25OHD < 28 nmol/l) had shorter knee–heel length at birth than other infants, indicating a difference in long-bone growth, but other birth measures were unaffected(Reference Morley, Carlin and Pasco251). A study in The Gambia, in which all women had a plasma 25OHD concentration >50 nmol/l at 20 weeks of pregnancy, found no significant relationships between maternal vitamin D status and infant growth or bone mineral during the first year of life(Reference Prentice, Jarjou and Bennett252). Maternal vitamin D status during pregnancy may have long-term effects on bone mineral accretion in childhood. A low concentration of maternal 25OHD in late pregnancy has been associated with lower whole-body and lumbar spine BMC in UK offspring at 9 years of age; maternal UVB skin exposure and vitamin D supplement use in late pregnancy were also predictors(Reference Javaid, Crozier and Harvey253).
In pregnant women at risk of low vitamin D status, vitamin D supplementation in mid–late gestation with doses ranging from 10 to 30 μg/d (400 to 1200 IU/d) has demonstrated greater cord and plasma Ca concentrations, lower plasma ALP concentrations, smaller fontanelle size and lower incidence of growth retardation and neonatal hypocalcaemia in the newborns(Reference Cockburn, Belton and Purvis244, Reference Brooke, Brown and Bone254–Reference Mallet, Gugi and Brunelle260) and effects on subsequent infant growth(Reference Brooke, Butters and Wood255). Other studies have reported no effects on birth weight(Reference Mallet, Gugi and Brunelle260) or infant forearm bone mineral(Reference Congdon, Horsman and Kirby261). It should be noted that many of these studies were small and did not have randomised, controlled protocols.
As described in the previous section, unmetabolised vitamin D is the predominant form of vitamin D transferred postnatally from the mother to the breast-fed infant. The concentrations of vitamin D in breast milk are influenced by the mother's UVB exposure and dietary intake. Supplementation of US women during lactation with doses of 10 μg/d (400 IU/d) vitamin D has been shown to have relatively little influence on the vitamin D status of their breast-fed child, but increases in serum 25OHD concentrations have been observed in the infants of US lactating women consuming supplemental vitamin D at doses of 50–160 μg/d (50–6400 IU/d)(Reference Specker235, Reference Basile, Taylor and Wagner238–Reference Wagner, Hulsey and Fanning240).
There is considerable controversy over the definition of vitamin D adequacy for pregnant and lactating women that takes into account the requirements for the mother and infant, other potential health outcomes for the mother and child, and the UVB exposure and/or supplemental doses required to achieve it(Reference Abrams262). Large supplementation trials(263–265) are currently ongoing in the UK, USA and Canada to provide more definitive evidence.
Summary and implications for nutrition policy
The evidence presented in this review suggests that human pregnancy and lactation are associated with changes in Ca and bone metabolism that support the transfer of Ca between mother and child. Decreases in maternal bone mineral are observed in pregnancy and lactation, predominantly from regions of the skeleton rich in trabecular bone. These decreases are sufficient to make a sizeable contribution to Ca economy(Reference Prentice, Pettifor, Juppner and Glorieux3, Reference Olausson, Laskey and Goldberg11, Reference Heaney and Skillman103). Other changes that contribute to Ca economy are also observed, such as increases in intestinal absorption efficiency during pregnancy and the later stages of lactation, and enhanced renal Ca reabsorption during lactation. The classical calciotropic hormone PTH, while continuing to play a role in Ca homeostasis, appears not to be the primary mechanistic driver for the changes in Ca and bone metabolism during pregnancy and lactation, except potentially during the phase of adjustment after lactation stops and for mothers nursing twins in whom the demands for Ca transfer into breast milk are particularly high. Instead, PTHrP is considered to play a key role. The changes in Ca and bone metabolism observed in pregnancy and lactation generally appear to be independent of maternal Ca supply in populations where Ca intakes are close to current recommendations. The effects are reversed in later lactation or after breast-feeding has stopped and there is no evidence of residual effects on the skeleton that might suggest any detriment to the long-term bone health of the mother. Taken together, therefore, the evidence suggests that these processes are physiological in the human and that they provide sufficient Ca for fetal growth and breast-milk production, without relying on an increase in dietary Ca intake and without compromising maternal bone health in the long term. However, more research is needed to determine whether this holds true for women with marginal and low dietary Ca intake. In addition, maternal vitamin D status during pregnancy is an important factor influencing Ca and bone metabolism of the mother and child that needs to be considered especially in populations at risk of vitamin D deficiency.
Nutrition policy and dietary guidelines with respect to Ca and vitamin D in pregnancy and lactation differ between countries(213, 214, Reference Prentice229, 231, 266). In the UK, no increase in Ca intake in pregnancy is recommended, in line with the existing evidence, and, although the recommendation is currently for an increase of 550 mg Ca/d in lactation, it is considered that such an increment may not be necessary(266). For vitamin D there is a reference nutrient intake for pregnant and lactating women in the UK of 10 μg/d, with a recommendation to consume a supplement(231), and it is recognised that the re-emergence of rickets is occurring among some sectors of the population, and that many UK women have a low vitamin D status before and during pregnancy(Reference Hyppönen and Boucher267).
Further research is needed to determine the limitations of the maternal response to the Ca demands of pregnancy and lactation, especially among mothers with low Ca intakes, and to define vitamin D adequacy for reproductive women.
Acknowledgements
The authors were supported by the UK Medical Research Council (unit programme no. U105960371 and U123261351). The present review received no specific grant from any funding agency in the public, commercial or not-for-profit sectors.
H. O. and G. R. G. had the original idea for this review, the contents and where it would be submitted. H. O. conducted the majority of the literature review, drafted the original manuscript, and compiled the tables. G. R. G. and A. P. critically reviewed the manuscript, and revised and prepared it for submission. All authors contributed to the interpretation of the data and review contents: H. O. (maternal physiology, biochemistry and endocrinology); G. R. G. (maternal and infant physiology and nutrition); M. A. L. (bone imaging and biology); L. M. A. J. (maternal and infant nutrition); I. S. (biochemistry and endocrinology); A. P. (mineral metabolism, reproductive physiology, public health nutrition). All authors read and approved the final version of the manuscript before submission.
None of the authors has any conflicts of interest.


