Introduction
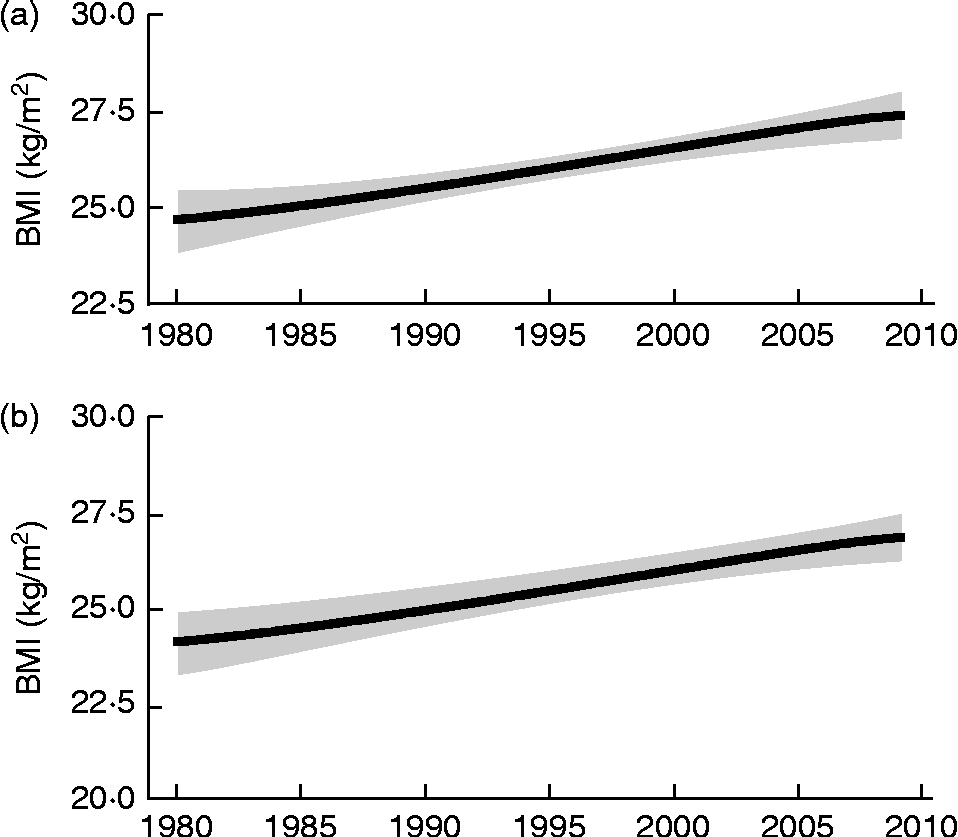
Obesity is at the heart of all national discussions about public health and well-being, having reached epidemic proportions within the developed world and moving towards such levels within many parts of the developing world. A high BMI is now identified as the sixth most important risk factor for global death and disease burden, ranking first in Australasia, second in North America and third in Western Europe(Reference Lim, Flaxman and Andrews1). The most recent information for England(2) indicates that in 2010, most of the population, 69 % of men and 60 % of women, were overweight (BMI ≥ 25 and < 30 kg/m2), with 26 % obese (BMI ≥ 30 kg/m2), almost twice the prevalence observed in 1993. This is a consequence of a steady increase in adult BMI which began in Britain during the 1950s(Reference James3, Reference Khosla and Lowe4) and which is well documented from 1980(Reference Finucane, Stevens and Cowan5) (see Fig. 1). Obesity was first recognised as a ‘hazard to health’ in the UK in 1976(Reference James3), with the mean adult BMI reaching 25 kg/m2 in the early 1980s for men and the late 1980s for women(Reference Finucane, Stevens and Cowan5). The consequences of these changes for the health of the general population are now becoming clear(Reference Prospective Studies Collaboration, Whitlock and Lewington6, Reference Berrington de Gonzalez, Hartge and Cerhan7), with all-cause mortality increasing by about 30 % for each 5-unit increase in BMI above the reference minimum mortality range of 20·0 to 24·9 kg/m2 up to a BMI value of 49·9 kg/m2. These reports identify mechanisms linking excess adiposity, especially visceral adiposity, with vascular disease, the main cause of increased mortality, through hypertension, dyslipidaemia and inflammation. Even for the elderly, for whom there has been some debate about the potential hazard of being overweight(Reference Baumgartner, Stauber and Koehler8) and for whom BMI may overestimate adiposity if height falls with age, it has been clearly shown that increased waist circumference increases risk of all-cause, cardiovascular (CVD) and cancer mortality(Reference de Hollander, Bemelmans and Boshuizen9). Whilst detailed socio-economic models of its aetiology have been elaborated, and an extensive literature on the types and effectiveness of weight-reduction interventions for individuals and population groups has accumulated(10), no consensus has yet emerged about effective, population-based strategies, particularly whether such strategies should focus on energy intake (EI), energy expenditure (EE), or both(10).
Trends in BMI for UK males (a) and females (b) 1980–2010. The solid line represents the posterior mean and the shaded area the 95 % uncertainty interval. (Redrawn from Finucane et al. (Reference Finucane, Stevens and Cowan5)).

One important reason for this lack of consensus is ‘the lack of robust, objective measures of dietary intake and physical activity and of behavioural and attitudinal measures in large populations’(10) which prevents the debate being informed by unequivocal data. Also the detailed time course of weight gain is largely undocumented, so that simple questions about whether weight gain is slow and incremental or episodic cannot be answered. However, it is also the case that the basic human biology and nutritional physiology of obesity at the level of energy balance and energy flux remain poorly understood and as a result controversial. Most would agree with the simple model frameworks proposed by Popkin(Reference Popkin11) or Bouchard(Reference Bouchard12) who view the energy imbalance, i.e. an excess of EI over EE, and weight gain to be as a result of large shifts in both diet and physical activity patterns. These shifts have occurred to a greater or lesser extent on a global basis, resulting from an obesogenic social and built environment to which populations, many of whom carry obesity-related genetic traits, are exposed to, and who exhibit obesogenic behaviour in terms of overconsumption and under-activity. In relation to the genetics of obesity, this is by no means straightforward. Notwithstanding the great advances in identifying obesity-related SNP that contribute to the clearly demonstrated heritability of obesity, i.e. an individual's risk of adult obesity increases by 2·2- to 3·2-fold or by 5- to 15-fold if one or both parents were obese throughout childhood and adolescence(Reference Loos13), such increased risk reflects both genetic as well as familial environmental susceptibility. Furthermore although genome-wide association studies, performed mainly in white European adults, have to date identified at least fifty-two loci robustly associated with obesity-related traits(Reference Loos13), of which the best-known fat mass and obesity associated (FTO) risk allele occurs with a high frequency (46 %) in white Europeans, with each trait increasing BMI, by up to 0·33 BMI units in the case of the FTO variant(Reference Li, Zhao and Luan14), the predictive ability of the BMI-associated loci remains poor. Thus these fifty-two currently identified traits account for a total of only 6–7 % of the variance in BMI. Although genetic studies should reveal new insights into the biological pathways that underlie weight gain and body fat accumulation, and may eventually explain why humans are better able to defend against weight loss than against weight gain, to date progress in this direction appears to be slow. This has allowed a range of views and interpretations to develop, not only in relation to the more esoteric questions, such as the evolutionary origins of human susceptibility to obesogenic environments and diets(Reference Prentice, Hennig and Fulford15, Reference Speakman16), but also over questions relating to basic issues such as the relative importance of increasing EI or decreasing EE as the primary driver of weight gain. One approach to the debate is to recognise that such debates are over-simplistic. For example, there is an obvious interaction between sedentary behaviour and food overconsumption(Reference Chaput, Klingenberg and Astrup17). In addition, elaborate very large-scale complex obesity system maps such as those described in the Foresight report have been produced that include all possible influences, interactions and potential solutions(10), and which argue that ‘disproportionate attention has been given to debates over the relative importance of diet or inactivity in the aetiology of obesity, given that the subtle shifts in energy balance which have occurred at a population level are below the limits of detection of current methodologies’. The other approach is to place one main driver of obesity, the food supply, at the centre of the problem(Reference Swinburn, Sacks and Hall18). This automatically downscales all other influences. Rutter(Reference Rutter19) has commented that such simple energy balance questions assume that obesity has evolved within a complicated but ultimately knowable and predictable system and can therefore be modelled and understood. In his view obesity should be treated as the outcome of a complex system with understanding and solutions unlikely to come from the perspective of individual scientific specialisms, requiring instead ‘big thinking, many changes’(Reference Lang and Rayner20). While this may well be true, it is nevertheless important to ensure that within the ‘complicated system’ discussion, the detailed arguments are logical and stand up to scrutiny. Although much of the recent debate has evolved in relation to the growth of obesity in the USA and elsewhere, the main focus here is on the development of obesity in the UK population.
Drivers of obesity: the current gluttony v. sloth debate
In 1995, commenting on the doubling of obesity prevalence in Britain between 1980 and 1991, Prentice & Jebb(Reference Prentice and Jebb21) argued that although it was generally assumed that ready access to highly palatable foods induces excess consumption so that simple gluttony causes obesity, in fact, average recorded EI in Britain had declined substantially as obesity rates have escalated. The implication was that increasing sloth was also an important driver in that levels of physical activity, and hence energy needs, had declined even faster. Their interpretation of the evidence was that modern inactive lifestyles were at least as important as diet in the aetiology of obesity and possibly represent the dominant factor. The importance of an inactive lifestyle as well as an obesogenic diet was also identified by some US workers such as Hill and colleagues (Hill & Peters(Reference Hill and Peters22)). In one review which examined the behavioural factors in the aetiology of obesity(Reference Hill23), Hill made the important observation that the role of changes in EI was difficult to identify because weight gain itself increases EE, making it difficult to separate cause from effect in terms of EI and obesity. On the other hand, he reported evidence of reductions in physical activity in specific population groups. One example was the Amish community who chose not to adopt much of the technological change that has shaped physical activity behaviour in the wider population. On the basis of recorded walking activity of the Amish(Reference Bassett, Schneider and Huntington24) and Hill's and others' studies of average men and women, Hill identified a difference in daily EE of 400–600 kcal/d (1670–2510 kJ/d) as an approximation of the reduction in physical activity that has occurred in the past decades. Reviewing links between obesity and physical activity in 1996, Ferro-Luzzi & Martino(Reference Ferro-Luzzi, Martino, Chadwick and Cardew25) concluded that at least for Western societies, the overall EE had fallen for some decades and lifestyles have become increasingly more sedentary. For example, one 7-year longitudinal study of self-reported physical activity in the late 1980s and early 1990s in young US adults identified a 30 % decrease in mean physical activity(Reference Anderssen, Jacobs and Sidney26). The Ferro-Luzzi–Martino report followed from an analysis of time-budget surveys showing that both the time required for and energy spent on earning a living and domestic work had declined appreciably over recent decades, and that the associated expansion of free time involves considerable passive leisure.
A more recent analysis of the changes in occupation in the USA supports this view. Thus data on occupations in private industry from the US Bureau of Labor Statistics combined with National Health and Nutrition Examination Survey (NHANES) body weight changes show that the extent of the reduction in daily occupation-related EE (>100 kcal;>420 kJ) and associated estimated weight gain closely matches the observed weight gain between 1960 and 2003–2006(Reference Church, Thomas and Tudor-Locke27). Clearly, such calculations are subject to a variety of assumptions but the authors remark that by not factoring in technological changes that reduce the extent of moderate-intensity occupations, they may have underestimated the fall in EE of the work force. Another likely example of a fall in EE being associated with an increase in obesity is the urbanisation of China. James(Reference James28) estimates that the change from rural to modern urban life may involve a reduction of 400–800 kcal/d (1670–3350 kJ). Given this change and the associated dramatic increase in dietary energy density associated with increased sugar and a more than doubling in fat EI during this transition, the estimated current increase in adult weight of 0·5–2 kg/year is, in his view, entirely predictable. One recent global study of emerging trends in decreased EE and increased sedentary patterns also identified a fall in activity(Reference Ng and Popkin29). This study examined both cross-sectional and longitudinal datasets of physical activity in terms of metabolic equivalents of task (MET) for past and current activities across the four main physical activity fields over many decades and showed that MET values decreased in the USA, UK, China, Brazil and India over the time periods studied. These authors predict that physical inactivity and sedentary behaviours will continue to rise. However, as commented in another recent authoritative review of global physical activity level (PAL)(Reference Hallal, Andersen and Bull30), the first in the Lancet's recent series on physical activity(Reference Das and Horton31), the collection and codification of data on PAL have been extremely difficult in the past because a standardised instrument suitable for international use has only been available since 2003(Reference Craig, Marshall and Sjostrom32). Data collected over the last decade with this instrument indicate that for 122 countries a third of all adults and four-fifths of adolescents are reported not to reach public health guidelines for recommended levels of physical activity(Reference Hallal, Andersen and Bull30). For children and adolescents, time budget analyses are much more difficult than for adults, but assessment of television (TV) watching has identified an increasing trend in some cases (for example, NHANES III in the USA(Reference Andersen, Crespo and Bartlett33) and in Europe(Reference Niemi and Pääkkönen34)) while others have found minimal change in either TV watching or vigorous physical activity as measured by self-administered questionnaires over the period 1985/1986 to 1997/1998(Reference Samdal, Tynjala and Roberts35). One 5-year longitudinal study of physical activity and sedentary behaviour during adolescence reported substantial reductions in moderate to vigorous physical activity (MVPA), particularly among girls, and increasing leisure-time computer use in girls and boys(Reference Nelson, Neumark-Stzainer and Hannan36). A 2005 review of evidence on sedentariness, fitness and attitudes concluded that physical activity in clearly defined contexts, active transport, school physical education and organised sports was declining in many countries(Reference Dollman, Norton and Norton37). In a study involving two 10-year-separated cross-sectional cohorts of Czech adolescents in 2000 and 2010 the doubling in obesity was accompanied by an increase in total sedentary behaviour, especially in girls, and a switch from TV watching to computer games(Reference Sigmundová, Ansari and Sigmund38).
For the UK population the recent UK dietary reference values (DRV) report(39) comments that both the National Diet and Nutrition Survey (NDNS) and the Health Surveys of countries within the UK, which estimate physical activity as the proportion of the survey population who achieve the UK recommended level, consistently show that the majority of individuals do not meet these physical activity recommendations. Similarly, despite numerous public recommendations to promote physical activity in the USA, one study showed that over four decades from 1958 to 1998 amongst a health-conscious population of US elderly there were only very modest increases(Reference Talbot, Fleg and Metter40). The problem with all such estimates based on self-reported physical activity questionnaires, including the International Physical Activity Questionnaire(Reference Craig, Marshall and Sjostrom32), is that they are likely to over-report physical activity in the population and have limited accuracy in representing habitual levels. Physical activity as an aetiological factor is discussed further below.
A related and important theme of Hill's work is the magnitude of the mismatch between EI and EE responsible for the observed rates of weight gain. They introduced a statistic describing the ‘energy gap’, the required change in EE relative to EI necessary to restore energy balance, which in their terms was the same amount as the excess daily intake over expenditure calculated from weight gain over time. Thus on the basis of a deposited energy content of weight gain of 7·7 kcal/g (32·2 kJ/g) they identified that 1 lb (0·45 kg) of weight gain represented 3500 kcal (14 640 kJ) of body energy and estimated from the distribution of weight gain over an 8-year period indicated in NHANES that this was equivalent to daily energy imbalances for the median weight gain of only 15 kcal/d (63 kJ/d), with 50 kcal/d (209 kJ/d) accounting for the 90th percentile(Reference Hill, Wyatt and Reed41).
Although this calculation is simplistic and has been criticised(Reference Hall, Sacks and Chandramohan42) it is undeniably the case that on a daily basis, a very small energy imbalance between EI and EE can mediate weight gain. Such a response against a background of a declining EE became the mainstream view in the UK as indicated by the Foresight report(10), i.e. ‘It is generally accepted, at least for adults, that as society has changed, there have been systematic reductions in energy expenditure, as a consequence of fewer manual jobs, increases in car ownership and the rise of labour-saving devices for use at home and work. Despite evidence of reductions in walking and cycling to school, the impact of similar changes on physical activity in children is less clear. Other factors may also be relevant, such as the increased fears of parents about unsupervised outdoor play for children’(Reference Fox and Hillsdon43). Forsight recognised specific dietary risk factors for obesity such as foods with a high energy density, diets high in fat and low in fibre, and the consumption of sugar-rich drinks, all compounded by large portion sizes(Reference Jebb44) but importantly argued that ‘disproportionate attention has been given to often sterile debates’ about causality (poor diet or lack of exercise). The report argued that subtle shifts in both diet and physical activity that influence obesity trends may be below the limits of detection of current methodologies(Reference Jebb44, Reference Wareham45).
This comment was most probably in response to an increasingly prominent view that rejected the Prentice & Jebb position that sloth played a bigger part than gluttony and which placed sole responsibility on the food supply as the main driver of obesity. Cutler and colleagues, in addressing the question ‘Why have Americans become more obese?’ (Cutler et al. (Reference Cutler, Edwards and Shapiro46)) and subsequently ‘Why is the developed world obese?’ (Bleich et al. (Reference Bleich, Cutler and Murray47)) argued that for the USA and for most other developed countries ‘calories expended’ have not changed significantly since 1980, while ‘calories consumed’ have risen markedly so that rising obesity is primarily the result of consuming more ‘calories’. They prefaced their discussion with some energy balance calculations which purport to show that the net energy imbalance required to account for observed weight gains (a 10- to 12-lb (4·5- to 5·4-kg) increase in median weight in two decades) is ‘strikingly small’ at about 100 to 150 kcal/d (420 to 630 kJ/d). In fact, the value they calculate is not an estimate of the likely daily energy imbalance but of the increase in EE and consequent EI (energy turnover or flux) at the end of the two decades when their 10- to 12-lb (4·5- to 5·4-kg) weight gain has occurred, i.e. the extra intake needed to support the energy demands of a larger individual. In fact, a weight change of 10 lb (4·5 kg) over 20 years is equivalent to less than 1 g weight gain/d requiring an unmeasurably small daily energy imbalance. This misplaced equality of the increase in energy turnover resulting from weight gain with the extent of daily energy imbalance to achieve such weight gain has become an important feature of the debate as discussed below.
Cutler et al. (Reference Cutler, Edwards and Shapiro46) reviewed evidence on EI and conclude that in the USA between 1909 and 1950 urbanisation resulted in a decline in EE but obesity did not occur because EI also fell. However, they argue that EI increased from 1965 to 1999 by about 700 kcal (2930 kJ) (1978–1999) ‘three to four times the increase needed to explain the increase in average obesity over the time period’. Furthermore, they argue that for EE voluntary exercise has not changed between 1965 and 1995, whilst the major reduction in occupational EE occurred between 1910 and 1970 with a much more modest change since, and with change in transportation to work having ‘largely run its course by 1980’. They also argue that for children and the elderly for whom increases in obesity have occurred, reductions in employment-based EE cannot be used as the basis of a reduction in EE and, in the case of the elderly, they may be more active now than in 1980. They conclude that ‘the most plausible explanation for the rise in obesity involves increased caloric intake, not reduced caloric expenditure’.
This view is repeated in a recent Lancet series(48) in which Swinburn et al. (Reference Swinburn, Sacks and Hall18) echo Cutler's views and propose a scenario involving two distinct phases: ‘the so-called move less, stay lean phase (1910–60), characterised by decreasing physical activity levels and energy intake, and a population that remained lean; and the subsequent so-called eat more, gain weight phase, characterised [after a “tipping point”] by increasing energy intake and a concomitant rise in population weight’. They argue that during these two phases two different mechanisms operate to achieve energy balance. In phase 1, appetite mechanisms ‘pull down energy intake, because intake was being matched to decreasing expenditure associated with decreases in physical activity so that obesity rates did not increase despite widespread uptake of mechanisation and motorisation’. In phase 2, weight gain restored energy balance by increasing energy expenditure (through increased RMR) to match increasing intake in response to increasingly available, cheap, tasty, highly promoted obesogenic foods. Clearly this view does not allow for weight gain to be driven by a positive energy balance consequent on reduced physical activity. On the contrary, the model is dependent on reduced activity before the tipping point driving a fall in EI.
The fact that what appear to be plausible analyses of the extent of change in physical activity in recent decades can reach such opposite conclusions compared with other commentators shows the difficulty in reaching a definite conclusion on this aspect of the debate.
Direct measurements of energy expenditure
While direct measurement of daily EE over 1–2 weeks with the doubly-labelled water (DLW) method has transformed our ability to study energy balance, to date, such data have yet to inform unambiguously on the gluttony v. sloth debate. Indeed, one of the first DLW reports on the obese showed that while BMR, total EE and physical activity energy expenditure (PAEE; 0·9 × EE − BMR) were all higher in obese compared with lean women, there was no difference in EE or PAEE calculated on a fat-free mass or total body weight (W) basis or in PAL (EE/BMR)(Reference Prentice, Black and Coward49). Ferro-Luzzi & Martino(Reference Ferro-Luzzi, Martino, Chadwick and Cardew25) also showed that DLW-determined values of PAL were the same in lean third-world adults compared with overweight developed-country subjects. These were surprising results at the time but have subsequently been confirmed repeatedly (and the implications of such data are further discussed below). DLW measurements of EE in terms of both EE and PAL were recently compared in two large cohorts of women from sociocultural environments that give rise to the extremes of obesity prevalence, rural Nigeria and African American women in Chicago, mean BMI = 23 or 31 kg/m2, respectively(Reference Luke, Dugas and Ebersole50). The mean and distributions of PAL values were the same for the two cohorts and in each case weight gain during the 3 years after the baseline DLW measurement was unrelated to activity EE adjusted for W. The most recent attempt to develop the debate is a meta-analysis of all published DLW studies of adults living in developing and industrialised countries between 1986 and 2008 with the objective of examining whether EE and PAL values are higher for individuals in developing countries(Reference Dugas, Harders and Merrill51). An analysis of mean study data from 183 cohorts of subjects showed that neither EE, adjusted for W and age, nor PAL differed significantly between developing and industrialised countries. They concluded that this ‘calls into question the role of energy expenditure in the cause of obesity at the population level’. In terms of year of publication they also showed very little change over the time period. Thus, although within a meta-regression of all examined studies, EE fell marginally (P= 0·05) over the time period for men, there was no change in women and there was no change in PAL for men or women. The study mean PAL values for men and women aged < 65 years from the industrialised countries are shown in Fig. 2. It is clear that year of publication explained very little of the variance (1·6 % for the combined data), so that the mean fall in PAL from 1·81 in 1986 to 1·72 in 2008 cannot be interpreted as hard evidence of a reduction in physical activity over the two decades when the data were published.
Trends in doubly-labelled water-derived physical activity for published studies from industrialised countries. Mean physical activity level (PAL) values for men (■) and women (○) aged < 65 years from industrialised countries (R 2 for the regression = 0·016). (Data from Dugas et al. (Reference Dugas, Harders and Merrill51)).

In fact, such meta-analyses are unlikely to reveal much about actual population trends in EE because the individual studies involve for the most part very small numbers (median and 90th centile n for each individual study = 14·5 and 71). With very few exceptions, subjects for these studies were not selected as representative of the general population and as a result the published data are extremely heterogeneous. Certainly neither W nor BMI changed significantly within these studies over the time frame examined (W and BMI explained < 1 % of the variance) and overall in the meta-regression of all published studies referred to above the authors report that after accounting for age, weight, development status and year of publication, the residual heterogeneity in mean study PAL values was close to 90 % for men and women.
Another widely quoted report suggesting no change in PAEE in recent decades is an analysis of DLW data by Westerterp & Speakman(Reference Westerterp and Speakman52). This conclusion is based on an analysis of a small dataset of DLW studies of EE of men and women measured at Maastricht (n 366 in nine separate groups starting in 1988). Trends in PAEE calculated in several, essentially similar, ways are interpreted as indicating either no change with time or, if anything, a slight increase. In fact the dataset is not large enough to draw any conclusions about time trends, with mean annual values exhibiting very considerable year-on-year changes and with the largest and the smallest mean annual values occurring in the first and second year. The fact that year of study was not an influence on EE, with W explaining 32 % of its variance, is not at all surprising given that the BMR component of EE varies directly with W, as does all weight-bearing PAEE. They also report an increase with time in EE measured in US subjects but the results for this analysis are not shown, so that it is difficult to comment on. They also argue that the PAEE matches EE of wild animals. In fact the similarity between observed EE in Maastricht and that predicted on the basis of W according to a regression of EE on W in wild animals is also not helpful given that the 95 % CI values of their derived prediction equation ranged from EE values equivalent to PAL values from 1 to>2 and with wild animal values at similar body weights exhibiting PAL values ranging from 1 to 2·5.
This same laboratory has published another DLW study given the title ‘Physically active lifestyle does not decrease the risk of fattening’(Reference Westerterp and Plasqui53). This study reports PAL values and fat gain in Dutch men and women over 10 years with a principal finding that ‘a high initial activity level was predictive for a higher fat gain’. However, the data actually reported are an increase in body fat and BMI and a small average fall in PAL, with the most physically active subjects showing the largest reduction, so that individual changes in PAL and fat exhibited an inverse relationship; i.e. the subjects who reduced PAL the most, gained most fat and vice versa. Thus, a quite legitimate alternative title would be ‘Reducing a physically active lifestyle increases the risk of fattening’.
The most widely quoted report that discusses obesity as a consequence of increased EI rather than reduced PAEE is that of Swinburn et al. (Reference Swinburn, Sacks and Lo54). This is an analysis of the relationship between W and ‘energy flux’, defined as EE ≡ EI, with EE measured by DLW, in a large cohort of adults with W ranging from 34 to 150 kg derived from eight published studies. The analysis is performed to identify the magnitude of what they define as ‘the energy flux gap’, the difference in EE between two time points defining the change from normal weight to obesity (in fact the same measure calculated by Cutler et al. (Reference Cutler, Edwards and Shapiro46) discussed above). This ‘energy flux gap’ is distinct from the ‘energy imbalance gap’, i.e. the excess of EI over EE which results in weight gain, which, as discussed above is very small and not measurable. This is an important authoritative report in so far as the authors of the article (and of the response to criticism of the arguments made in the report(Reference Millward55, Reference Swinburn, Sacks and Lo56)) include established leaders of the field of energy balance studies. Thus what they say cannot be lightly dismissed. However, the present author has questioned its main arguments(Reference Millward55). The authors make two important points.
The first is that identifying the magnitude of the ‘energy flux gap’, the extra food EI required to maintain the increased body weight of an obese compared with a lean adult, is important because it quantifies the magnitude of the public health challenge in relation to the extent to which food intake needs to fall to reverse obesity. Clearly, any improved understanding of the energetics of obesity is to be welcomed. However, in the same way that weight gain develops gradually over time as a result of continued small positive energy balance, health care practitioners know that effective weight management programmes must involve modest and sustained EI reductions if they are likely to succeed. Thus it remains to be seen how knowledge of the ‘energy flux gap’ will help in terms of individual weight management programmes or in relation to advice to the food industry.
Secondly, and more importantly, the report is important in the context of the gluttony v. sloth debate. This is because of the way the authors interpret the increasing ‘energy flux’ (EE ≡ EI) with increasing W which they demonstrate for their dataset and from which they derive a linear equation, EE ∝ W, and the log-transformed version of the reverse of this, lnW ∝ ln total EI. They argue that the positive relationship of the latter equation implies causality, i.e. weight gain is driven by increasing EI. Swinburn et al. argue(Reference Swinburn, Sacks and Lo54) that ‘the constraints of the first law of thermodynamics allowed us to infer that a high EI must be the major driver of higher body weight in modern populations. If obesity was primarily determined by lower PA (including higher sedentariness), one would expect that the consequent reductions in activity energy expenditure would result in a lower EE (EnFlux) being related to higher body weight (i.e. a negative relation). The fact that the observed relation was strongly positive implies that the high EnFlux associated with a high body weight is because a high EI is the main driver of both factors’. Is this a logical conclusion and is the observation itself in any way remarkable? In fact, as indicated above, the early DLW study of lean and obese subjects by Prentice et al. (Reference Prentice, Black and Coward49) demonstrated such a relationship in that EE was higher in heavier obese women compared with lean because both BMR and PAEE were higher, with no difference after correcting for body weight. Thus, the relationship shown by Swinburn et al. is hardly surprising. In fact, using the terminology of an ‘energy flux gap’, this earlier study showed that the energy flux gap of women with a BMI of 32·9 kg/m2 compared with 22·1 kg/m2 was 2·23 MJ/d.
The relationship between EE and W is examined in Fig. 3. The simple regression of EE on W for men and women reported by Swinburn et al. (Reference Swinburn, Sacks and Lo54) has been used to generate EE values at increasing body weights covering the within-population range of W in their dataset (equivalent to BMI values from 20 to 45 kg/m2 with values expressed as the mean for men and women at their current average UK population heights). These values are compared with values calculated in a similar way from two other datasets using a similar linear regression of EE on W calculated by the present author. One is the DLW database published as part of the US Institute of Medicine's review of energy requirements(57) that was compiled from individual values from a large number of generally small studies, many of which are included in the Swinburn dataset. The other is a large DLW dataset of urban American adults (n 890), which derives from two recent separate population-based studies(Reference Tooze, Schoeller and Subar58, Reference Moshfegh, Rhodes and Baer59) compiled within the recent UK report on DRV for energy(39). It is clear that the three DLW datasets show quite similar EE–body weight relationships. This is important, because the UK DRV dataset derives only from relatively recent population surveys so that the increasing weight relates to the current weight distribution within the population rather than representing a historical trend. The slope of any EE–W relationship reflects the increasing BMR with W, which is fixed and well studied (and shown in Fig. 3(Reference Henry60) as mean values for middle-aged men and women(Reference Dugas, Harders and Merrill51)), and the way that PAEE varies with W within the study population, which is a variable. For BMR ∝ W the line shown is EE = 0·0507 × W+2·69 MJ/d. This equation is very similar to the regression of BMR on weight for all adults in both the dietary reference intake (DRI) and UK DRV datasets (slopes = 0·0517, 0·0529, intercepts 2·53, 2·50, respectively). The slopes and intercepts of the lines at fixed PAL values increase directly with the PAL values shown in Fig. 3 (1·4, 1·7, 2·0 and 2·5). By comparing the slopes and heights for the three population datasets with the fixed PAL plots as shown it is immediately apparent that all three datasets are very similar to each other and to a fixed PAL–W relationship of about 1·7. For the UK DRV dataset, the mean value of PAL was 1·66, which was independent of weight(39). The two other datasets are very similar and indicate PAL values that increase very slightly from just below 1·7 to just above 1·7 over the weight ranges indicated. This is consistent with actual reported PAL values for the DRI dataset of 1·70 at 50 kg rising to 1·72 at 140 kg(57). Thus the EE–W regression derived from the dataset examined by Swinburn et al. (Reference Swinburn, Sacks and Lo54) approximates to a population in which the mean PAL value is about 1·7 and more or less constant over the weight range of the population, with the positive slope driven by the increasing BMR with increasing W.
Changes in total energy expenditure (EE) as a function of weight. Values shown are either calculated from BMR and physical activity level (PAL) (EE = PAL × BMR) or predicted from linear regressions of doubly-labelled water-derived values for EE on weight for datasets reported by Swinburn et al. (Reference Swinburn, Sacks and Lo54) (□), the UK dietary reference values report(39) (○) or the Institute of Medicine's dietary reference intake report(57) (△). The BMR values are calculated as the mean values for men and women calculated at weights equivalent to BMI values from 20 to 45 kg/m2 at current heights of UK men and women with the Henry prediction equations for men and women aged 30–60 years(Reference Henry60).

Is it likely that over such a wide range in weight the slope could be flat or negative as implied by the authors if PAL had declined? In fact, inspection of Fig. 3 shows that over the weight range indicated the slope would still be positive even if there was a systematic fall in PAL with increasing W, as indicated for example by a line connecting a PAL of 2·0 at the lowest body weight with a PAL of 1·4 at the highest body weight, although the positive slope would be much shallower than that of the three population datasets. Indeed, in order for the slope to be obviously negative for this very wide range of body weights it would require a PAL value at or above 2·5 for the smallest values of W, an unrealistically high sustainable rate of EE, falling systematically to 1·4 at the highest value of W, which is lower than the mean PAL observed for obese adults in current populations as discussed below. Thus for any dataset of values of EE and W in which W varies over such a wide range ( ≥ 60 kg) as that shown in Fig. 3, because the increasing BMR with weight will always drive an increasing EE with W regardless of how PAL values change (at least within a range which is a physiologically reasonable for very small and very large individuals), a positive slope is entirely predictable and a negative slope is highly unlikely. It should be noted, however, that this is not true for smaller weight changes. Inspection of Fig. 3 shows that it is perfectly possible for a smaller weight change (for example, W increasing from 70 to 90 kg) associated with a reduction in PAL (for example, from 2 to 1·7) to result in EE–W relationships with a negative slope. However, such a relationship could not be extended to include body weights markedly outside the limited range. What this means is that any examination of population data which includes the range of body weights shown in Fig. 3 will result in a EE–W relationship, the physiological causality of which is that increasing W drives increasing BMR and EE. To interpret EE as energy flux and therefore EI does not change this causality. Furthermore, it also follows that datasets which include very wide body weight ranges are quite unsuitable for deriving EE ∝ W relationships which can usefully be used to predict relatively small population-based weight changes from changes in EI as discussed below.
The next question relates to whether anything can be inferred from the relationships shown in Fig. 3, about the mechanism of increasing W, whether it is described in terms of energy flux or EI as opposed to EE as measured. Does it help the debate as to whether the positive energy balance driving weight gain results from gluttony (an increase in EI) or sloth (a fall in PAEE and EE)? In response to a criticism that the W–EE relationship offers no insight into the causality of weight gain(Reference Millward55), they respond(Reference Swinburn, Sacks and Lo56): ‘We agree that, although population weight gains could theoretically be due to a drop in physical activity energy expenditure (PAEE), this would need to be so large and uniform as to be physiologically unlikely.’ They also argue: ‘Conceptualizing how a reduction in PAEE could act as a driver toward a state of higher mean EE that accompanies the higher weight is a conundrum, so postulating an increase in EI as the major driver of higher body weight in modern populations seems far more parsimonious and physiologic.’ The logic of the first of these statements is difficult to identify given that the very small but sustained daily positive energy balance required for weight gain can occur through either an increase in EI or a fall in EE. The second statement is simply an opinion unsupported by argument.
Further insight into the arguments presented by Swinburn et al. (Reference Swinburn, Sacks and Lo54) is indicated by subsequent applications of their lnW ∝ lnEI relationship (the log-transformed reverse of the EI ∝ W relationship shown in Fig. 3), in an attempt to identify the mechanism of weight gain with one study involving the UK(Reference Scarborough, Burg and Foster61). This study is quoted in their Lancet paper (Swinburn et al. (Reference Swinburn, Sacks and Hall18)) as one of ‘several studies [which] have tested the hypothesis that increases in the food supply are the dominant drivers of the weight gain in populations … and … more than sufficient to explain … most of the weight increase in the UK since the 1980s’. In this study the authors examine the actual weight gain reported by NDNS surveys in the UK between 1986 and 2000 and compare this with predicted weight gains. This prediction is made with their inverted log-transformed regression (lnW ∝ lnEI) and food EI measured over this period. They identify a number of different measures of food EI and choose values indicating an increase (FAO food balance sheet data indicating food supply at a national level adjusted for wastage). They predict weights from the EI, showing them to be lower than observed weights (by about 20 % for men and 40 % for women). However, they focus on the calculated weight gains that are lower than observed values for men (4·7 v. 7·7 kg) but slightly higher than observed values for women (6·43 v. 5·4 kg). They conclude that in men the lower than predicted weight gain shows that weight gain was due to both increased EI and decreased physical activity. However, for women they argue that ‘an increase in total energy intake was sufficient to explain the increase in body weight over this time period’. In another similar study they undertake the same calculations of weight changes from changes in EI in the US population and come to the same conclusion that increased food energy supply is more than sufficient to explain the US epidemic of obesity(Reference Swinburn, Sacks and Ravussin62). Is it sensible to assume that it is possible to identify the aetiology of weight gain in terms of gluttony or sloth from calculations such as these?
The authors argue(Reference Swinburn, Sacks and Ravussin62) ‘…the relation between energy flux and body weight … is assumed to apply to the US population over the time period studied. The multicountry data used to generate those equations suggests that this positive relation between energy flux and body weight is applicable across populations.’ In fact, as shown in Fig. 3, their equation describes the EE–W relationship for adults of increasing W with a more or less constant level of physical activity (PAL about 1·7) and will only accurately predict W from EI for such a population group. Because with their equation the recorded EI values predict much lower than observed body weights, especially for the women, either the equation is inappropriate (i.e. actual PAL values are < 1·7, especially for women, and vary between 1986 and 2000), or the EI values are underestimates of true food intakes. Either of these explanations could be true and cannot be discriminated between, so that the exercise itself seems of dubious value.
Secondly, and crucially, these authors were only able to develop their arguments by their choice of EI data which increased between 1986 and 2000. As they discuss, EI recorded by the NDNS or by the National Food Survey (NFS) fell over this time period, so their equation would have predicted a fall in body weight and the weight gain would only be explainable in terms of an even greater fall in physical activity. Clearly, as they argue, measurement of food intake by the various methods available is fraught with difficulty and their criticisms of both the NDNS and NFS are valid but few would invest the FAO food supply data with sufficient accuracy to warrant the sort of exercise described by these authors even if the methodology were sound.
There is a place for very simple modelling of likely changes in EE/EI as a function of change in weight and lifestyle to test the likely accuracy of reported levels of UK food intakes. This is discussed further below. However, it is arguable that DLW measurements of EE are unlikely in themselves to answer the key gluttony v. sloth question about causality for two reasons. One is the problem posed by weight change in interpreting changes in DLW-derived PAEE and this is discussed below. The other is that, because the very small positive energy balance required to initiate weight gain can occur through any combination of changes in EI or EE which results in EI>EE, a DLW measurements of EE is unlikely to indicate which of these changes has occurred. The DLW measurement indicates the amount of EI required to balance EE during weight stability, i.e. the mean EE for a short time period (usually 2 weeks) and is not a true measure of EI during the measurement period (or at any other time). It is only a proxy for habitual EI if two caveats are observed: (1) subjects are in energy balance during the measurement period; and (2) physical activity behaviour during the measurement period is the same as habitual behaviour. For the first of these caveats, only precise measurement of weight and/or body composition change or EI over the period would inform on whether EI differed from EE (if such measurements were possible). Because subjects may be advised to maintain stable weight, or may do this consciously or unconsciously by changing EI, during the DLW measurement period EI may differ from habitual EI. As for the second caveat, EE is known to vary over time because behaviour is not constant. Within-subject repeated measurement of EE by DLW showed a CV of 12·6 %(Reference Luke, Dugas and Ebersole50), with some individuals exhibiting EE in the second measurement of only 50 % of the first, albeit with at least 1 year between measurements.
Body weight influence on physical activity energy expenditure and physical activity behaviour
A surprising feature about the DLW database is that there is no evidence of a fall in PAL with increasing obesity, up to quite high levels. This is the case for both the US DRI dataset(57) and that used to define the UK DRV(39, Reference Tooze, Schoeller and Subar58, Reference Moshfegh, Rhodes and Baer59). The distribution of PAL values according to quartile (Q) of BMI within the latter dataset is shown in Table 1. PAL values for Q4 (mean BMI: women, 33·1 kg/m2; men, 32·2 kg/m2), range from 1·28 to 2·15 kg/m2 with a median value of 1·63 kg/m2 similar to that of BMI Q1 (mean BMI: women, 21·4 kg/m2, men, 22·9 kg/m2). Similarly, in a small group of Dutch adults (n 40; BMI = 24·3 (range 19–31) kg/m2) there was no relationship between PAL and BMI(Reference Westerterp and Plasqui53). This is contrary to the common perception of increasing sloth amongst the obese. Although this indeed appears a conundrum, DLW-measured PAL values are in fact seriously limited as predictors of actual physical activity behaviour. This is because of two potential difficulties. The first is what PAL represents and whether it can or should be corrected for body weight. The second is how it relates to actual behavioural changes when W is changing.
Physical activity values of adult men and women according to BMI*

PAL, physical activity level; PAEE, physical activity energy expenditure; Q, quartile; DLW, doubly-labelled water; EE, energy expenditure.
* Data from the combined DLW adult dataset compiled by the Scientific Advisory Committee on Nutrition(39) from Tooze et al. (Reference Tooze, Schoeller and Subar58) and Moshfegh et al. (Reference Moshfegh, Rhodes and Baer59).
† PAL = EE/BMR.
‡ PAEE = 0·9 × EE − BMR.
What does physical activity level represent and should it be corrected for body weight?
In the factorial model in which EE is expressed as PAL × BMR, it has been implicit that the BMR component captures the weight, age and sex dependence of EE, with PAL a measure of PAEE independent of these variables. However, the relationship between PAL, PAEE and body weight is quite complex for a number of reasons. Some of the complexity is mathematical relating to PAL as a ratio (EE:BMR) and PAEE as an absolute value. In this case, of minor importance is the fact that because PAL describes all EE above the BMR, its physiological relationship with PAEE is not exact because of the inclusion of thermogenesis within PAL but not in PAEE. Dietary induced thermogenesis (DIT) is the main component of thermogenesis and is often assumed to be 10 % EI, i.e. 10 % EE at energy balance. Thus PAEE can be adjusted for DIT as PAEE = 0·9 × EE − BMR. At low PAL values (PAL ≤ 1·4), DIT accounts for about 50 % of PAL (i.e. the extra EE above BMR), falling to ≤ 25 % at high PAL values ( ≥ 2·0). This means that PAL increases less steeply than absolute PAEE and this effect becomes more marked with increasing size. Furthermore, and independent of this effect of DIT, PAL as a measure of absolute PAEE is not independent of W. This is because the PAEE represented by a PAL value will increase with W or conversely the effect of a fixed amount of PAEE on PAL gets smaller as size increases. The reason is that the increase in BMR with size contributes to both the numerator and denominator in the PAL calculation but PAEE contributes only to the numerator. In other words, to maintain a constant PAL with increasing size, PAEE would need to increase in proportion to the BMR. This effect is not large but does explain why for the population group shown in Table 1, the modest (but significant) increase in PAEE with BMI group (Q4/Q1 = +12 to 18 %) is not observed for PAL (Q4/Q1 = − 2 to +2 %).
A second complexity in the PAL–PAEE relationship is physiological. Clearly, size does influence absolute strength and the consequent ease of strength-requiring tasks as well as the energy cost of weight-bearing activities. It was shown some years ago that the PAL value associated with a fixed programme of work does increase with W(Reference Haggarty, Valencia and McNeill63). This means that any discussion of relative PAL of the obese compared with lean populations needs to consider a correction for size. In fact, first-principle considerations indicate that the relationship of PAEE with W is complex. It is a function of both the proportion of PAEE that is weight-bearing such as stair climbing (which varies directly with W), as opposed to weight-independent activities such as cycling (with a minimal dependency on W). It also depends on the extent to which changes in W that influence body composition and shape influence the mechanical efficiency of external work done. A variable component of PAEE is spontaneous physical activity (SPA; fidgeting and miscellaneous non-planned activity), which can be substantial (for example, 100–800 kcal/d (420–3350 kJ)(Reference Zurlo, Ferraro and Fontvielle64) or>30 % of EE(Reference Thomas, Martin and Heymsfield65)). Because the extent of SPA is an individual behavioural phenotype(Reference Snitker, Tataranni and Ravussin66), with low levels predisposing to obesity, the possibility of a reducing SPA with increasing size is another complicating factor in relation to correcting PAEE for size. In fact, it has been argued that it may not be possible to adjust PAEE for size with any confidence and that great caution must be exercised when attempting to do so(Reference Prentice, Goldberg and Murgatroyd67). In 12-year-old girls the energy cost of walking at fixed speeds increased with body weight, especially at higher walking speeds(Reference Spadano, Must and Bandini68). In these latter studies MET values (EE/RMR) for walking at a 10 % incline at 4·8 mph for girls of 50 kg was about 40 % higher than girls of 30 kg, an increase which is obviously less than the 66·6 % difference that would have occurred if the MET values were simply corrected by weight. In Table 1 after a simple adjustment of PAEE for size assuming all PAEE is weight bearing, i.e. PAEE/BMI, PAEE falls with increasing size by 25 % in women and 21 % in men (Q1 to Q4). However, if PAEE represents a mix of activities so that the appropriate exponent of BMI is 0·5(Reference Prentice, Black and Coward49), the fall in PAEE is much less. This means that in the population, PAEE may fall with increasing obesity but the extent is difficult to identify. However, inspection of Fig. 4, showing PAEE for an adult urban population corrected for size assuming it is all weight bearing (i.e. PAEE/BMI), indicates that with increasing BMI in both men and women there is still a very wide range of PAEE/BMI values within the overweight and obese range up to BMI values of 40 kg/m2, with BMI explaining only 4–7 % of the variance. In fact, the apparent decline in PAEE with increasing BMI is still less than might be expected, i.e. a fall of about 50 % over a BMI range from 18 to 50 kg/m2. This raises the second major problem in interpreting DLW measures of physical activity in terms of PAL or PAEE values: their ability to quantify physical activity changes in terms of behaviour.
Physical activity energy expenditure (PAEE) for an adult urban population corrected for body weight as a function of increasing size. Linear regressions shown are for men (■, —, r 2− 0·040, P≤ 0·0001) and women (○, - - -, r 2 0·066, P≤ 0·0001), and indicate that over a BMI range from 18 to 50 kg/m2 PAEE corrected for size falls on average by 50 % for men and women. PAEE (0·9 × total energy expenditure − BMR) is corrected for body weight (BMI) assuming it is all weight bearing. (Dataset compiled in Scientific Advisory Committee on Nutrition(39) from Tooze et al. (Reference Tooze, Schoeller and Subar58) and Moshfegh et al. (Reference Moshfegh, Rhodes and Baer59)).

How is physical activity level related to actual behavioural changes when body weight is changing?
PAEE behaviour can be measured by accelerometry with devices that assess movement in several spatial directions and there is a literature which clearly shows a mismatch between such measurements and EE per se. For example, Table 2 shows the results reported in a comprehensive study of lean (BMI 22 kg/m2) and obese (BMI 36 kg/m2) 18-year-old adolescent boys and girls(Reference Ekelund, Aman and Yngve69), in which PAEE was calculated from DLW measurements of EE and by accelerometry. Physical activity measured with the accelerometer and uncorrected for body weight was lower in obese adolescents (by 24 % in boys and 37 % in girls) than in the age-, sex- and education-matched control lean subjects, whereas PAEE did not differ significantly between the groups and PAL values were only 6–8 % lower. In fact, when the accelerometry counts are expressed in relation to DLW-derived PAEE (the energetic intensity of the movement, counts/MJ of PAEE), physical activity was considerably lower in obese boys and girls, at 62–72 % of the lean controls. In terms of simple correction for body weight, the observed fall in DLW-measured PAEE/kg (31–38 %) is only about half of the fall in this behavioural measure of activity as accelerometry-measured counts/kg (50–62 %).
Physical activity values of lean and obese 18-year-old boys and girls measured by doubly-labelled water (DLW) and accelerometry*

PAL, physical activity level; PAEE, physical activity energy expenditure; EE, energy expenditure.
* Data from Ekelund et al. (Reference Ekelund, Aman and Yngve69).
† PAL = EE/RMR. EE measured over 15 d by DLW. RMR measured by indirect calorimetry.
‡ PAEE = 0·9 × EE − RMR.
§ Mean of 14 d value.
Studies such as these show that not only is physical activity behaviour a different measure compared with PAEE derived from DLW measures as might be expected, but that in terms of the current gluttony v. sloth debate, DLW data, by far the major source of information informing the current debate, are inadequate as a measure of actual behavioural changes associated with weight gain. Direct measurements of PAEE by tri-axial accelerometry during 1 week in free-living overweight men and women in the Southern USA show that 95 % of their active time is spent in low-intensity PAEE, suggesting a sedentary lifestyle. Importantly, the amount of free-living PAEE negatively correlated with body fatness to the extent that in age- and sex-adjusted multiple regressions, average and maximum weekday PAEE explained 29–32 % of the variation in body fat(Reference Buchowski, Acra and Majchrzak70). Such information and that shown in Table 2 clearly indicate that physical activity behaviour is markedly reduced in the obese in line with common experience, with the latter study showing that such changes can contribute to obesity.
In the case of DLW studies limited to predominantly lean population groups, the difficulty of assessing the physiological implication of varying PAL values does not arise. There are several reports of DLW-determined values for PAL in lean population groups in non-industrialised societies living subsistence lives, who can be expected to expend high levels of PAEE: i.e. Gambian agriculturalists measured during harvesting season (PAL = 2·4)(Reference Heini, Minghelli and Diaz71) and Bolivian Aymara men measured during pre-harvest season (PAL = 2·0)(Reference Kashiwazaki, Dejima and Orias-Rivera72). One important study has investigated the Hadza, a population of hunter–gatherers in Northern Tanzania in terms of both DLW measures of EE and estimates of walking distance(Reference Pontzer, Raichlen and Wood73). The men of this latter group walked on average 11·4 km/d, were lean (BMI 20·3 kg/m2) and exhibited mean PAL values of 2·26 (n 13; range 1·67–2·96). In contrast, the women who were also lean (BMI 20·2 kg/m2), walked half the distance of the men (5·8 km/d), with lower PAL (1·78; range 1·44–2·53). Also studies of lean UK subjects with high levels of leisure physical activity have been shown to have PAL values that are consistent with their activity(Reference Davidson, McNeill and Haggarty74). For this group of healthy lean men (BMI 21·6 (sd 1·5) kg/m2, age 38 (sd 9) years), with sedentary jobs but most of whom (seven out of nine) reported active leisure activities, the active men exhibited high PAL (mean 2·12; range 1·79–2·41) and for competitive runners in training, mean PAL was 2·2 (range 2·02–2·41). Thus, the interpretation of DLW data on its own only becomes difficult when the subjects under study include a wide range of body weights. An example is a small DLW study of the Yakut (fourteen men and fourteen women), an indigenous high-latitude Siberian group, who rely on a mixture of subsistence activities, government wages and pensions, private-sector salaries and ‘cottage’ industries(Reference Snodgrass, Leonard and Tarskaia75). Subjects for the study were recruited to include both lean and overweight subjects, so that BMI ranged from 18·3 to 36·8 kg/m2 for men and from 16·0 to 43·5 kg/m2 for women. PAL values indicate only modest activity: i.e. for men, 1·68 (range 1·34–2·25); and for women, 1·50 (range 1·24–1·91). This suggests a relatively sedentary community. However, whether the sedentary nature of the group studied can be causally related to the presence of obesity in this community is difficult to judge from this small sample because although individual behaviour was assessed, any relationship of this with BMI was not reported. Although PAL tended to be higher for those with more traditional lifestyles, this relationship was only marginally significant.
Changes in food intake in the UK
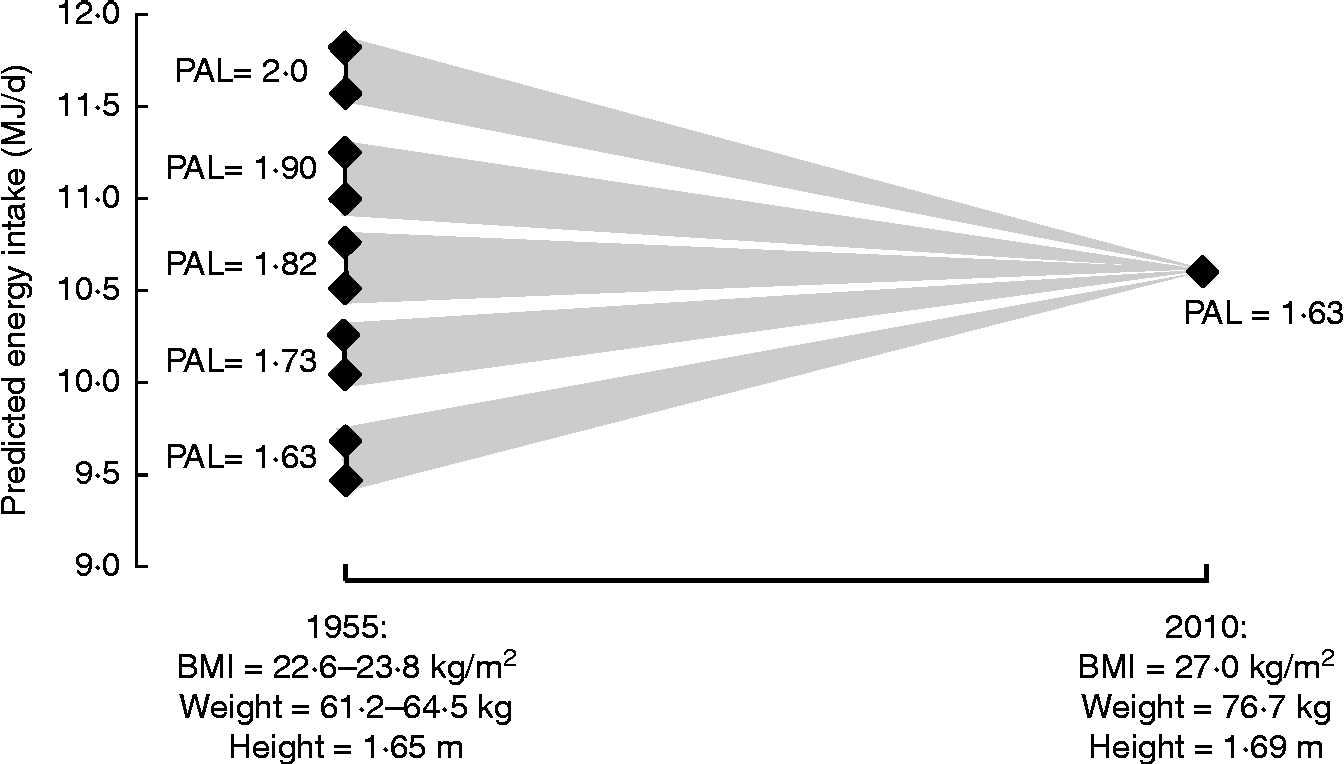
As already indicated, although DLW measurements of EE are often used as a proxy measure for EI, there are limitations on what such data can tell us. In any case, population-based DLW data are themselves very limited. Nevertheless, knowledge of the likely range of DLW-derived PAL values allows expected rates of EE to be predicted for population groups on the basis of BMR calculated from weights and heights, and such values can be usefully compared with food EI measurements to provide a measure of their likely accuracy. For example, Table 3 shows such predicted EE/EI data for the adult current UK population; the median value is 10·7 MJ/d for men and women combined, with the value for men (11·97 MJ/d) 28 % higher than for women (9·37 MJ/d) at the same BMI because of the higher height, body weight and BMR for men. Such predictions also allow modelling of the likely change in EI during the time that obesity has developed in the UK from 1955, the year after wartime rationing ended, to the present day. National statistics on weights and heights or BMI are scarce for that period but national data are available for men and women of varying age groups in 1943 (mean BMI 22·6 kg/m2) and for male industrial employees for 1960 (BMI 24·2 kg/m2) and for similar females for 1971 (23·4 kg/m2)(Reference James3, Reference Khosla and Lowe4), i.e. a mean BMI of 23·8 kg/m2. On this basis a likely mean all-adult weight can be estimated from assumed mean heights and the corresponding mean BMR can be calculated. By assuming various initial PAL values, likely changes in food intake balancing predicted rates of EE between 1955 and 2010 can be calculated at least for the adult population, and Fig. 5 shows such modelling. Initial population PAL values have been chosen to range from 2·0 (very active), to the currently assumed value of 1·63, calculated in each case for the likely minimum and maximum initial body weights. If the initial PAL were 1·82 the fall in PAEE to the current value would match the increasing BMR associated with the weight gain and predicted EI does not change. However, predicted food EI would increase for initial PAL values < 1·82 or decrease for PAL values>1·82.
Food energy intakes necessary to match expected rates of energy expenditure of the current UK adult population

Likely changes in food intake balancing various predicted rates of energy expenditure from 1955 to current 2010 assumed population values. Predicted rates of energy expenditure for 1955 are BMR × physical activity level (PAL), with the PAL values ranging from very active (2·0) to the currently assumed population value of 1·63. BMR is predicted for adults (men and women) at the likely range of BMI values (22·6 and 23·8 kg/m2; see text), equivalent to weights of 61·2 and 64·5 kg at mean heights for men and women combined to be 1·65 m. This latter value is 3·9 cm less than current values, assuming that over the 55 years there has been a steady increase in height at the rate reported for England between 1993 and 2010(2). BMR is the mean of values calculated separately for men and women with the Henry prediction equations for weight and height(Reference Henry60). The value for 2010 is the all-adult 16–75+ years population value shown in Table 3.
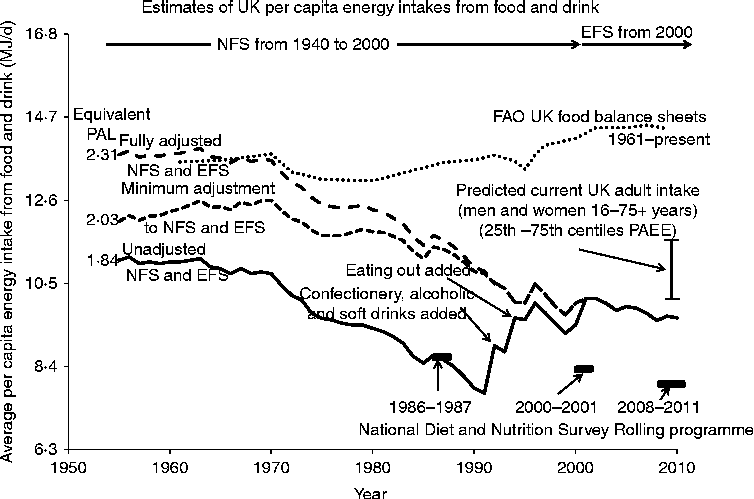
There are three types of estimate of food EI for the UK and information on all three is shown in Fig. 6. The FAO compiles data on national food balance sheets, converted to per capita overall food energy supply(76). These data show little change between 1961 and 1990 (at about 13·4 MJ/d per capita) but after this intakes increase, by 5 % to 2000 and by a further 2 % to 2009 to reach 14·3 MJ/d.
Various estimates of food energy intakes for the UK since 1955. Estimates of actual food consumption is reported by the FAO(76) as per capita food energy supply estimated from national food balance sheets (supply, production, imports used for human consumption, after adjusting for food exports, livestock feeds, seed uses, losses during storage and transportation). Values have been reported since 1961. Household food purchases have been recorded in the National Food Survey (NFS) from 1940 to 2009 followed by the Expenditure and Food Survey (EFS) from 2001(77). The EFS is a 2-week diary record of all expenditure by each household member over the age of 7 years. Confectionery, alcoholic drinks and soft drinks brought home were only included from 1992 and eating out was added for the first time in 1994. The data are shown as unadjusted (i.e. as reported) and adjusted either minimally or more fully as described in the text so that the pre-1994 NFS data become comparable with those recorded in the EFS. Directly measured individual energy intakes are reported in the National Diet and Nutrition Survey for 1987–1988(Reference Gregory, Foster and Tyler79), 2000–2001(Reference Henderson, Gregory and Swan80) and for 2008–2011(81) when the survey has operated as a continuous rolling programme. PAL, physical activity level; PAEE, physical activity energy expenditure.
The second source of dietary EI data is the long-term record based on household food purchases that started in the UK in 1940. The data were recorded initially in the NFS although the sampling only became a complete cross-section of the British population from 1950. The NFS was changed in 2001 by merging with the Family Expenditure Survey to form the Expenditure and Food Survey (EFS), with the food expenditure module published from 2002 as Family Food. The EFS is a 2-week diary record of all expenditure by each household member over the age of 7 years, i.e. 12 196 individuals within 5263 UK households in 2010. The main feature of these records has been a steady decline in food EI. A recent 2010 report(77) stated: ‘A reduction of 0·5 per cent in 2010 reaffirms the downward trend in energy intake. Energy intake was 1·2 per cent lower in 2010 than in 2007. On the basis of the analysis reported in 2010 the average energy intake per person from food and drink declined by 28 per cent between 1974 and 2010.’ Exactly how this latter change is calculated is not clear in the report, but in any case these food records require careful examination. The reported per capita values (total purchases/number in household) involve several assumptions, including within-household share, so that demographic changes in household composition could influence the trend. However, a statistical analysis in the 1998 report(78) showed that between 1974 and 1998 the fall in recorded EI was apparent for men and women at most ages, although at a lower rate for the very young and old. The main difficulty in analysing long-term trends is that the basis of estimation of EI has evolved and changed over the years. Thus, confectionery, alcoholic drinks and soft drinks brought home were only included from 1992 and eating out was added for the first time in 1994, with reliable data available from 2001 within the EFS. Also in a recent Family Food report(77), intakes recorded by the EFS are said to be more accurate than estimates of household purchases in the NFS because of an improved methodology including basing household food purchases on till receipts which is assumed to reduce under-reporting error. In addition, in Family Food reports up to 2008 an allowance of 10 % was made for wastage. Because of this in the 2010 report, earlier NFS values, from 1974 to 2000, were corrected and scaled up (on average by +8·3 %). Fig. 6 shows the original unadjusted values from 1955, the first full year after post-war rationing ended in 1954, with step increases occurring with each of the two above-described additions in 1992 and 1994, and with the change to the EFS in 2001. Fig. 6 shows two approaches to the adjustment of pre-2001 values to take into account the changes in methodology. Firstly, for both approaches the scaling applied to historical estimates of household purchases in the NFS from 1974 to 2000, to align with the more accurate intakes recorded by the EFS, has been applied to earlier values, from 1955 to 1973. Secondly, estimates of confectionery, etc., and eating out have been added to pre-1992 and -1994 values. To obtain a minimum initial estimate of the latter two additions, it has been assumed that the values increased linearly from zero in 1955 to an amount in 1991 for confectionery, etc. which is the mean of the values recorded in the NFS between 1992 to 2000, and to an amount in 1993 for eating out which was the mean of the recorded values for eating out as measured in the EFS (2001–2010), considered the best estimates. To obtain a most likely ‘fully adjusted’ estimate of the effect of these latter additions, it is assumed that initial purchases of confectionery, etc. in 1955 were half current estimates and increased linearly to the mean of the values recorded in the NFS between 1992 to 2000. For food consumption outside the home it is assumed that the extent of this was similar to current recorded values so that the mean value was added in all years before their measurement. On this basis, per capita EI in 1955 were 11·03 MJ/d unadjusted, 12·0 MJ/d minimally adjusted or 13·7 MJ/d fully adjusted. These 1955 intakes either remained flat or increased slowly until 1970 after which they decreased more markedly to the present. This indicates an overall fall from 1954 to 2010 by 1·46 MJ/d (13 %) in the unadjusted data, or by between 2·43 MJ/d to 4·1 MJ/d (20 % to 30 %) after adjustment.
The third estimate is the measured EI reported in the NDNS. This is reported for 1987–1988(Reference Gregory, Foster and Tyler79), 2000–2001(Reference Henderson, Gregory and Swan80) and for 2008–2011(81) when the survey has operated as a continuous rolling programme. There is a downward trend in the mean reported daily intakes for total energy for adult men and women for the three reported values: i.e. 8·37, 8·29 and 7·86 MJ/d. The earliest value closely corresponds to the unadjusted NFS values but the two subsequent values are very much lower than food supply values and lower than the food purchase values.
All of these values for estimated food EI shown in Fig. 6 can be compared with predicted current values of food EI from Table 3, shown in Fig. 6 as a range of all adult values from the less active 25th centile (PAL = 1·43; 9·76 MJ/d), to the more active 75th centile (PAL = 1·78; 11·65 MJ/d). Also on the basis of BMR values predicted from the higher of the two assumed 1955 body weights shown in Fig. 5 (64·5 kg) the 1955 EI can be expressed as mean PAL values for matching rates of EE of adult men and women. Given that the household data relate to an average household individual (children, adults and the elderly, with a mean value of 2·32 individuals/household for 2010), the actual mean body weight will be slightly lower than the assumed value, the 1955 predicted PAL value equivalents of the intakes are slight underestimates while the 2010 predicted intakes are slight overestimates.
It is clear that there is a considerable mismatch between overall food supplies to the population and expected individual food energy consumption, i.e. food supply values currently markedly overestimate actual EI. The largest component of this mismatch is undoubtedly food wastage. This occurs before individual purchase, especially during packaging and supply to supermarkets, within supermarkets for limited shelf-life foods, and after purchase within the home. In the USA, the US Department of Agriculture assumes about one-third is wasted(Reference Hall, Guo and Dore82). While various estimates of wastage in the UK are quoted, actual values are not known with any precision. One recent reliable estimate of household food and drink waste for the UK in 2009(83) was 8·3 (sd 0·3) million tonnes per year, i.e. about 14 % of the FAO food supply (about 60·4 million tonnes/year)(76) (although the most recent information suggests that domestic food wastage is starting to fall in association with rising food prices and an economic squeeze(84)). Assuming similar food wastage before purchase during sorting, packaging and processing and through shelf life expiry at the retail level, then total UK wastage could be similar to that in the USA, and entirely account for the>30 % overestimate. More importantly in the present context, because of the changes in patterns of food processing, distribution, purchase and consumption since food balance sheet data became available in 1960, wastage has almost certainly increased, as in the USA(Reference Hall, Guo and Dore82). This may well account for the rising UK food supply trend in recent decades. Indeed, the earliest food supply data for the 1960s may have been much less subject to wastage given that food purchase was largely from small local grocery shops and markets, consumption of ready meals was much less, and shelf life had not become an issue.
As for the declining food purchase EI trend shown in Fig. 6, if there is an increasing domestic wastage trend, in excess of the 10 % already assumed in this survey, this would mean that the true trend was an even greater fall than indicated so that current EI estimates in the EFS would be lower than the values shown. In this case they would be too low. It may be that for subjects within the survey, wastage is much less than usual because of a behavioural change induced by participation in the survey and that the assumed 10 % is a reasonable estimate. However, some under-reporting is to be expected and if this increased with time this could account for the declining trend. Family Food states: ‘Under-reporting is a problem with all dietary surveys but is considered to be lower in the Family Food Module. Its focus on all expenditure with most food items collected from till receipts reduces the scope for under-reporting of household purchases.’(85) As it stands, the actual current recorded EFS intake value of 9·58 MJ/d is 2 % (43 kcal/d; 180 kJ/d) below the lower range (25th centile) all-adult population value of 9·76 MJ/d. However, as already indicated, this is not strictly a like-for-like comparison and because the per capita body weight for the EFS is lower than the assumed adult average, the EFS current recorded EI are not unreasonable. Certainly, the current EFS values are considerably higher than the NDNS values for adults which are physiologically unrealistically low, indicating considerable under-reporting in this survey. Because under-reporting of actual food intakes may be worse for the overweight or obese, especially for energy-dense food and drinks, EI trends as reported by the NDNS may be less reliable than the EFS values.
However, the fully adjusted 1955 values indicate intakes which, when applied to the adult population with body weights which can be assumed for that time, are equivalent to very high levels of physical activity: PAL values of 2·03 and 2·31 for the minimally or fully adjusted NFS intake, respectively, and 1·84 for the 1955 NFS intake without any adjustment. Is a population PAL value of 2 or more at all likely for the UK in 1955? While it is undeniable that lifestyles and occupations were quite different from those of the modern day, and while there are arguments in the literature that increasing leisure activity has more than compensated for changes in transport and occupational activities, there is simply not enough information to allow any sensible prediction of the magnitude of likely differences. As indicated above, few DLW studies have reported mean PAL values of 2 or more and such values represent the top 10 % of observed PAL values within DLW datasets relating to current population groups. Thus, within the Scientific Advisory Committee on Nutrition (SACN) adult DLW dataset, of those within the normal body weight range (n 322; mean BMI = 22·7 kg/m2, similar to the assumed 1955 value used in the calculations in Figs. 5 and 6), for whom PAL values were at or above the 90th centile value of 1·95 (n 35), the mean PAL was 2·08 (range 1·95–2·37). However, there is no information about the lifestyles of this very small subgroup. In the meta-analysis of all reported DLW studies, of which PAL values for industrialised countries are shown in Fig. 2(Reference Dugas, Harders and Merrill51), of the studies showing study mean PAL values ≥ 2·0 (n 15; six women and nine men), three were from low or moderate developed societies, seven were overweight or obese, all were aged less than 65 years and most studies were very small (median n 8). However, as indicated above, PAL values in excess of 2·0 were recorded in DLW studies of lean adult subjects in which either sedentary jobs were accompanied by high leisure activities(Reference Davidson, McNeill and Haggarty74), or who exhibited high activity lifestyles (African(Reference Heini, Minghelli and Diaz71) or South American farmers(Reference Kashiwazaki, Dejima and Orias-Rivera72)) or African hunter–gatherer men(Reference Pontzer, Raichlen and Wood73) for whom walking long distances was recorded. Thus a population PAL for the UK in 1955 considerably higher than currently assumed values is certainly possible. It seems unlikely that food wastage was significant at that time and was inflating the unadjusted NFS estimate. The additional 2·64 MJ added within the full adjustment includes 0·91 MJ for scaling, 1·16 MJ for eating out and 0·55 MJ for confectionery, soft drinks and alcohol, values which are not unreasonable although there is considerable uncertainty with each of these estimates, the extent of which is largely unknowable.
Can any firm conclusions be drawn from these data? Notwithstanding the considerable effort and expense put into the collection of the data, none is entirely satisfactory. However, assuming that the NFS/EFS trends are the best indicator for the UK, it would appear that food EI may have changed minimally before 1970 but has fallen steadily since, with a downward trend continuing in the most recent surveys. The data shown in Fig. 6 were compiled on the basis of reports up to 2010. The recently published 2011 Family Food report(84) confirms the downward trend stating: ‘There was a statistically significant reduction in energy intake from household food and drink in 2011 which is consistent with the longer term decline in energy intake from food and drink since the mid 1960s.’ Whilst there are many potential inaccuracies in these data it is quite unlikely that they could be sufficiently large as to conceal an increase. Thus on the evidence of these data a simple gluttony without sloth explanation of the obesity epidemic is not supported.
Direct evidence of physical activity–weight gain interactions
Implicit to the Swinburn ‘tipping point’ model(Reference Swinburn, Sacks and Hall18) is that the reducing physical activity before the tipping point drives a matching fall in EI, i.e. appetite regulates energy balance when the diet is favourable (i.e. a low-fat, low-sugar diet as assumed for the pre ‘tipping point’ period). When the diet is unfavourable after fats and sugars increased to initiate the ‘tipping point’, appetite ceases to regulate energy balance, with weight gain acting as the ‘mechanism’ to restore energy balance through increased EE. Whilst this latter teleological description of weight gain is debatable, the role of appetite in first regulating and then failing to regulate energy balance in this way is not implausible. The difficulty is that current understanding of the interaction between physical activity, dietary composition, dietary EI and energy balance is by no means clear.
Within the Foresight programme, Wareham(Reference Wareham45) summarised his previous review of the evidence base relating physical activity and obesity prevention(Reference Wareham, van Sluijs and Ekelund86) which had concluded that the ecological evidence for the increasing obesity prevalence to have occurred simultaneously with reductions in physical activity was rather limited. This reflected the limited validity of measures of total energy expenditure calculated from self-report data as used by the main source of information for the UK, The Health Survey for England (HSE)(2). As with the household food survey methodology described above, the HSE questions on activity have changed over time, adding to the uncertainty in concluding that the reductions in physical activity indicated by proxy domain-specific measures (car ownership, household mechanisation, TV viewing, distance children walk per year and employment in physically demanding occupations) have resulted in actual overall reductions in the totality of physical activity. Clearly, studies involving objectively measured physical activity are likely to be more reliable although there are no such data relating to the whole period under discussion here. Thus, the objective data are either cross-sectional or prospective in terms of short time periods of a few years.
Cross-sectional studies clearly show that lower levels of physical activity are related to a higher risk of obesity in children, adolescents(Reference Jiménez-Pavon, Kelly and Reilly87) and adults(Reference Wilks, Besson and Lindroos88). However, cross-sectional studies are clearly limited in identifying the causal direction of the relationship between physical activity and obesity, which is a real problem given the likelihood of behavioural changes occurring as a consequence of increasing fatness. In other words, bi-directional causality is highly likely. Prospective studies of physical activity and subsequent weight gain are less susceptible to misinterpretation, and the literature suggests that for adults, although there were mixed findings, overall the expected inverse association between physical activity and subsequent weight gain was found although the magnitude of the effect was small(Reference Wareham, van Sluijs and Ekelund86). Similarly for children the expected relationship was found in some but by no means all studies, and, where found, the measures of association tended to be small. The most recent systematic review of prospective studies of objectively measured physical activity and obesity in children, adolescents and adults(Reference Wilks, Besson and Lindroos88) showed that overall the observational studies show that physical activity is not strongly prospectively related with adiposity. For example, in one study of adults(Reference Ekelund, Brage and Franks89), although baseline PAEE (assessed by heart rate monitoring) did inversely predict change in body fat over 5 years in subjects below the median study age (54 years), albeit weakly (explaining < 1 % of the variance in adiposity), for older subjects, who were on average weight stable, it predicted a higher body weight, fat mass and fat-free mass. It was suggested that physical activity attenuated weight loss and the development of sarcopenia. In a further analysis of this same study in which amount of time spent in the sedentary state rather than total PAEE was examined as a predictor of fat gain at follow up, no significant association was observed(Reference Ekelund, Brage and Besson90). Indeed, the reverse association was observed with initial fat mass predicting sedentary time at follow up. It is the case that the subjects in the second study were a subset (50–57 %) of those in the first study and no attempt was made to separate the younger and older subjects. The authors make no comment about this other than to conclude that these two studies show that sedentary time and PAEE are differently associated with gain in fat mass and may be considered as separate entities in relation to health outcomes.
The studies included in these reviews examined PAEE with a variety of different methodologies, i.e. DLW, heart rate monitoring or accelerometry and, as indicated above (Table 2), they are not always comparable. Also, not all use direct measures of body fatness. Of those studies which used accelerometers in children, The Framingham Children's Study(Reference Moore, Gao and Bradlee91) involved 8 years of activity monitoring by accelerometry from preschool to early adolescence in a small sample of 103 children and showed that those in the highest tertile of average daily activity had smaller gains in body fat assessed from five skinfold thickness measurements. Within a sample of prepubertal American Indian children aged 7·5 years, total activity measured by an accelerometer on 1 d predicted lower percentage fat measured 3 years later if they were normal weight at baseline (n 310) but not in those who were overweight at baseline(Reference Stevens, Suchindran and Ring92). The most recent studies involve continuous monitoring of movement with accelerometers, allowing detailed analysis of both total and intensity of activity throughout the day, and dual-energy X-ray absorptiometry measures of fatness. Two UK longitudinal studies have used these approaches: the Avon Longitudinal Study of Parents and Children (ALSPAC), a large birth cohort study that has reported on 12- to 14-year-old children(Reference Ness, Leary and Mattocks93–Reference Augustin, Mattocks and Cooper95); and the smaller EarlyBird prospective cohort study of 5- to 10-year-olds(Reference Metcalf, Voss and Hosking96, Reference Metcalf, Hosking and Jeffery97).
The initial ALSPAC study(Reference Ness, Leary and Mattocks93) reported a cross-sectional analysis of 12-year-olds (n 5500) showing that MVPA was very strongly negatively associated with fat mass so that the OR for obesity (the top decile for fat mass) for the top compared with bottom quintiles of minutes of MVPA was extremely low (0·03 for boys and 0·36 for girls). Subsequently(Reference Riddoch, Leary and Ness94), 14-year-olds were included, allowing a prospective assessment of their physical activity at age 12 years with their subsequent adiposity at age 14 years. Using multilevel modelling of covariance of the repeated measures of both fat mass and physical activity (i.e. allowing fat mass at age 14 years to be controlled for the confounding effect of fat mass at age 12 years), fat mass at age 14 years was shown to be strongly inversely associated with physical activity at age 12 years for daily total and especially for MVPA in boys and girls. The authors comment that theirs is the only study that has measured both fat mass and physical activity with MVPA objectively in such a large cohort of adolescents (n 2418 at each time point). Although the differences in fat mass between active and inactive children were small (10 %), the results indicate that an increase of 15 min/d in MVPA at age 12 years is associated with a reduced fat mass of about 1 kg at 14 years. This means that for children who meet current health-related recommendations of 60 min of MVPA per d, the observed relationship would predict 4·3 kg less fat mass at age 14 years than children who do no MVPA. The most recent report from this study(Reference Augustin, Mattocks and Cooper95) involves an analysis in which fat mass is modelled as a continuous function of the profile of weekly physical activity rather than specific activity ranges. This indicates that the time spent in moderate and vigorous activity at 12 years of age has a negative contribution towards fat mass at 14 years while the time spent in sedentary and very light activity (i.e. slow walking and similar activities) has a positive contribution.
The EarlyBird study does not find the same predictive influence of physical activity on subsequent fatness observed in the ALSPAC children. In their initial report on 212 children aged 5–8 years(Reference Metcalf, Voss and Hosking96), physical activity was measured annually over 7 d by accelerometry and the children were either categorised into more or less (than the median) active or by time spent meeting the government-recommended activity level of>3 MET. The change in fatness (skinfolds, waist circumference or BMI) over the 3 years was not different between the two activity groups and was not related to the number of minutes spent in activities>3 MET. What was shown, however, was that the higher activity was associated with an improved metabolic score (insulin resistance, TAG, cholesterol:HDL ratio and blood pressure). In a subsequent analysis of the cohort (n 202) between the ages of 7 and 10 years(Reference Metcalf, Hosking and Jeffery97) both total and MVPA and body fat (percentage body weight) were measured annually. Although cross-sectional analyses of either total physical activity or MVPA with fatness showed inverse relationships at each age and when time-lagged by ± 1, 2 and 3 years, when the direction of these relationships was examined in terms of the change in either physical activity or fatness as outcomes, regressed against the other variable as predictor, percentage body fat emerged as the significant negative predictor of the change in physical activity (especially MVPA), not the other way round. Although the significant relationships, when observed, were weak, with percentage body fat predicting < 5 % of the variance in either total physical activity or MVPA, the authors were able to conclude that the inverse relationship between physical activity and percentage body fat is dominated by the impact of fatness on future activity rather than activity on future fatness.
It is not clear why the EarlyBird study did not find the clear influence of higher levels of physical activity on subsequent fatness observed in the much larger ALSPAC study given their similarity in methodologies. The statistical models used in the two studies are not entirely the same and while the former study involved mainly prepubertal boys and girls, puberty was well advanced for many of the ALSPAC cohort, with fat mass decreasing in boys and increasing in girls and with MVPA increasing faster in girls than boys. However, boys and girls exhibited similar influences of baseline total physical activity or MVPA on subsequent fatness. It remains to be seen whether subsequent measurements on these two cohorts continue to identify the different apparent relationships. The most recent ALSPAC study of the cohort up to the age of 15 years has involved dietary studies(Reference Ambrosini, Emmett and Northstone98). These have shown that dietary patterns characteristic of high dietary energy density, a greater percentage total energy from fat and low levels of fibre density, were positively associated with later fat mass. Thus, for this cohort at least both diet and physical activity appear to be involved in the development of fatness. Clearly, much more work is needed in this area.
Conclusions
This focus of the present review, i.e. an examination of evidence relevant to the gluttony v. sloth debate, has been limited to the post-Second World War UK population, at least as far as evidence about the food supply is concerned. The main conclusion is that obesity has developed against the background of a decline in food EI and by implication a decline in physical activity. Thus, this differs significantly from the two-phase ‘energy flipping point’ divided scenario proposed for the USA(Reference Swinburn, Sacks and Hall18). For the UK a post-Second World War ‘eat more, gain weight’ second phase is replaced by a ‘move less–eat somewhat less but still too much’ scenario. In other words, this is a partial failure of the strict appetite regulation which was surmised to match the decline in EI to a declining PAEE in the US pre-Second World War ‘move less, stay lean’ phase(Reference Swinburn, Sacks and Hall18). It might be argued that for the UK the ‘flipping point’ occurred when the level of EE fell below a threshold at which the appetite mechanism starts to fail. However, the extent to which the UK underwent a ‘move less, stay lean’ phase in the first half of the 20th century is difficult to judge because reliable EI or EE data are not available for this period. Also the food purchase EI data shown in Fig. 6 indicate that in 1955 when obesity was beginning in the UK, population activity levels were high. Thus a ‘flipping point’ scenario is highly unlikely.
The UK scenario proposed here in no way downgrades the importance of obesogenic dietary drivers, so that post-war changes in the UK food supply are undoubtedly part of the problem. The difficulty is in identifying how large this part is. From the perspective of a first-principle examination of behavioural influences on the two components of the energy balance equation, EI and EE, it has been pointed out that EI (eating) is 100 % behavioural but for EE, much less than half (PAEE) is behaviour(Reference Caudwell, Gibbons and Hopkins99). Thus it might be thought reasonable to focus entirely on EI. However, such an analysis would ignore the interactive nature of these behaviours. On the one side, physiological control is exerted on eating through the appetite mechanism, the effectiveness of which may vary with overall PAEE and EE(Reference King, Caudwell and Hopkins100). On the other side the existence of SPA, which appears to be phenotypically determined, exhibiting marked inter-individual variability, may account in some individuals for a large fraction of PAEE. Thus, it is by no means clear from first principles which behaviours should be the main focus in seeking to identify causality. What is clear from the evidence reviewed here is that low population levels of physical activity cannot be simply removed from the debate about causality.
The difficulty in accepting a decline in physical activity appears to flow from a misunderstanding of what the DLW database can and cannot reveal. It has revealed a near-complete description of the likely range of sustainable EE for individuals and small population groups and this has proved useful in exercises such as the prediction of population food energy requirements. However, the present review has shown that it is much less good at assessing physical activity behaviour especially within most current population groups which include a majority of overweight and obese individuals. For these groups the lack of any change in the distribution of PAL values or absolute rates of PAEE is almost certainly concealing marked behavioural changes in activities which are revealed by different methodologies such as accelerometry(Reference Spadano, Must and Bandini68, Reference Ekelund, Aman and Yngve69), and are, in fact, easily identifiable if weight-corrected values of PAEE are used instead of PAL. The further development of such methodologies and their application in future DLW studies would markedly improve understanding. DLW data of EE can be used to reveal whether population-based food EI data are sensible and to model EI for specified EE, but their use as a test of the hypothesis that ‘increases in the food supply are the dominant drivers of the weight gain in populations’ is unconvincing.
The reason that the gluttony v. sloth debate is important is that while support for the moderation of gluttony is universal, support for moderating sloth (increasing exercise) has consistently been equivocal. It is certainly the case that physical activity intervention studies in children have generally failed to identify an influence on fatness, in that of the three studies in which physical activity was increased by the intervention only in one was a beneficial influence on fatness identified (see Jiménez-Pavon et al. (Reference Jiménez-Pavon, Kelly and Reilly87)). Although there is longstanding evidence that exercise can improve appetite control by several mechanisms, the efficacy of exercise as a means of weight reduction is regularly scrutinised(Reference Blundell101). Some of these doubts flow from the now well-documented fact that exercise as a means of weight reduction simply does not work for everyone – there is a continuum between responders and non-responders(Reference King, Hopkins and Caudwell102). It is also the case that in many exercise intervention studies the magnitude of the energy imbalance expected from the increased exercise is less than in most EI restriction studies. Thus, in exercise intervention studies reviewed by Thomas et al. (Reference Thomas, Bouchard and Church103) prescribed exercise interventions resulted in median energy deficits of only 0·98 (range 0·2–2·9) MJ/d compared with the 2 MJ/d deficit usually recommended in dietary restriction studies. Also, these authors concluded from their calculations of energy imbalance actually achieved (from body composition measurements) that in many cases EI had increased, reducing the potential for weight and fat loss.
Whatever the efficacy of increasing EE through exercise as a tool in weight management, it is clear that exercise delivers health benefits for both the general population(104–Reference Kohl, Craig and Lambert107) and in children(Reference Metcalf, Hosking and Jeffery97) in terms of improved well being and disease risk reduction. It can also reduce obesity risk especially in those with a high genetic susceptibility(Reference Li, Zhao and Luan108). Indeed, the most recent study of gene–lifestyle interactions has shown that the adverse influence of sedentary behaviour (TV watching) and beneficial influence of increasing leisure-time physical activity appear to have separate influences on the genotypic propensity for obesity(Reference Qi, Li and Chomistek109). This indicates that public health efforts to prevent obesity and related cardiometabolic diseases should include efforts to both increase exercise levels and reduce sedentary behaviours, which would be of particular benefit to those who are more genetically predisposed to obesity. Even non-responders to an exercise-induced weight-loss regimen demonstrate decreased blood pressure, loss of abdominal fat and improved mood associated with improved aerobic fitness(Reference King, Hopkins and Caudwell110). Within a large cohort (about 10 000) of dyslipidaemic veterans, increased fitness was as effective as statins in reducing mortality(Reference Kokkinos, Faselis and Myers111). There are also nutritional advantages of maintaining a higher level of EE and balancing EI in terms of ensuring a healthy balanced diet. It is the case that nutrient requirements are defined in most cases on a body-weight basis so that as energy requirements and matching EI fall, the diet must become increasingly nutrient dense to meet nutrient requirements. This principle has been explored in relation to the adequacy of dietary protein intakes from typical UK omnivore and vegetarian diets for elderly men and women(Reference Millward and Jackson112, 113). If these groups are sedentary, energy needs can become sufficiently low that significant risk of protein deficiency (intakes < requirement) can be identified in terms of protein needs as currently defined, and this principle is likely to be the case for several other nutrients. Thus, as EE and matching EI increase it becomes easier to follow the healthy diet guidelines ensuring both macro- and micronutrient adequacy. In the UK there is clear government advice to increase physical activity(104) but the reason why some individuals are physically active and others not is a complex question which remains poorly understood(Reference Bauman, Reis and Sallis114). At least one report(Reference Dollman, Norton and Norton37) found that young individuals would like to be active but are often constrained by external factors such as school policy or curricula, parental rules in relation to safety and convenience, and physical environmental factors. It is to be hoped that a legacy of the London Olympic Games is to improve the current low proportion of the population which meets such targets(2), not least by reversing some of the declining trends in overall school sports activity(Reference Vasagar115).
Acknowledgements
The present review was supported by a grant from the British Nutrition Foundation. The author thanks Jim Holding of the Department for Environment, Food and Rural Affairs for useful discussion about the NFS and EFS surveys and adjustments of the NFS as shown in Fig. 6, and staff at the British Nutrition Foundation for help with the literature search.
There are no conflicts of interest.