

Introduction
Planetary environments can be placed into one of three categories: (1) uninhabitable environments. These are locations that cannot support the activity of any known organisms and trivial examples would be the core of the Earth or the interior of a neutron star, (2) inhabited habitats. These are locations that can support the metabolic activity of known organisms and contain organisms. Many environments on the surface and interior of the Earth are examples (Odum Reference Odum1971), (3) uninhabited habitats. These are locations that have the energy, carbon source, liquid water and CHNOPS elements to support the metabolic activity of known organisms at a basic level of survival or reproduction, but contain no such life (Cockell Reference Cockell2011, Reference Cockell2014). These third categories are rare on the Earth and are not described in the ecological literature.
One hypothesis for why uninhabited habitats are rare on the present-day Earth is that newly formed habitats are effectively linked with other inhabited locations through the hydrological cycle and atmospheric circulation. For example, this would be the case for organisms that use organics in energy acquisition. Atmospheric circulation transports organic matter, fixed from carbon dioxide in vast quantity by oxygenic photosynthetic organisms (global net primary productivity is estimated at about 1.05 × 10¹⁷ g of carbon fixed per year; Field et al. Reference Field, Behrenfeld, Randerson and Falkowski1998; Raven Reference Raven2009). In newly-formed surface habitats where this organic matter becomes entrained, it can usually be used as an electron donor with oxygen (an electron acceptor itself made widely available by oxygenic photosynthesis) to acquire energy for aerobic respiration.
Beyond the Earth, uninhabited habitats could be more common. They could hypothetically exist on inhabited planets, similar to the Earth, but where a weaker hydrological cycle or inclement atmospheric conditions (such as higher UV radiation on anoxic planets without an ozone shield) reduces the efficacy with which organisms can be transported from an inhabited location to a newly created habitat. They might exist on uninhabited planets, for example on a planet that has habitable conditions, but where life has not originated.
On ancient Mars, uninhabited habitats may have existed in environments such as transient impact-generated or volcanic hydrothermal systems (Cockell et al. Reference Cockell, Balme, Bridges, Davila and Schwenzer2012). On more recent Mars, uninhabited habitats might have been created in places such as impact-melted subsurface permafrost or regions of glacial melting during periods of changing obliquity.
On Earth, studying the rate of colonization of newly formed habitats has significance for understanding how quickly microbial communities become established in newly formed habitable conditions and which organisms take advantage of these conditions. Microbial succession has been studied in a diversity of environments including lava flows and glacial forelands (e.g. Chapin et al. Reference Chapin, Walker, Fastie and Sharman1994; Gomez-Alvarez et al. Reference Gomez-Alvarez, King and Nüsslein2007; Ibekwe et al. Reference Ibekwe, Kennedy, Halvorson and Yang2007; Nemergut et al. Reference Nemergut, Anderson, Cleveland, Martin, Miller, Seimon and Schmidt2007; Schütte et al. Reference Schütte, Abdo, Foster, Ravel, Bunge, Solheim and Forney2010). However, in these cases, we generally do not know when the substrate becomes habitable and to what sorts of organisms. Furthermore, studies of microbial primary succession have not quantified the rate of colonization in the very earliest stages after the appearance of new habitable, but uninhabited substrates.
In this paper, we investigated the rate of colonization of habitable but uninhabited artificial endolithic habitats, which were deliberately designed to be habitable at the beginning of the experiment to a defined group of organisms, thus providing controlled initial conditions that constitute an ‘uninhabited habitat.’ The implications for the exploration of other planetary bodies are discussed.
Methods
Artificial endolithic uninhabited habitats
Artificial uninhabited habitats were fabricated in the laboratory to mimic a rock-based environment for microbial growth (Fig. 1). The artificial endolithic habitats were made such that they contained all of the requirements for the metabolic activity of at least known aerobic respirers and phototrophs, but they were constructed to be sterile.
(a) Schematic of an artificial uninhabited habitat showing its major characteristics. In this work, uninhabited habitats with four (Experiments 1 and 3) and five (Experiment 2) discs were constructed. (b) Photograph of artificial uninhabited habitat (side on view, left; top-down view of nine stacks, right). (c) Schematic representation showing experimental setup described in this paper. The covered stacks were open on the sides to expose them to atmospheric circulation.

The artificial rock substrates were constructed using sintered silica discs (Fig. 1) (Scientific Glass Laboratories, UK), which are manufactured to a known and homogeneous porosity and size. These were considered to be representative of porous silicate rocks such as sandstones, although they can be regarded as a generic rock-like surface for colonization. The discs are 2 cm in diameter and 0.3 cm thick. The size was chosen to allow for easy manipulation. The discs were baked at 500 °C for 4 hours to kill all organisms and volatilize organics so that no organics remained. Four porosities of glass discs were employed in these experiments: porosity 1 (pore sizes 100–160 µm), porosity 2 (40–100 µm), porosity 3 (16–40 µm), porosity 4 (10–16 µm) according to the manufacturer's data (Fig. 2). The pore spaces are connected through the sintered glass fragments that make up the discs (Fig. 2), allowing for the flow of water and microorganisms, although the tortuosity and permeability of the discs are not quantified by the manufacturer.
Secondary scanning electron microscopy (SEM) images of the glass discs used to build uninhabited habitats. The main images show the texture of the discs at the same scale (scale bar 200 µm). The inset images (scales shown) show detail of the pore spaces and silica particles. (a) Porosity 1 (Experiments 1–3), (b) Porosity 2 (Experiment 2), (c) Porosity 3 (Experiment 2), (d) Porosity 4 (Experiment 2).
The sintered glass discs (which are baked silica) lack carbon, nitrogen and sulphur and unlike many natural rocks, such as basalt, are also devoid of phosphorus and trace elements. They are therefore uninhabitable (they cannot on their own, support the activity of organisms). To make them uninhabited habitats for aerobic respirers and some other defined organisms including phototrophs, nutrients were added. Although the sintered glass discs alone would eventually become inhabited by organisms using allochthonous nutrient and micro-nutrients blown and washed into the stacks from the environment, in these experiments we wanted to investigate how quickly a habitat devoid of life, but which starts off as habitable to a defined group of organisms (an uninhabited habitat) would become inhabited.
The discs were soaked in a solution of 0.2% yeast extract (Oxoid, UK) and then dried in a laminar flow hood. Yeast extract is prepared (by the manufacturers) by growing Saccharomyces spp., in a carbohydrate-rich plant medium. The yeast is harvested, washed and resuspended in water, where it undergoes autolysis or self-digestion using the yeast's enzymes. Yeast extract is the total soluble portion of this autolytic action. The autolytic activity is stopped by a heating step. The resulting yeast extract is filtered clear and dried into a powder by spray drying.
CHNOPS elements are provided from the diverse amino acids, carbohydrates and nucleobases present. Trace elements such as iron and magnesium are present (Grant & Pramer Reference Grant and Pramer1962). The yeast provides an energy source in the form of the diverse carbon compounds that can be used in aerobic respiration as electron donors with atmospheric oxygen as the electron acceptor. The uninhabited habitats can also support phototrophs that only require nutrients and no organic supply since they fix CO2 from the atmosphere.
Four sintered discs (Experiments 1 and 3) or five to enhance depth resolution of colonization (Experiment 2) were collected into a stack and held together with 0.5 mm-diameter sterilized steel wire (Chapuis, UK). The different slices are designated depth 1 (for the top disc) to the bottom disc, which was depth 4 for Experiments 1 and 3 or depth 5 for Experiment 2. The sides of the stack were sealed using Dow Corning 732 RTV Silicone Rubber Sealant and the stacks were placed in a laminar flow hood to dry for 12 h. When dry, the uninhabited habitat stacks were placed into sterile 6-well plates until deployment in the outside environment. The experiment was conducted in western Edinburgh at location 55°56′12.0″N, 3°12′31.5″W. When the discs were deployed they were wetted by carefully pipetting 2 ml of ddH2O onto the top of each stack to provide liquid water, thus ensuring that at the start of the experiment the stacks had all the requirements for habitability (Fig. 1).
In Experiments 1 and 3, all uninhabited habitats were made using discs of porosity 1. In Experiment 2, uninhabited habitats were made using all four porosity discs.
Experimental set-up and environmental data
Experiment 1. The purpose of Experiment 1 was to test the hypothesis that rapid colonization of uninhabited habitats would occur within a period of 1 month.
Experiment 1 ran for 1 month (31 days) starting on 4 January 2015. Nine sets of uninhabited habitats were placed into a plastic box with holes in the underside to allow precipitation to drain through the box (Fig. 1(c)). These are referred to as ‘exposed’ stacks. The purpose of these stacks was to expose the uninhabited habitats both to microbial input from atmospheric circulation and input from precipitation such as rain. A further set of nine stacks was placed into a plastic box, which was covered by a ceramic plate with a 5 cm space between the box and the plate. These are referred to as ‘covered’ stacks. The purpose of these stacks was to prevent direct precipitation and atmospheric in-fall and thus test the hypothesis that these factors are a significant factor in colonization. A triplicate set of stacks was removed after day 1, week 1 and month 1 from each of the exposed and covered stacks.
A triplicate set of control stacks for each time point was also maintained in 6-well plates that were sealed with a sterile lid until the time point was processed.
Experiment 2. The purpose of Experiment 2 was to test the hypothesis that different rock porosities would affect the extent of colonization of uninhabited habitats.
Experiment 2 ran for 3 months (91 days) starting on 1 September 2015. Experiment 2 was a repeat of the procedure described for Experiment 1 with three modifications. First, time points were taken at day 1, week 2 and month 3. Second, stacks were prepared using four different porosities of rock designed to mimic differences in natural rock porosities with each stack of a given porosity. Third, five sintered glass discs were used instead of four to increase the data in the process of colonization at different depths. As for Experiment 1, all stacks for each porosity were run in triplicate.
A triplicate set of control stacks for each time point was also maintained in 6-well plates that were sealed with a sterile lid until the time point was processed.
Experiment 3. The purpose of Experiment 3 was to examine the early colonists of the endolithic habitats and to determine whether there were differences between exposed and covered stacks.
Experiment 3 ran for 3 months (91 days) starting on 1 June 2016. The experiment consisted of exposed and covered stacks for each of three-time points (day 1, week 2, month 3). Stacks comprised four discs. Five stacks were used for each time point to increase sample number and maximize the likelihood of extractable DNA. At the end of the experiment, DNA was extracted from each depth in the stacks as described below and the colony-forming units (cfus) were quantified for each stack and depth as described below.
A set of five control stacks for each time point was also maintained in 6-well plates that were sealed with a sterile lid until the time point was processed.
The minimum and maximum air temperature and precipitation data were obtained from the Royal Botanic Gardens weather station, Edinburgh for each day during the experiments.
Quantification of colonization
At each time point, stacks were removed from the site. In a laminar flow hood under aseptic conditions, the individual sintered discs from each stack were separated with a sterile blade. Each sintered disc was gently broken up into ~3 mm diameter fragments within a sterile aluminosilicate mortar and pestle. From the crushed fragments, 0.3 g was separated and 0.6 ml of sterile ddH2O was added. These fragments were further gently crushed into a fine powder. From this slurry 50 µl was removed using a pipette with a pipette tip from which the end had been cut off to create a wider bore (to prevent blockage). This material was transferred onto a 0.2% yeast extract agar plate (2% Bacteriological Agar number 1, Oxoid). Plates were incubated at 21 °C for 7 days. Colonies were enumerated irrespective of colony morphology or colour and used to extrapolate an estimate of the total number of cells capable of growth on yeast extract agar in the disc. The process was carried out for the discs at each depth and for all of the stacks. Yeast extract was used because that was the organic source in the uninhabited habitats when the experiment was started. We were interested specifically in determining when the habitat becomes colonized by this specific group of organisms for which habitable conditions at the start of the experiment had been defined.
In Experiment 1, the cultivable diversity was also estimated by counting the number of different colonies (morphology and colour).
In Experiment 1, the total number of cells was also determined. To estimate total disc cell number, cells were stained with SYBR Gold DNA binding dye (Life Technologies, UK). SYBR Gold was added to a crushed disc suspension (1/10 disc to water ratio) and incubated in the dark at room temperature for approximately 20 min according to the manufacturer's instructions. Three hundred microlitres of the suspension were transferred using a vacuum pump to 0.2 µm filter paper. The filter was applied to a glass slide and a drop of AntiFade fluorescence mounting medium added. The slide was viewed under blue light (I3 prism) at 100× magnification under fluorescent microscopy (Leica DM4000B). Cells were counted in 30 fields of view defined by a 100 × 100 μm2 grid. The total number of cells per gram of disc was estimated.
Statistical analysis
Response variables were predicted by a General Linear Model considering the factors of exposure (covered/exposed), time, depth, porosity and all possible pairwise interactions. The data residuals were tested for homogeneity of variance using Levene's metric and for normality by the Anderson–Darling test. The cell count and colony count data were log(x + 1)-transformed to meet the assumption of normality. Chi-squares were used to test for association between treatments and the distribution of cells with depth through a stack of discs.
Identification of phototrophs and 16S rDNA analysis of cultured bacterial colonists
To test the hypothesis that uninhabited habitats, as well as being colonized by organisms that can use yeast extract, are colonized by phototrophs, these organisms were cultured.
To identify phototroph colonizers, from all top discs of both covered and exposed samples (Experiment 3) a small segment (~0.2 g) was placed into a 25 ml glass bottle containing 10 ml of BG-11 medium (Rippka et al. Reference Rippka, Deruelles, Waterbury, Herdman and Stanier1979). Samples were incubated at 21 °C for 3 months under continuous laboratory lighting conditions (approximately 50 µmol m−2 s−1 light intensity). After 3 months, the presence or absence of phototrophic growth was noted for each tube by the presence of conspicuous green colouration. Phototrophs were examined and identified visually under bright field microscopy using a Leica DM4000B microscope at 20× and 100× magnification. A fragment of the top disc of three control stacks was also incubated with the same protocol.
In Experiment 1 each morphotype of bacteria observed on plates was subcultured and a single colony was used as a template for Polymerase Chain Reaction (PCR) targeting the 16S rDNA gene (primers 27F/1389R). The total reaction volume was 20 µl, consisting of 14.375 µl H2O, 12.5 µl GoTaq mastermix and 1.0 µl each of forward (27F) and reverse (1389R) primers (10 µM). Thermal cycling began with initial denaturation at 94 °C for 2 min, followed by 25 cycles of 94 °C (1 min), 55 °C (1 min) and 72 °C (1.5 min), with a final elongation step of 72 °C for 10 min. The PCR products were visualized and checked for proper size through agarose gel electrophoresis, then they were purified using the QIAquick PCR Purification Kit in preparation for DNA sequencing at Geneart (Regensburg, Germany). Returned sequence files were bidirectionally edited and ends were trimmed to remove low-quality base calls. To determine the species of a colony type, its 16S rDNA sequence was compared via Basic Local Alignment Search Tool (BLAST) against homologous sequences from known species found in the NCBI GenBank database.
Molecular analysis of total community
To determine the identity of the total microbial community, DNA was extracted from the discs of exposed and covered stacks at months 1 and 3 (Experiment 3). DNA was extracted with the PowerMax Soil DNA Isolation Kit (Mobio) according to the manufacturer's instructions.
Extracted genomic DNA was then sequenced using the Illumina MiSeq platform (Research and Testing Laboratory of the South Plains, Lubbock, Texas, USA). Initial trimming, denoising and chimera checking were carried out by Research and Testing Laboratory (Edgar Reference Edgar2010, Reference Edgar2011; Edgar et al. Reference Edgar, Haas, Clemente, Quince and Knight2013). Operational taxonomic unit (OTU) clustering and taxonomic identification were carried out in QIIME (Caporaso et al. Reference Caporaso, Kuczynski, Stombaugh, Bittinger, Bushman, Costello, Fierer, Pena, Goodrich, Gordon and Huttley2010). Open reference OTU picking was performed against the Silva database (Quast et al. Reference Quast, Pruesse, Yilmaz, Gerken, Schweer, Yarza, Peplies and Glöckner2013) and the remaining unaligned sequences clustered de novo using UCLUST. Singleton OTUs and OTUs that did not align with PyNAST were removed. Biodiversity data for bacteria were calculated by binning sequences into discrete OTUs with a 97% similarity.
Results
Environmental data
The environmental data (maximum and minimum temperature and precipitation) for each day of the three experiments is displayed in Fig. 3. The mean minimum and maximum temperatures and cumulative total amount of precipitation that the samples experienced at each experimental sampling time point was as follows: (temperature mean min – °C, temperature mean max – °C, precipitation – mm): Experiment 1 – Day 1 (8.6, 13.8, 7.2), Week 1 (3.2, 9.7, 21.0), Month 1 (1.4, 7.1, 63.8); Experiment 2 – Day 1 (8.7, 17.2, 3.0); Week 2 (8.6, 17.0, 11.0), Month 3 (6.6, 14.0, 208.6); Experiment 3 – Month 1 (10.2, 16.2, 70.8), Month 3 (11.1, 18.2, 184.4).
Temperature (air maximum and minimum) and precipitation data during the course of Experiments 1 (start, 4 January 2015), 2 (start, 1 September 2015) and 3 (start, 1 June 2016) Data are shown as days of the experiment. The horizontal line in the temperature data is 0 °C. Data were obtained from the Royal Botanic Gardens weather station, Edinburgh.

Colonization of artificial uninhabited habitats
Experiment 1. The mean number of cfus (x-axis) per gram of disc for each of the time points and for both exposed and covered stacks is shown in Fig. 4. The y-axis shows the depths from the surface (1) to the bottom disc (4). The mean values do not reveal the heterogeneity of colonization in given triplicates at given time points. Figure 5 shows the cfus (x-axis) per gram of disc for each of the triplicates for each of the time points for both exposed and covered stacks. The y-axis shows the depths from the surface (1) to the bottom disc (4). No colonization of the control stacks was observed.
Experiment 1. Mean colony-forming units (cfus) per gram of material in exposed and covered stacks after day 1, week 1 and month 1. Each of the four depth values are shown for the mean of the triplicate stacks. Note different x-axes for time points. Errors are standard deviations.

Heterogeneity in colonization. Experiment 1. Colony-forming units (cfus) per gram of material in exposed and covered stacks after day 1, week 1 and month 1. Each of the four depths values are shown for each of the three triplicate stacks (light grey, dark grey, black). Data are shown in the arbitrary order in which the three stacks were selected and processed for each depth. Note different x-axes for time points.
In Experiment 1, the number of distinct colony morphologies per plate was 1.2 (±0.4) after week 1 and 1.6 (±0.6) after month 1 time points. Over the course of the whole experiment, the number of distinct colony morphologies was 0.6 (±0.5) in covered stacks and 1.8 (±0.5) in exposed stacks.
In Experiment 1, the total number of cells per gram of disc as determined by direct cell counting under fluorescent microscopy is shown in Table 1. Total cell numbers for Day 1 were below reliable detection limits using the method employed.
Total cell counts in Experiment 1 after week 1 and month 1 time points. All values are cells per gram of disc (×105)

Experiment 2. The mean number of cfus (x-axis) per gram of disc for each of the time points and for both exposed and covered stacks is shown in Fig. 6. The y-axis shows the depths from the surface (1) to the bottom disc (5) for each of the four porosities. The mean values do not reveal the heterogeneity of colonization in given triplicates at given time points. Figure 7 shows the cfus (x-axis) per gram of disc for each of the triplicates for each of the time points and for both exposed and covered stacks and for all four porosities. No colonization of the control stacks was observed.
Experiment 2. Mean colony-forming units (cfus) per gram of material in exposed and covered stacks after day 1, week 2 and month 3. Each of the five depths values are shown for the mean of the triplicate samples. Note different x-axes for time points. Errors are standard deviations. Samples with ≥5000 cfus g−1 were overgrown on the plates and no determination of exact cultivable cell numbers could be obtained. In the case of exposed, depth 1, porosity 3, all discs had ≥5000 cfus g−1 hence there is no SD.
Heterogeneity in colonization. Experiment 2. Colony-forming units (cfus) per gram of material in exposed and covered stacks after day 1, week 2 and month 3. Each of the five depths values are shown for each of the three triplicate stacks. Data are shown in the arbitrary order in which the three stacks were selected and processed for each depth (the three triplicates for each depth are shown in the same colour). Note that these values are plotted on a logarithmic scale to improve visual comparisons between different porosities and note different x-axes for time points. Samples with ≥5000 cfus g−1 were overgrown on the plates and no determination of exact cultivable cell numbers could be obtained.

Experiment 3. In Experiment 3, cfus were determined (per gram) as shown in Table 2.
Number of colony-forming units in Experiment 3 at each depth for month 1 and 3 time points
Statistical analysis of colonization results
Experiment 1. Colonization of uninhabited habitats was rapid. After day 1, top discs in two exposed stacks were colonized. Approximately twice as many cfus were observed after 1 month as after 1 week, but this effect was marginally non-significant (F 1,42 = 3.23, P = 0.079). There was no corresponding increase in cultivable diversity (F 1,42 = 1.50, P = 0.227). Direct exposure to precipitation (exposed stacks) accounted for nearly a 2× (2-times) increase in average colony count (F 1,42 = 21.44, P < 0.001) compared with covered stacks and a nearly 1.5× increase in the number of distinct colony morphologies (F 1,42 = 14.94, P < 0.001).
The top disc hosted about 1.65× more cfus and cultivable diversity than the global mean (cfus: t = 2.09, P = 0.043; diversity: t = 2.72, P = 0.010), although depth did not explain a significant share of variance in either measure (F 3,42 = 1.55, P = 0.216; F 3,42 = 2.81, P = 0.051). The distribution of cfus with depth differed between covered and exposed stacks (χ2 = 7.203, df = 3, P = 0.001). Specifically, exposed stacks displayed less variance between depths than covered stacks, where cfus were concentrated in the top and bottom discs. The depth distribution of cfu did not change between week 1 and month 1 time-points (χ2 = 0.690, df = 3, P = 0.875).
In Experiment 1 in which total cell counts were determined, the fewest cells were observed in the middle two discs, with the most cells being found in the bottom disc (F 3,42 = 4.10, P = 0.012). A chi-square test revealed no association between exposure and depth distribution (χ2 = 7.40, df = 3, P = 0.060). Exposure compared with covered stacks had a small but statistically significant positive effect on cell count (F 1,42 = 4.15, P = 0.048). Cell count declined between week 1 and month 1 in both covered and exposed treatments (F 1,42 = 7.27, P = 0.010).
Experiment 2: Statistical analysis of Experiment 2 confirms the findings of Experiment 1 and yields insights into the important effects of porosity.
Porosity was a significant factor in determining colonization (F 3,357 = 5.86, P = 0.001). Stacks with the highest porosity (Porosity 1) had 4× more cfus than the lowest porosity (Porosity 4) stacks and the difference was statistically significant (t = 3.16, P = 0.002).
The effect of porosity varied with time (F 6,357 = 5.61, P < 0.001). After 1 day, there was no significant difference in cfus between most and least porous stacks (t = 0.90, P = 0.377). After 2 weeks, there was still not a significant difference but there were 2.9× as many cfus in the most porous stacks compared with the least (t = 1.69, P = 0.100). After 3 months, there were approximately 4.3× as many cfus in the highest-porosity stacks (t = 4.17, P < 0.001) and it was statistically significant. At this time point, porosity 1 stacks had 1.6× more cfus than porosity 2, but the difference was not statistically significant (t = 1.60, P = 0.116). Porosity 1 stacks had 1.4× more cfus than porosity 3, but the difference was not statistically significant (t = 1.17, P = 0.248).
Among disc stacks exposed to precipitation (exposed stacks), the most porous discs contained approximately 3.7 times as many cfus as the least porous ones (t = 2.76, P = 0.008). The average difference among covered discs appeared even greater, at 6.1 times, but this value was marginally non-significant owing high variability among the most porous discs (t = 1.84, P = 0.073). Thus, porosity seems to have had the greatest effect on colonization of exposed discs.
Time was a highly significant factor (F 2,357 = 97.77, P < 0.001). The 3-month time point was associated with a 491× increase in cfus compared with the day 1 time point (t = 8.13, P < 0.001). There was also a 7.7× increase in cfu between the day 1 and week 2 time points (t = 3.74, P < 0.001). Between the week 2 and month 3 time points there was an increase of 64.0× (t = 8.02, P < 0.001).
As for Experiment 1, exposure was a highly significant factor (F 1,357 = 47.95, P < 0.001). Exposed stacks had approximately 5.6× more cfus than covered stacks on average (t = 5.13, P < 0.001). The positive effect of exposure became more pronounced with time (F 2,357 = 44.77, P < 0.001).
In Experiment 2, depth did not explain a significant proportion of the variance (F 4,357 = 0.72, P = 0.578), but on average the top disc contained 1.4× as many cfus than the bottom four (t = 1.06, P = 0.292). The interaction between depth and porosity was not significant (F 12,357 = 0.77, P = 0.677). The interaction between depth and exposure was also not significant (F 4,357 = 0.57, P = 0.688). The interaction between depth and time was also not significant (F 8,357 = 0.67, P = 0.721).
Culturing of organisms
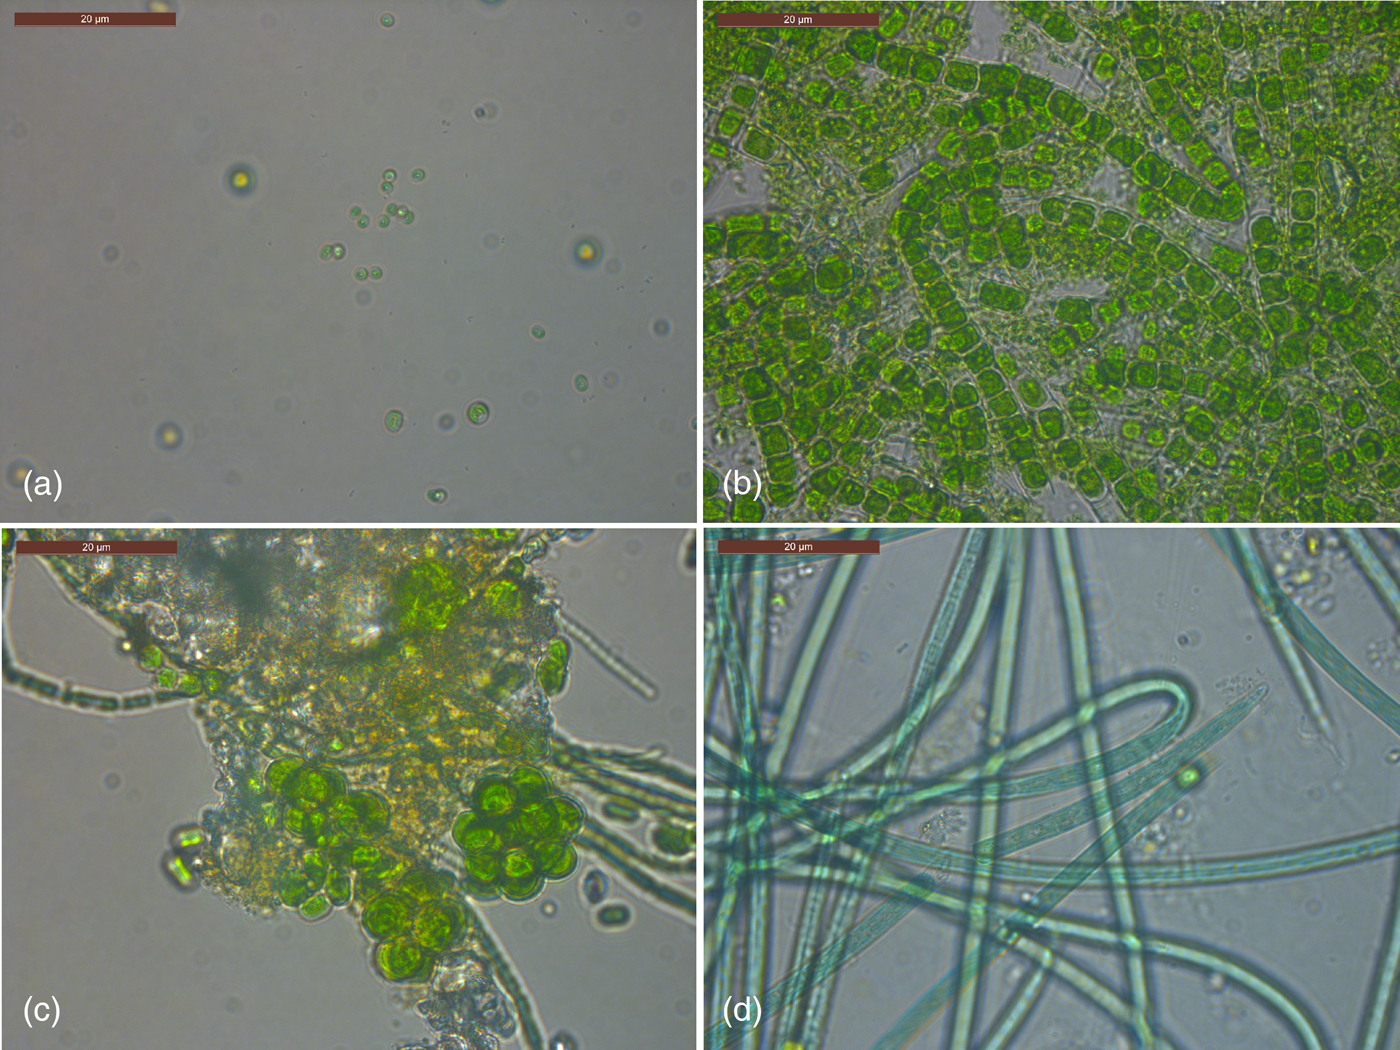
After day 1 (Experiment 3), no phototrophic growth was observed in any of the exposed samples. In covered samples, one sample displayed growth of Chlorella (Fig. 8(a)) and another sample displayed growth of Klebsormidium (Fig. 8(b)). After 1 month all exposed and control top discs displayed phototrophic growth apart from two covered samples. Both filamentous forms and coccoid algae and cyanobacteria were observed in exposed and covered samples. A much larger diversity of both algal and cyanobacterial phototrophs were observed after 1 month compared with day 1 including both coccoid (e.g. Coelastrum sp., Fig. 8(c)) and filamentous forms (e.g. Klebsormidium sp.; Oscillatoria sp., Fig. 8(d)). Presumptive Pseudanabaena/Anabaena filaments were observed (for example in Fig. 8(c)). The two samples that did not display phototrophic growth had conspicuously high levels of fungal growth. After 3 months all discs displayed growth apart from two covered samples. The diversity of organisms was the same as for 1 month samples, with no recognizably new morphologies of phototrophs.
Phototrophs cultured from the top disc of stacks after day 1 (a) and month 3 (b–d) of Experiment 3. See text for details.
A total of seven distinct colony types were cultivated on yeast extract plates from Experiment 1. Examples of all were seen at both time points and in both exposure groups. Four of them were successfully subcultured and sequenced. They were: orange isolate: Sphingomonas aerolata (99% similarity), pink isolate: Hymenobacter antarcticus (97% similarity), yellow isolate: Micrococcus luteus (99% similarity), red isolate: Janthinobacterium lividum (99% similarity).
Identity of colonists by genomic DNA analysis
The phylum-level identification of bacterial colonists (based on 16S rDNA sequences) of the discs in Experiment 3 at different depths observed after months 1 and 3 is shown in Fig. 9(a). The phylum-level identification of eukaryotic (fungal and algal) colonists (based on 18S rDNA sequences) of the same discs is shown in Fig. 9(b). A prominent difference between exposed and covered samples was the much more abundant fungal population in covered discs. No DNA was successfully extracted or amplified from control discs or from day 1 discs.
Phylum level (and class level in the Proteobacteria) classification of 16S rDNA and eukaryotic sequences in exposed and covered stacks of discs after months 1 and 3 (Experiment 3).
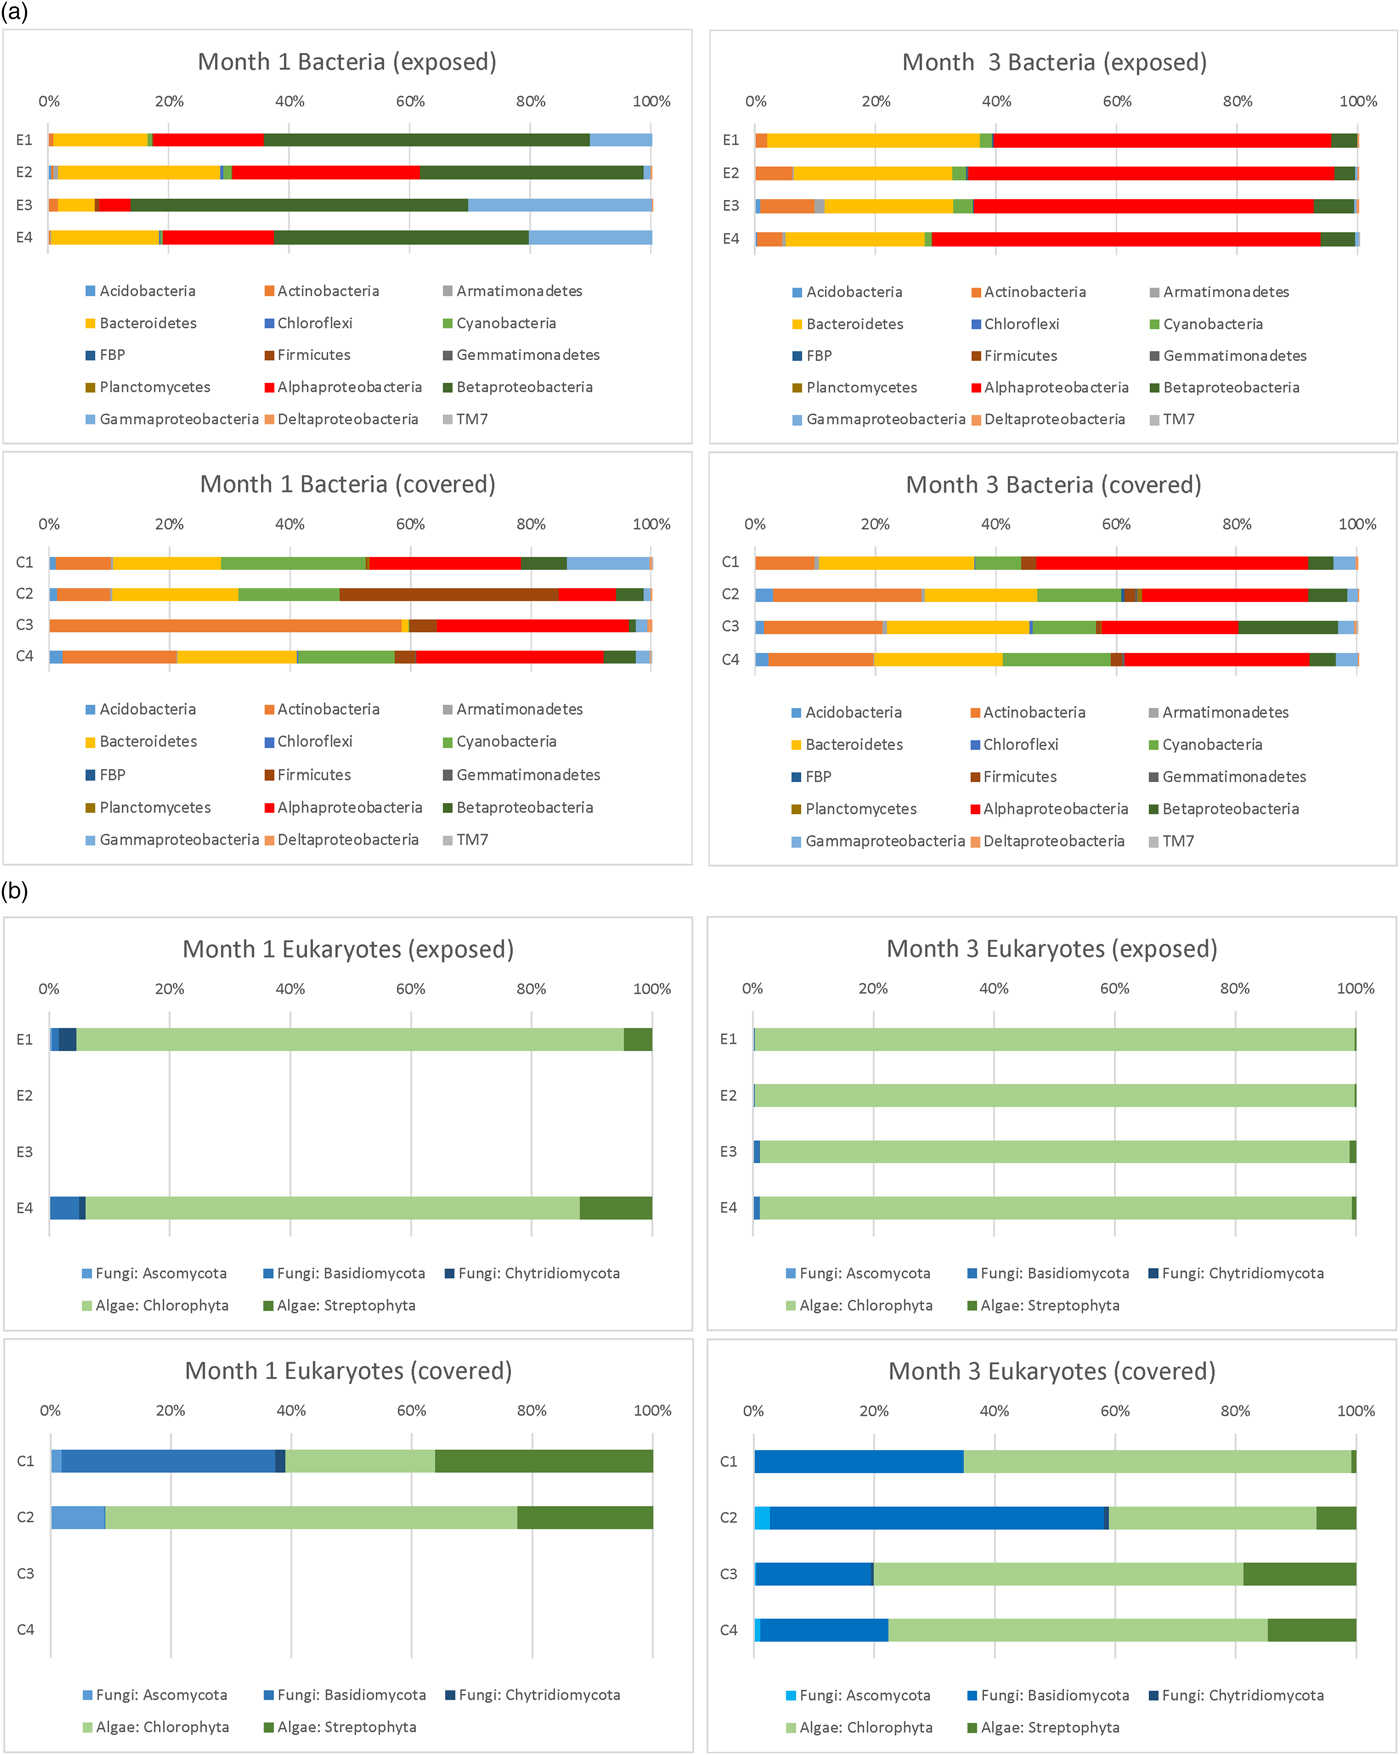
After 1 month, exposed discs at all depths were dominated by Proteobacteria. Alphaproteobacteria genera were dominated by sequences affiliated with Sphingomonas and Methylobacterium spp, Betaproteobacteria by Janthinobacterium, Duganella, Herbaspirillum and Acidovorax spp. and Gammaproteobacteria by Pseudomonas sp. The large proportion of Betaproteobacteria compared with exposed samples in month 3 was almost completely accounted for by the presence of a population of Janthinobacterium sp. at all depths. Bacteroidetes were dominated by Hymenobacter and unclassified spp. In covered samples, Actinobacteria were more prominent than exposed samples, accounted for by sequences affiliated with Arthrobacter and Marmoricola spp. Cyanobacteria were more prominent in covered samples with sequences dominated by Nostoc and Anabaena spp. In covered samples at depth 2 there was a prominent population of Firmicutes accounted for by a population of Paenibacillus sp. In depth 3, the more prominent Actinobacteria component was accounted for by a population of Kocuria spp.
In exposed samples after month 3, populations were broadly similar to month 1. However, the prominent population of the Betaproteobacterium, Janthinobacterium, was no longer evident. Instead, Alphaproteobacteria dominated the Proteobacteria, accounted for mainly by a population of Methylobacterium sp.
In covered samples after month 3, the distribution of bacterial phyla and genera was similar to month 1, but the distinctive populations of Firmicutes and Actinobacteria identified in depth 2 and 3 at month 1 were no longer dominant and populations were similar at all depths.
For eukaryotic analysis after month 1, DNA was only successfully amplified in exposed samples at depths 1 and 4. In the algal sequences, at both depths, Chlorophyta were dominated by sequences affiliated with organisms in the family Trebouxiophyceae dominated by Chloroidium, Chlorella, Diplosphaera and Apatococcus spp. In Streptophyta, sequences belonged to Klebsormidium and other genera dominate. In fungal sequences in depth 1, Basidiomycota were dominated by sequences affiliated with Cryptococcus, Ascomycota by Trichomerium sp. and Chytridiomycota by unclassified sequences. Similar sequences were determined in depth 4, but in the Basidiomycota, Udeniomyces and Kondoa spp were prominent and in Ascomycota sequences affiliated with Taphrina were prominent.
In covered samples (month 1), eukaryotic DNA was only amplified from depths 1 and 2. In the algal sequences, Chlorophyta were dominated by sequences affiliated with organisms in the family Trebouxiophyceae including Chlorella, Diplosphaera and Apatococcus. In Streptophyta, sequences belonged to Klebsormidium and other genera. In fungal sequences in depth 1, Basidiomycota were dominated by sequences affiliated with Cryptococcus, Ascomycota by Sawadaea sp. and Chytridiomycota by Rhizophlyctis sp. At depth 2, fungi were dominated by Ascomycota represented by Saccharomyces sp.
After 3 months, eukaryotic DNA was successfully amplified at all depths in exposed and covered samples. Fungi were more prevalent in covered samples (an average of 25.3 ± 16.4% in all discs compared with 0.72 ± 0.46% in exposed samples). In exposed samples, algal sequences at all depths were dominated by Chlorophyta with sequences affiliated with organisms in the family Trebouxiophyceae dominated by Chloroidium. Fungi were more prominent at depths 3 and 4 and were dominated by Basidiomycota with sequences affiliated with Cryptococcus.
In covered samples, in the algal sequences, in depth 1 algae were predominantly Chlorophyta with sequences dominated by Chloroidium. However, at depths 2–4, algal sequences were more diverse, with Chlorophyta dominated by sequences affiliated with organisms in the family Trebouxiophyceae including Chlorella, Diplosphaera, Apatococcus, Stichococcus and Trebouxia spp. In Streptophyta, sequences primarily belonged to Klebsormidium. In fungal sequences in all depths, Basidiomycota were dominated by sequences affiliated with Cryptococcus. At depth 2, there was a prominent set of sequences of Basidiomycota affiliated with Sporobolomyces and sequences of Ascomycota associated with Penicillium sp.
Biodiversity data for bacteria in Experiment 3 are shown in Table 3.
Biodiversity data for Experiment 3 showing Simpson and Shannon diversity indices for each depth and time period for exposed and covered stacks. At month 1 a total of 18 140 sequences were sampled and at month 3, there were 15 650 sequences

Discussion
Environments that contain all the requisites (CHNOPS elements, other nutrients, energy, water and appropriate physical and chemical conditions for growth) for known organisms, but contain no such organisms (uninhabited habitats) are rarely reported in the ecological literature (Cockell Reference Cockell2011). One explanation is that most of these environments are transient and are colonized rapidly by organisms transported in the atmosphere. This hypothesis would explain why the presence of habitable conditions and metabolically active life are usually tightly coupled on the Earth.
Although many studies have been carried out on primary succession habitats, the initial conditions of the substrate with respect to whether it is uninhabitable and when it becomes habitable and to what group of organisms, are not usually defined. Therefore, the close coupling of the appearance of habitable environments and their colonization by organisms that define those conditions as habitable has not been empirically studied under controlled conditions. In this paper, we sought to investigate the rarity of habitable, but uninhabited conditions on Earth by constructing a well-controlled habitat that was habitable with respect to a defined set of organisms (aerobic respirers and phototrophs) and then following the rate of colonization of this specific set of organisms.
The data obtained showed that colonization of uninhabited habitats is rapid in a temperate environment. After 1 month, exposed artificial endolithic uninhabited habitats (Experiment 1) were colonized at all four depths and in all triplicates. Nevertheless, uninhabited habitable conditions did persist in the interior of the exposed stacks after week 1. In covered stacks, although the surfaces of all stacks were colonized after month 1, uninhabited habitats persisted below the surface at this time. These latter data show the importance of direct precipitation and atmospheric fall-out of organisms in causing the rapid disappearance of uninhabited habitats and that where these microbial inputs are less vigorous, uninhabited habitats could persist for at least periods of months.
As covered stacks were not exposed directly to precipitation one question is how the interiors become inhabited. During the experiment, it was observed that frequently there was dew condensed onto the surface of the stacks, particularly in the mornings. Moisture that condensed onto the surface of the rocks could have carried organisms into the covered stacks, perhaps by capillary action, suggesting the importance of the hydrological cycle in driving colonization even in covered stacks.
In Experiments 1 and 2 some of the stacks showed colonization of the bottom disc before the interior discs. One explanation for this observation is that the aerial transport of organisms to the underside of the stacks (for example in local updrafts) led to colonization of the disc before organisms had time to percolate from the top into the interior of the stack.
Colonization patterns of the uninhabited habitats were heterogeneous. In exposed stacks on day 1, just one of the triplicates was colonized at depths 1 and 2 (to a depth of 0.6 cm), the other two stacks remained uninhabited habitats at all depths. After one week, only one exposed stack was colonized at all depths, the two other stacks were colonized heterogeneously at different depths. These data can be explained by the heterogeneous delivery of organisms onto the surface of the stacks, the potentially different rates at which given organisms percolate into the rocks and different growth rates within the rock once organisms become established. Heterogeneity in cell numbers and microbial diversity at a metre and sub-metre scales has previously been observed in fresh lava flows (Kelly et al. Reference Kelly, Cockell, Thorsteinsson, Marteinsson and Stevenson2014).
Curiously, total cell number was reduced between week 1 and month 1 in Experiment 1, but cfus increased. One hypothesis to explain these data is that between these time points the habitats, which contain yeast extract, provided a suitable environment for the proliferation of organisms that can use this substrate, shown by an increase in cfus, which are determined on yeast extract agar plates. However, after intense precipitation during week 1 and 2, the habitats experienced very little precipitation but were exposed to freeze-thaw events that lasted over 5 days, potentially damaging or lysing cells that were deposited in the first 2 weeks and reducing the diversity and total numbers of cells. The high numbers of total cell counts observed in the bottom disc might also be caused by the presence of inactive or moribund cells washed through the discs during the experiment and collected on the underside.
To test the role of porosity in influencing the rate of colonization of uninhabited habitats, an experiment (Experiment 2) was conducted using four porosities. The experiment showed that porosity influences the rate of colonization. After 3 months there was a significant difference in colonization between porosity 1 and 4. Lower porosities likely retard both water flow through the rocks and microbial movement, causing slower rates of colonization. This is consistent with previous observations on the importance of porosity in determining microbial movement through rocks and soil (Krone et al. Reference Krone, Orlob and Hodgkinson1958; van Elsas et al. Reference van Elsas, Trevors and van Overbeek1991; Huysman & Verstraete Reference Huysman and Verstraete1993; Abu-Ashour et al. Reference Abu-Ashour, Joy, Lee, Whiteley and Zelin1994; Wolf et al. Reference Wolf, Vos, de Boer and Kowalchuk2013).
Given the results of Experiment 1 in which uninhabited habitats were observed in covered stacks after 1 month, the final time point in Experiment 2 was taken at 3 months to discover if this time was sufficient for covered stacks to become colonized at all depths. The experiment showed that this was the case. After 3 months, all stacks at all depths in both covered and exposed conditions and for all four porosities were colonized. However, consistent with Experiment 1, covered stacks had significantly lower cfus than exposed stacks.
The identity of the early colonists was examined in Experiment 3 by 16S rDNA sequencing. Some of the sequences affiliated with organisms already known to inhabit primary succession environments. For example, members of the Actinobacteria (Arthrobacter), Alpha and Betaproteobacteria (Sphingomonas) and Bacteroidetes (Hymenobacter) were also observed to be culturable components of the earliest colonists of early Icelandic lava flows, which were examined 3 and 5 months after their formation (Kelly et al. Reference Kelly, Cockell, Thorsteinsson, Marteinsson and Stevenson2014). The reasons for this are not known, but possible explanations might include the resistance of these taxa to desiccation, atmospheric UV radiation and ability to grow under low organic carbon availability.
The source of the organisms that colonized the rocks was atmospheric. The troposphere is known to contain a diversity of microorganisms (Womack et al. Reference Womack, Bohannan and Green2010; Bowers et al. Reference Bowers, Clements, Emerson, Wiedinmyer, Hannigan and Fierer2013; Vaitilingom et al. Reference Vaitilingom, Deguillaume, Vinatier, Sancelme, Amato, Chaumerliac and Delort2013; Seifried et al. Reference Seifried, Wichels and Gerdts2015) and rain droplets are known to carry organisms (Evans et al. Reference Evans, Coombes and Dunstan2006; Elbert et al. Reference Elbert, Taylor, Andreae and Pöschl2007; Huffman et al. Reference Huffman, Prenni, DeMott, Pöhlker, Mason, Robinson, Fröhlich-Nowoisky, Tobo, Després, Garcia, Gochis, Harris, Müller-Germann, Ruzene, Schmer, Sinha, Day, Andreae, Jiminez, Gallagher, Kreidenweis, Bertram and Pöschl2013), accounting for the colonization observed here.
Evident in the sequences and confirmed by culturing (Experiment 3) were phototrophs, demonstrating that they can rapidly take advantage of newly created and exposed habitable space. In addition to the organics provided by the yeast extract, organics are probably provided by phototrophs. Phototrophs are known to be early colonists of primary succession habitats (Brock Reference Brock1973). Similarly to this study, they were cultured, but not found to be dominant members of early lava flow communities (Kelly et al. Reference Kelly, Cockell, Thorsteinsson, Marteinsson and Stevenson2014). The thickness of the stacks (1.2 cm) in the experiment and the fact that they are exposed to light on all sides may explain why phototrophs managed to colonize all depths.
In addition to the specific interest in uninhabited habitats, the data presented here provide general insights into the colonization of endolithic habitats. Although microbial successional sequences have been studied in a wide diversity of environments including lava flows and glacial forelands (Chapin et al. Reference Chapin, Walker, Fastie and Sharman1994; Gomez-Alvarez et al. Reference Gomez-Alvarez, King and Nüsslein2007; Ibekwe et al. Reference Ibekwe, Kennedy, Halvorson and Yang2007; Nemergut et al. Reference Nemergut, Anderson, Cleveland, Martin, Miller, Seimon and Schmidt2007; Schütte et al. Reference Schütte, Abdo, Foster, Ravel, Bunge, Solheim and Forney2010), the patterns of colonization have not been elucidated for the interior of rocks, although they are known to host ordered stratified communities including phototrophs (Friedmann Reference Friedmann1982). The artificial endolithic habitats used here suggest that the general sequence of endolithic primary succession is similar to that of other environments, with heterotrophs and phototrophs colonizing the rock in the early stages. The presence of distinct populations of Paenibacillus and Kocuria in the interior of the covered rocks in month 1 not observed in month 3 shows that in the early stages of colonization a small number of species may proliferate and dominate the interior of rocks before more stable communities become established. The abundance of eukaryotes observed might reflect differences in habitat. The greater abundance of fungi in covered stacks compared with exposed stacks may be accounted for by the darker conditions in the covered stacks. Fungi are known to occupy dark, moist environments (Elbert et al. Reference Elbert, Taylor, Andreae and Pöschl2007). The slower rate of colonization of eukaryotes compared with bacteria in the stacks could be accounted for by different hypotheses including a lower abundance in the atmospheric inoculum arriving on the rock or the generally larger cell size of eukaryotes, which might retard migration through the stacks.
The experimental method developed here shows the promise of artificially engineered habitats for elucidating in a controlled and replicated way how microorganisms colonize the surface and interior of rocks in different locations around the world.
The data likely underrepresent the extent of colonization. We enumerated cfus on yeast extract plates since that was the carbon and nutrient source provided initially in the uninhabited habitats and we were therefore interested in following the colonization of this specific group of organisms for which the habitat had been engineered as habitable at the beginning of the experiment. There may have been other active organisms within the habitats that either use yeast extract and cannot readily grow on agar surfaces or organisms that feed on the waste products of other organisms (such as organics produced by phototrophs shown to be present in both culture and culture-independent methods) that were not able to grow on yeast extract plates, but this was not the focus of this study. Furthermore, there is also well-known discrepancy between culturable and total numbers of cells (Staley & Kanopka Reference Staley and Konopka1985; Amman et al. Reference Amman, Ludwig and Schleifer1995). This is likely to be the case in our experiment, evidenced by the high diversity of organisms we obtained by 16S rDNA analysis of extracted genomic DNA compared with isolated organisms. The environmental DNA extraction does not allow us to determine which of the sequences belonged to non-viable or inactive cells that drifted in, the latter for whom the rock may not be a habitat.
These data are a demonstration of how habitability and the presence of life can be tightly coupled on Earth. The rate at which colonization occurs in any given planetary environment could be reduced by several factors. They include: (1) an environment where there is much lower biomass in water or atmospheric input, which could increase the time period over which no organisms, or organisms unable to be active, land in an available habitat; (2) a planet with an inclement atmosphere, such as an anoxic planet with a more damaging UV flux than on Earth, which might have fewer viable organisms in the atmosphere; (3) a planet or planetary environment that has a much less vigorous hydrological regime that causes longer time periods between the formation of a newly available habitat and its inoculation with organisms from surface water or atmospheric precipitation; (4) a planet or planetary environment where localized liquid water is generated by, for example, impact events, localized melting or subglacial ice or obliquity variations, creating transient habitable regions that are disconnected from other habitable regions and finally; (5) a planet where an origin of life has not occurred, but habitable conditions exist.
The experiments described here tested for colonization by aerobic heterotrophs, which use oxygen produced by life as the electron acceptor for energy acquisition and in these experiments yeast extract, also a product of biology, as a source of electron donors and other nutrients. However, environments could have habitable conditions for some chemolithotrophs and phototrophs made possible by rock- and abiotically-derived elements and compounds. Abiotically-produced organic molecules, for example amino acids, nucleobases and sugars found in meteorites (Sephton Reference Sephton2002; Martins et al. Reference Martins, Botta, Fogel, Sephton, Glavin, Watson, Dworkin, Schwartz and Ehrenfreund2008), might supply organics for growth of anaerobic heterotrophs and fermentative microorganisms with other nutrients derived from rocks or meteorites (Mautner Reference Mautner2002).
The surface and subsurface of Mars may be one location to test the hypothesis that uninhabited habitats can be sustained over long time periods. Past habitable environments on Mars that could theoretically support chemolithotrophs (Grotzinger et al. Reference Grotzinger, Sumner, Kah, Stack, Gupta, Edgar, Rubin, Lewis, Schieber, Mangold, Milliken, Conrad, DesMarais, Farmer, Siebach, Calef, Hurowitz, McLennan, Ming, Vaniman, Crisp, Vasavada, Edgett, Malin, Blake, Geliert, Mahaffy, Wiens, Maurice, Grant, Wilson, Anderson, Beegle, Arvidson, Hallet, Sletten, Rice, Bell, Griffes, Ehlmann, Anderson, Bristow, Dietrich, Dromart, Eigenbrode, Fraeman, Hardgrove, Herkenhoff, Jandura, Kocurek, Lee, Leshin, Leveille, Limonadi, Maki, McCloskey, Meyer, Minitti, Newsom, Oehler, Okon, Palucis, Parker, Rowland, Schmidt, Squyres, Steele, Stolper, Summons, Treiman, Williams and Yingst2013) offer locations to test for the presence of past life and to determine whether they preserve evidence for uninhabited habitats or whether, as on the Earth, habitable regions ubiquitously became rapidly colonized.
Finally, we note that if there is extant life on Mars and it is very sparsely distributed and therefore difficult to find directly, but ultimately distributed in low abundance in the atmosphere or subsurface, one way to find it might be to deploy uninhabited habitats similar to the ones described here on the Martian surface or buried in the subsurface and leave them for months to years to determine if they ultimately become inhabited. Similar life detection approaches might be used to ‘fish’ for extraterrestrial life elsewhere. Deployed uninhabited habitats are essentially a collection and enrichment method. A lack of success would in itself be a valuable demonstration of the potential for the persistence of habitable, but uninhabited environments in the Universe. The use of uninhabited habitats on other planetary surfaces as a life detection method would also conform to planetary protection concerns.
Acknowledgements
Christy Read, Ruth Estefany Quispe and Marika Tarasashvili are thanked for assistance with cyanobacterial and algal identification.


 Open access