


Impact Statement
Accurate prediction of ionospheric variations is critical for various applications, including communication, navigation, remote sensing, and climate change monitoring. The traditional models are based on physical and empirical models, which have limitations in capturing the ionosphere’s dynamic nature. The development of machine learning methods has created a new opportunity to improve ionospheric variation prediction accuracy significantly. Development of the long short-term memory (LSTM) model leads to accurate short-term $ foF2 $
predictions during maximum and minimum solar activity. The results provide an efficient and reliable prediction of ionospheric variations, which can have a significant impact on a variety of applications. Applying machine learning methods can provide new insights into the complex ionosphere dynamics, improving the quality of life for people worldwide.
$ foF2 $
predictions during maximum and minimum solar activity. The results provide an efficient and reliable prediction of ionospheric variations, which can have a significant impact on a variety of applications. Applying machine learning methods can provide new insights into the complex ionosphere dynamics, improving the quality of life for people worldwide.
1. Introduction
The ionosphere experiences daily fluctuations that can arise from various factors, such as solar and geomagnetic activity, as well as large-scale lower atmospheric waves. Understanding the ionosphere is essential in predicting ionospheric parameters and mitigating the effects of climate change. The ionosphere consists of ions and charged particles produced by solar radiation absorption and the solar wind’s impact on the upper atmosphere. Therefore, man-made emissions have a significant impact on the entire atmospheric system since greenhouse gas concentrations have a cooling effect on the upper atmosphere, which leads to significant changes in the mesosphere, thermosphere, and ionosphere (Laštovička et al., Reference Laštovička, Akmaev, Beig, Bremer, Emmert, Jacobi and Ulich2008; Laštovička, Reference Laštovička2013). Although accurate ionospheric predictions during severe disturbances are challenging, the ionosphere remains complex and nonlinear (Cander, Reference Cander2015). Various approaches have been developed to overcome the effects of ionospheric delay on communication systems, but further research is necessary for precise predictions (Paziewski & Sieradzki, Reference Paziewski and Sieradzki2020).
The characteristics of the ionosphere are determined by the $ F2 $
layer, which has a high electron density. The
$ F2 $
layer, which has a high electron density. The $ foF2 $
critical frequency of the
$ foF2 $
critical frequency of the $ F2 $
layer is an essential parameter for high-frequency (
$ F2 $
layer is an essential parameter for high-frequency ( $ HF $
) radio propagation, navigation, and remote sensing systems, as sudden irregularities can cause disruptions. The Earth’s magnetic field can also influence the
$ HF $
) radio propagation, navigation, and remote sensing systems, as sudden irregularities can cause disruptions. The Earth’s magnetic field can also influence the $ F2 $
layer by deflecting charged particles in the ionosphere and affecting their distribution. Therefore, forecasting the
$ F2 $
layer by deflecting charged particles in the ionosphere and affecting their distribution. Therefore, forecasting the $ foF2 $
critical frequency has become a significant concern in space weather studies, with applications ranging from high-frequency radars to communication systems (Ismail Fawaz et al., Reference Ismail Fawaz, Forestier, Weber, Idoumghar and Muller2022).
$ foF2 $
critical frequency has become a significant concern in space weather studies, with applications ranging from high-frequency radars to communication systems (Ismail Fawaz et al., Reference Ismail Fawaz, Forestier, Weber, Idoumghar and Muller2022).
Accurate ionospheric prediction remains challenging under extreme weather conditions, particularly during geomagnetic storms. Forecasting the $ foF2 $
critical frequency encounters challenges due to the complex and nonlinear relationship between ionospheric parameters, the volatile nature of the ionosphere, model bias, and limitations of input parameters. Scientists have made efforts to determine which parameters are most affected by changes in
$ foF2 $
critical frequency encounters challenges due to the complex and nonlinear relationship between ionospheric parameters, the volatile nature of the ionosphere, model bias, and limitations of input parameters. Scientists have made efforts to determine which parameters are most affected by changes in $ foF2 $
. Geomagnetic indices, such as
$ foF2 $
. Geomagnetic indices, such as $ ap $
and
$ ap $
and $ Kp $
, are considered significant indicators of geomagnetic activity that impact the ionosphere (Gruet et al., Reference Gruet, Chandorkar, Sicard and Camporeale2018; Jakowski et al., Reference Jakowski, Stankov, Schlueter and Klaehn2006). The sunspot number (
$ Kp $
, are considered significant indicators of geomagnetic activity that impact the ionosphere (Gruet et al., Reference Gruet, Chandorkar, Sicard and Camporeale2018; Jakowski et al., Reference Jakowski, Stankov, Schlueter and Klaehn2006). The sunspot number ( $ Rz $
), solar flux (
$ Rz $
), solar flux ( $ F10.7 $
), and zenith angle are also closely linked to ionospheric variations (Chen et al., Reference Chen, Liu and Chen2000; Blagoveshchensky et al., Reference Blagoveshchensky, Sergeeva and Kozlovsky2017; Zhang et al., Reference Zhang, Zhao, Feng, Liu, Xiang, Li and Lu2022). Identifying the most relevant and effective parameters is still an important area of research.
$ F10.7 $
), and zenith angle are also closely linked to ionospheric variations (Chen et al., Reference Chen, Liu and Chen2000; Blagoveshchensky et al., Reference Blagoveshchensky, Sergeeva and Kozlovsky2017; Zhang et al., Reference Zhang, Zhao, Feng, Liu, Xiang, Li and Lu2022). Identifying the most relevant and effective parameters is still an important area of research.
At present, the complex behavior of the ionosphere cannot be fully encapsulated by any single model across all regions and geomagnetic conditions. Several models, such as the International Reference Ionosphere (IRI) and the Global Ionosphere-Thermosphere Model (GITM), are designed to focus on specific regions or concentrate on particular aspects of ionospheric behavior (Bilitza et al., Reference Bilitza, McKinnell, Reinisch and Fuller-Rowell2011; Ridley et al., Reference Ridley, Deng and Toth2006). In comparison, these models offer predictions but have limitations in their global applicability. Admittedly, data collection and sharing across organizations and countries need to be more consistent to compile detailed and comprehensive data sets. Despite these efforts, accurate prediction under extreme weather conditions, especially during geomagnetic storms, remains a challenge.
1.1. Previous studies
In recent years, machine learning methods have been applied to analyze large data sets and identify patterns, demonstrating high sensitivity and accuracy prediction improvement. The linear regression algorithm is one of the most established and comprehended algorithms in statistics and machine learning. It is easy to implement and interpret, as well as it is computationally efficient. However, linear regression assumes that the independent and dependent variables are linear, which may not always be the case in the ionosphere (Liu et al., Reference Liu, Wan and Ning2004). Moreover, linear regression can be sensitive to outliers and may not perform well with noisy data (Jakowski et al., Reference Jakowski, Stankov, Schlueter and Klaehn2003). Therefore, due to these limitations, other more complex models, such as decision trees, random forests, and neural networks, are often used instead. Decision trees have been used in ionospheric prediction to classify ionospheric disturbances, estimate ionosphere parameters, and predict the occurrence of geomagnetic storms. Decision trees can handle categorical, numerical, missing data, and outliers (Liemohn et al., Reference Liemohn, McCollough, Jordanova, Ngwira, Morley, Cid and Vasile2018; Twala, Reference Twala2009). They are both fast and efficient regarding training, and prediction (Patel et al., Reference Patel, Prajapati and Lakhtaria2012). They can handle high-dimensional data with numerous features (Lin et al., Reference Lin, Shen, Shi, Hengel and Suter2014). However, decision trees have some limitations, such as overfitting, lack of interpretability, instability, and bias toward categorical variables, making them less suitable for specific predictions (Loh, Reference Loh2014).
A multilayer perceptron (MLP) is an artificial neural network (ANN) capable of approximating any continuous function to arbitrary accuracy, handling non-linear relationships, and modeling complex systems (Gardner & Dorling, Reference Gardner and Dorling1998). Several things could be improved by using MLP for prediction tasks. The first is overfitting, which occurs when a model becomes too complex. Another reason is that MLP is computationally more expensive than statistical models (Fukumizu, Reference Fukumizu2001). As well as, MLPs are not suitable for problems with a temporal or spatial structure as they do not have any memory (Ramchoun et al., Reference Ramchoun, Ghanou, Ettaouil and Janati2016). Francis et al. (2001) used a non-linear prediction of the hourly $ foF2 $
time series in conjunction with missing data point interpolation (Francis et al., Reference Francis, Brown, Cannon and Broomhead2010). Many researchers have extensively explored the forecast of ionospheric
$ foF2 $
time series in conjunction with missing data point interpolation (Francis et al., Reference Francis, Brown, Cannon and Broomhead2010). Many researchers have extensively explored the forecast of ionospheric $ foF2 $
variability for short-term prediction by using long short-term memory (LSTM). LSTMs are particularly well-suited for dealing with sequential data and long-term dependencies, allowing them to make predictions while considering the context and history of the input data (Zhao et al., Reference Zhao, Yang, Yang, Zhu, Meng, Han and Bu2021). LSTMs have been used to predict ionosphere parameters, classify ionospheric disturbances, and predict geomagnetic storm occurrence. For example,
$ foF2 $
variability for short-term prediction by using long short-term memory (LSTM). LSTMs are particularly well-suited for dealing with sequential data and long-term dependencies, allowing them to make predictions while considering the context and history of the input data (Zhao et al., Reference Zhao, Yang, Yang, Zhu, Meng, Han and Bu2021). LSTMs have been used to predict ionosphere parameters, classify ionospheric disturbances, and predict geomagnetic storm occurrence. For example, $ foF2 $
prediction was developed 1–5 hours ahead (McKinnell & Oyeyemi, Reference McKinnell and Oyeyemi2009; Oyeyemi et al., Reference Oyeyemi, McKinnell and Poole2006; Oyeyemi et al., Reference Oyeyemi, Poole and McKinnell2005) and 1–24 hours ahead (Nakamura et al., Reference Nakamura, Maruyama and Shidama2007; Twala, Reference Twala2000). Li et al. (2021) applied the LSTM model for
$ foF2 $
prediction was developed 1–5 hours ahead (McKinnell & Oyeyemi, Reference McKinnell and Oyeyemi2009; Oyeyemi et al., Reference Oyeyemi, McKinnell and Poole2006; Oyeyemi et al., Reference Oyeyemi, Poole and McKinnell2005) and 1–24 hours ahead (Nakamura et al., Reference Nakamura, Maruyama and Shidama2007; Twala, Reference Twala2000). Li et al. (2021) applied the LSTM model for $ foF2 $
forecasting by using previous values of
$ foF2 $
forecasting by using previous values of $ foF2 $
among other input parameters with ionosonde stations covering a part of China and Australia (Li et al., Reference Li, Zhou, Tang, Zhao, Zhang, Xia and Liu2021). Zhao et al. (2019) used a genetic algorithm-based neural network (GA-NN) to forecast
$ foF2 $
among other input parameters with ionosonde stations covering a part of China and Australia (Li et al., Reference Li, Zhou, Tang, Zhao, Zhang, Xia and Liu2021). Zhao et al. (2019) used a genetic algorithm-based neural network (GA-NN) to forecast $ foF2 $
disturbances (Zhao et al., Reference Zhao, Li, Liu, Wang and Zhou2019). The results showed that predictions 1 hour ahead performed better than 3, 6, 12, and 24 hours ahead.
$ foF2 $
disturbances (Zhao et al., Reference Zhao, Li, Liu, Wang and Zhou2019). The results showed that predictions 1 hour ahead performed better than 3, 6, 12, and 24 hours ahead.
Bi (2022) created a hybrid neural network consisting of a convolutional neural network (CNN) and bidirectional long short-term memory (BiLSTM) for forecasting foF2 variations in the low latitude region during low and high solar activity years, with a $ MAPE $
of 22.7% in 2014 (Bi et al., Reference Bi, Wu, Li, Chang and Yong2022). Two different approaches of two different time-series models were used to predict the
$ MAPE $
of 22.7% in 2014 (Bi et al., Reference Bi, Wu, Li, Chang and Yong2022). Two different approaches of two different time-series models were used to predict the $ foF2 $
critical frequency over Athens, Greece, between 2004 and 2018, with a
$ foF2 $
critical frequency over Athens, Greece, between 2004 and 2018, with a $ MAPE $
of 5.56% by Atıcı et al. (Atıcı & Pala, Reference Atıcı and Pala2022). The AdaBoost-BP algorithm is used to predict the foF2 critical frequency one hour ahead by Zhao et al. with the prediction of 0.78 MHz absolute error at Taipei station (Zhao et al., Reference Zhao, Ning, Liu and Song2014).
$ MAPE $
of 5.56% by Atıcı et al. (Atıcı & Pala, Reference Atıcı and Pala2022). The AdaBoost-BP algorithm is used to predict the foF2 critical frequency one hour ahead by Zhao et al. with the prediction of 0.78 MHz absolute error at Taipei station (Zhao et al., Reference Zhao, Ning, Liu and Song2014).
This paper focuses on developing accurate $ foF2 $
critical frequency prediction using the LSTM model covering mid and high latitudes. The research emphazises the importance of developing reliable forecasting methods for different geographical locations up to 24 hours in advance. As far as existing long-term prediction models of
$ foF2 $
critical frequency prediction using the LSTM model covering mid and high latitudes. The research emphazises the importance of developing reliable forecasting methods for different geographical locations up to 24 hours in advance. As far as existing long-term prediction models of $ foF2 $
cannot provide reliable performance accuracy, the article mainly focuses on short-term prediction, using planetary and geomagnetic indices as input parameters. The paper depicts the prediction results for 1, 2, 6, 12, 18, and 24 hours ahead at the various stations. The results are compared at high and middle latitudes during maximum and minimum solar activity.
$ foF2 $
cannot provide reliable performance accuracy, the article mainly focuses on short-term prediction, using planetary and geomagnetic indices as input parameters. The paper depicts the prediction results for 1, 2, 6, 12, 18, and 24 hours ahead at the various stations. The results are compared at high and middle latitudes during maximum and minimum solar activity.
In this article, we aim to develop a model that can accurately predict changes in the ionosphere using minimal computational resources. The model’s potential implications extend to enhancing our understanding of the Earth’s upper atmosphere and mitigating space weather effects. Section 1 describes the main problem and previous studies. Section 2 illustrates the developed ionospheric forecasting model, the machine learning process, data description, station selection, and the comparison of the other developed models. Section 3 discusses the prediction results and their dependencies. Finally, Section 4 offers concluding remarks.
2. Methodology
The study’s methodology consists of three main steps: data collection, model development and implementation, and model performance evaluation.
2.1. Dataset description and input parameters
The importance of geomagnetic and ionospheric indexes is emphazised in the introduction section. They provide valuable information about the complex interactions between the Earth’s magnetic field and the ionosphere and aid in improving the accuracy of ionospheric predictions. The geomagnetic and ionospheric information was downloaded from NASA https://omniweb.gsfc.nasa.gov/ow.html (accessed on 15 January 2023) (https://ccmc.gsfc.nasa.gov/) and Data Analysis Center for Geomagnetism and Space Magnetism https://wdc.kugi.kyoto-u.ac.jp/dstdir/ (accessed on 15 January 2023) (https://wdc.kugi.kyoto-u.ac.jp/dstdir/).
The input parameters of the ionospheric foF2 forecasting model, related to the ionospheric variability in time, space, solar, and geomagnetic activity, are described as follows:
-
1. To account for the influence of the number of days in a year on ionospheric $ foF2 $
variations (Chen et al., Reference Chen, Liu and Chen2000), (Myles et al., Reference Myles, Feudale, Liu, Woody and Brown2004), a day number (
$ DN $
) is converted into sine and cosine components as follows:
$ foF2 $
variations (Chen et al., Reference Chen, Liu and Chen2000), (Myles et al., Reference Myles, Feudale, Liu, Woody and Brown2004), a day number (
$ DN $
) is converted into sine and cosine components as follows:


 $$ DNS=\sin \left(\frac{2\pi \times DAY}{365}\right) $$
 $$ DNC=\cos \left(\frac{2\pi \times DAY}{365}\right) $$
-
2. The universal time altered the ionospheric storm occurrence, and adjustments are made accordingly for different times (Wintoft & Cander, Reference Wintoft and Cander2000).
 $$ UT S=\sin \left(\frac{2\pi \times UT}{24}\right) $$
 $$ UT C=\cos \left(\frac{2\pi \times UT}{24}\right) $$
-
3. The solar zenith angle is transformed using the provided formulas to calculate the sine (
$ CHIS $
) and cosine (
$ CHIC $
) components:


 $$ CHI S=\sin \left(\frac{2\pi \times CHI}{360}\right) $$
 $$ CHI C=\cos \left(\frac{2\pi \times CHI}{360}\right) $$
-
4. The
$ ap $
index uses a time-weighted accumulation series calculated from the geomagnetic planetary index
$ ap $
(Wrenn, Reference Wrenn1987). This study uses a constant factor of attenuation multiplier, called
$ \tau $
, ranging from 0 to 1. In this article,
$ \tau $
is set to 0.8. The initial value of the magnetic index is
$ {ap}_0 $
, while
$ {ap}_{-1} $
,
$ {ap}_{-2} $
, and
$ {ap}_{-11} $
represents the values 3 hours before, 6 hours before, and 33 hours before, respectively.


 $$ ap\left(\tau \right)=\left(1-\tau \right)\sum \limits_{i=0}^{11}{\left(\tau \right)}^i\times {ap}_{-i} $$
-
5. Based on previous research, there is a significant correlation between the geomagnetic index
$ Dst $
,
$ Kp $
and
$ foF2 $
(Kutiev & Muhtarov, Reference Kutiev and Muhtarov2001). As a result, we also consider
$ Dst $
and
$ Kp $
as input parameters similar to
$ ap $
and define them as follows:


 $$ Dst\left(\tau \right)=\left(1-\tau \right)\sum \limits_{i=0}^{11}{\left(\tau \right)}^i\times {Dst}_{-i} $$
-
6. The first differences in the
$ Kp $
values are taken to achieve stationarity of the
$ Kp $
index. This involves computing the difference between each
$ Kp $
value
$ \left( Kp(t)\right) $
and its previous value
$ \left( Kp\left(t-1\right)\right) $
, denoted as
$ \Delta Kp(t)= Kp(t)- Kp\left(t-1\right) $
.


 $$ \Delta Kp(t)={\beta}_0+{\beta}_1\Delta Kp\left(t-1\right)+{\beta}_2\Delta Kp\left(t-2\right)+\dots +{\beta}_{18}\Delta Kp\left(t-18\right)+\varepsilon (t) $$
Here, $ \Delta Kp(t) $
refers to the first differences of the
$ \Delta Kp(t) $
refers to the first differences of the $ Kp $
index at time
$ Kp $
index at time $ t $
and
$ t $
and $ \Delta Kp\left(t-1\right) $
to
$ \Delta Kp\left(t-1\right) $
to $ \Delta Kp\left(t-18\right) $
represents the lagged first differences of the
$ \Delta Kp\left(t-18\right) $
represents the lagged first differences of the $ Kp $
index up to 18-time steps. The coefficients
$ Kp $
index up to 18-time steps. The coefficients $ {\beta}_0 $
to
$ {\beta}_0 $
to $ {\beta}_{18} $
in the model capture the impact of these lagged differences on the current value
$ {\beta}_{18} $
in the model capture the impact of these lagged differences on the current value $ \Delta Kp(t) $
, and
$ \Delta Kp(t) $
, and $ \varepsilon (t) $
represents the error term. To estimate the coefficients
$ \varepsilon (t) $
represents the error term. To estimate the coefficients $ \varepsilon (t) $
, we apply the least squares method using a matrix (
$ \varepsilon (t) $
, we apply the least squares method using a matrix ( $ X $
) containing the lagged first differences and a vector (
$ X $
) containing the lagged first differences and a vector ( $ Y $
) with the first differences of the
$ Y $
) with the first differences of the $ Kp $
index. The formula to estimate the coefficients is
$ Kp $
index. The formula to estimate the coefficients is $ \beta ={\left({X}^{\prime }X\right)}^{\left(-1\right)}{X}^{\prime }Y $
. In this work, set
$ \beta ={\left({X}^{\prime }X\right)}^{\left(-1\right)}{X}^{\prime }Y $
. In this work, set $ T $
= 18 hours (Wang et al., Reference Wang, Shi, Wang, Zherebtsov and Pirog2008).
$ T $
= 18 hours (Wang et al., Reference Wang, Shi, Wang, Zherebtsov and Pirog2008).
-
7. The characteristics of the ionospheric
$ F $
layer are affected by the wind in the thermosphere. According to the vertical ion drift equation (Oyeyemi et al., Reference Oyeyemi, Poole and McKinnell2005), this is the case.

 $$ W=U\times \sin \left(\theta -D\right)\times \cos I\times \sin I $$ $ W $
represents the vertical ion drift velocity,
$ W $
represents the vertical ion drift velocity, $ U $
represents the horizontal wind velocity, and
$ U $
represents the horizontal wind velocity, and $ \theta $
is the geographic azimuth angle. Additionally, we denote magnetic declination and inclination as
$ \theta $
is the geographic azimuth angle. Additionally, we denote magnetic declination and inclination as $ D $
and
$ D $
and $ I $
, respectively. To decompose
$ I $
, respectively. To decompose $ D $
into sine and cosine components, we use
$ D $
into sine and cosine components, we use $ DS $
and
$ DS $
and $ DC $
. Similarly,
$ DC $
. Similarly, $ I $
is transformed into its sine component,
$ I $
is transformed into its sine component, $ IS $
.
$ IS $
.
 $$ DS=\sin \left(\frac{2\pi \times D}{360}\right) $$
 $$ DC=\cos \left(\frac{2\pi \times D}{360}\right) $$
 $$ IS=\sin \left(\frac{2\pi \times I}{360}\right) $$
-
8. According to studies on the
$ F2 $
layer,
$ foF2 $
values are significantly influenced by previous hour values (Oyeyemi et al., Reference Oyeyemi, Poole and McKinnell2005). Our model uses the relative deviation formula to account for this dependence.


 $$ {\Delta}_1(h)={f}_0{F}_0(h)+{f}_0{F}_2\left(h-1\right) $$
 $$ \Delta R(h)=\frac{\Delta_1(h)}{f_0{F}_2(h)} $$
-
9. The sunspot number, also known as
$ Rz $
, is widely used as an input in various ionosphere models, such as the International Radio Consultative Committee
$ foF2 $
model (Wrenn, Reference Wrenn1987). This is because
$ Rz $
can effectively map the ionospheric
$ foF2 $
response to changes in solar output. Therefore, we have included
$ Rz $
as an input factor in our models.


This research focuses on ionospheric $ foF2 $
critical frequency forecasting at mid and high latitudes, using hourly time-series data from 5 stations worldwide (Table 1 and Figure 1). The data is collected for 2012, 2015, and 2009, 2019, as these years represent the maximum and minimum solar activity, correspondingly (Barta et al., Reference Barta, Sátori, Berényi, Kis and Williams2019). Solar activity variations of 11 years are essential for decadal variations in the solar-terrestrial environment (Gnevyshev, Reference Gnevyshev1977; Ohmura, Reference Ohmura2009). This article investigates the critical frequency variations based on the 24th solar cycle from 2008 to 2019.
$ foF2 $
critical frequency forecasting at mid and high latitudes, using hourly time-series data from 5 stations worldwide (Table 1 and Figure 1). The data is collected for 2012, 2015, and 2009, 2019, as these years represent the maximum and minimum solar activity, correspondingly (Barta et al., Reference Barta, Sátori, Berényi, Kis and Williams2019). Solar activity variations of 11 years are essential for decadal variations in the solar-terrestrial environment (Gnevyshev, Reference Gnevyshev1977; Ohmura, Reference Ohmura2009). This article investigates the critical frequency variations based on the 24th solar cycle from 2008 to 2019.
The geographical locations and coordinates of the selected stations

A map of the stations’ spatial distribution, marked by red dots.

2.2. The developed LSTM model
Working with time-series data requires understanding a system’s dynamics, such as its periodic cycles, how the data changes over time, its regular variations, and its sudden changes. LSTM networks are recurrent neural networks designed to avoid the long-term dependency problem by learning order vulnerability in sequence from time-series data (Hochreiter & Schmidhuber, Reference Hochreiter and Schmidhuber1997).
The LSTM network consists of the following stages: the forget gate, cell state, input gate, and output gate (Figure 2). One of the essential properties of the LSTM is its ability to memorize and recognize information that enters the network and to discard information that is not required by the network to learn and make predictions (Yu et al., Reference Yu, Si, Hu and Zhang2019). The forget gate determines whether or not information can pass through the network’s layers. It expects two types of input: the information from the previous layers and information from the current layer.
The LSTM block diagram, the repeating module in LSTM, with four interacting layers.

Furthermore, LSTMs have a chain structure with four neural network layers interacting uniquely (Gonzalez & Yu, Reference Gonzalez and Yu2018). The LSTM algorithm relies on the cell state, represented by the horizontal line running across the top of the diagram, and is crucial in information transmission (Gers et al., Reference Gers, Schmidhuber and Cummins2000). The LSTM can remove or add information to the cell state, which is carefully controlled by gate structures. Gates allow information to pass through if desired (Yu et al., Reference Yu, Si, Hu and Zhang2019). The “forget gate layer” is a sigmoid layer that removes information that is no longer relevant or useful for further predictions. It examines $ {h}_{t-1} $
(a hidden state at the timestamp
$ {h}_{t-1} $
(a hidden state at the timestamp $ t-1 $
) and
$ t-1 $
) and $ {x}_t $
(the input vector at the timestamp
$ {x}_t $
(the input vector at the timestamp $ t $
) and returns a number between 0 and 1 for each number in the cell state
$ t $
) and returns a number between 0 and 1 for each number in the cell state $ {C}_{\left(t-1\right)} $
. Number 1 indicates “completely keep,” while number 0 indicates “completely remove” where
$ {C}_{\left(t-1\right)} $
. Number 1 indicates “completely keep,” while number 0 indicates “completely remove” where $ {h}_t $
represents a hidden state at the current timestamp
$ {h}_t $
represents a hidden state at the current timestamp $ t $
. The updated cell from the cell state is passed to the
$ t $
. The updated cell from the cell state is passed to the $ \tanh $
, an activation function, which is then multiplied by the output state’s sigmoid function. After calculating the hidden state at the timestamp
$ \tanh $
, an activation function, which is then multiplied by the output state’s sigmoid function. After calculating the hidden state at the timestamp $ t $
, the value is returned to the recurrent unit and combined with the input at the timestamp
$ t $
, the value is returned to the recurrent unit and combined with the input at the timestamp $ t+1 $
. The same procedure is repeated for
$ t+1 $
. The same procedure is repeated for $ t+2,t+3,\dots, t+n $
timestamps until the desired number
$ t+2,t+3,\dots, t+n $
timestamps until the desired number $ n $
of timestamps is reached.
$ n $
of timestamps is reached.
 $$ {f}_t=\sigma \left({x}_t\times {u}_t+{h}_{t-1}\times {w}_t\right) $$
 $$ {\hat{c}}_t=\tanh \left({x}_t\times {u}_c+{h}_{t-1}\times {w}_c\right) $$
 $$ {i}_t=\sigma \left({x}_t\times {u}_i+{h}_{t-1}\times {w}_i\right) $$
 $$ {o}_t=\sigma \left({x}_t\times {u}_o+{h}_{t-1}\times {w}_o\right) $$
 $$ {c}_t={f}_t\times {u}_{t-1}+{i}_t\times {\hat{c}}_t $$
 $$ {h}_t={o}_t\times \tanh \left({c}_t\right) $$
Where: $ {x}_t $
is the input vector,
$ {x}_t $
is the input vector, $ {h}_{t-1} $
is the previous cell output,
$ {h}_{t-1} $
is the previous cell output, $ {C}_{t-1} $
is the previous cell memory,
$ {C}_{t-1} $
is the previous cell memory, $ {h}_t $
is the current cell output,
$ {h}_t $
is the current cell output, $ {c}_t $
is the current cell memory and
$ {c}_t $
is the current cell memory and $ w $
,
$ w $
, $ u $
are weight vector for forget gate (
$ u $
are weight vector for forget gate ( $ f $
), candidate (
$ f $
), candidate ( $ c $
),
$ c $
), $ i/p $
is the gate (
$ i/p $
is the gate ( $ i $
) and
$ i $
) and $ o/p $
is the gate (
$ o/p $
is the gate ( $ o $
).
$ o $
).
2.3. Network configuration
Figure 3 depicts the input parameters of the LSTM model. The developed LSTM model has 14 input parameters fed into the LSTM neural network, as described in Section 2.1. The proposed model has 14 input variables connected to 36 LSTM units, 12 units of dense layer, and one output layer. The objective of the LSTM model is to extract significant and representative features from the historical data. Various experiments are conducted using different hyperparameters and LSTM units to obtain an optimal architecture, taking inspiration from previous research studies (Reimers & Gurevych, Reference Reimers and Gurevych2017). A developed configuration for the LSTM model is derived after a meticulous evaluation process. The activation function is set to $ Relu $
to handle non-linear relationships effectively (Yadav et al., Reference Yadav, Jha and Sharan2020). A batch size of 15 is found to balance efficiency and capture meaningful patterns. Through iterative fine-tuning of parameters and learning, the model is trained for 200 epochs. This LSTM configuration has demonstrated superior performance and is anticipated to produce accurate predictions for the given task.
$ Relu $
to handle non-linear relationships effectively (Yadav et al., Reference Yadav, Jha and Sharan2020). A batch size of 15 is found to balance efficiency and capture meaningful patterns. Through iterative fine-tuning of parameters and learning, the model is trained for 200 epochs. This LSTM configuration has demonstrated superior performance and is anticipated to produce accurate predictions for the given task.
A block diagram of the proposed LSTM model with input parameters.

2.4. Output parameters
The current study focuses primarily on the storm-time $ foF2 $
forecast. As output parameters, 1, 2, 6, 12, 18, and 24 hours ahead prediction results are demonstrated for years with maximum and minimum solar activity.
$ foF2 $
forecast. As output parameters, 1, 2, 6, 12, 18, and 24 hours ahead prediction results are demonstrated for years with maximum and minimum solar activity.
2.5. The machine learning process
Figure 4 presents a comprehensive overview of the methodology utilized in constructing a machine-learning model. The process entails sequential steps, including pre-processing, normalization, model training, model testing, and model evaluation (El Naqa & Murphy, Reference El Naqa and Murphy2015). The article uses the temporal segmentation technique to address seasonal changes in time-series data, which involves dividing the data into segments corresponding to different months or recurring temporal patterns. Segmenting data by several months and time ensures that each season is equally represented, reducing the risk of skewed model performance. Additionally, splitting the data optimizes model performance by aligning with the network’s strengths, mitigating biases, enhancing generalization, and facilitating comprehensive evaluation (Lovrić et al., Reference Lovrić, Milanović and Stamenković2014).
A generalized diagram depicting the process of developing a machine learning model.
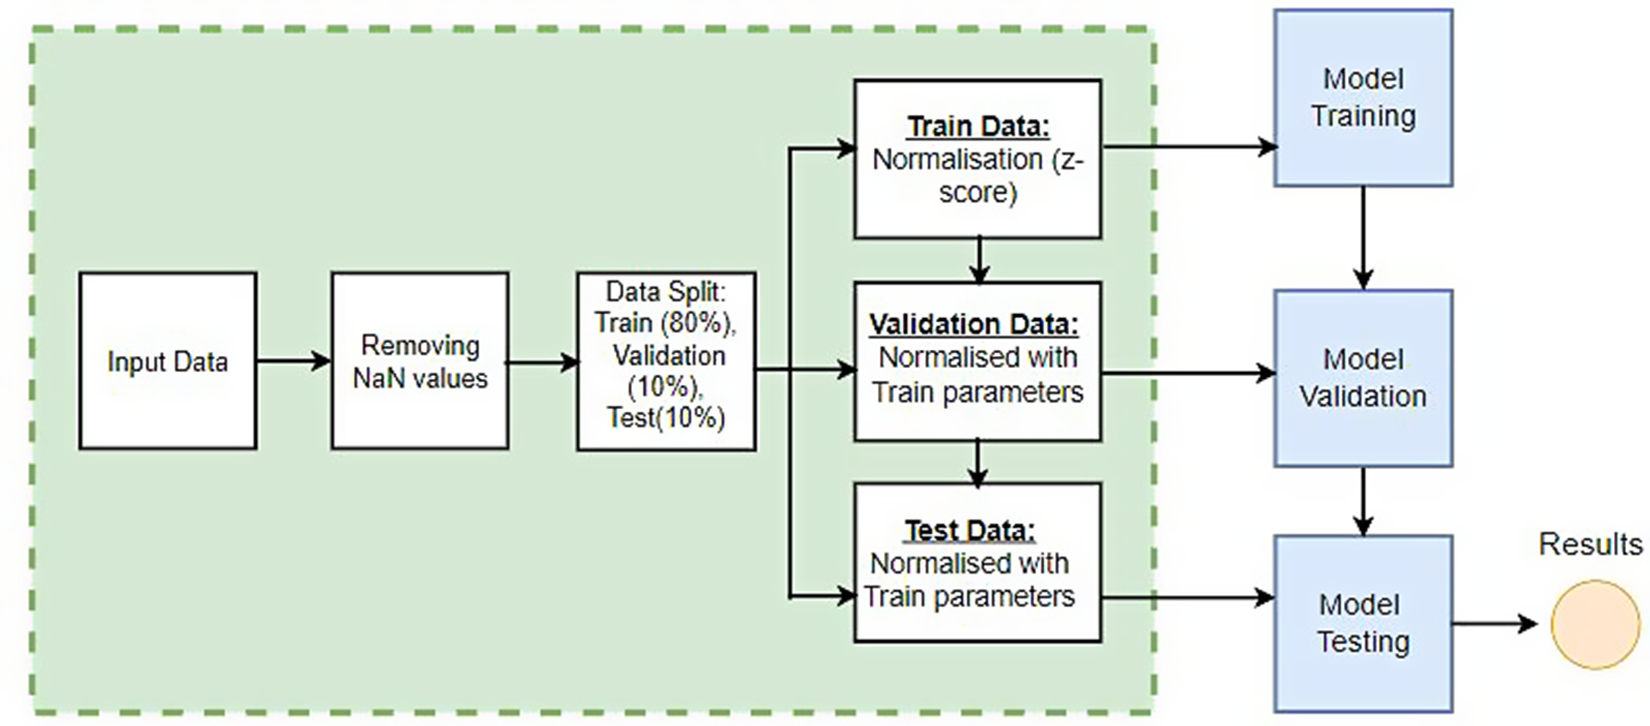
The dataset is divided into three subsets: 80% for training, 10% for validation, and 10% for testing. However, a non-shuffled approach is adopted to preserve temporal information and mitigate potential seasonal bias errors. It is important to note that a non-shuffled approach preserves temporal information. To improve the accuracy of our methodology, we use a refined approach. Firstly, the data is divided into four separate segments, each representing a three-month period. These segments are then assigned to training, validation, and test subsets based on predetermined percentages. This process is repeated every three months, ensuring that the training, validation, and test datasets are evenly distributed. The reason for using this approach is based on the robust capabilities of LSTM networks in dealing with sequential data. This method capitalizes on LSTM’s ability to capture temporal patterns, thus enhancing model performance. Essentially, the sequential partitioning method not only utilizes the power of LSTM but also effectively eliminates any potential seasonal distortions. This meticulous approach results in improved overall quality in model development and outcomes.
Data pre-processing is an important step that involves cleaning, transforming, normalizing, and organizing raw data into a format suitable for analysis (Károly et al., Reference Károly, Galambos, Kuti and Rudas2020; Rinnan et al., Reference Rinnan, Berg, Thygesen, Bro and Engelsen2009; Rinnan et al., Reference Rinnan, Berg, Thygesen, Bro and Engelsen2020). Pre-processing’s primary function is handling missing data and inconsistencies in raw data. After clean data is performed, selected parameters are used as model inputs; parameter preparation is described in Section 2.1.
The time-series data, which is associated with ionospheric deviations, is inputted into the network. The input sequence is gradually shifted to predict the ionospheric behavior at various future time points. This involves incrementally shifting the data from 1 hour up to 24 hours for each testing instance. The result of this shifting procedure is a set of input-output pairs, where the input consists of past observations up to a particular time, and the output is the prediction for a specific time point in the future. The generalized process can be described as follows:
 $$ foF{2}_{\left(t+i\right)}=f\left({UTS}_t,{UTC}_t,{HIS}_t,{HIC}_t,{DNS}_t,{DNC}_t,{DS T}_t,{ap}_t,{Kp}_t,{DS}_t,{DC}_t,{IS}_t,{Rz}_t,\Delta {R}_t\right) $$
where $ t $
indicates time and
$ t $
indicates time and $ i $
depicts prediction hour (up to 24 hours).
$ i $
depicts prediction hour (up to 24 hours).
The mean absolute percentage error ( $ MAPE $
), root mean square error (
$ MAPE $
), root mean square error ( $ RMSE $
) and mean absolute error (
$ RMSE $
) and mean absolute error ( $ MAE $
) were chosen to measure the predictive accuracy of the developed model. (Jakowski et al., Reference Jakowski, Stankov, Schlueter and Klaehn2017). The
$ MAE $
) were chosen to measure the predictive accuracy of the developed model. (Jakowski et al., Reference Jakowski, Stankov, Schlueter and Klaehn2017). The $ foF2 $
forecasting performance was compared to the other three algorithms. The
$ foF2 $
forecasting performance was compared to the other three algorithms. The $ MAPE $
,
$ MAPE $
, $ RMSE $
, and
$ RMSE $
, and $ MAE $
are defined as follows:
$ MAE $
are defined as follows:
 $$ MAPE=\frac{1}{n}\sum \limits_i^n\left|\frac{\ foF{2}_{act}- foF{2}_{pred}}{foF{2}_{act}}\times 100\right| $$
 $$ RMSE=\sqrt{\sum \limits_i^n\frac{{\left(\ foF{2}_{act}- foF{2}_{pred}\right)}^2}{N}} $$
 $$ MAE=\sum \limits_i^n\left|\frac{\ foF{2}_{act}- foF{2}_{pred}}{N}\right| $$
where n is the number of summation iterations, $ foF{2}_{act} $
is the actual value,
$ foF{2}_{act} $
is the actual value, $ foF{2}_{pred} $
is the predicted value. A low accuracy rate value indicates that the model’s predictions are close to the actual values, whereas a high accuracy rate value indicates that the model’s predictions are far off.
$ foF{2}_{pred} $
is the predicted value. A low accuracy rate value indicates that the model’s predictions are close to the actual values, whereas a high accuracy rate value indicates that the model’s predictions are far off.
2.6. Compared models
To evaluate the developed model performance, LSTM was compared to linear regression, decision trees, and MLP algorithms. Linear regression is a widely used method for data analysis (Montgomery et al., Reference Montgomery, Peck and Vining2021). It is good at finding the linear relationship in data sets by establishing the relationship between independent and dependent variables when performing a regression task (finding the best-fitting line). It denotes the existence of a linear relationship between dependent and independent variables. In a linear regression model, the dependent variable is modeled as a linear combination of the independent variables plus an error term (Weisberg, Reference Weisberg2005). The equation is written as follows:
 $$ y={\beta}_0+{\beta}_1\times {x}_1+{\beta}_2\times {x}_2+\cdots +{\beta}_n\times {x}_n+\varepsilon $$
The dependent variable is y, and the independent variables are $ {x}_1,{x}_2,\cdots, {x}_n $
. The coefficients (
$ {x}_1,{x}_2,\cdots, {x}_n $
. The coefficients ( $ {\beta}_0,{\beta}_1,{\beta}_2,\cdots, {\beta}_n $
) describe the strength of each independent variable’s relationship with the dependent variable.
$ {\beta}_0,{\beta}_1,{\beta}_2,\cdots, {\beta}_n $
) describe the strength of each independent variable’s relationship with the dependent variable. $ \varepsilon $
is the error, representing the difference between the predicted and actual value of the dependent variable.
$ \varepsilon $
is the error, representing the difference between the predicted and actual value of the dependent variable.
Decision Tree (DT), an effective tool that employs a tree-like model of decisions and their potential outcomes, was implemented for $ foF2 $
critical frequency forecasting up to 24 hours in advance (Iban & Şentürk, Reference Iban and Şentürk2022). A series of branches represent possible decisions and outcomes (Myles et al., Reference Myles, Feudale, Liu, Woody and Brown2004). A decision tree model’s prediction is based on the probabilities or scores associated with the leaf nodes where the data ends up (Lan et al., Reference Lan, Zhang, Jiang, Yang and Zha2018).
$ foF2 $
critical frequency forecasting up to 24 hours in advance (Iban & Şentürk, Reference Iban and Şentürk2022). A series of branches represent possible decisions and outcomes (Myles et al., Reference Myles, Feudale, Liu, Woody and Brown2004). A decision tree model’s prediction is based on the probabilities or scores associated with the leaf nodes where the data ends up (Lan et al., Reference Lan, Zhang, Jiang, Yang and Zha2018).
MLP was developed for $ foF2 $
ionospheric disturbances forecasting, composed of multiple layers of interconnected “neurons.” MLP’s ability to have many hidden layers between the input and output increases complexity and density. The MLP models have been used to forecast air quality, daily solar radiation, and solar activity (Elizondo & McClendon, Reference Elizondo and McClendon1994). A comprehensive description of the developed Decision Tree and MLP models, along with their corresponding block diagrams and hyperparameters, is provided in Supplementary Material.
$ foF2 $
ionospheric disturbances forecasting, composed of multiple layers of interconnected “neurons.” MLP’s ability to have many hidden layers between the input and output increases complexity and density. The MLP models have been used to forecast air quality, daily solar radiation, and solar activity (Elizondo & McClendon, Reference Elizondo and McClendon1994). A comprehensive description of the developed Decision Tree and MLP models, along with their corresponding block diagrams and hyperparameters, is provided in Supplementary Material.
3. Obtained results discussion
The developed algorithms generate comprehensive evaluations encompassing $ RMSE $
,
$ RMSE $
, $ MAE $
and
$ MAE $
and $ MAPE $
. The definitions of these criteria are expressed in the Formulas above. The LSTM model’s effectiveness is evaluated by comparing the obtained results to the other three machine learning algorithms. Table 2 shows the average accuracy of the
$ MAPE $
. The definitions of these criteria are expressed in the Formulas above. The LSTM model’s effectiveness is evaluated by comparing the obtained results to the other three machine learning algorithms. Table 2 shows the average accuracy of the $ foF2 $
predicted values across all selected stations and years, according to maximum and minimum solar activity for the 1st, 12th, and 24th hour. The complete results of
$ foF2 $
predicted values across all selected stations and years, according to maximum and minimum solar activity for the 1st, 12th, and 24th hour. The complete results of $ RMSE $
errors for all models presented during the specified period for each station are available in Appendix 8. Please refer to Appendix 8 for further details. Additionally, all research findings have been made publicly accessible via the project’s GitHub page, ensuring open access to the results for interested parties.
$ RMSE $
errors for all models presented during the specified period for each station are available in Appendix 8. Please refer to Appendix 8 for further details. Additionally, all research findings have been made publicly accessible via the project’s GitHub page, ensuring open access to the results for interested parties.
The average errors of $ foF2 $
predicted values across all the stations for the 1st prediction hour
$ foF2 $
predicted values across all the stations for the 1st prediction hour

The complex relationship between the input variables and the $ foF2 $
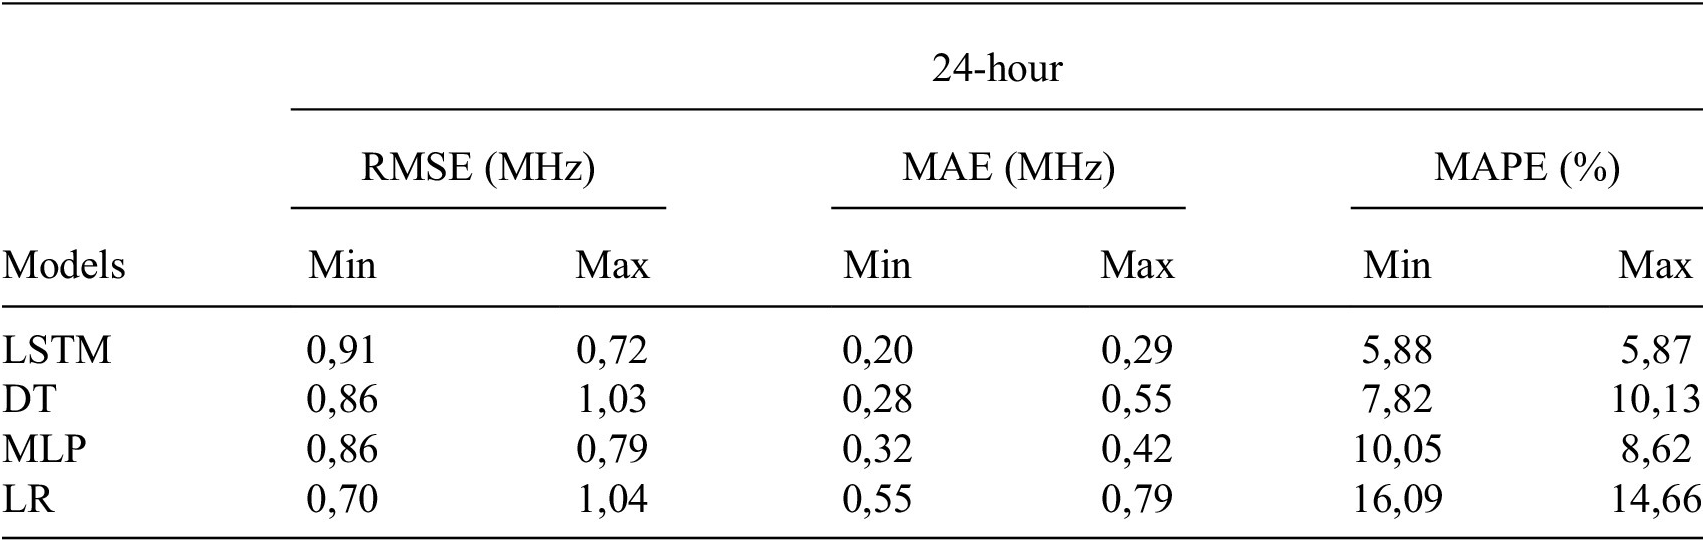
values is effectively captured by the LSTM model, as evidenced by its performance metrics. Specifically, the LSTM model yields average MAPE errors of 3.27% and 3.07%, average RMSE errors of 0.91 and 0.72 (in MHz), and average MAE errors (in MHz) of 0.20 and 0.29 for the first prediction hour across all stations during both solar minimum and maximum periods (refer to Table 2). Notably, for each station, the LSTM model consistently demonstrates lower MAPE values, particularly evident for the 12th prediction hour, where average errors are recorded as 4.70% and 4.68%, while average RMSE errors are 0.33 (in MHz) and 0.55 (in MHz), with corresponding average MAE errors (in MHz) of 0.16 and 0.24 during solar minimum and maximum, respectively (Table 3). Furthermore, during the 24th hour of prediction, the LSTM model yields average MAPE errors of 5.88% and 5.87% for solar minimum and maximum periods, respectively, with corresponding RMSE values of 0.91 (in MHz) and 0.72 (Table 4). The average MAE (in MHz) values are also observed to be 0.20 and 0.29 for solar minimum and maximum, respectively. The decision tree algorithm had a lower performance compared to LSTM and MLP models, indicating a complex relationship between models and data. This trend was consistently observed across nearly all stations and years, with only a negligible 3% of the results deviating from this observed pattern.
$ foF2 $
values is effectively captured by the LSTM model, as evidenced by its performance metrics. Specifically, the LSTM model yields average MAPE errors of 3.27% and 3.07%, average RMSE errors of 0.91 and 0.72 (in MHz), and average MAE errors (in MHz) of 0.20 and 0.29 for the first prediction hour across all stations during both solar minimum and maximum periods (refer to Table 2). Notably, for each station, the LSTM model consistently demonstrates lower MAPE values, particularly evident for the 12th prediction hour, where average errors are recorded as 4.70% and 4.68%, while average RMSE errors are 0.33 (in MHz) and 0.55 (in MHz), with corresponding average MAE errors (in MHz) of 0.16 and 0.24 during solar minimum and maximum, respectively (Table 3). Furthermore, during the 24th hour of prediction, the LSTM model yields average MAPE errors of 5.88% and 5.87% for solar minimum and maximum periods, respectively, with corresponding RMSE values of 0.91 (in MHz) and 0.72 (Table 4). The average MAE (in MHz) values are also observed to be 0.20 and 0.29 for solar minimum and maximum, respectively. The decision tree algorithm had a lower performance compared to LSTM and MLP models, indicating a complex relationship between models and data. This trend was consistently observed across nearly all stations and years, with only a negligible 3% of the results deviating from this observed pattern.
The average errors of $ foF2 $
predicted values across all the stations for the 12th prediction hour
$ foF2 $
predicted values across all the stations for the 12th prediction hour

The average errors of $ foF2 $
predicted values across all the stations for the 24th prediction hour
$ foF2 $
predicted values across all the stations for the 24th prediction hour
Figures 5, 6, 7, and 8 display the error plots of four developed models - LSTM, DT, MP, and LR during the years 2009, 2012, 2015, and 2019. For instance, at the Istanbul station, the LSTM model demonstrates the most favorable predictive accuracy, as indicated by the minimal error observed in the error-box plot, across all prediction hours (1, 2, 6, 12, 18, and 24). The LSTM error plots show narrower error bands and smaller deviations from the observed values, indicating its superior predictive capability.
Error plots of compared machine learning models for the Istanbul station for the 2009 year.

Error plots of compared machine learning models for the Istanbul station for the 2012 year.

Error plots of compared machine learning models for the Istanbul station for the 2015 year.

Error plots of compared machine learning models for the Istanbul station for the 2019 year.
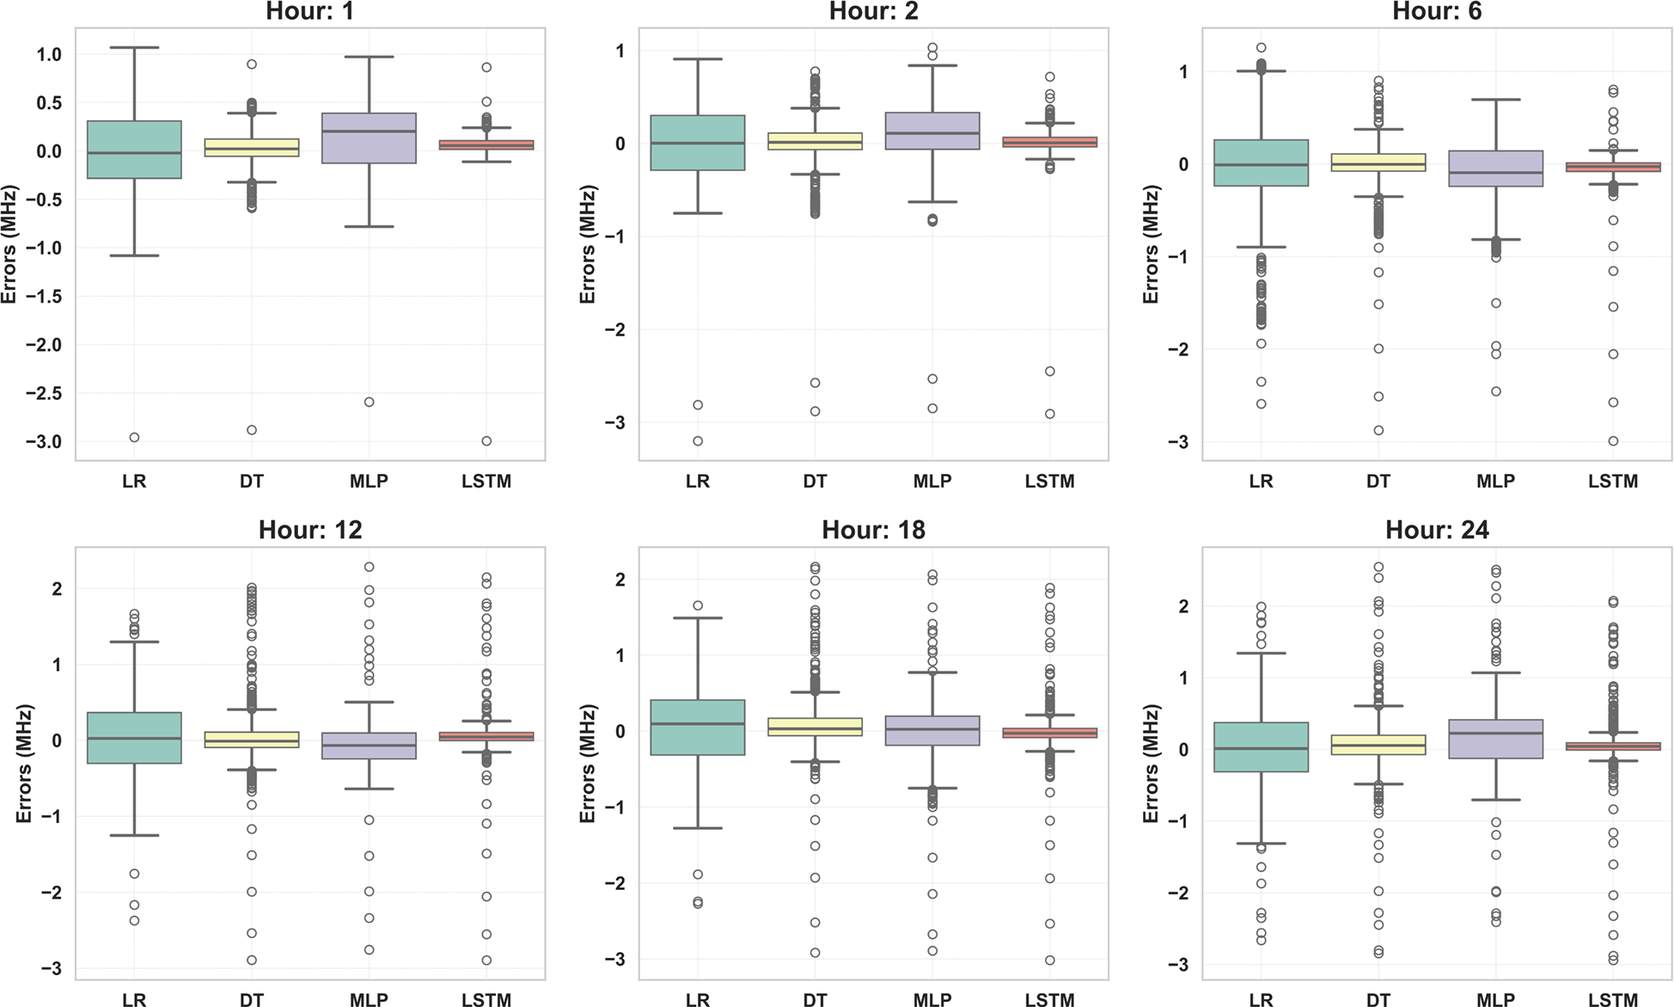
The error plot for the decision tree model, positioned as the second runner-up among the models tested, might reveal fluctuations or irregular patterns. Moreover, while the MLP model’s error plot may exhibit moderate improvements compared to the decision tree model, it still shows notable errors. This suggests challenges in capturing the intricate temporal dependencies present in the $ foF2 $
data, even though it performs better than the decision tree model. Conversely, the linear regression model’s error plot may display systematic biases or larger errors, particularly in capturing the non-linear relationships and temporal dynamics inherent in the
$ foF2 $
data, even though it performs better than the decision tree model. Conversely, the linear regression model’s error plot may display systematic biases or larger errors, particularly in capturing the non-linear relationships and temporal dynamics inherent in the $ foF2 $
data. All obtained results and associated plots, encompassing data from various stations and years, are readily accessible through the project’s GitHub page.
$ foF2 $
data. All obtained results and associated plots, encompassing data from various stations and years, are readily accessible through the project’s GitHub page.
Overall, the error plots consistently indicate that the LSTM model outperforms the DT, MLP, and LR models in forecasting $ foF2 $
values for all the stations and across the years 2009, 2012, 2015, and 2019. The narrower error bands, smaller errors, and closer alignment with observed values in the LSTM error plot underscore its superiority in capturing the complex temporal patterns and dependencies present in the foF2 data, highlighting its efficacy for accurate forecasting in ionospheric parameter predictions.
$ foF2 $
values for all the stations and across the years 2009, 2012, 2015, and 2019. The narrower error bands, smaller errors, and closer alignment with observed values in the LSTM error plot underscore its superiority in capturing the complex temporal patterns and dependencies present in the foF2 data, highlighting its efficacy for accurate forecasting in ionospheric parameter predictions.
Figures 9, 10, 11, and 12, the box and whisker plots provide a comprehensive visualization of the distribution of prediction values across different models and years for predicting $ foF2 $
values alongside the real value. Across the years 2009, 2012, 2015, and 2019, these plots show the central tendency, spread, and variability of forecast errors, making, enabling a comparative assessment of the model performance. Furthermore, the box and whisker plots allow for the identification of potential outliers and extreme forecast errors, which may be more prevalent in certain models or years. These outliers can provide valuable insights into the limitations and weaknesses of specific models, as well as potential areas for improvement in forecasting methodologies.
$ foF2 $
values alongside the real value. Across the years 2009, 2012, 2015, and 2019, these plots show the central tendency, spread, and variability of forecast errors, making, enabling a comparative assessment of the model performance. Furthermore, the box and whisker plots allow for the identification of potential outliers and extreme forecast errors, which may be more prevalent in certain models or years. These outliers can provide valuable insights into the limitations and weaknesses of specific models, as well as potential areas for improvement in forecasting methodologies.
Box and whisker plots illustrating $ foF2 $
prediction results using the LSTM, DT, MLP, and LR models for the Istanbul station in 2009.
$ foF2 $
prediction results using the LSTM, DT, MLP, and LR models for the Istanbul station in 2009.

Box and whisker plots illustrating foF2 prediction results using the LSTM, DT, MLP, and LR models for the Istanbul station in 2012.

Box and whisker plots illustrating foF2 prediction results using the LSTM, DT, MLP, and LR models for the Istanbul station in 2015.

Box and whisker plots illustrating foF2 prediction results using the LSTM, DT, MLP, and LR models for the Istanbul station in 2019.

Notably, the LSTM model consistently demonstrates smaller median errors and narrower interquartile ranges compared to the other models. This suggests that the LSTM model consistently outperforms the DT, MLP, and LR models in terms of forecast accuracy across different years.
Conversely, the box and whisker plots for the DT, MLP, and LR models may exhibit larger median errors and wider interquartile ranges, indicating greater variability and less accuracy in their forecasts. These models may struggle to capture the underlying patterns and dynamics in the $ foF2 $
data, resulting in less consistent performance across different years.
$ foF2 $
data, resulting in less consistent performance across different years.
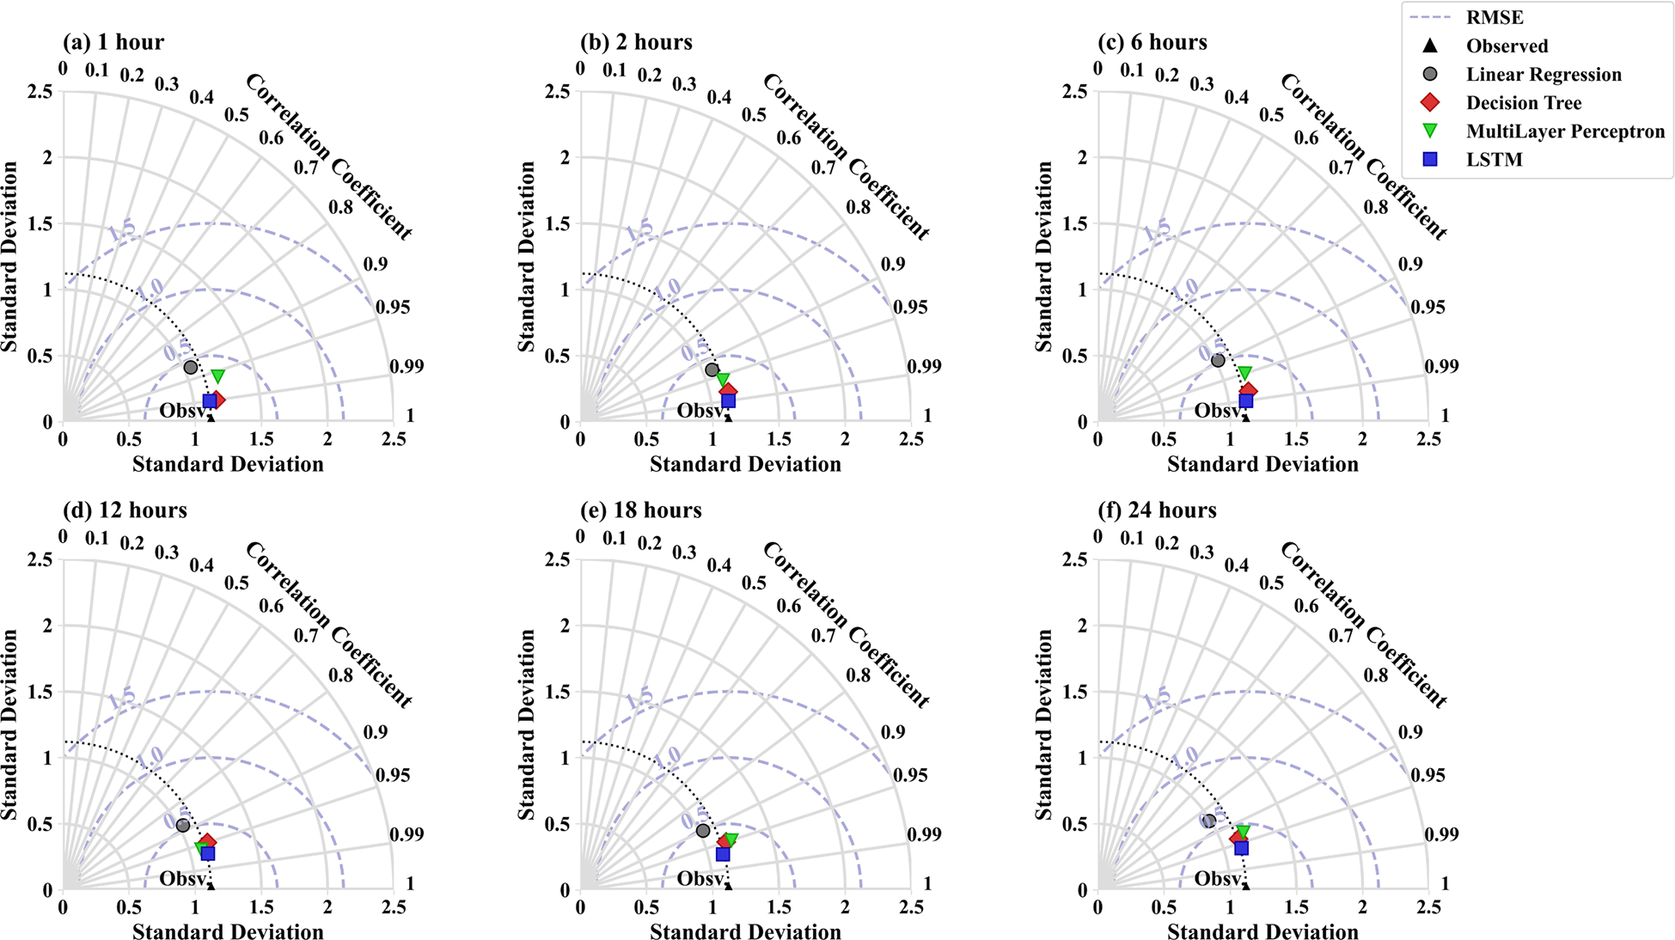
Furthermore, in this section, an overview of the results is presented based on the Taylor Diagram analysis (Rochford, Reference Rochford2016). The performance of the four models in predicting foF2 values for various (1, 2, 6, 12, 18, and 24 hours) are comprehensively evaluated (Figures 13, 14, 15, and 16). The Taylor diagram provides a visual representation of the agreement between the observed and predicted data, considering key metrics such as correlation, centered root mean square error (CRMSE), and standard deviation, providing a holistic view of model performance (Jolliff et al., Reference Jolliff, Kindle, Shulman, Penta, Friedrichs, Helber and Arnone2009). In this study, the Taylor diagram is employed to determine the degree of alignment between the predicted values of each model and the actual values observed (Taylor, Reference Taylor2001). In this context, the results indicate that the LSTM model outperforms the other models, as evidenced by its placement closer to the baseline observed point on the Taylor diagram. This proximity signifies a high level of similarity between the predicted and observed data in terms of standard deviation, with a correlation approaching 90% and a CRMSE close to 0.25. Following the LSTM model, the decision tree model demonstrates the second-best performance among the tested models. While not as close to the observed point as the LSTM, the decision tree model still exhibits favorable agreement with the observed data, indicating its effectiveness in predicting foF2 values across different time intervals. The MLP model follows, showing slightly lesser performance accuracy compared to the decision tree model. Although it falls further from the observed point on the Taylor diagram, it still demonstrates a reasonable level of agreement with the observed data, albeit with a slightly lower correlation and potentially higher CRMSE. Lastly, the linear regression model appears to have the least favorable performance among the tested models, as indicated by its placement on the Taylor diagram. It may exhibit lower correlation and higher CRMSE compared to the other models, suggesting limitations in capturing the underlying patterns and complexities in the foF2 data.
Taylor plots with the predicted and observed foF2 values for the Istanbul station in 2009 utilizing LSTM, DT, MLP, and LR models over different time intervals (1, 2, 6, 12, 18, and 24 hours).

Taylor plots with the predicted and observed foF2 values for the Istanbul station in 2012 utilizing LSTM, DT, MLP, and LR models over different time intervals (1, 2, 6, 12, 18, and 24 hours).

Taylor plots with the predicted and observed foF2 values for the Istanbul station in 2015 utilizing LSTM, DT, MLP, and LR models over different time intervals (1, 2, 6, 12, 18, and 24 hours).

Taylor plots with the predicted and observed foF2 values for the Istanbul station in 2019 utilizing LSTM, DT, MLP, and LR models over different time intervals (1, 2, 6, 12, 18, and 24 hours).
4. Conclusion
In conclusion, the accurate prediction of ionospheric parameters is of utmost importance due to their significant impact on radio wave propagation and weather forecasting. The present study aims to investigate the performance of several popular machine learning models in predicting the critical frequency of the ionospheric $ F2 $
layer, known as
$ F2 $
layer, known as $ foF2 $
, up to 24 hours in advance using the single-station approach, with a particular focus on mid and high latitudes. The reliability of the LSTM model is analyzed in forecasting daily variations in
$ foF2 $
, up to 24 hours in advance using the single-station approach, with a particular focus on mid and high latitudes. The reliability of the LSTM model is analyzed in forecasting daily variations in $ foF2 $
during the 24th solar cycle and is compared to other machine learning algorithms. The findings of this study hold promise for improving the accuracy of
$ foF2 $
during the 24th solar cycle and is compared to other machine learning algorithms. The findings of this study hold promise for improving the accuracy of $ foF2 $
predictions, with potential implications for enhancing communication systems and weather forecasting capabilities. The LSTM model outperforms other machine learning algorithms in forecasting daily variations of foF2, as evidenced by its placement closer to the baseline observed point on the Taylor diagram. This proximity signifies a high level of similarity between the predicted and observed data regarding standard deviation, with a correlation approaching 90% and a CRMSE close to 0.25. Furthermore, on average, LSTM is 1.2 times better than the second-best model (DT), 1.6 times as effective as the MLP, and three times more accurate than linear regression. An in-depth analysis of changes in the ionosphere is fundamental to ascertaining their impact on terrestrial weather patterns and anticipating space weather, which can have dire consequences for a society reliant on technology. Ensemble learning, which integrates multiple deep learning models, will be employed to comprehensively understand ionospheric behavior during turbulent and quiet periods. Furthermore, future research endeavors will focus on the low, equatorial, mid, and high regions, concentrating on short-term or real-time forecasting.
$ foF2 $
predictions, with potential implications for enhancing communication systems and weather forecasting capabilities. The LSTM model outperforms other machine learning algorithms in forecasting daily variations of foF2, as evidenced by its placement closer to the baseline observed point on the Taylor diagram. This proximity signifies a high level of similarity between the predicted and observed data regarding standard deviation, with a correlation approaching 90% and a CRMSE close to 0.25. Furthermore, on average, LSTM is 1.2 times better than the second-best model (DT), 1.6 times as effective as the MLP, and three times more accurate than linear regression. An in-depth analysis of changes in the ionosphere is fundamental to ascertaining their impact on terrestrial weather patterns and anticipating space weather, which can have dire consequences for a society reliant on technology. Ensemble learning, which integrates multiple deep learning models, will be employed to comprehensively understand ionospheric behavior during turbulent and quiet periods. Furthermore, future research endeavors will focus on the low, equatorial, mid, and high regions, concentrating on short-term or real-time forecasting.
Abbreviations
- LSTM
-
a long short-term memory method
- foF2
-
critical frequency of the F2 layer of the ionosphere.
- F2
-
the highest layer of the ionosphere.
- MAPE
-
the mean absolute percentage error.
- MAE
-
the mean absolute error.
- RMSE
-
the root to mean square error.
- TEC
-
the total electron content.
- F
-
a layer of the ionosphere.
- MLP
-
a multilayer perceptron.
- DT
-
a decision tree.
- LR
-
a linear regression.
- ANN
-
an artificial neural network.
- CNN
-
a convolutional neural network.
- BiLSTM
-
a bidirectional long short-term memory.
- AdaBoost-BP
-
a parallel Adaboost-Backpropagation neural network
- ap
-
a daily average level for geomagnetic activity.
- Kp
-
a planetary index characterizing the global disturbance of the Earth’s magnetic field.
- Rz
-
a sunspot number.
- DHS, DHC
-
a day number (sine and cosine components).
- UTS, UTC
-
universal time (sine and cosine components).
- DNS, DNC
-
a solar zenith angle (sine and cosine components).
- DS, DC
-
magnetic declination (sine and cosine components).
- IS
-
magnetic inclination (a sine component).
-
$ \Delta $
R(h)
-
relative deviation of foF2.
- HF
-
high-frequency.
- F10.7
-
solar flux.
- IRI
-
the International Reference Ionosphere.
- GITM
-
the Global Ionosphere -Thermosphere Model.
- NASA
-
National Aeronautics and Space Administration.
- GANN
-
Genetic Algorithm Neural Network.
- CRMSE
-
the Centered Root-Mean-Squared Error.
- ReLU
-
the Rectified Linear Unit.
- MSE
-
the mean squared error criterion.

Acknowledgments
The authors thank Serkan Macit for support in data gathering and technical assistance. The authors also thank the Community Coordinated Modeling Center for providing data.
Data availability statement
The data and materials are readily accessible on the corresponding author’s GitHub page. Replication data and code can be found on the GitHub website: (https://github.com/AlexaDenisenko/Ionosphere/).
Author contribution
Conceptualization: Alexandra Denisenko-Floyd and Meric Yucel. Methodology: Alexandra Denisenko-Floyd and Meric Yucel. Validation: Alexandra Denisenko-Floyd, Meric Yucel and Burak Berk Ustundag. Data curation: Alexandra Denisenko-Floyd and Meric Yucel. Data visualization: Alexandra Denisenko-Floyd. Writing original draft: Alexandra Denisenko-Floyd. Supervision, Burak Berk Ustundag. All authors approved the final submitted draft.
Funding statement
This study was funded by the Scientific and Technological Research Council of Turkiye as part of Research Project 121E88.
Competing interest
The authors declared no conflict of interest.
Ethical standards
The research meets all ethical guidelines, including adherence to the legal requirements of the study country.


 Open access