


INTRODUCTION
Governments often struggle to implement effective climate policies without public support. The 2018 Yellow Vests protests, driven by anger over a proposed increase in the French carbon tax, escalated into a nationwide movement that ultimately pressured the government to retract the policy. More broadly, climate policies have at times fueled resentment, triggered backlash, and bolstered support for radical right parties (Colantone et al. Reference Colantone, Di Lonardo, Margalit and Percoco2024; Voeten Reference Voeten2025). Consequently, understanding the sources of opposition to climate policies and identifying ways to secure public support have become central challenges in advancing the green transition (Fairbrother Reference Fairbrother2022).
To explain opposition to climate policies, research has focused on individual-level factors and, in particular, on the behavioral and financial costs such policies impose. Perceptions of unfairness in how these costs are distributed often further undermine public support. Consequently, scholars have increasingly examined whether materially compensating those disadvantaged by climate policies can enhance support, yielding mixed results (Mildenberger et al. Reference Mildenberger, Lachapelle, Harrison and Stadelmann-Steffen2022). At the same time, a large body of work has emphasized how fairness, reciprocity, and conditional cooperation shape citizens’ willingness to accept costly climate action in both domestic and international contexts (Bechtel and Scheve Reference Bechtel and Scheve2013; Bechtel, Scheve, and Lieshout Reference Bechtel, Scheve and van Lieshout2022; Kline et al. Reference Kline, Seltzer, Lukinova and Bynum2018; Mildenberger and Tingley Reference Mildenberger and Tingley2019; Tingley and Tomz Reference Tingley and Tomz2014). Yet, there has been relatively little discussion of alternative ways to increase support for climate policies, particularly in cases where financial compensation is insufficient or where policies impose direct behavioral constraints on individuals (Bolet, Green, and Gonzalez-Eguino Reference Bolet, Green and Gonzalez-Eguino2024).
In this article, we contribute to these debates by examining a specific tool that governments can use to enhance support for costly policies, a concept we call symbolic policies. We argue that public policies differ not only in their material impacts, that is, the extent to which they impose financial costs, provide benefits, or regulate the behavior of a large portion of the population, but also in the meaning they signal to the public, namely their symbolic dimension (Boussaguet and Faucher Reference Boussaguet and Faucher2020; Reference Boussaguet and Faucher2024; Edelman Reference Edelman1985). The messages conveyed by policies may therefore provoke reactions whose intensity depends on how strongly they resonate with people’s emotions, concerns, and values. While all policies carry meaning, we define symbolic policies as those that rely primarily on their symbolic dimension rather than on their material impact. Policies such as requiring ministers to take the train instead of the plane or reducing MPs’ wages signal meaningful messages to the public but impose minimal financial or behavioral constraints.
We argue that symbolic policies can help mitigate opposition to materially costly policies not by altering their material costs, but by reshaping the messages these policies convey to the public. Opposition to costly policies arises not only from their direct material impact, but also from the meanings they signal, such as who is expected to bear the burden and what values the policy reinforces, which together shape public perceptions and reactions. By sending messages related to distributive and procedural fairness, elite behavior, and government credibility, symbolic policies can shift how costly policies are understood, thereby making them more acceptable. Consequently, although they may have little substantive effect on the issues they address on their own, symbolic policies can play a crucial role in fostering support for otherwise costly measures.
We provide support for our argument using a mixed methods approach based on evidence from three studies conducted in France. In the first study, a survey experiment, we examine whether support for costly climate policies increases when they are combined with symbolic climate policies. We assess public support for two behaviorally costly measures (reducing the speed limit on highways and banning short-haul flights) and evaluate the mediating effect of two symbolic policies: requiring ministers to use trains for domestic travel and banning private jets in France. The results show that support for the costly policies significantly increases when they are accompanied by a symbolic policy. In the second study, based on 53 qualitative interviews, we further investigate the mechanisms underlying these effects. The findings reveal how symbolic appeals resonate with concerns about fairness, resentment toward elites, and perceptions of government credibility, thereby clarifying why symbolic policies, as tested in Study 1, can enhance support for otherwise unpopular measures. The third study extends the initial experimental design by broadening the range of policies examined and exploring the underlying mechanisms through additional survey experiments. It replicates the positive effects of symbolic policies when paired with costly ones. Moreover, the results show that symbolic policies on their own receive the highest levels of support, while their explicit exclusion reduces support for costly policies. This study also tests a new symbolic policy signaling citizen participation: an annual parliamentary discussion on an environmental measure proposed by citizens. While participatory tools could, in principle, have substantive consequences, in our design this measure functions primarily as a symbolic signal of inclusion and significantly increases support for carbon taxes. Crucially, the results of Study 3 further corroborate the mechanisms identified in Study 2.
Our findings contribute to the literature on climate policy support by demonstrating the importance of the symbolic dimension in policy design. These results also carry significant policy relevance, showing that symbolic climate policies, while not directly contributing to climate change mitigation, are instrumental garnering support for more effective mitigation measures. More broadly, this article makes a significant contribution to the wider scholarship on public opinion and policy support by examining how people make sense of politics and public policies not only through distributional and material lenses, but also through the symbols they convey.
The article is organized as follows. We first review the literature on climate policy support and symbolic politics to derive our theoretical framework regarding the influence of symbolic policies on costly climate policies. Next, we introduce the methodology used to test our argument and the mechanisms underlying our theory. Then, we present our results and discuss the theoretical and empirical implications of our findings.
EXPLAINING VARIATIONS IN CLIMATE POLICY SUPPORT
Research on climate policy attitudes has extensively examined the individual determinants of policy support. Sociodemographic factors such as gender, education, income, and age, as well as ideology, have been shown to shape these perceptions (Bergquist et al. Reference Bergquist, Nilsson, Harring and Jagers2022; Bush and Clayton Reference Bush and Clayton2023; Carattini, Carvalho, and Fankhauser Reference Carattini, Carvalho and Fankhauser2018; Klenert et al. Reference Klenert, Mattauch, Combet, Edenhofer, Hepburn, Rafaty and Stern2018; Maestre-Andrés, Drews, and Bergh Reference Maestre-Andrés, Drews and van den Bergh2019). Preexisting attitudes, including distrust or dissatisfaction with the government and political elites, also influence support for climate policies (Fairbrother, Sevä, and Kulin Reference Fairbrother, Sevä and Kulin2019). In addition, contextual factors such as extreme weather events can boost support for climate action (Arias and Blair Reference Arias and Blair2024; Hazlett and Mildenberger Reference Hazlett and Mildenberger2020).
Further research has investigated how climate policy design influences citizens’ support (Drews and van den Bergh Reference Drews and van den Bergh2016). The perceived effectiveness of climate policies and the credibility of those implementing them have been identified as key drivers of support (Bergquist et al. Reference Bergquist, Nilsson, Harring and Jagers2022; Gazmararian and Tingley Reference Gazmararian and Tingley2023a). But, in particular, the design of climate policies often imposes significant financial and behavioral costs on individuals, which can hinder public backing (Douenne and Fabre Reference Douenne and Fabre2020). Financial costs affect purchasing power and employment (e.g., through carbon taxation), while behavioral costs constrain individuals’ actions, such as their mobility (Dechezleprêtre et al. Reference Dechezleprêtre, Fabre, Kruse, Planterose, Chico and Stantcheva2025). The perception of these costs and their distribution likely reduces policy support among those most affected (Schaffer Reference Schaffer2024), reflecting both pocketbook and fairness concerns (Tallent Reference Tallent2025).
As a result, the climate policy literature stresses the importance of designing nonregressive policies that address material costs by incorporating mechanisms to compensate potential policy losers through redistributive schemes and revenue recycling (Bolet, Green, and Gonzalez-Eguino Reference Bolet, Green and Gonzalez-Eguino2024; Carattini, Carvalho, and Fankhauser Reference Carattini, Carvalho and Fankhauser2018; Douenne and Fabre Reference Douenne and Fabre2020; Gazmararian Reference Gazmararian2024; Klenert et al. Reference Klenert, Mattauch, Combet, Edenhofer, Hepburn, Rafaty and Stern2018). Since climate laws typically include a variety of policy measures (Dechezleprêtre et al. Reference Dechezleprêtre, Fabre, Kruse, Planterose, Chico and Stantcheva2025), bundling these policies can increase support by broadening the range of benefits and compensation options (Bergquist, Mildenberger, and Stokes Reference Bergquist, Mildenberger and Stokes2020; Givoni Reference Givoni2014; Givoni et al. Reference Givoni, Macmillen, Banister and Feitelson2013; Wicki, Fesenfeld, and Bernauer Reference Wicki, Fesenfeld and Bernauer2019).
Compensation schemes are typically designed as material compensation for individuals most affected by costly climate policies, such as carbon taxes or coal phase-outs (Bergquist, Mildenberger, and Stokes Reference Bergquist, Mildenberger and Stokes2020; Gaikwad, Genovese, and Tingley Reference Gaikwad, Genovese and Tingley2022). They primarily function by reducing the material costs borne by certain individuals, potentially mitigating policy opposition. While these schemes may address concerns about rising energy prices or job losses, their effectiveness has been increasingly debated (Mildenberger et al. Reference Mildenberger, Lachapelle, Harrison and Stadelmann-Steffen2022). Moreover, they are likely less effective for climate policies with limited economic costs but requiring behavioral changes, such as speed limit reductions or bans on carbon-intensive behaviors. The literature offers limited exploration of alternatives to financial compensation for reducing opposition to climate policies.
Beyond material compensation, another strand of research highlights the importance of cooperation and reciprocity in shaping public support for climate action. From a collective action perspective, citizens are more willing to support international agreements when more countries participate and costs are shared fairly (Bechtel and Scheve Reference Bechtel and Scheve2013), or when they are informed about foreign citizens’ climate beliefs (Mildenberger and Tingley Reference Mildenberger and Tingley2019). This sensitivity to reciprocity also extends to national climate policy: voters are more supportive of domestic carbon taxes when similar countries adopt comparable measures (Bechtel, Scheve, and Lieshout Reference Bechtel, Scheve and van Lieshout2022). By showing that the actions of other countries do affect mass preferences on national costly climate policy, this work goes beyond the opposition between a distributive conflict framework (Aklin and Mildenberger Reference Aklin and Mildenberger2020) and a public goods framework (Kennard and Schnakenberg Reference Kennard and Schnakenberg2023) for understanding climate politics. Yet, results remain mixed. Kline et al. (Reference Kline, Seltzer, Lukinova and Bynum2018) show that the principle of differentiated responsibilities can discourage citizens in disadvantaged countries from contributing, even when advantaged ones do more. By contrast, Tingley and Tomz (Reference Tingley and Tomz2014) find that many citizens hold unconditional preferences, with support for their country’s climate policies not contingent on other states’ behavior. Taken together, this literature not only highlights the potential relevance of conditional cooperation, but also leaves open questions about how it can be fostered beyond the context of cross-national cooperation, within domestic politics, where reference points are not other countries but political and economic elites.
To contribute to this debate, we explore alternative approaches to fostering policy support in this context. Specifically, we draw on the literature examining the role of the symbolic politics to develop the concept of symbolic climate policies and assess their potential to enhance support for more costly policies.
SYMBOLIC POLITICS AND POLICIES
The term “symbolic” is commonly used to describe policies or political actions that are seen as ineffective but serve rhetorical or communicative purposes. From this perspective, symbolic policies are often interpreted as strategies used by politicians to build positive narratives, reinforce legitimacy, or deflect attention from inaction (Feo and Piccio Reference Feo and Piccio2020). They are viewed as lacking implementation capacity or substantive financial backing (Lourie Reference Lourie2015), or taking the form of vague and ambiguous statements (Rizvi and Lingard Reference Rizvi and Lingard2009).
This instrumental view of symbolic politics draws from the foundational work by Edelman (Reference Edelman1985), though the author offers a wider understanding of what symbolic means. To him, political symbols, such as discourses, ceremonies, objects, and images, convey messages primarily through their emotional resonance and their appeal to people’s values, influencing how people perceive and respond to politics. Yet, Edelman frames these symbols primarily as tools of elite manipulation, used to pacify or distract mass publics. As a result, symbolic politics in this tradition is often equated with superficiality, deception, or distraction—a conception that continues to shape much of the literature. Following this work, a symbolic policy would generally be perceived as a common-sense notion referring to a policy that primarily serves as communication, regardless of whether it brings about the intended changes.
Later work challenges this narrow and often cynical view. Scholars in interpretive policy analysis have emphasized that politics is about meaning and, as a consequence, that all policies carry a symbolic dimension, regardless of whether they are intended as such (Hajer and Wagenaar Reference Hajer and Wagenaar2003; Metze Reference Metze2017; Pijnappel Reference Pijnappel2016; Yanow Reference Yanow1996). Policies are hence not just technical instruments or cost-effective tools but carriers of meaning. Unlike Edelman’s view of symbols as manipulation, this tradition sees meaning as a constitutive component of policy reception that merits systematic attention. Recent contributions have reinforced this perspective. Boussaguet and Faucher (Reference Boussaguet and Faucher2024), for instance, argue that policies inherently generate meaning through public interpretation, as audiences decode and evaluate them based on what they evoke or signal. From this standpoint, policy design and implementation are inseparable from the symbolic work they perform—for instance, in shaping identity, signaling inclusion or exclusion, or conveying commitments.
However, by emphasizing the symbolic dimension of all political actions, this perspective risks overlooking their diverse material effects. While some policies contain both symbolic and substantive elements, others function primarily as signals intended to convey a message. Crucially, this broader perspective has rarely been integrated into more systematic studies of policy support and public opinion, particularly in the context of climate change.
Building on this literature, we adopt a more expansive view of symbolic policies as political actions or instruments that, while limited in material impact, play a meaningful role in shaping public perceptions and responses. In particular, we explore how symbolic policies may function as signals of commitment, fairness, or collective effort, and how these signals might enhance support for more demanding climate measures. We return to this framework in the theory section next.
THEORETICAL FRAMEWORK: SYMBOLIC (CLIMATE) POLICIES
Conceptualizing Symbolic Policies
In order to reconceptualize symbolic policies, we begin with defining public policies along two continuous dimensions. The first dimension relates to the messages they convey to the public. All policies carry meanings and hence possess a symbolic component. The meaning of a policy, once decoded by the audience, triggers reactions whose intensity depends on how strongly the message resonates with their emotions, concerns, and values. For instance, technical regulations, such as building codes or workplace safety standards, focus on practical outcomes and their symbolic component is unlikely to convey meaning significant enough for people to trigger a strong emotional response. In contrast, memorial policies, like opening national monuments or establishing days of remembrance, carry more important meanings and convey messages about national identity, collective memory, and shared values, with the aim of shaping public perception and fostering unity.
Second, policies vary in material scope, which refers to the extent of their impact on individuals or groups. The material scope includes both financial costs or benefits and the behavioral constraints or freedoms that the policy creates or influences. The greater the intensity of these costs and benefits and the more people they affect, the larger the material impact of the policy. Universal income, healthcare programs, or carbon taxes would be examples of policies with high material impact, while policies such as renaming a street or park or making administrative data publicly available would have low material impact.
It is important to stress that these dimensions are continuous and hardly mutually exclusive. We acknowledge that every policy will always have some symbolic component, while it will also carry some material impact. This conceptualization allows for a more nuanced understanding of public policies by recognizing that their symbolic and material dimensions exist on a spectrum rather than as distinct categories.
Building on these two dimensions, we define symbolic policies as those that convey meaningful messages to the public while having minimal material impact. They are symbolic because they are primarily relying on their symbolic dimension—not their material one. For instance, a policy aiming at reducing MP’s wage would have a material impact but only on a tiny number of people. It would, however, carry significant meaning by targeting a resented group perceived as unfairly benefiting from the system. Similarly, nonbinding consultative citizen assemblies have little direct material impact but activate preferences on democratic participation. In both cases, through the messages they convey, these two symbolic policies can activate certain beliefs in the population—for instance, around elite exemplarity or procedural fairness.
Following our definition, policies may signal meaningful messages without being considered symbolic if they also have significant material impacts. For example, requiring every student to sing the national anthem or recite a pledge of allegiance every morning is highly symbolic, in the sense that it sends a message around patriotism and collective identity, but also has a broad material scope, affecting the behavior of a large number of individuals. Similarly, a policy that regulates individuals’ consumption behavior has an important symbolic component, by carrying meaning about which behaviors are considered legitimate and acceptable. However, it also imposes considerable material impacts by restricting the behaviors of a large portion of the population, thus moving beyond the realm of symbolic policies. Our conceptualization here echoes works on taxation highlighting similar dynamics, albeit not using the term. For example, Scheve and Stasavage (Reference Scheve and Stasavage2016) show that higher taxes for the wealthy during wartime could be justified as a form of compensation in times of mass sacrifice. The expansion of progressive taxation in this context signaled that elites, too, were being “conscripted” to contribute when ordinary citizens were sent to the front line. In this sense, one could argue that taxation functioned not only as revenue-raising but also as a symbolic gesture of shared sacrifice. At the same time, because such taxes raise substantial revenue, they differ from the policies we define as symbolic, whose material costs are minimal and whose influence comes primarily from the message conveyed rather than the financial effect.
Consequently, due to their limited material scope, symbolic policies often have on their own negligible effects on the issue they ostensibly target. For instance, in the context of reducing the state budget, cutting MPs’ wages would have a very limited impact on the deficit. Similarly, requiring the head of state to favor trains over planes for travel would not significantly reduce carbon emissions. In both cases, the purpose would not be to deliver substantial policy outcomes—whether on climate change or the state deficit—but to send a meaningful message to the public to demonstrate political commitment and responsiveness to citizens.
The Effects of Symbolic Policies on Support for Costly Policies
While a symbolic policy on its own may not seem highly impactful, we argue that it has the potential to make materially costly policies more appealing.
Costly policies, in our framework, are those that impose significant material burdens—financial or behavioral—on a broad share of the population. Public resistance to these policies has typically been explained by their material impact. However, we argue that opposition also stems from how such policies are interpreted—from the meanings they convey. For example, a costly policy (e.g., a carbon tax) may be opposed not only because of its material costs but also because it is perceived as signaling who should and should not bear certain costs, triggering feelings of unfairness.
Taken together, symbolic policies can mitigate opposition to costly policies by intervening on the message the latter convey. Since symbolic policies have little material impact, they do not change the actual material costs associated with costly policies. However, the message they convey can reshape how the public perceives and interprets the meaning of the costly policy. Hence, symbolic policies differ from policies that directly aim to improve support by materially compensating policy losers, as these primarily seek to reduce opposition by altering the costs borne by these individuals. While compensation policies can also influence the message sent by costly policies by shifting perceptions of who bears those costs, symbolic policies solely target how these policies are understood, without introducing any material changes for those affected by costly policies. They might hence activate similar beliefs, but symbolic policies do so through symbolic means (i.e., the message) and not through the material composition of costs.
In the climate change context, policy costs fuel public opposition not only due to their material impact on many, but also because they are interpreted as unfair and imposed by political elites (Bolet, Green, and Gonzalez-Eguino Reference Bolet, Green and Gonzalez-Eguino2024; Fairbrother, Sevä, and Kulin Reference Fairbrother, Sevä and Kulin2019; Schuitema and Bergstad Reference Schuitema and Bergstad2018; Westlake, Demski, and Pidgeon Reference Westlake, Demski and Pidgeon2024). While this opposition is partly material, it also reflects the interpretations people derive from policy design and implementation. Policies are indeed evaluated in relation to the behavior of political elites, the transparency of decision making, and broader narratives of fairness. To date, these concerns have largely been addressed through direct redistributive schemes that financially compensate those affected by climate policies. As a result, these financial mechanisms primarily shape public support by adjusting the distribution of material costs.
Symbolic climate policies can alter the meaning of costly climate policies, even when they do not change the material costs imposed upon people. Building on the literature and the insights from our fieldwork (presented in our Study 2), we argue that this can act through several potential mechanisms.
Distributive Fairness
First, they may enhance perceptions of distributive fairness by signaling that a larger number of citizens are contributing to climate action (Bechtel and Scheve Reference Bechtel and Scheve2013), and to their fair share. In particular, here, we suggest that symbolic policies targeting socially “undeserving” groups such as the wealthy or political elites (Schneider and Ingram Reference Schneider and Ingram1993) can attenuate the resentment otherwise directed at costly climate efforts. Schneider and Ingram’s framework suggests that the social construction of target groups matters not only because groups are seen as deserving or undeserving, but also because policies signal whether groups are subject to burdens or benefits, and whether they exercise control over the political agenda or policy design. Symbolic policies that visibly impose burdens on powerful elites can therefore be especially potent. They invert the usual pattern in which costs fall on ordinary citizens while privileged groups retain control. For instance, measures like limiting politicians’ access to private jets or cutting parliamentary salaries may do little to reduce emissions or significantly affect the budget. Yet, they can signal fairness in how costs are distributed, thereby increasing public support for an otherwise costly policy.
Perception of Elite Behavior
Second, symbolic policies can affect the acceptance of costlier policies by improving citizens’ assessments of elite behavior. While much of the symbolic politics literature (e.g., Edelman Reference Edelman1985) emphasizes manipulation or distraction, we argue that symbols can also function to affirm elite exemplarity—the idea that political leaders are taking action themselves and not exempting themselves from sacrifice. In times of mass mobilization or collective effort, this kind of visible commitment matters. As mentioned earlier, research has shown, for instance, that the taxation of the wealthy during wartime helped justify broader sacrifice by signaling elite commitment (Scheve and Stasavage Reference Scheve and Stasavage2016). In line with this, as elite resentment has been documented to fuel resistance to climate measures (Tatham and Peters Reference Tatham and Peters2023), we suggest that symbolic climate policies can convey that elites are “doing their part” and thereby increase support for climate policies that impose material costs.
At the same time, symbolic policies can signal elite responsiveness. Beyond sharing the burden, elites are often judged on whether they acknowledge and react to citizens’ concerns rather than ignoring them. Symbolic policies that demonstrate attention to public discontent—for instance, reducing MPs’ salaries or restricting ministers’ travel—convey that leaders are not only imposing burdens but also taking seriously the frustrations and expectations voiced by citizens. In this way, symbolic policies can counter perceptions of elite detachment or hypocrisy. Taken together, these two dimensions, exemplarity and responsiveness, improve perceptions of elite behavior and thereby enhance support for costly climate policies.
The logic of these two mechanisms, elite perceptions and distributive fairness, echoes existing research investigating how the contributions of other individuals or countries influence support for climate action. Research on conditional cooperation underscores fairness and reciprocity as central in public goods provision, showing that people are more willing to support costly actions when they know that others—especially those with greater resources or responsibility, such as high-emitting countries—are contributing as well (Bechtel and Scheve Reference Bechtel and Scheve2013; Bechtel, Scheve, and Lieshout Reference Bechtel, Scheve and van Lieshout2022; Mildenberger and Tingley Reference Mildenberger and Tingley2019).
While related, our argument about these mechanisms differs from this literature in its focus on national climate policies and the role of elites who adopt them. Citizens are more likely to be aware of domestic policies, who imposes them, and who is asked to contribute, than of international climate agreements and the cooperation of other countries. At the same time, national elites are also more susceptible to be the source of resentment than other actors. In this context, the image of these groups and the power they hold over the allocation of burdens and benefits plays a crucial role in understanding how citizens perceive and care about these elites (Schneider and Ingram Reference Schneider and Ingram1993). Symbolic policies have the potential to make the elites’ contribution more salient by signaling that climate efforts are genuinely shared and enforced through institutionalized tools. In our case, this occurs without substantially changing the material impacts of costly policies, which distinguishes our argument from research on reciprocity in climate cooperation (see, e.g., Bechtel and Scheve Reference Bechtel and Scheve2013) as well as from work showing that voluntary mild commitments by firms can act as symbolic gestures substituting for and weakening support for regulation (Malhotra, Monin, and Tomz Reference Malhotra, Monin and Tomz2019). By contrast, we argue that when symbolic gestures are institutionalized through public policy and targeted at elites, they can complement rather than undermine costly regulation.
Finally, we also argue that the contributions of elites may operate by signaling responsiveness, that is, whether leaders are attentive to citizens’ concerns rather than detached or hypocritical. This aspect conceptually differs from conditional cooperation, common but differentiated responsibility, or second-order beliefs, as our focus is on asymmetries in cooperation between elites and citizens, rather than between countries or among citizens. Finally, as elaborated next, we argue that symbolic policies may increase support for costly climate policies through additional mechanisms, such as procedural fairness and credibility; mechanisms largely absent from the conditional cooperation literature. In this sense, our framework extends the focus on reciprocity and burden sharing by showing that symbolic policies operate through a broader set of mechanisms that reshape how citizens understand and evaluate costly climate action.
Procedural Fairness
Third, symbolic policies may enhance procedural fairness of costly climate measures, especially when they are seen as technocratic or disconnected. Bolet, Green, and Gonzalez-Eguino (Reference Bolet, Green and Gonzalez-Eguino2024) show that including citizens in the policy process can significantly increase support for climate policies in otherwise contentious contexts like the closure of coal mines. Even symbolic policies such as nonbinding citizen assemblies can signal political inclusion, countering perceptions of exclusion or imposition. Prior research indeed shows that procedural fairness increases legitimacy, even when outcomes remain unchanged (Warren and Pearse Reference Warren and Pearse2009).
Credibility
Finally, symbolic policies may shape perceptions of the seriousness of climate action. Research has shown that opposition to climate policies may stem not only from their direct costs or fairness concerns, but also from doubts about whether governments are genuinely committed to ambitious climate action. Policies risk being perceived as lacking credibility if governments fail to stick to their commitments, deliver tangible local benefits (Gazmararian and Tingley Reference Gazmararian and Tingley2023b), or ensure that burdens are distributed in ways consistent with climate goals. Costly measures may therefore trigger skepticism when they appear incoherent with other aspects of climate action or unlikely to be enforced. For instance, imposing new burdens on citizens while leaving elites untouched can be read as inconsistent and insincere, just as introducing new constraints without providing avenues for citizen involvement can be seen as not credible. Such perceptions of incoherence and weak commitment undermine the credibility of ambitious climate policies and fuel public resistance.
Symbolic policies could mitigate these doubts by serving as visible commitment devices. A common critique is that symbolic actions amount to mere “cheap talk”; offering rhetorical gestures without substantive impact. Yet, research shows that such commitments can create audience costs: once announced publicly, failing to uphold them can damage reputation, credibility, and trust (Fearon Reference Fearon1994; Tomz Reference Tomz2007). In this sense, when they are public, repeated, and targeted at meaningful issues (e.g., elites), symbolic policies signal resolve and consistency, reassuring citizens that costly measures are part of a serious and credible effort rather than an isolated or insincere initiative. In this way, symbolic policies can bolster support for costly climate action by enhancing perceptions of government credibility and the seriousness of its commitments.
Summary of the Mechanisms
Overall, our central hypothesis therefore posits that public support for policies that levy significant material costs on a broad segment of the population can be effectively increased when these policies are coupled with symbolic policies. Put simply, seemingly ineffective symbolic policies are in fact highly effective in providing policy support. Symbolic climate policies can alter the meaning of costly policies by tapping into concerns underlying opposition by increasing perceptions of distributive and procedural fairness, elite exemplarity, and perceptions of seriousness. While these effects are distinct from material redistribution, they may be just as important in contexts where resistance to climate action is rooted in symbolic concerns rather than direct economic harm.
It is important to note that these mechanisms are unlikely to operate with equal weight in all cases. Their role may vary depending on the type of costly policy at stake and the specific symbolic policy that accompanies it. For example, distributive fairness concerns may dominate in the case of taxation, while procedural fairness or elite exemplarity may be more relevant when new regulations constrain individual behaviors. The design of the symbolic policy therefore also has to be adjusted in accordance with the costly policy and the potential negative perceptions it might generate and should alter.
DESIGN AND MEASUREMENT
To test our hypothesis and explore the underlying mechanisms, we employ a mixed methods approach through three studies conducted in France. The first study uses survey experiments to manipulate the impact of symbolic climate policies on support for climate policies. The second study relies on qualitative interviews to explore the mechanisms behind the effects identified in Study 1. The final study (Study 3) is based on additional experiments aimed at strengthening the experimental design of Study 1, broadening the scope of the policies studied, and quantitatively testing the mechanisms identified in Study 2. This section first presents the French case and then outlines the design of the three studies.
The French Case
Many European countries have been experiencing recent waves of opposition to climate policies, whether in the form of outright protestations or electoral discontent (Rodriguez-Pose and Bartalucci Reference Rodriguez-Pose and Bartalucci2023). France was not spared from these recent developments. The current state of climate politics in the country makes us believe that it is an interesting case to test our argument. Over the past years, the French government has faced significant difficulties in implementing climate policies that impose substantial costs on citizens. The Yellow Vests movement at the end of 2018 was sparked by citizens’ opposition to an increase in the carbon tax, which generated feelings of unfairness as well as of disconnection from the political elite (Tatham and Peters Reference Tatham and Peters2023), and forced the government to reconsider this policy. Following the movement, a citizens’ assembly (the Convention citoyenne pour le Climat) was created and mandated to propose a range of climate policies for a future climate law. Later, the costlier climate policies proposed by the assembly were vetoed by President Emmanuel Macron who was concerned over the potential backlash that these policies would create among the population. Further, French billionaires and politicians have been increasingly criticized in the mediaFootnote 1, Footnote 2 for having disproportionately high carbon footprints in a context where climate change is becoming more salient and French citizens are being asked to make efforts to reduce their emissions. In this context and despite some specific events, France is a representative case of broader trends across Europe in terms of opposition to climate policies, concerns over fairness and a growing resentment toward elites.
Design of Study 1
We initially conducted a survey with 2,010 respondents as part of the Environment and Ecology Barometer (Pautard et al. Reference Pautard, Sauger, Rouban, Ginsburger, Grossman, Jan and Sattelmayer2024), a study of environmental attitudes implemented through the French Longitudinal Internet Survey for the Social Sciences (ELIPSS). The fieldwork took place from mid-December 2023 to mid-January 2024. We embedded an experiment with two distinct questions in which respondents were presented with a fictitious government announcement regarding climate policies. The two costly climate policies were the introduction of a lower speed limit on French highways and a policy banning national air travel within France if a train alternative under 5 hours existed. Respondents were asked to indicate the extent to which they agreed with each government announcement. For each policy, respondents were randomly assigned to one of three groups. The control group was exposed solely to the announcement of the costly climate policy, while the two treatment groups received the same announcement along with one of the symbolic climate policies. One treatment involved a symbolic policy requiring government officials to switch from planes to trains for their domestic travels to protect the climate. The other treatment focused on restricting the use of private jets by the wealthiest French citizens. The full experimental design, information, and presentation can be found in Section A.2 of the Supplementary Material. Table 1 further shows the six different announcements of the survey experiment.
Announcements Used in Study 1

Respondents were presented with the following text:Footnote 3
Here is a fictitious government announcement that could be communicated to combat climate change:
[Announcement].
To what extent would you agree with this announcement?
-
1. Totally agree
-
2. Rather agree
-
3. Rather disagree
-
4. Totally disagree
Both costly climate policies were selected due to their relevance in the ongoing French climate policy debate. We focused on policies that had been publicly discussed but never implemented, such as those proposed during the Citizens Convention for Climate and excluded from the 2021 climate law. These policies are considered costly because they impose constraints on the mobility of a large number of citizens. For example, a policy introduced in France in 2023 aims to ban flights where a 2.5-hour train alternative exists; however, it affects only a small number of flights, making the actual impact on the population marginal.Footnote 4 Our design proposes a more extensive version of this policy. Similarly, the proposed lowering of the speed limit on French highways from 130 to 110 km/h parallels the 2018 reduction of speed limits on rural roads, which was seen by some as a catalyst for the Yellow Vests movement (Boyer et al. Reference Boyer, Delemotte, Gauthier, Rollet and Schmutz2020).
Building on the literature on target groups (Schneider and Ingram Reference Schneider and Ingram1993), we argue that policies can have significant symbolic effects when they target powerful groups that are negatively perceived and hold important power in society. Politicians and the wealthiest individuals in France can be considered such groups (Deiss-Helbig, Guinaudeau, and Matthiess Reference Deiss-Helbig, Guinaudeau and Theres2022). By introducing symbolic policies that target the rich and politicians alongside costly climate policies, we aim to test the hypothesized mitigating effect on public opposition to these policies.
We estimate the average treatment effects of the two treatments in both experiments using OLS regressions. The models control for key variables identified in the literature as predictors of climate policy support, such as ideology, climate concern, education, income, gender, age, and urban–rural divide. We also control for participants’ overall satisfaction with the French government to isolate the treatment effects from political biases, as our experiment involves a fictitious government announcement without priming on its political leaning. Additionally, since the costly policies target behavior related to car and air travel, we control for respondents’ actual use of these modes of transportation. The operationalization and descriptives of these variables are provided in Section A.5 of the Supplementary Material.
Design of Study 2
While our experiments tested the hypothesized effect on a representative sample of the French population, we complement this with qualitative evidence to better assess the underlying mechanisms (Greene, Caracelli, and Graham Reference Greene, Caracelli and Graham1989).
To do this, we rely on qualitative fieldwork conducted across three diverse French regions: Alsace, Lorraine, and Brittany. These regions encompass varying socioeconomic developments, economic structures (industrial, agricultural, service oriented), inequalities, and electoral outcomes (see Talandier and Acadie Reference Talandier and Acadie2023, for a typology of French territories). This geographic diversity provided a rich context for interviewing citizens from different backgrounds. While not aiming for a representative sample, we sought to capture a broad range of perspectives by ensuring diversity in sociodemographic characteristics such as age, gender, occupation, education, income, and location. We employed a mix of snowball and purposive sampling methods. Following Cramer (Reference Cramer2016), we first engaged with key entry points to avoid being confined to a single social network and leveraged their help to connect with a diverse pool of local residents. This approach allowed us to access a wide range of viewpoints while fostering trust—crucial for open and candid discussions—thereby overcoming common challenges in qualitative fieldwork (Cramer Reference Cramer2016; Norgaard Reference Norgaard2011).
Following the interpretative methodology of Walsh (Reference Walsh2012), our research aimed to understand how individuals perceive the green transition. We conducted 53 semistructured interviews with 63 citizens,Footnote 5, Footnote 6 covering themes such as environmental concerns, daily practices, and opinions on climate policies. Additionally, we presented 16 specific policies (detailed in Section B.6 of the Supplementary Material) to examine participants’ reasoning behind their support or opposition. The interviews focused on our main dependent variable. We explore respondents’ attitudes toward different costly climate policies and on what, in their view, could increase public support. Our aim was not to prime respondents with symbolic policies by asking them to evaluate such measures directly, but rather to observe the extent to which these concerns would be raised unprompted. It also enabled us to see when specific issues related to symbolic policies (e.g., billionaires flying in private jets) emerged spontaneously in discussions and the thought processes leading to these mentions. This approach provides insights into why citizens may oppose a policy but express more favorable views under certain conditions. Further details on the qualitative methodology are provided in Section B of the Supplementary Material.
Design of Study 3
To address potential concerns regarding the identification of the effect of symbolic policies in Study 1, and to expand the scope of policies studied while testing mechanisms identified in the qualitative interviews, we designed a second survey with additional experiments (Table 2). The survey, which included 3,300 respondents, was conducted using the Bilendi access panel and fielded between December 2024 and January 2025.
Comparison of Announcements in Study 3

While we replicated the first experiment on highways and political elites, this second survey introduced several key differences. To better isolate the effect of symbolic policies, we divided the sample into five groups. The first two groups remained unchanged: a control group that was only presented with the costly policy and another group that saw both the costly and symbolic policies together. However, we added a third group that was shown only the symbolic policy. Additionally, two more groups were introduced: one presented with the costly policy along with an explicit statement that the symbolic policy would not be implemented, and another showed the symbolic policy with a clear indication that the government would dismiss the costly policy. This design allows us to better assess the standalone effect of symbolic policies and how they interact with different configurations of costly policies.
Additionally, we also tested a new costly policy regarding a carbon tax and a new symbolic policy signaling citizen participation. The carbon tax had been at the root of the Yellow Vests movement and stands emblematically for the lack of citizen consultation or involvement in the design of climate policies (Driscoll Reference Driscoll2023). It allows us to test to what extent symbolic policies can also affect support for policies imposing financial rather than behavioral costs. In this context, we examine whether holding an annual parliamentary discussion on an environmental measure proposed by citizens can increase public support for the carbon tax. We consider this policy to be symbolic, as it would primarily serve the purpose of signaling participation. We acknowledge that this symbolic policy may nonetheless have some practical implications if the parliamentary discussion leads to concrete proposals with potentially meaningful and tangible effects on national politics and policymaking. However, given the limited scope and vagueness of the proposed measure (a single annual discussion) and the absence of any binding mechanism to ensure that citizens’ proposals are implemented, we consider its practical implications to be potentially minimal and unlikely to signal substantial material impacts. In contrast, such a policy rather symbolically signals that the government is willing to involve citizens in the decision-making process. Overall, given the contentious nature of the costly policy (the carbon tax) and the framing of the symbolic policy (as a signal of participation), any positive effects of the symbolic measure would provide robust evidence of its potential impact.
The final distinction from the first experiment was the inclusion of four additional survey questions, administered after respondents viewed the government announcement, alongside the item measuring support. The first three questions, informed by our qualitative findings and outlined in the theoretical section, aimed to offer deeper insights into the mechanisms behind the effect of symbolic policies. Since perceived fairness emerged as a key factor in opposition to costly climate policies, we examined how different treatments influenced citizens’ perceptions of the distributive and procedural fairness of the government announcement. Second, following the potential mechanism related to elite perceptions, we included questions on elite attitudes toward climate policies to investigate whether symbolic policies improve perceptions of elite exemplarity and responsiveness. Since the role of elites varied across the two experiments, these questions were slightly adapted to fit each specific government announcement. Third, to investigate our mechanism around credibility and to anticipate the argument that symbolic policies may be dismissed as mere “cheap talk,” we also asked respondents to assess whether the announcement signaled a genuine government commitment to climate action. On top of these mechanisms previously discussed, we also add another item aimed to measure perceptions of policy effectiveness. Given that symbolic policies are, by design, expected to have a limited direct impact on policy outcomes (in this case carbon emissions), we test the extent to which respondents see these policies as effective and whether their bundling with costly policies increases perceived effectiveness of the announcement. The framing of the survey questions is presented in Table 3.
Survey Questions for Highway and Carbon Tax Announcements

For Study 3, we estimate average treatment effects using the same OLS specification as in Study 1, including identical covariates controlling for respondents’ left–right self-placement, climate concern, education, income, gender, age, urban–rural residence, satisfaction with the government, and main mode of transportation. This ensures the study closely replicates Study 1 and allows for robust comparisons across experiments. Descriptives and operationalization of these variables are provided in Section C.5 of the Supplementary Material.
RESULTS
Study 1
To begin with, we present the results of our first survey (for replication data, see Tallent, Jan, and Sattelmayer Reference Tallent, Malo and Luis2026). To facilitate interpretation, the OLS estimates are rescaled to express changes as percentages of the full response range on the original 1–4 support scale (1 = totally disagree, 4 = totally agree). We also report standardized effect sizes, expressed as changes in standard deviations units of support relative to the control group. As shown in Figure 1, support for costly climate policies increases across all four configurations when these policies are presented alongside a symbolic measure.
Treatment Effects of Symbolic Policies on Support for Costly Policies
Note: Coefficients are estimated from ordinary least squares (OLS) models with outcomes rescaled to express changes as a percentage of the full 1–4 scale range. Points denote percentage changes to the outcome scale compared to the control groups and horizontal bars show 95% confidence intervals. In parentheses, average treatment effects (ATE) on the original 1 (totally disagree)–4 (totally agree) scale are reported alongside standardized effect sizes (SD) measuring changes in standard deviations of support relative to the control group. The full regression tables with all control variables can be found in Table 3 in Section A.6 of the Supplementary Material.

Looking at the first experiment, which concerns the reduction of the highway speed limit to 110 km/h, the symbolic policy targeting the wealthiest citizens yields a 16.5% increase in support for the government announcement, corresponding to an increase of 0.47 standard deviation units relative to the control group. Similarly, the policy centered around politicians produces an even larger increase of 19.8%, equivalent to 0.56 standard deviation units, when the symbolic measure is paired with the costly policy.
The second experiment yields similar results. The support for banning flights if a train alternative in less than 5 hours is available is statistically significantly higher when this announcement is accompanied by either of the two proposed symbolic policies. Prohibiting the use of private jets for the rich raises the support for the announcement by 3.5%, which corresponds to an increase of 0.12 standard deviation units. Consistently, the symbolic policy targeting politicians flying by plane leads to an increase in support of 7%, equivalent to 0.25 standard deviation units. The above presented treatment effects all hold when controlling for important drivers of climate policy support (see Table 3 in Section A.6 of the Supplementary Material). To ensure our results are robust across key subgroups, we also examine heterogeneous effects reported in Section A.7 of the Supplementary Material. These tests conclude that the effect of the symbolic policy is not driven by left–right self-placement or by people that rely on their car as main mode of transportation and who would be disproportionately affected. Finally, the effect is also consistent across people with favorable or opposing attitudes toward climate policies in general.
By testing our hypothesis with different configurations of costly and symbolic policies, our results robustly support that symbolic policies have the potential to increase the support for otherwise costly policies. This means that policies which have no material impact on most individuals can increase support for otherwise costly policies because of the symbolic effect of targeting powerful and negatively perceived elites. The coefficients indicate that these effects are not only statistically significant, but also substantially important.
Furthermore, our results indicate that the effects of symbolic policies are more pronounced in support for the policy limiting highway speeds than for the policy banning national flights. Comparing the coefficients presented in Figure 1, we can observe a stronger effect of the symbolic policies of the first experiment. We believe that this might be due to symbolic policies having a differently strong effect depending on the perceived costs of the initial climate policy.
We discuss these differences in Figure 2, where we observe that support for limiting the speed on highways is more evenly distributed than for the national flight ban policy, indicating more opposition to the former. This seems to indicate that the speed limit policy is perceived as more costly than the flight policy. Looking at the distribution of the variables on car and flight use, we observe that these two climate policies differ in the scope of people they are likely to impose constraints on and therefore its material impacts. While nearly half of the respondents indicated that they primarily use a car for transportation, only about 35% had used a plane in the past 12 months. This suggests that fewer people will perceive the flight policy as behaviorally costly compared to the car-related policy, as it affects a smaller portion of the population.
Support for Costly Climate Policies by Treatment Group
Note: Figure shows how respondents in the control and treatments groups evaluated the two costly climate policies. Support is expressed as the percentage of respondents in each response category.

Additionally, Figure 1 shows that in both experiments the effect of symbolic climate policies also varies depending on their target. The effect of the symbolic policy on the overall support is stronger when targeting politicians than when targeting the wealthy. Although these differences are not strongly statistically significant, they suggest that symbolic policies might be more effective when targeting politicians, who also are the ones implementing them, rather than the wealthiest citizens. One possible explanation is that the symbolic policy targeting the rich is less popular than the one targeting politicians. Unlike the latter, it has a greater material impact and some effect on climate emissions, making it less purely symbolic. Additionally, the very affluent may have a slightly better public image than politicians, reducing the policy’s symbolic effect. In contrast, politicians tend to provoke stronger reactions, as fewer people identify with them and public discontent toward them is higher. Moreover, since politicians directly propose and implement policies, their symbolic contribution to climate action may carry more weight in boosting public support.
Study 2
To further understand the mechanisms behind our experimental results, we draw on qualitative evidence from fieldwork conducted across France in 2023 and 2024. The interviews help explain why symbolic policies targeting the wealthy or political elites can foster support for stringent policies. Consistently mentioned throughout the fieldwork, the perceived fairness in the distribution of material costs emerged as a significant factor of opposition to costly climate policies, hereby confirming previous research in climate politics (Gaikwad, Genovese, and Tingley Reference Gaikwad, Genovese and Tingley2022). However, while interviewees did not necessarily mention the direct need to implement symbolic climate policies, they also often referred to their perceptions of the behaviors of economic and political elites to explain their views on costly climate policies. Beyond these issues, they brought forward additional concerns (e.g., around procedural fairness) on which symbolic policies could intervene—hereby laying the foundations for Study 3.
Our discussions over the symbolic dimensions of the green transition and behaviors like flying with private jets, allow for a broader understanding of fairness as driven by the material impact of the policy, as well as the meaning associated with it. While interviewees consistently mentioned that they felt that the distribution of costs was uneven, they especially centered their narratives around the position and behaviors of wealthy and powerful actors. Interviewee 34, a small-town mayor who defined himself as progreen transition and engaging in proenvironmental behaviors illustrates the importance of financially compensating the costs of stringent climate policies through social measures as follows:
[…] if all the environmental measures are accompanied by social or societal measures, I think we can get through. But it’s absolutely essential that the environmental measures are compensated for people who don’t have the money. (Interview 34)
At the same time, however, the interviewee further emphasized the significance of symbolically targeting the behavior of the wealthy. He explained that people like him, who can afford the costs and make efforts by purchasing electric cars, installing solar panels on their roofs, and adopting heat pumps, also need to see those with highly carbon-intensive lifestyles contributing as well. To him, a fair transition is not solely about a fair compensation of material costs, it is also about ensuring the symbolic contribution of all.
Interviewee 34: When you hear that I don’t know which a**hole took his plane from Marseille to Nice, you say “what I saved for a year by pissing myself off, he cracked it in 30 seconds.” So there absolutely has to be a social rebalancing. […] Money shouldn’t allow people to pollute, it shouldn’t allow them to waste water, no, that’s no longer possible.
Interviewer: Do you think that people would be more receptive, if we put policies in place but at the same time tried to target this kind of behavior?
Interviewee 34: Well, that’s for sure. That’s obvious. In any case, we won’t be able to get one through if we don’t have the other. Even if it does represent 0.5% of emissions, we don’t care about that, that’s not the problem. It’s not the problem. There’s no reason why some people should have the right to pollute, to do things, to do things, just because they have money. That’s no longer understandable.
Even when interviewees acknowledged the limited impact this might have on climate change or the burden on individuals, they still emphasized the importance of targeting such behavior, highlighting that the perceived inaction of the elite may signal a lack of commitment and exemplarity. In this sense, while the current meaning attached to costly climate policies alone is that of an unfair transition, a symbolic policy targeting the elite could alter the message, thus shift the understanding of it and, therefore, enhance support by signaling fairness through the contribution of all.
This aspect of fairness is visible in the attitude of interviewees potentially targeted by costly policies. For them, even though their own behaviors might be impacted by a costly policy (like a ban on short-haul flights), their support for such a policy partly depends on the contribution of the wealthiest actors. When asked about the proposal to ban short-haul flights, Interviewee 23, a young working class individual from a rural area who travels by plane about twice a year, speaks about the unfairness of a policy limiting his travels. While extremely wealthy individuals, such as rich football players, would likely still be able to continue their excessive behaviors by using their private jets, he states that:
If it’s just going from A to B, I think they should ban [short-haul flights]. But you see, in that case, say they ban them. But football players who take their jet 30 times a month, it’s the same thing… I come back to the same main idea: for me, it’s always the “big” [actors] who are the problem. Because they can ban or… increase the price of certain flights, but that won’t stop Messi from taking his jet 10 times a day if he wants to.
In this case as across other interviews,Footnote 7 even if individuals may be negatively affected, the necessity to compensate for the material costs of climate policies or the desire to reduce these costs by limiting their scope both matter less. Instead, it is about ensuring that all actors symbolically “do their parts,” especially the very small group of super-rich individuals. In addition to the material impact, people attribute a certain meaning to the policy which triggers the feeling that not everybody is doing their fair part. Symbolic climate policies, as defined in this article, can precisely tap into this feeling and serve this purpose by enhancing a perception of collective action.
Citizens also oppose climate policies because they perceive a mismatch between what they are asked to do and what those who ask—the politicians—are doing themselves. This is exemplified by the reactions of Interviewees 29a and 29b, two young middle-class residents of a small town in the Lorraine region of potential policies targeting individual plane transportation:
Interviewee 29a: Personally, no, I wouldn’t say to myself: I’m writing off a holiday, for example, if I wanted to go on a trip somewhere, I wouldn’t give it up for environmental reasons, personally.
Interviewee 29b: […] I think there was a study that came out saying that if you wanted to be carbon neutral, you’d have to take a plane once every 8 years, […] over a lifetime, that’s the equivalent of 4 one-way trips to be carbon neutral, or something like that. And then you see politicians flying from Paris to Brittany for a school trip, and the guy is back at [the Parliament] an hour later… Making big, moralizing speeches about “yes, we have to be careful” […] I get the impression that we’re being taken for a ride.
Interviewee 29a: That goes back to what I was saying about the hypocrisy of “do that but”…
Here, the costly policy is perceived as unfair due to the behavior of politicians who do not hold themselves to the same standard which they impose on others. A symbolic policy signaling commitment from ministers may shift this understanding and enhance perceived exemplarity—and hence, climate policy support. Interestingly, this analysis echoes findings from the conditional cooperation literature, which shows that people’s willingness to support costly collective action increases when they believe that others with greater resources or responsibility—in our case, elites—are also contributing.
However, it is also evident that this discontent is partly fueled by a deeper resentment toward political elites and the government, largely shared by other interviewees.Footnote 8 Earlier, Interviewee 29a, for example, is not outright opposed to reducing his airplane consumption but expresses very strong emotions toward political elites, thus justifying his opposition to potentially imposed restrictions. The resentment generated by the perceived hypocrisy of politicians produces an expectation that they should be leading by example, a feeling that symbolic policies can precisely play on. This is exemplified by Interview 9 with a middle-class female industrial worker in a suburban area when discussing the question of limiting individual air transportation:
Interviewee 9: Personally, we don’t really fly, so it’s not a problem for me. This year, we’d planned to go on holiday by plane, but we canceled because prices had gone up enormously. They should take away the private jets already. […] All that government stuff, all that, they all travel by jet to do… that’s it. I think they should set an example.
Beyond fairness and antielite attitudes, interviewees’ reactions also reveal doubts about the seriousness of climate action. When citizens see elites exempting themselves from sacrifice, they question whether costly measures are genuinely credible. Interview 16, a 50-year-old middle-class woman working in local administration, illustrates this logic when discussing the responsibilities of individuals:
Interviewee 16: I was talking with my neighbor who always feels guilty about taking the plane 1 to 3 times a year… But it’s nothing compared to those in jets or those who spend their lives in planes. Here, credibility depends on whether high emitters such as political and economic elites also face constraints. Symbolic policies targeting elites may thus reassure citizens that climate action is pursued seriously and consistently.
Finally, while concerns over the fair distribution of costs and the behaviors and position of elites were widespread, so were grievances related to the feeling of being neglected and unheard by politicians.Footnote 9 Interviewee 46a, a middle-class 50-year-old man in a coastal area, insisted on the necessity to listen to people’s voices and ideas when conducting the green transition.
Interviewee 46a: Being as close as possible to the people, the territory, not necessarily imposing laws from above, but discussing with people what they need, what they think, and then not going back up there and then redoing their thing when they already have their own idea.
This implies that a symbolic policy signaling procedural fairness may partly shift this negative perception among the population and enhance support for otherwise costly policy.
To sum up our qualitative evidence, we find direct support for our core argument regarding the use of symbolic climate policies, as well as potential mechanisms behind their effect on climate policy support. Throughout the interviews, citizens did refer to the financial costs and compensation measures that could help in building support for climate policies. Yet, citizens further justified their positions on costly climate policies by emphasizing a general perception of uneven exposure to costs, unfair contribution to climate action, and resentment toward the elites’ behavior and position. This produces a perception of the green transition as unfair and enacted by an elite that does not credibly show the required seriousness in their own actions. This perceived unfairness and the created resentment can be mediated through symbolic policies targeting these elites, as revealed across interviews and confirmed in Study 1. Suggested symbolic policies generate for instance the feeling that those who pollute the most or those who impose constraints on citizens also partake in sharing the burdens. In doing so, the meaning attached to climate action may hence partly shift, conveying new messages around fairness, collective action, and elite exemplarity. Furthermore, the qualitative evidence brought forward additional insights into citizens’ discontent and the symbolic dimension on which policies could act, such as around procedural fairness. As shown here, symbolic policies could potentially also tap into the desire of being involved in the decision-making process (as further tested in Study 3), while making sure that people feel exposed to “fair” costs while following policies enacted by a responsible elite (as shown in Study 1 and replicated in Study 3 next). As a result, we deduce that individuals would become more accepting of costly policies in such a context.
Study 3
Study 3 proceeds in three steps. First, we replicate the speed limit experiment of Study 1 with additional treatment groups. Second, this time we test the effect of an additional symbolic policy, which is not targeted against elites, on a costly climate policy that is not restricting behavior but imposing financial costs. Third, with additional survey questions, we test the detailed mechanisms through which symbolic policies can operate.
The findings of our second survey replicate the first study examining the effects of the symbolic policy targeting ministers on support for the speed limit. One of the limits of Study 1 was that it did not fully test the effect of the symbolic policy itself, but only together with the costly one. Therefore, one of the new treatment groups saw only the symbolic policy. Additionally, we also included one treatment group with the costly policy, while the symbolic one was explicitly dismissed, and another one with the symbolic policy, while the costly one was explicitly dismissed. The rationale behind this decision stemmed from the qualitative fieldwork during which the interviewees consistently emphasized that the elite enacting the policies did not follow the same rules. As further detailed next, we also test a configuration of Symbolic + No costly to elucidate how the explicit absence of a costly policy might impact the ability of the symbolic one to signal commitment to climate action.
Figure 3 shows that pairing the costly policy with the symbolic policy increases support by 16.5% of the full scale range relative to the control group, closely mirroring the findings from Study 1. This consistency indicates that our results are robust across different samples of the French population. Testing the symbolic policy alone reveals that it is the most supported proposal, with support increasing by 41.3% of the scale range, and 92% of respondents in this treatment group favoring the policy. The Symbolic + No costly condition also produces a substantial positive effect on support, though less pronounced than for the symbolic policy alone. Finally, exposure to the Costly + No symbolic treatment reduces support relative to the control group by 7.9% of the scale range.
Treatment Effects on Support for Costly Climate Policies
Note: Coefficients show the estimated change in support expressed as a percentage of the full 1–4 response-scale range. Points denote percentage changes to the outcome scale compared to the control groups and horizontal bars show 95% confidence intervals. In parentheses, average treatment effects (ATE) on the original 1 (totally disagree)–4 (totally agree) scale are reported alongside standardized effect sizes (SD) measuring changes in standard deviations of support relative to the control group. The dashed line denotes zero effect. The costly policy is to limit the speed on highways to 110 km/h. The symbolic policy is that ministers switch from plane to trains for their domestic travels. The control group refers to respondents exposed only to the costly policy. The regression table with all control variables can be found in Table 8 in Section C.6 of the Supplementary Material.

These results provide deeper insight into the interaction between symbolic and costly policies. First, the broad support for the symbolic policy alone suggests that it may play a crucial role in increasing public backing for costly climate policies. However, this effect cannot be attributed solely to the symbolic policy’s appeal. A widely supported policy does not automatically translate into greater acceptance of a costly policy that might otherwise face resistance. Instead, we argue that the symbolic policy helps reshape how the costly policy is perceived. Without the costly component, the symbolic policy receives less support than when presented alone, highlighting how failing to signal a credible commitment to climate action can weaken support among certain segments of the electorate. Conversely, a costly policy without a symbolic element may reinforce perceptions of elite hypocrisy (Study 2), leading to even lower support than the control group. As we will elaborate further, it is the interaction between symbolic and costly policies that ultimately drives shifts in policy support.
Next, building on our previous experiments, which had focused exclusively on symbolic policies targeting political and economic elites, we broaden our analysis to include other symbolic policies. Rather than imposing a direct burden on target groups, the new one signals a commitment to citizen participation which was a key theme emerging from our interviews. Hence, the symbolic policy involves introducing a yearly parliamentary discussion of an environmental measure proposed by citizens. We test its impact on improving support for a carbon tax, demonstrating that symbolic policies may not only complement behavioral measures (such as the speed limit or the flight ban in Study 1), but also enhance support for more financially impactful and contested policies that are widely studied in the literature.
Figure 4 illustrates that the effect of the costly policy paired with the symbolic policy is an increase in support by 10.1% compared to the control group. For groups exposed to the symbolic policy alone and the symbolic policy explicitly without the costly policy, we observe increases in support by 44.7% and 38.6%, respectively. Again, the symbolic policy outscores all other treatment groups compared to the control group. Consistent with findings from the symbolic policy targeting ministers, 85% of respondents express support for the symbolic policy when asked about it in isolation. However, contrary to the first study and our expectations, exposure to the costly policy explicitly without the symbolic element slightly increases support compared to the costly policy on its own.
Treatment Effects on Support for Costly Climate Policies
Note: Coefficients show the estimated change in support expressed as a percentage of the full 1–4 response-scale range. Points denote percentage changes to the outcome scale compared to the control groups and horizontal bars show 95% confidence intervals. In parentheses, average treatment effects (ATE) on the original 1–4 scale original 1 (totally disagree)–4 (totally agree) are reported alongside standardized effect sizes (SD) measuring changes in standard deviations of support relative to the control group. The dashed line denotes zero effect. The dashed line denotes zero effect. The costly policy is a carbon tax. The symbolic policy is the yearly parliamentary discussion of an environmental measure proposed by citizens. The control group refers to respondents exposed only to the costly policy. The regression table with all control variables can be found in Table 8 in Section C.6 of the Supplementary Material.

Hence, our results demonstrate that the potential of symbolic policies extends beyond symbols targeting elites and can also operate through other messages, such as appeals to procedural fairness. These findings become even more significant when viewed within the broader context of France. The proposal of a carbon tax was at the root of the Yellow Vest movement, which caused a national crisis in the country. Increasing public support for such a highly contentious policy through the use of a symbolic policy represents a far-reaching insight.
Finally, to gain deeper insight into the mechanisms at play, we incorporated four additional questions in our second survey. These questions aimed to examine how exposure to different treatment groups influenced perceptions of distributive and procedural fairness, and the perceptions of elite behavior in the implementation of climate policies.
Starting with the model on fairness, we observe similar patterns across all groups and policies as in the support models. As shown in Figure 5, which displays the estimates of the models, respondents considered the symbolic policy alone to be the fairest, while the costly policy without any symbolic element was seen as the most unfair. Once again, when paired with a symbolic policy, respondents perceived the announcement, including the costly policy, as fairer than when the costly policy was presented alone. This underlines that the mechanisms identified in Study 2 also apply to the general population and that symbolic policies can shape how fair a costly policy is perceived to be, without directly altering its actual costs.
Treatment Effects of the Symbolic Policies on Perceptions of Policy Effectiveness, and Fairness, as Well as Views on the Elite and Government Seriousness of the Different Policy Announcements
Note: Coefficients show the estimated change in perceptions expressed as a percentage of the full 1–4 response-scale range. Points denote percentage changes to the outcome scale compared to the control groups and horizontal bars show 95% confidence intervals. The costly policies are either a carbon tax or the speed limit on highways. The symbolic policy for the carbon tax is a yearly parliamentary discussion of an environmental measure proposed by citizens, while the symbolic policy for the highways is to force ministers to take the train instead of the plane for national travels. The control group refers to respondents exposed only to the costly policy. The regression table with all control variables can be found in Tables 9–12 in Section C.6 of the Supplementary Material.

Building on our interviews, which highlight perceptions of policymaker hypocrisy and their failure to adequately consider citizens’ views, we examine how symbolic policies influence these perceptions of elite behavior. Specifically, we explore how the symbolic policy targeting ministers signals that politicians are doing their part, while a symbolic policy focused on participation conveys that citizens’ voices are being heard. Our findings suggest that symbolic policies shape these perceptions. Whether implemented alongside costly policies or on their own, symbolic policies lead respondents to view politicians’ actions more favorably. In particular, citizens are more likely to see politicians as actively contributing to climate action when a symbolic policy is introduced. Likewise, the promotion of a yearly parliamentary discussion on a citizens’ environmental proposal enhances the perception that political elites are taking citizens’s views into account. These results indicate that one key mechanism behind the impact of symbolic policies is their ability to reduce elite resentment by signaling that politicians are actively contributing to climate action and being responsive to citizens’ concerns.
Finally, we look at how credible respondents perceive the government announcement to be across different groups. As discussed, climate policies may be perceived as noncredible if governments fail to show that they are properly committed to climate action. Symbolic policies, in particular, may be criticized as mere “cheap talk” or greenwashing, where the government is seen as not truly committed to addressing climate change through such measures. Therefore, if respondents perceive symbolic policies as cheap talk, we would expect our models to show that they evaluate governments promoting such policies as lacking credibility in their climate action efforts. However, the models reveal a similar pattern to what we found previously: governments promoting symbolic policies are perceived as more serious in fighting climate change than when these policies are not included or explicitly excluded. This not only shows that symbolic policies are credible, but also that they change how credible the costly policy is perceived. In this way, symbolic policies appear to successfully signal to citizens that politicians are seriously committed to fighting climate change and can serve as commitment devices, reducing uncertainty about the government’s seriousness in its endeavor.
Finally, we turn to examining how effective respondents perceive the government announcement to be in reducing greenhouse gas emissions across different groups. Unlike costly climate policies, which are designed to significantly reduce emissions, symbolic policies, at least the ones we study here, would have a negligible impact on this outcome and may therefore be viewed as ineffective despite their popularity. However, our findings surprisingly show the opposite. Respondents exposed to the symbolic policy alone perceived the government announcement as the most effective. Unexpectedly, the group that saw the costly policy paired with the symbolic one considered the announcement more effective than the costly policy alone. Surprisingly, for both costly policies, citizens view the symbolic policy as more effective than the costly one. Yet, it seems unlikely that citizens accept costly policies bundled with symbolic ones because they believe the symbolic measures are effective in reducing carbon emissions. One alternative explanation for these results could be motivated reasoning (Feldman and Hart Reference Feldman and Hart2018), whereby respondents who favor symbolic policies perceive them as more effective than they actually are. Since respondents prefer symbolic over costly policies, they may want to believe the symbolic measures are more effective. Nevertheless, the results still suggest that the limited substantive impact of symbolic policies does not constitute a barrier to increasing support for costly policies.
Overall, our experimental results, whose main results are summarized in Table 4, provide support for our main hypothesis that the introduction of symbolic policies improves support for costly climate policies. Further, our quantitative investigation into the mechanisms behind the effects of symbolic policies on support for costly policies aligns with our qualitative findings. We demonstrate that symbolic policies address feelings of unfairness—both distributive and procedural—as well as negative perceptions of elite behavior, whether in terms of their own actions, the decision-making process, or government credibility in climate action. When combined with a symbolic policy, elites are seen as more engaged and responsive, the sense of an unequal distribution of climate action efforts diminishes, and the government announcement is considered to be more serious. Furthermore, our results suggest that symbolic policies increase support without being perceived as ineffective in addressing climate change or as mere empty rhetoric from governments.
Summary of Main Experimental Results

CONCLUSION
In this article, we offer a new perspective on the factors driving climate policy support. We introduce a conceptual framework and present empirical evidence on the impact of symbolic policies in boosting support for more costly climate policies. Drawing on the symbolic politics literature, we define symbolic policies as those having low material impact on groups or individuals, while conveying meaningful messages to the public. We argue that symbolic policies can help reduce opposition to costly policies by influencing the message these policies convey. While symbolic policies have minimal material impact and do not change the actual material costs of costly policies, they can shape public perceptions and alter how these policies are understood.
Our first study, based on survey experiments, demonstrates that symbolic policies—such as those targeting the behaviors of the ultra-rich and politicians—can significantly boost public support for costly climate policies when paired together. We find that the impact of a symbolic policy is more pronounced when paired with highway speed limits rather than flight bans. We explain this through the fact that flight bans would affect less people than a change of speed limits. Furthermore, we observe that symbolic policies targeting politicians have a stronger effect than those focused on the wealthiest individuals.
Our second study, based on qualitative interviews, explores the mechanisms behind these effects. We find that perceived fairness of both the costs and the decision-making process, along with resentment over double standards by political elites are key reasons citizens reject costly climate policies. However, the interviews suggest that if powerful groups symbolically “do their part” or if political elites “lead by example,” and show responsiveness to citizens’ concerns—something a symbolic climate policy aims to signal—this can reduce perceived unfairness and resentment. As a result, citizens are more likely to accept the imposed costs. This shows that symbolic policies help mediate the impact of climate policy costs on support.
Study 3 extends Studies 1 and 2 by refining the experimental design, expanding the policy types examined, and testing additional mechanisms through further survey experiments. It replicates the speed limit experiment from Study 1 with similar findings, showing that symbolic policies promoted alone are most supported, while their explicit exclusion decreases policy support. The study also expands the analysis to include symbolic policies not directly targeting elites but signaling commitment to citizens’ participation, such as a yearly parliamentary discussion on a citizen-promoted environmental measure, which influences support for costly climate policies like carbon taxes. Finally, testing various mechanisms, we find that when paired with costly policies, symbolic policies improve perceptions of distributive and procedural fairness, enhance positive assessments of elite behavior, and are not seen as ineffective or mere “cheap talk.”
Although our study is limited to France, we believe that our conceptual framework can yield similar results in other European countries, as the costly policies studied and the suggested mechanisms are not country specific. For instance, Germany has had strong political debates regarding the implementation of a speed limit. Similarly, in the United Kingdom, then Prime Minister Rishi Sunak faced significant criticism for using private jets, which set a poor example in efforts to reduce carbon emissions.Footnote 10 However, the variation in the effect of symbolic policies across different countries, the intensity and scope of climate policy costs, and the symbols they can play on remain open questions that require further research. The high effect of the symbolic policy targeting elites in France may not be as pronounced elsewhere, and the specific implementation of symbolic policies is likely to vary by country.
Our study design is limited in its ability to assess the impact of symbolic policies on costly policies within an experimental framework. We are unable to determine the extent to which these effects would persist in the long run, which would largely depend on the credibility of policymakers in designing and implementing such policies. Hence, if governments were to adopt only symbolic policies without ever taking substantive climate action or merely announce these policies without genuine commitment, the message conveyed could backfire, reinforcing existing opposition to climate policies driven by political resentment and cynicism toward political elites. Moreover, the effect of symbolic policies on the support for costly policies could be hampered by potential polarization efforts or counter-arguments raised by opponents of climate policies, which our experimental setting is unable to capture. Finally, this study cannot directly compare the effects of symbolic policies to non-symbolic measures such as material compensation, or assess how targeting elites differs from targeting other groups. Future research could take up these comparisons to refine and nuance the concept of symbolic policies and their role in shaping support for costly climate action.
Our results offer a significant contribution to the literature on climate policy support. Although the role of fairness in explaining why citizens favor less costly climate policies is widely recognized (Maestre-Andrés, Drews, and Bergh Reference Maestre-Andrés, Drews and van den Bergh2019), the literature has primarily concentrated on the impact of compensation schemes to enhance fairness and garner support for these policies (Beiser-McGrath and Bernauer Reference Beiser-McGrath and Bernauer2024). We argue that, in addition to policies aimed at financial compensation for those bearing the costs, symbolic policies can also bolster support for climate policies. While the question of the “symbolic” has been largely ignored in climate policy research, we hope this research will inspire future work in this direction.
More broadly, our results also speak to ongoing debates about cooperation, reciprocity, and the public goods framing of climate politics (e.g., Bechtel, Scheve, and Lieshout Reference Bechtel, Scheve and van Lieshout2022; Mildenberger and Tingley Reference Mildenberger and Tingley2019). To this literature focusing on the cooperative behavior of countries, firms, or ordinary citizens, our contribution is to highlight that in domestic climate politics, the behavior of political and economic elites is particularly salient. Their visibility, privileged position, and frequent association with hypocrisy or free-riding make them a central reference point for fairness judgments. Our framework also contributes to bringing the public goods and distributive conflict perspectives into closer conversation. Opposition to climate policy arises from distributive conflicts at the national level, but is further reinforced by concerns about reciprocity and free-riding. Symbolic policies can address the perceived distribution of costs by signaling that cooperation is genuinely shared and that efforts are reciprocal, particularly through targeting elites.
Furthermore, this research contributes to a broader understanding of public policy and individuals’ attitudes that extends beyond the specific case of climate change. By emphasizing the role of symbolic policies, we provide better insight into how people respond to governmental action, particularly when looking at policy bundles, and highlight dimensions beyond material self-interest. In this regard, we believe our research contributes to the study of other distributive policies. Scholars working on policy support for taxation and redistribution might explore the effect of symbolic policies, such as those capping the income of politicians.
SUPPLEMENTARY MATERIAL
To view supplementary material for this article, please visit http://doi.org/10.1017/S0003055425101408.
DATA AVAILABILITY STATEMENT
Research documentation and data that support the findings of this study are openly available at the American Political Science Review Dataverse repository: https://doi.org/10.7910/DVN/CFAQUC. The survey data from Study 1 are not available in the repository due to licensing restrictions but are accessible on the Sciences Po dataverse upon request. The replication package contains detailed guidance on how to access these data.
AUTHOR CONTRIBUTIONS
All authors contributed equally to this work.
ACKNOWLEDGMENTS
We are grateful to Vin Arceneaux, Cyril Benoit, Diane Bolet, Jacob Edenhofer, Florence Faucher, Federica Genovese, Emiliano Grossman, Jan Rovny, David Rueda, and Ronja Sczepanski for their valuable feedback on earlier versions of this manuscript and for their guidance throughout the research process. We also thank participants in the Nuffield Comparative Political Economy Seminar, the PolBI CIVICA Seminar, the PSA workshop Elections and Climate Change, and the CEE Prepub Seminar for helpful comments and suggestions.
We thank the CDSP at Sciences Po and its support team for making it possible to design and implement the survey for Study 1. We are also grateful to the CEE, Eleonora Russo, and Samia Saadi for their generous and efficient administrative support in funding and carrying out Study 3.
Finally, we thank the editors for their guidance and the three anonymous reviewers for their thoughtful and constructive feedback.
FUNDING STATEMENT
Study 1 was funded by the Center for Socio-Political Data (CDSP) at Sciences Po Paris and the Data and Statistical Studies Department of the French Ministry for the Ecological Transition (CGDD/SDES). Study 3 was funded by the Center for European Studies and Comparative Politics (CEE) at Sciences Po Paris.
CONFLICT OF INTEREST
The authors declare no ethical issues or conflicts of interest in this research.
ETHICAL STANDARDS
The authors declare the human subjects research in this article was reviewed and approved by the Research Ethics Committee of Sciences Po and certificate numbers are provided in the Supplementary Material. The authors affirm that this article adheres to the principles concerning research with human participants laid out in APSA’s Principles and Guidance on Human Subject Research (2020).
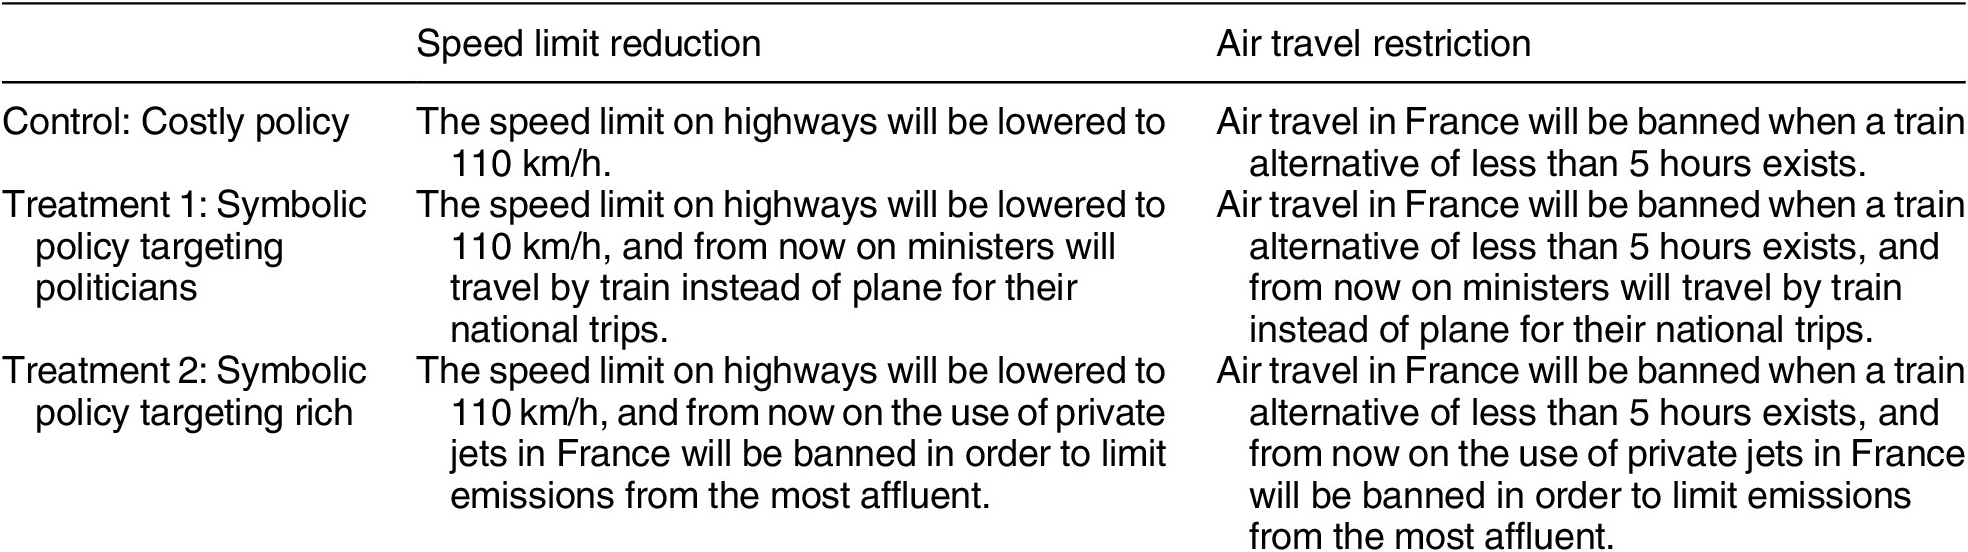
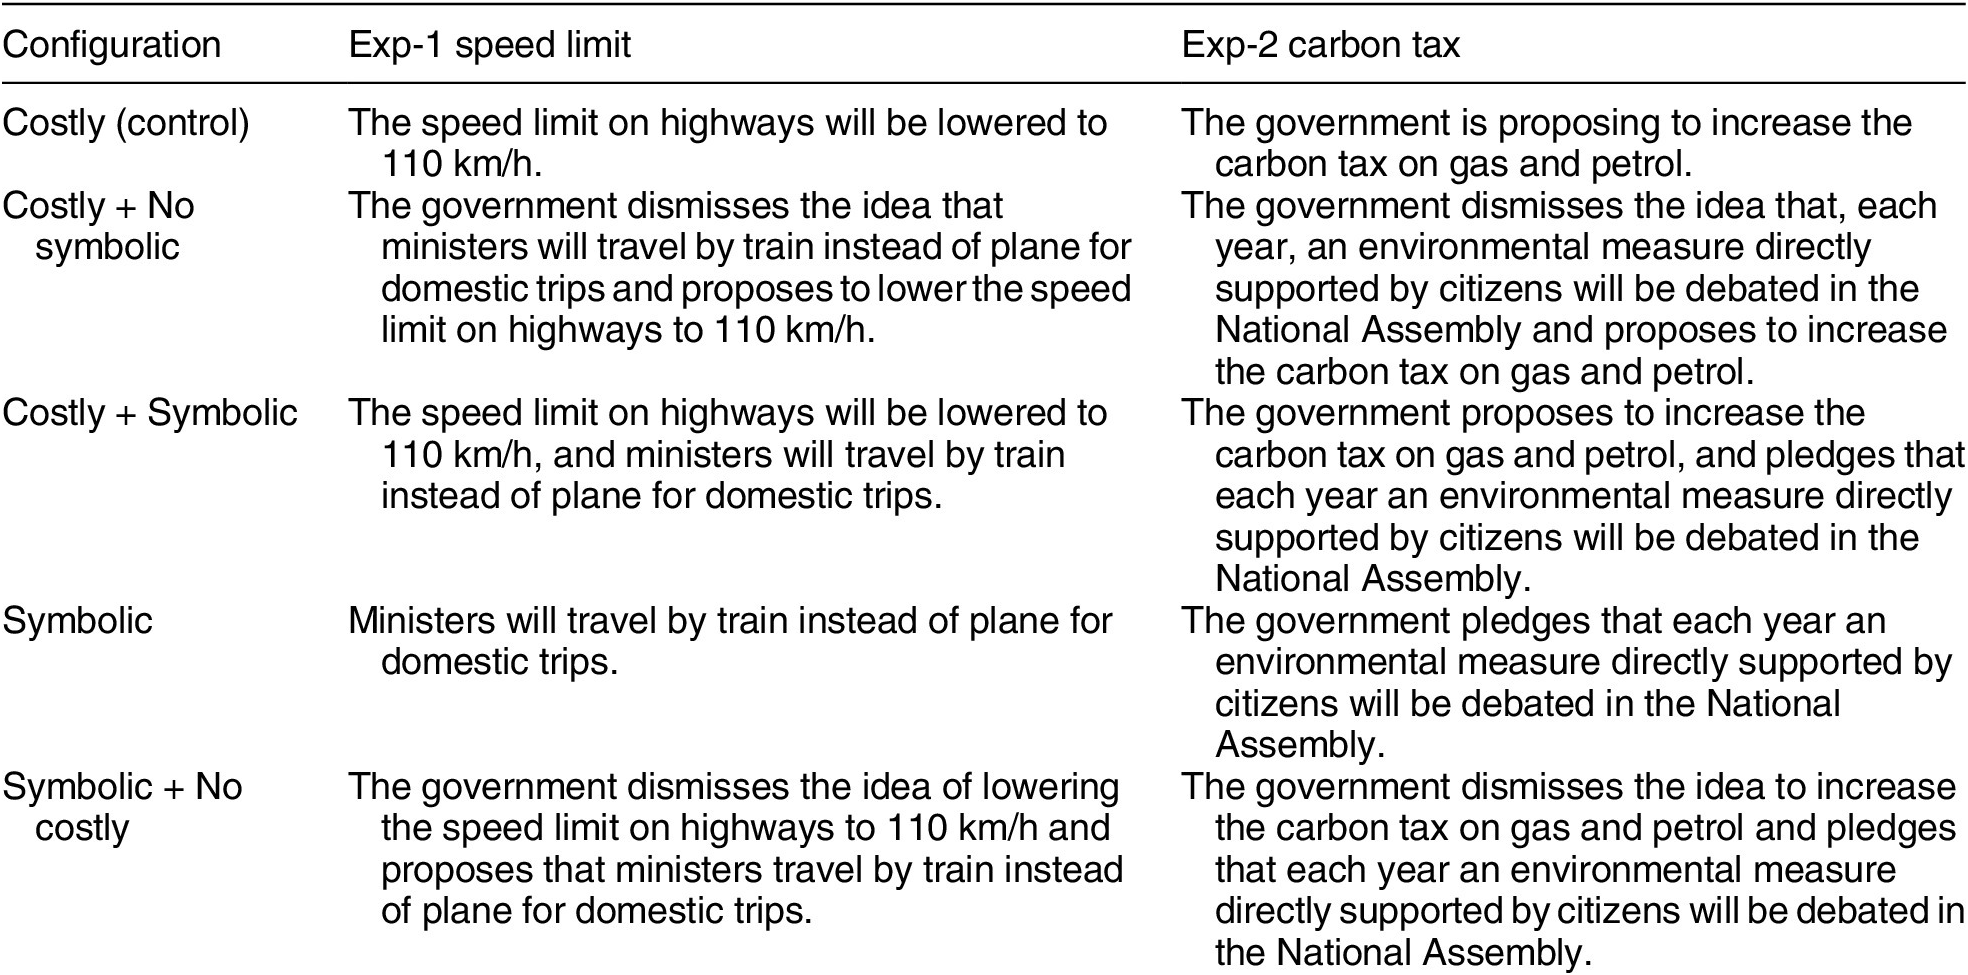
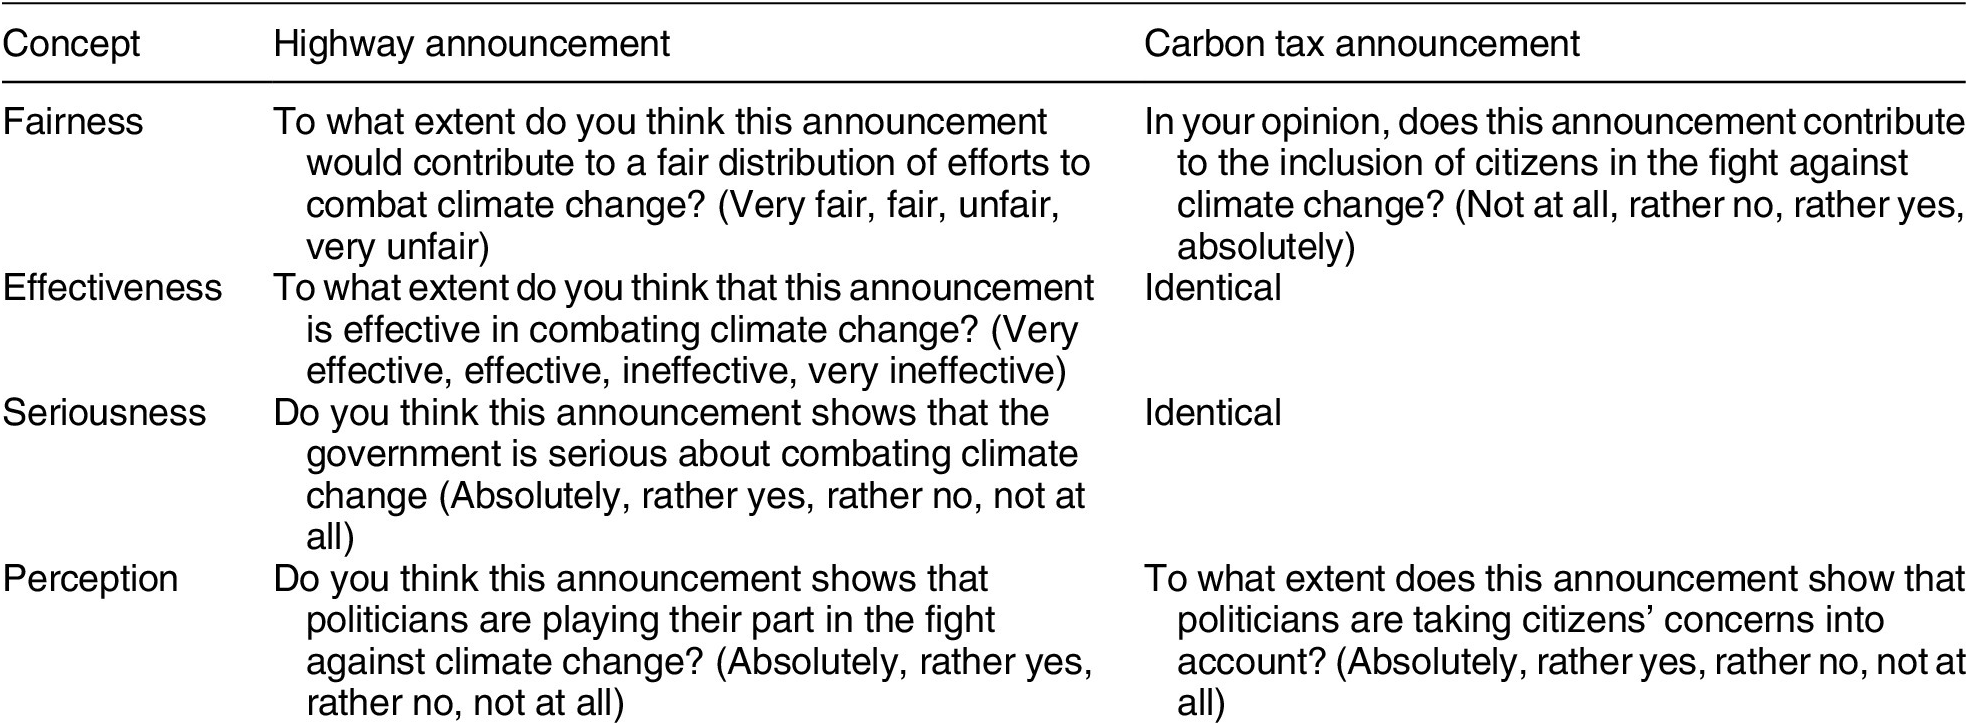

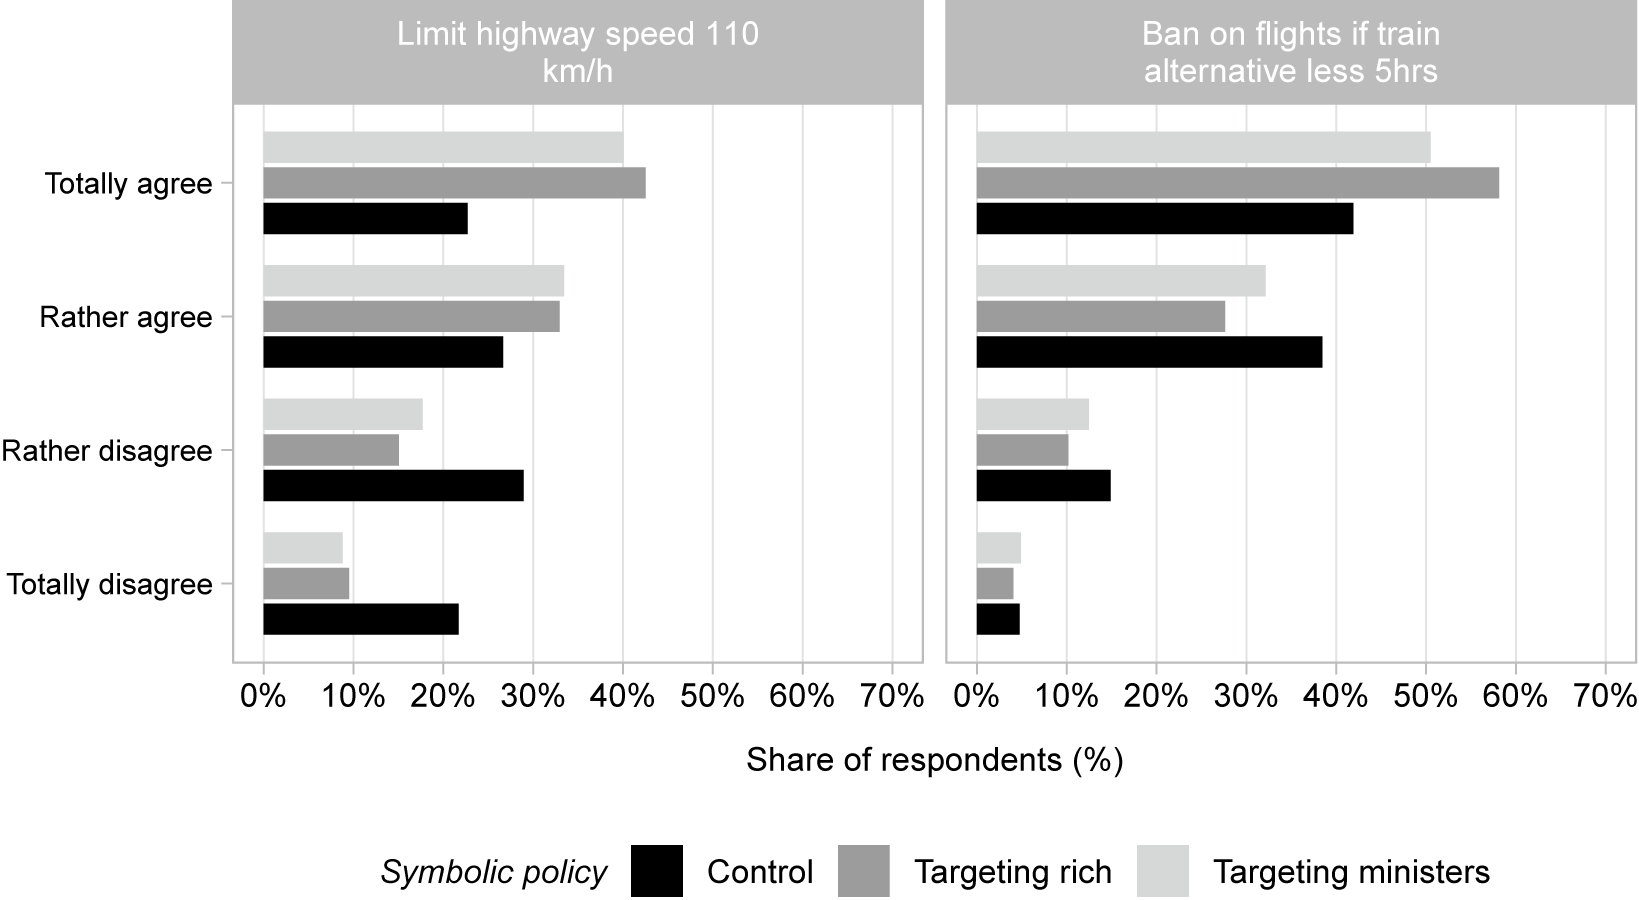
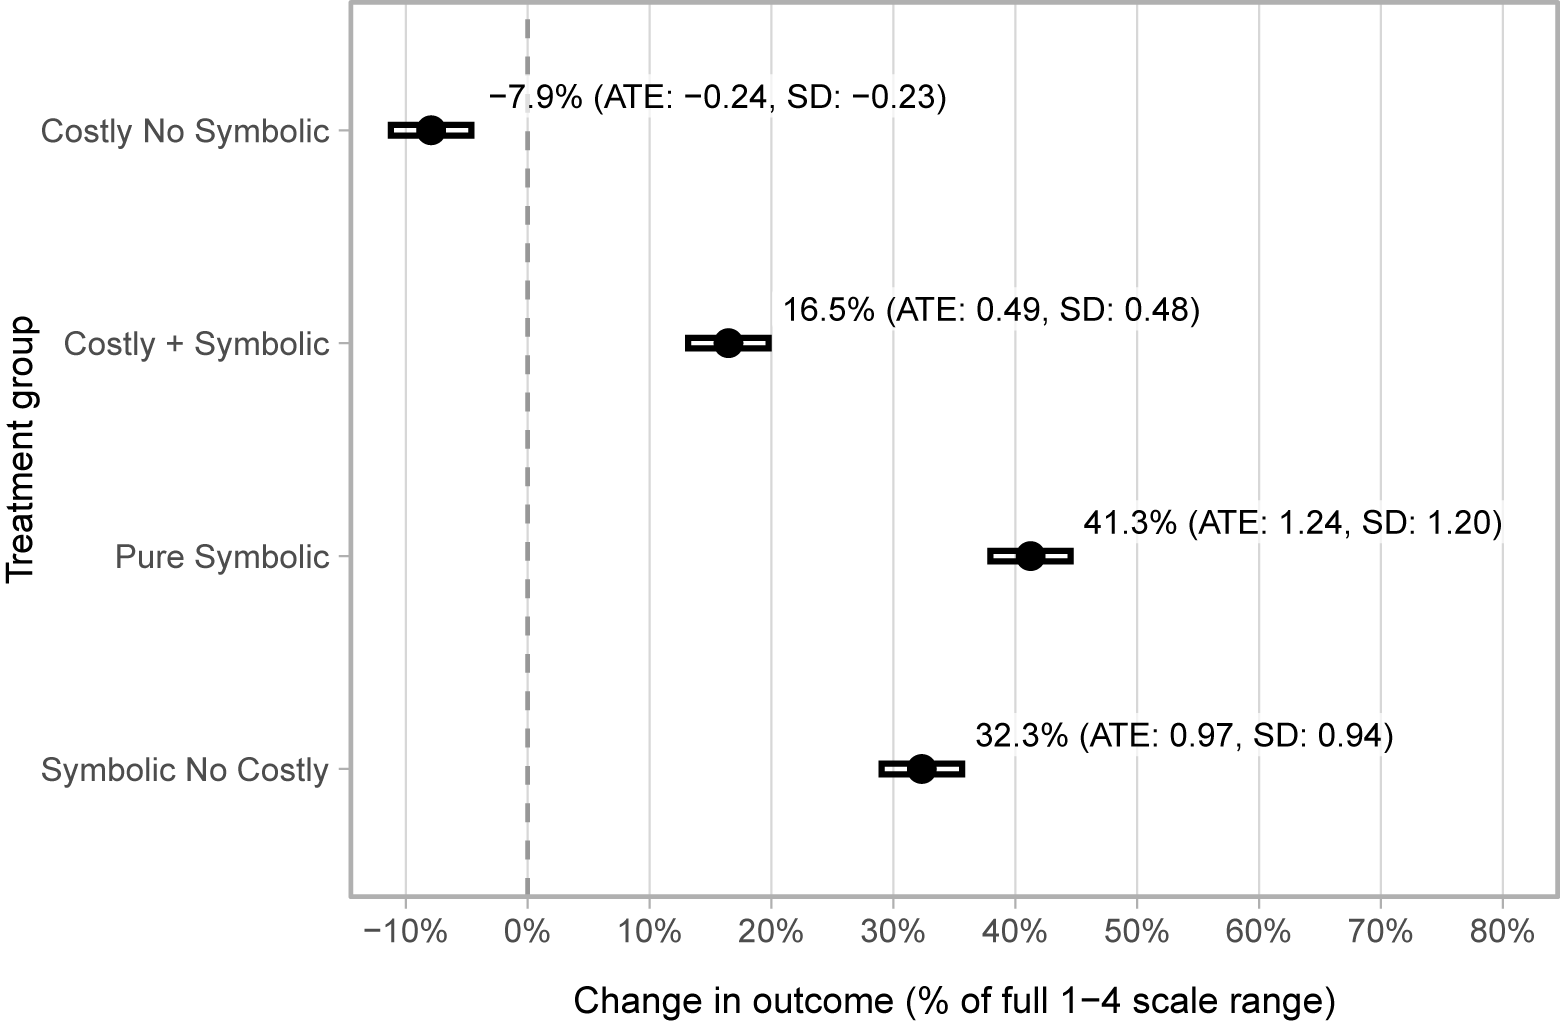
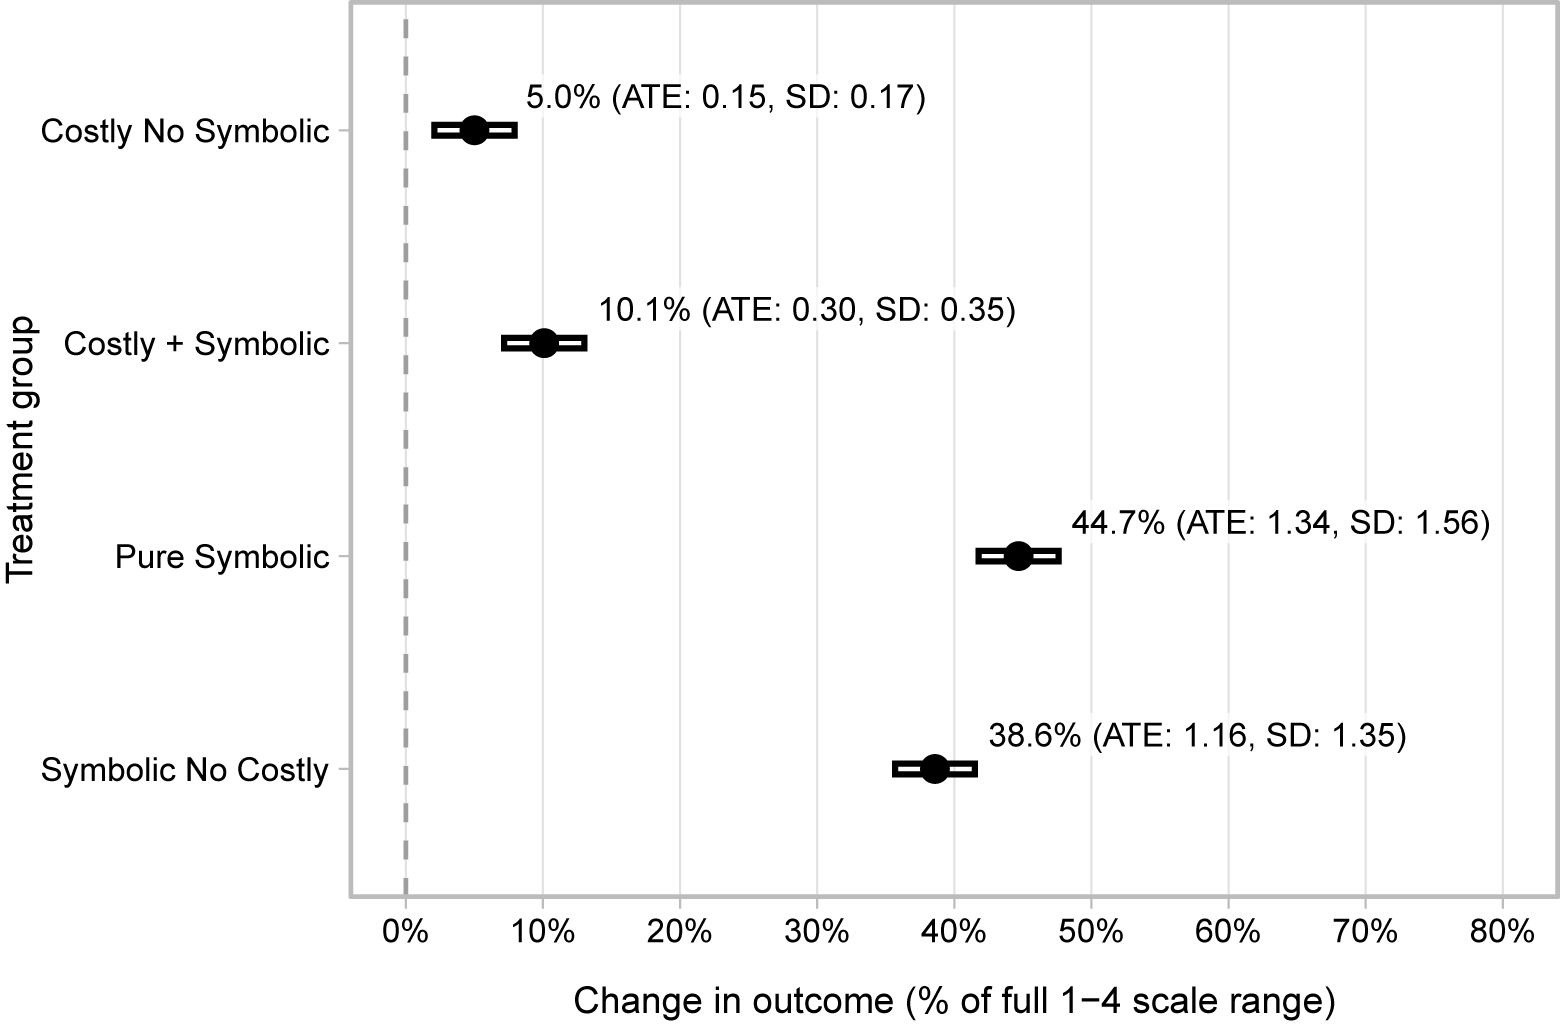
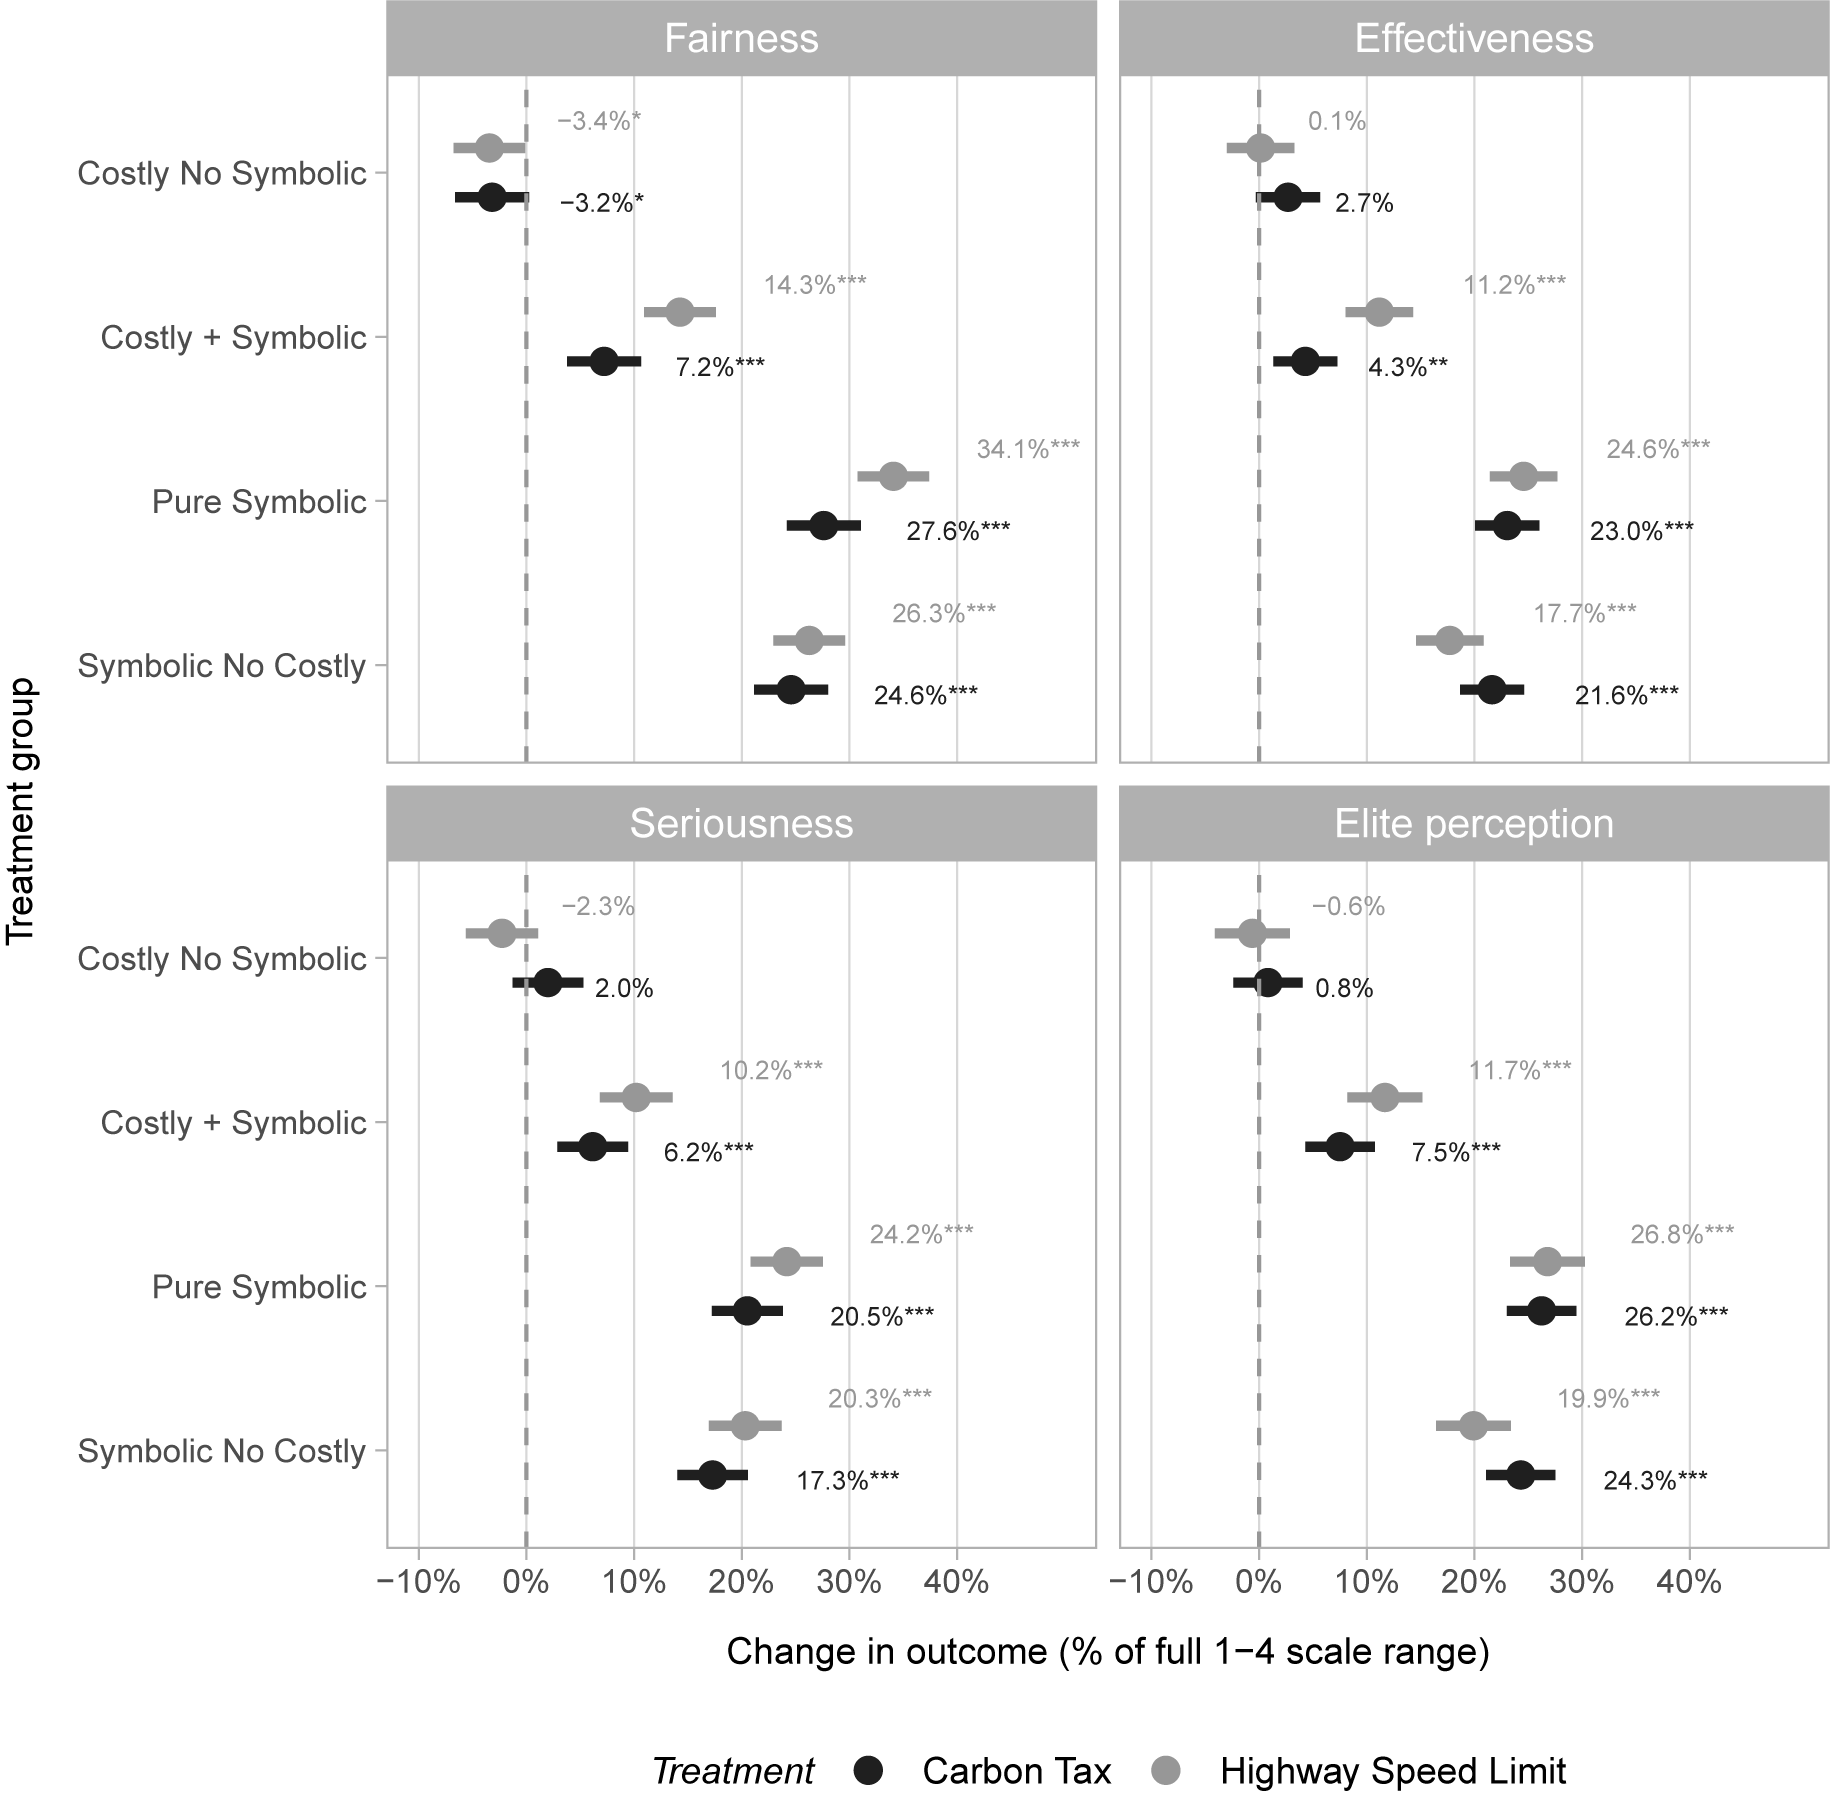
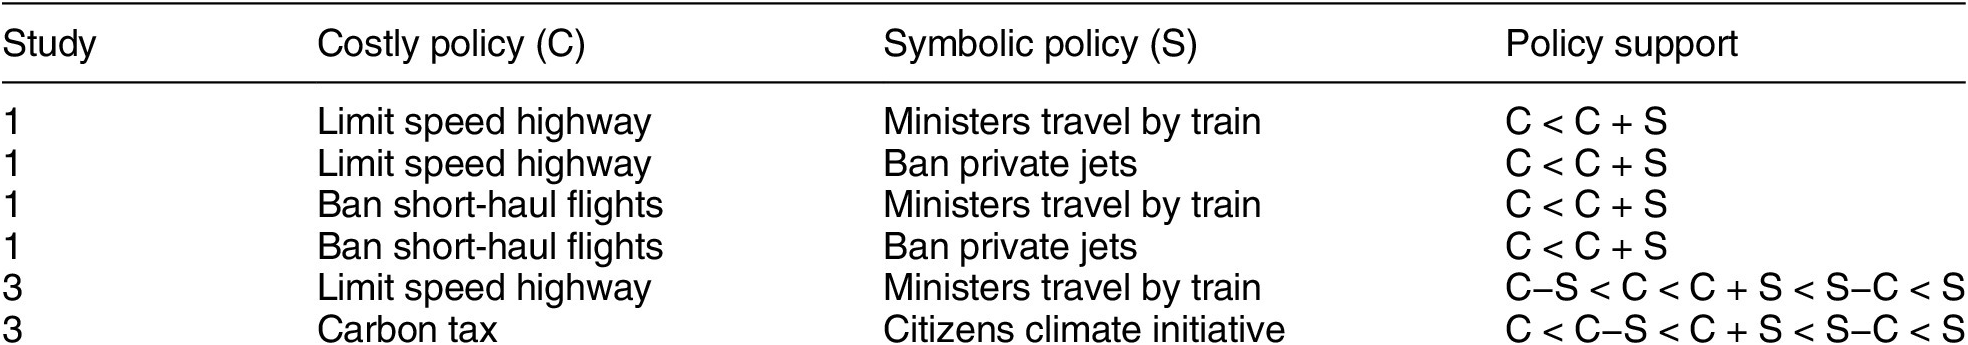


 Open access
Comments
No Comments have been published for this article.