


INTRODUCTION
In 1933, Ernst Röhm, an early ally of Adolf Hitler, claimed that “the roots of national socialism lie in the trenches of the World War” (Schmidt and Grabowsky Reference Schmidt and Grabowsky1934, 246). His propagandist rhetoric reflects a more general interpretation of World War 1 (WW1) as the “the great seminal catastrophe” that created the breeding ground for the rise of extreme nationalismFootnote 1 in interwar Germany and developments that eventually culminated in World War 2 (WW2) and the Holocaust.
Influential historical, macro-level studies underscore the role of international wars in fomenting nationalism—for example, through the socializing effects of military service or through war propaganda (Finer Reference Finer and Tilly1975; Hutchinson Reference Hutchinson2017). Recently, others have started to investigate such effects of war at the micro level. Cagé et al. (Reference Cagé, Dagorret, Grosjean and Jha2023), Acemoglu et al. (Reference Acemoglu, De Feo, De Luca and Russo2022), and Koenig (Reference Koenig2023) analyze the effects of WW1 on support for nationalist parties in interwar France, Italy, and Germany, highlighting the role of returning war veterans, economic hardship, and right-wing counter-mobilization against political gains of socialist parties.
In contrast to these insights, we shift the focus to a largely overlooked but central aspect of war: its enormous human costs and the resulting collective experiences of death and loss in the home communities of fallen soldiers. Combining insights from social psychology, history, and political science, we argue that community-level exposure to war fatalities can trigger psychological processes that foster ingroup cohesion and outgroup derogation, particularly among civilians who did not directly participate in the war. We expect this mechanism to manifest as higher levels of electoral support for right-wing nationalist parties that emphasize cultural homogeneity or racial superiority.
Empirically, we focus on WW1 and inter-war Germany to explore the local effects of war losses on political preferences and voting behavior. The enormous scale of the war, its painstaking documentation by the German military, and the disastrous implications of right-wing nationalist parties in the Weimar Republic make this case a well-suited context for our analysis. To measure war losses at the local level, we digitized and geocoded data on the entirety of all 7.5 million German soldiers who were wounded or died in WW1. To causally identify the effect of localized war exposure on nationalist preferences, we leverage variation in soldiers’ loss status (dead vs. wounded). We demonstrate that this status is the result of idiosyncratic battlefield action, and, therefore, unrelated to other determinants of political outcomes in soldiers’ home counties. For our main analysis, we combine the casualty data with county-level voting results for the two main right-wing nationalist parties in the Weimar Republic: the German Nationalist People’s Party (Deutschnationale Volkspartei, DNVP) and the National Socialist German Workers’ Party, the Nazi Party (Nationalsozialistische Deutsche Arbeiterpartei, NSDAP).
We find a robust and substantively meaningful positive effect of WW1 deaths on electoral support for nationalist parties throughout the Weimar period. To trace the mechanisms, we investigate (1) individual-level membership in nationalist organizations (NSDAP and Hitler Youth), (2) political attitudes expressed in Nazi letters, and (3) the moderating effect of pre-WW1 war monuments. The results align with our argument: exposure to WW1 deaths increased nationalist preferences among civilians (rather than veterans). We also find evidence that the effects of WW1 fatalities were amplified by processes of localized collective commemoration.
Our results make three main contributions. First, our findings add to research on the sources of nationalism. We provide additional micro-level evidence on the impact of war on nationalism, complementing previous theoretical and qualitative (Hutchinson Reference Hutchinson2017; Smith Reference Smith1981) as well as recent quantitative analyses (Acemoglu et al. Reference Acemoglu, De Feo, De Luca and Russo2022; Cagé et al. Reference Cagé, Dagorret, Grosjean and Jha2020; Koenig Reference Koenig2023). In particular, we extend prior research by Koenig (Reference Koenig2023) on how WW1 veterans drove support for conservative parties in Weimar Germany. In contrast to Koenig (Reference Koenig2023), we shift focus away from veterans and demonstrate that the death of soldiers fostered right-wing nationalist sentiments in the civilian population, which ultimately translated into political support for the Nazi Party. Thus, our findings complement a larger research program that links international-level variables, such as exposure to globalization, financial crises, or pandemics (or, in our case, war), to nationalist attitudes through community-level mechanisms (Bisbee et al. Reference Bisbee, Mosley, Pepinsky and Peter Rosendorff2020; Doerr et al. Reference Doerr, Gissler, Peydro and Voth2022; Gingerich and Vogler Reference Gingerich and Vogler2021; Hays, Lim, and Spoon Reference Hays, Lim and Spoon2019).
Second, extending prior research on the nation-wide effects of WW1 on interwar Germany (Alcalde Reference Alcalde2017; Ziemann Reference Ziemann2006), we demonstrate that the geographical distribution of war fatalities had a substantial effect on nationalist voting. We document a sizeable electoral benefit of war deaths for the Nazi Party, thus adding to the socioeconomic, religious, and propaganda-related predictors of the Nazi vote highlighted in previous research (e.g., Adena et al. Reference Adena, Enikolopov, Petrova, Santarosa and Zhuravskaya2015; Selb and Munzert Reference Selb and Munzert2018; Spenkuch and Tillmann Reference Spenkuch and Tillmann2018; Thurner, Klima, and Küchenhoff Reference Thurner, Klima and Küchenhoff2015).
Third, we contribute to research on the effects of war on political behavior. We demonstrate that proximity to casualties in the context of international wars can have long-lasting effects on political attitudes that go beyond assessments of ongoing wars and incumbent regimes (Althaus, Bramlett, and Gimpel Reference Althaus, Bramlett and Gimpel2012; Gartner and Segura Reference Gartner and Segura2000). Adding to the finding that war exposure can predict postwar prosocial behavior (Bauer et al. Reference Bauer, Blattman, Chytilová, Henrich, Miguel and Mitts2016), our case forcefully demonstrates that war exposure can fuel a very specific type of ingroup prosociality—nationalism—and its terrible consequences.
WAR AND NATIONALISM
A well-established body of literature has investigated how pervasive nationalist attitudes can be a source of interstate wars (Gruffydd-Jones Reference Gruffydd-Jones2017; Schrock-Jacobson Reference Schrock-Jacobson2012). In contrast to its role as a source of war, however, nationalism as a consequence of war has received less attention in the empirical literature, especially at the individual or sub-national level (Hutchinson Reference Hutchinson2017). Wars expose a large proportion of the population to violence, destruction, and death, both through soldiers with horrific first-hand experiences of the carnage, and through soldiers’ families and communities at home (Bondzio Reference Bondzio2020). To what extent do these traumatic experiences affect the political attitudes of citizens, especially their attachment to the idea of their “nation”?
A large body of research suggests that exposure to violence can shape individuals’ social and political attitudes (for overviews, see Bauer et al. Reference Bauer, Blattman, Chytilová, Henrich, Miguel and Mitts2016; Walden and Zhukov Reference Walden and Zhukov2020). A primary finding is that experiences of violence are associated with more cooperative attitudes and greater community engagement with the ingroup (Bauer et al. Reference Bauer, Blattman, Chytilová, Henrich, Miguel and Mitts2016). Findings from the Iraq and Vietnam wars suggest moreover that higher exposure to casualties in home communities can lower incumbent support and decrease support for the war in the short term (Althaus, Bramlett, and Gimpel Reference Althaus, Bramlett and Gimpel2012; Gartner, Segura, and Barratt Reference Gartner, Segura and Barratt2004). Despite the evidence that wars can shape political preferences, our knowledge of the effects of war on nationalism among civilians remains limited.
Only recently some studies have started to investigate how war may fuel nationalism, focusing specifically on interwar Europe. Cagé et al. (Reference Cagé, Dagorret, Grosjean and Jha2020) show that French municipalities that sent regiments to the Battle of Verdun during General Pétain’s leadership exhibited higher population shares of Nazi collaborators and higher vote shares for the political right in interwar France. Focusing on interwar Italy, Acemoglu et al. (Reference Acemoglu, De Feo, De Luca and Russo2022) argue that WW1 casualties indirectly fostered support for the fascist movement. Higher shares of WW1 casualties caused local socioeconomic hardships from which the Italian Socialist Party profited in 1919. This electoral success and the perceived threat of communism in turn increased the fascist vote share at the expense of other right-wing parties.
Finally, Koenig (Reference Koenig2023) shows that larger shares of WW1 veterans led to more electoral support for conservative parties in Weimar Germany. The results of additional tests are in line with the argument presented by Acemoglu et al. (Reference Acemoglu, De Feo, De Luca and Russo2020): war participation made veterans susceptible to fears of a left-wing majority. However, Koenig (Reference Koenig2023) does not find any effects of the share of veterans on support for the Nazi Party, indicating that returning soldiers did not drive the rise of nationalism at the extreme right of the political spectrum.
These studies identify plausible drivers of the relationship between war and nationalism. Absent from these explanations is, however, one of the most wide-reaching forms of war exposure: the effects of war deaths on civilians in the home communities of fallen soldiers.
HOW WAR DEATHS SHAPE CIVILIANS’ SUPPORT FOR NATIONALIST PARTIES
Our main hypothesis is that communities with higher death exposure during the war display stronger preferences for nationalist parties. This effect operates through attitudinal change among civilians in highly affected communities. Figure 1 illustrates the argument.
Theoretical Argument and Causal Mechanisms

The starting point of the mechanism is a community member’s experience of losing relatives and friends in the war. Specifically, we argue that death exposure fosters ingroup preference and outgroup derogation. While these two group dynamics do not necessarily overlap (Jardina Reference Jardina2019), research in social psychology demonstrates that confrontation with death, specifically, tends to activate attachment to the ingroup and hatred of the outgroup. The death of loved ones can increase people’s allegiance to their cultural worldviews, which serve as buffers against death anxiety. As a result, death can increase citizens’ identification with their own nation and trigger aggressive reactions against any opposition to their home country (Chatard, Arndt, and Pyszczynski Reference Chatard, Arndt and Pyszczynski2010). This effect can be reinforced by feelings of revenge: civilians may develop a strong desire to see outgroup members punished for the harm inflicted on them—regardless of the costs of retaliation (Stein Reference Stein2015). As civilians do not observe the ambiguities of war at the frontline—in particular the death of outgroup members and atrocities committed by ingroup members—they may harbor particularly aggressive inter-group sentiments. In fact, several studies show a positive relationship between civilian victimization in war and strengthened ingroup preferences as well as hardened feelings toward outgroup members (Bauer et al. Reference Bauer, Blattman, Chytilová, Henrich, Miguel and Mitts2016; Kupatadze and Zeitzoff Reference Kupatadze and Zeitzoff2019).
The second element of the mechanism links war losses to attitudinal change at the community level—including community members who are not themselves directly related to the dead. Prior research shows that this “indirect victimization” can have similar effects as personal losses (Bar-Tal et al. Reference Bar-Tal, Chernyak-Hai, Schori and Gundar2009). People’s awareness of their community’s vulnerability due to war can be sufficient to affect political attitudes similarly to that described above for directly affected individuals (e.g., Gartner, Segura, and Barratt Reference Gartner, Segura and Barratt2004). Again, in line with previous research, we expect death exposure to potentially trigger both, stronger identification with the ingroup and derogation of the outgroup. Civilian communities observe only one side of the human costs of the war: they experience the death of community members but not the human suffering of the outgroup. The resulting “collective sense of victimhood” (Bar-Tal et al. Reference Bar-Tal, Chernyak-Hai, Schori and Gundar2009) strengthens ingroup cohesion and outgroup hatred. The fact that collective loss experiences can affect attitudes in entire communities yields a key implication: levels of ingroup preferences and outgroup derogation covary with exposure to war deaths across communities.
The final element of the mechanism links community-level preferences for nationalism to increased electoral support for nationalist parties. More salient nationalist preferences trigger a general “bottom-up” demand for political agendas that are built on strong ingroup preferences and outgroup derogation. Far-right, extreme nationalist parties supply precisely these types of political platforms. While other political platforms may focus on mobilizing either ingroup preferences or hostility toward outgroups, extreme nationalist parties capitalize on both of these elements of group identity. Their extreme political worldviews are characterized by simplistic black-and-white interpretations, emphasis of ingroup superiority and intolerance toward other groups (van Prooijen and Krouwel Reference van Prooijen and Krouwel2019). Thus, nationalist party platforms almost perfectly meet the demands of communities seeking to make sense of their war losses.
While this mechanism focuses on trauma among civilians at the “home front,” we do not rule out political effects of returning soldiers. However, the impact of war on veterans seems more ambiguous. Some studies show that war veterans exhibit hardened feelings toward war opponents and preferences for nationalist parties (Grossman, Manekin, and Miodownik Reference Grossman, Manekin and Miodownik2015). Others find that combat experience can challenge idealistic views of war and lead to a de-identification with one’s own ingroup (e.g., Lesschaeve Reference Lesschaeve2020). Given this ambivalence, we do not have strong expectations about the effects of veterans’ war trauma on political attitudes.
Similarly, we acknowledge that exposure to war may also foster civilians’ longing for peace (rather than support for nationalist warmongering). Research has produced mixed results on the effects of violence on civilians’ political preferences: some studies show that victimization in war zones can foster pro-peace attitudes (Hazlett Reference Hazlett2020), while other demonstrate that proximity to casualties outside of war zones can undermine support for ongoing wars (Althaus, Bramlett, and Gimpel Reference Althaus, Bramlett and Gimpel2012; Gartner and Segura Reference Gartner and Segura2000). However, findings also indicate that this may be the result of short-term priming effects rather than persistent changes in political attitudes (ibid.). War-induced ingroup–outgroup dynamics and preferences for nationalism, in contrast, can endure for years after violence has ended (Bauer et al. Reference Bauer, Blattman, Chytilová, Henrich, Miguel and Mitts2016; Glaurdić, Lesschaeve, and Mochtak Reference Glaurdić, Lesschaeve and Mochtak2018). Thus, focusing on a postwar context, we expect a positive association between war losses and nationalism.
Our focus on the role of civilians’ loss experiences also suggests an important moderating factor: preexisting local traditions of collective commemoration may amplify and sustain civilians’ death exposure. Traditions of war commemoration vary across communities. In some places, remembrance is traditionally more private and individualistic; other communities have stronger traditions of collective mourning embodied in rites or memorials. These collective traditions of commemoration exist in many different forms (Ashplant, Dawson, and Roper Reference Ashplant, Dawson and Roper2000): they are apolitical in some places, centering on the grief of the community. In other places, they revolve around religious narratives, emphasizing the atrocity of war or distinct nationalist interpretations.Footnote 2
Independent of these types of commemorative traditions, it is specifically the collective nature of commemoration that moderates the effect of war exposure on nationalism. Traditions of remembrance act as “templates” that shape community-level responses to subsequent wars and war losses (Ashplant, Dawson, and Roper Reference Ashplant, Dawson and Roper2000, 16). Strong preexisting practices of collective mourning and remembrance increase the salience of death exposure among those community members that have not themselves lost any friends or family members in the war. As a result, local traditions of commemoration are likely to amplify the link between war exposure and nationalism.
HISTORICAL BACKGROUND
Shortly after its founding, the Weimar Republic came under political pressure: the loss of territory, the reduction of its army, the occupation of the Rhineland, and the vast amount of reparations created grievances that right-wing nationalist parties like the DNVP and the NSDAP were ready to exploit for political purposes.
Beyond some important differences, these two parties shared not only a common political tone but also key nationalist ideas and objectives (see Peukert Reference Peukert2001; Hochman Reference Hochman, Rossol and Ziemann2021, 73).Footnote 3 This common view facilitated cooperation between DNVP and NSDAP: in 1929, representatives of both parties organized a referendum against war reparations scheduled by the Young Plan, and in 1931, the two parties established a short-lived united national front against the democratic system (Alcalde Reference Alcalde2017, 204, 225).
Explanations for the electoral success of these nationalist parties, in particular of the NSDAP, have highlighted the role of social capital (Satyanath, Voigtländer, and Voth Reference Satyanath, Voigtländer and Voth2017), the fallout from the economic crisis and the government’s reaction (Doerr et al. Reference Doerr, Gissler, Peydro and Voth2022), and the appeal of the NSDAP to young voters who felt neglected by the political and economic institutions of the Weimar Republic (Peukert Reference Peukert2001). Scholars have also emphasized the role of WW1 as an important background condition (Abel Reference Abel1938).
While early work depicted the veterans as a core constituency of the far-right, more recent evidence suggests a more nuanced picture (Ziemann Reference Ziemann2006). Evidence from membership data of veteran organizations does not reveal a preference for far-right associations. Furthermore, even though the fate of veterans figured prominently in the NSDAP’s propaganda efforts, the party did not directly appeal to veterans until the 1930s and assigned no specific role to veterans in its quest to take over the state (Alcalde Reference Alcalde2017, 178).
But WW1 did not just shape the lives of those at the front. So many soldiers were killed that in many communities large shares of the population experienced the death of male household members, relatives, and friends (Bondzio Reference Bondzio2020).Footnote 4 Birth cohorts between 1901 and 1908 experienced educational curricula, premilitary training, and recreational activities that glorified war and propagated nationalism (Donson Reference Donson2010). Civilians’ war trauma was sustained by WW1 commemoration practices. Most of the soldiers killed could not be buried in their hometowns because it was not possible to find or identify their bodies. In the absence of individual graves, local memorials—often imprinted on the memorials of previous wars—kept the memory of fallen soldiers alive and provided spaces for social commemoration practices (Leonhard Reference Leonhard2014, 989; Ziemann Reference Ziemann2013, 14–6).
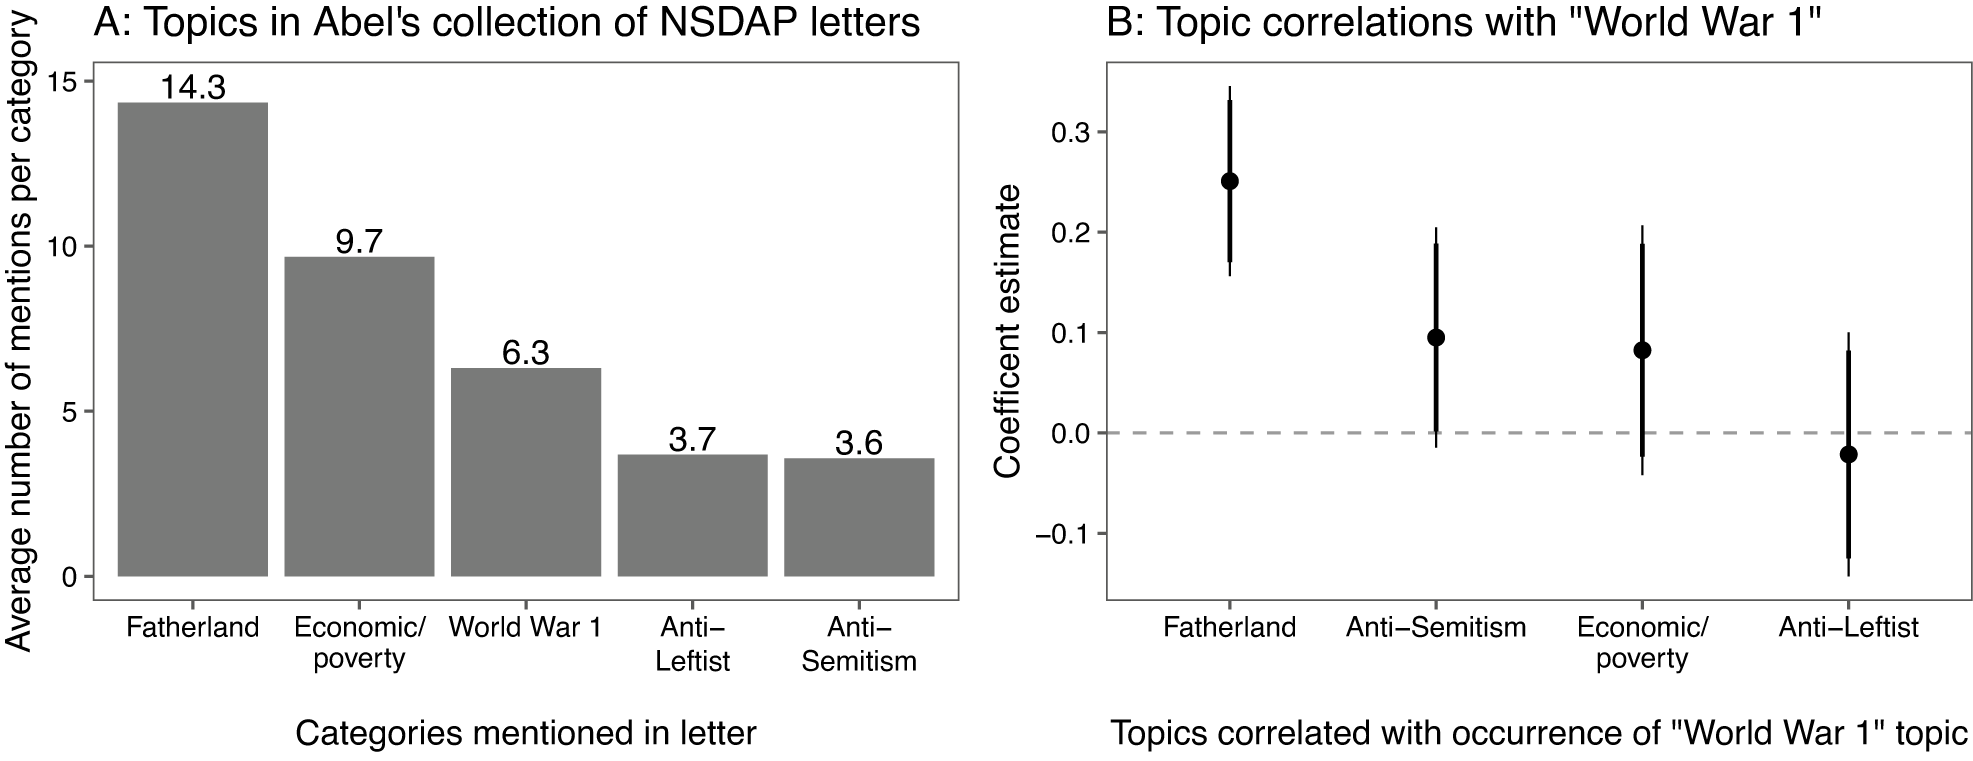
Nationalist parties attempted to capitalize on civilians’ war experiences. Below, we analyze 560 Nazi autobiographies to illustrate that the war played an important role in Germans’ nationalist thinking. In 1934, a year after Hitler became chancellor, Theodore Abel (Reference Abel1938), a sociologist at Columbia University, initiated a fake competition and invited submissions for the most compelling Nazi autobiography, including justifications for why people had joined the NSDAP.Footnote 5 In Figure 2a, we show that references to WW1 featured prominently in many of these letters—references to WW1 are more frequent than mentions of the political Left or anti-Semitism. In Figure 2b, we show that those autobiographies mentioning WW1 are also more likely to invoke references to the fatherland, German culture, and nationalism as justifications for Nazism. These descriptive patterns suggest individual cognitive associations between WW1, nationalism, and support for the NSDAP. In the following sections, we investigate to what extent these associations translated into higher support for right-wing nationalist parties in particularly war-affected communities.
WW1 and Topics in Nazi Autobiographies
Note: Figure 2a shows the average number of words per biography in five categories: (i) narratives of the fatherland and the Volksgemeinschaft (people’s community), hence nationalism; (ii) economic grievances; (iii) references to WW1; (iv) anti-leftist propaganda; and (v) anti-Semitic rhetoric. For each of these categories, we defined a list of associated words (see Section A.3 of the Supplementary Material), and counted their absolute number and relative share in the machine-readable version of each letter (Spörlein et al. Reference Spörlein, Pfuhlmann, Albert and Spörlein2020). Figure 2b shows the topic correlations between WW1 and the other categories, conditional on the following covariates: catholic, female, year of birth, year of birth squared, and higher education (Abitur). Error bars indicate 95% (thin) and 90% (thick) confidence intervals based on robust standard errors. Full results including covariate coefficients are available in the Dataverse replication archive.
DATA AND EMPIRICAL STRATEGY
Outcome: Nationalist Voting
Our main outcome variable is the combined vote share of right-wing nationalist parties per county and election. We consider all Reichstag elections held in Germany between 1920 and 1933.Footnote 6 We draw on county-level data collected by Falter and Hänisch (Reference Falter and Hänisch1990), which is based on the official statistical records in the Reichsstatistik. In line with prior research, we consider the DNVP and the NSDAP as right-wing nationalist parties. We also run separate analyses for each of the two parties. In Figure 3, we visualize the spatial distribution of the combined vote share of both parties in the Weimar Republic’s last free elections of 1932. We explain how we deal with county border changes throughout our study period in Section A.1 of the Supplementary Material.
Map of DNVP and NSDAP Vote Share in November 1932 and Local Exposure to WW1 Fatalities
Note: Thick black borders indicate pre-WW1 military districts.

Treatment: WW1 Casualty Fatality Rate
To measure WW1 exposure at the county level, we construct an individual-level dataset of all 8.6 million German soldiers who died, were wounded, captured, or went missing in WW1. To do this, we draw on the so-called “loss lists” (“Verlustlisten”). These lists were compiled by the German government during and after the war. First displayed publicly and later published as newspaper inserts, the loss lists served as an important source of information about war losses for the general population. As a valuable genealogical source, the loss lists were digitized and hand-coded through a crowd-sourced effort by the Verein für Computergenealogie e.V. (2014) (German Association for Computer-assisted Genealogy).
The data contains geocoded information on the birthplaces of 7.5 million soldiers. However, hand-coded information on the casualty status of individual soldiers (i.e., whether a soldier was wounded or died) was only available for a small subset of approximately 280,000 entries.Footnote 7 We therefore parsed scans of the original loss lists and used machine learning to retrieve the casualty status of each individual soldier. We provide details on the classification procedure and validation checks in Section A.2 of the Supplementary Material. In total, we were able to code the casualty status for approximately 5.5 million soldiers. Importantly, the estimated accuracy of the classification algorithm at the county level is not systematically correlated with our main outcome variable (Figure A.4 in the Supplementary Material).
Based on soldiers’ birthplace information, we spatially match each individual casualty entry to the counties of the Weimar Republic (Kreise) to generate our main treatment variable: county-level exposure to WW1 fatalities. Specifically, we compute the share of battle deaths relative to the total number of casualties:
 $$ {\mathrm{Casualty}\ \mathrm{fatality}\ \mathrm{rate}}_c=\frac{{\mathrm{Deaths}}_c}{{\mathrm{Deaths}}_c+{\mathrm{Wounded}}_c} $$
where $ {\mathrm{Deaths}}_c $
and
$ {\mathrm{Deaths}}_c $
and $ {\mathrm{Wounded}}_c $
are count variables for the number of dead and wounded soldiers, respectively, from a given county. For our main specifications, we discretize this “casualty fatality rate” using a median split.Footnote
8 The resulting measure
$ {\mathrm{Wounded}}_c $
are count variables for the number of dead and wounded soldiers, respectively, from a given county. For our main specifications, we discretize this “casualty fatality rate” using a median split.Footnote
8 The resulting measure $ {\mathrm{Casualty}\ \mathrm{fatality}\ \mathrm{rate}\ (\mathrm{binary})}_c $
represents our main treatment variable and indicates high localized exposure to WW1 fatalities. We illustrate the spatial distribution of our treatment variable in the right panel of Figure 3 and provide additional descriptive statistics on our data in Section A.5 of the Supplementary Material.
$ {\mathrm{Casualty}\ \mathrm{fatality}\ \mathrm{rate}\ (\mathrm{binary})}_c $
represents our main treatment variable and indicates high localized exposure to WW1 fatalities. We illustrate the spatial distribution of our treatment variable in the right panel of Figure 3 and provide additional descriptive statistics on our data in Section A.5 of the Supplementary Material.
The casualty fatality rate aligns well with our theoretical framework since it captures meaningful variation in the degree to which counties suffered WW1 battle deaths. To illustrate this idea, we compare the wartime experiences of the counties Eschwege and Brilon. The two counties were located in the same military and electoral districts, had a similar prewar male population size and local economic structure. The total number of casualties recorded for both counties is likewise very similar: 5,032 for Eschwege and 4,975 for Brilon. However, the intensity of exposure to WW1 deaths differed between the two counties. Based on our classification of the loss lists, we estimate that more than 2,100 young men from Brilon died on the battlefield, compared to “only” approximately 1,700 from Eschwege. The fatality rate among casualties in Brilon (42.6%) was much higher than in Eschwege (34.6%). While the two counties had similar levels of exposure to WW1 on the extensive margin (i.e., casualties), their level of exposure on the intensive margin (deaths among casualties) differed considerably. It is this variation in exposure to battle deaths conditional on the total number of reported casualties that we leverage for our main analysis.
Treatment Exogeneity
Relying on variation in local-level exposure to WW1 deaths based on the casualty fatality rate is preferable to alternative operationalizations for two reasons: (i) alternative measures are likely endogenous to prewar characteristics at the county level, while (ii) the casualty fatality rate is mainly driven by battlefield dynamics and hence exogenous to other determinants of political outcomes in soldiers’ home counties.
The total number of deaths scaled by county population size (rather than the number of casualties), for example, is an alternative treatment measure that also captures meaningful variation in exposure to WW1 battle deaths and aligns with our theoretical framework.Footnote 9 We do not use this treatment definition because it is demonstrably endogenous to a variety of prewar social, political, and economic characteristics that likely influenced military recruitment and volunteering. In Figure 5, we show that counties with a high number of deaths per population size tend to be more rural, agrarian, less industrialized, and Protestant. All of these variables are also plausible predictors of nationalist voting. We hence view the relationship between the population death share and nationalist voting as likely confounded. However, our substantive conclusions remain unchanged when we use this alternative treatment operationalization (see Table 1).
Balance (Placebo) Test for Pre-WW1 Characteristics
Note: Estimates for the effect of the binary population death-share treatment (gray lines) and binary casualty fatality rate treatment (black lines) on placebo outcomes measured prior to WW1 during the time of the German Empire. The effect estimates are y-standardized. All models include military district and city fixed effects. The vertical lines indicate 95% (thin) and 90% (thick) confidence intervals. Results in tabular form are available in the Dataverse replication archive.

Effect of the WW1 Casualty Fatality Rate on Nationalist Parties’ Vote Share, 1920–1933

Notes: The table reports OLS estimates of the relationship between exposure to WW1 fatalities and nationalist parties’ vote share (in %). Robust standard errors clustered by county in parentheses. Unit of observation is the county (Kreis). Results are reported for a pooled sample of all eight Reichstag elections between 1920 and 1933. Significance levels: $ {}^{***} p<0.001;{\hskip2.21384pt }^{**} p<0.01;{\hskip2.21384pt }^{*} p<0.05;{\hskip2.21384pt }^{+} p<0.1 $
.
$ {}^{***} p<0.001;{\hskip2.21384pt }^{**} p<0.01;{\hskip2.21384pt }^{*} p<0.05;{\hskip2.21384pt }^{+} p<0.1 $
.
In contrast to a measure scaled by population size, variation in the casualty fatality rate is the result of a quasi-random combination of battlefield dynamics, troop deployment, and recruitment practices. These features make the casualty fatality rate plausibly unrelated to other political features of soldiers’ home counties.
Battlefield deaths in WW1 were a function of war technology and tactics. More than half of the German battlefield deaths were caused by shellfire (Whalen Reference Whalen1984, 41–2). The artillery played a strategic role in the “trench warfare” of WW1: opposing field armies took defensive positions in the trenches, while intensive artillery fire prepared occasional infantry offensives (e.g., Griffith Reference Griffith1996). Historical records show that, relative to other types of weapons, the artillery was substantially more deadly (Reichswehrministerium 1934). Thus, the risk of incurring a high number of deaths relative to the number of injured (i.e., the casualty fatality rate) was particularly high among military units stationed in frontline sections that were selected by enemy troops for attempts at breaking through the frontlines and were therefore subjected to heavy artillery fire.
Panels (a) to (c) in Figure 4a–c show how this pattern is empirically visible in our data. We located four archival maps of high-casualty battles that contain information on the location of 149 German regiments and allied offensives at the Somme (July 1916), Champagne (February 1915), and Artois (May and September 1915) (Reichsarchiv 1944). As illustrated for the Battle of the Somme in Figure 4a, we use these maps to identify two groups of German regiments: those stationed in areas that were overrun in allied military offensives and those that were deployed to the same frontline at the same time, but were stationed just north or south of these frontline sections. We contend that these two groups differ mainly in terms of their exposure to heavy artillery fire. These offensives were arguably unrelated to the characteristics of the regiments or of the individual soldiers’ home counties (we discuss potential arguments against this assumption below).
WW1 Battlefield Dynamics and Geographic Variation in Casualty Fatality Rates in Weimar Germany
Note: The plot displays the effect of frontline placement on geographical variation in WW1 casualty fatality rates across the Weimar Republic. (a) Stylized excerpt of one of the archival maps we coded. The map illustrates how frontline shifts are displayed on historical maps of decisive battles. (b) Regiment-level casualty fatality rates over time in “overrun” vs. “missed” regiments, based on their frontline placement during French advances. Plot combines data from the four coded maps of Somme (July 1916), Champagne (1915), Artois I (May 1915), and Artois II (September 1915). (c) Overall casualty fatality rates from 1914 to 1918 for the 149 regiments we identified on the maps. The plot illustrates that the placement even during a single battle increased, on average, a regiment’s casualty fatality rate during the entire war. (d) The map displays the birthplaces of casualties from two example regiments we identified on the maps. Regiment casualties cluster in space, generating variation in casualty fatality rates across German counties.

We then draw on our casualty data to compare the casualty fatality rates of these two groups of regiments. Figure 4b displays their average casualty fatality rates in the months before and after the respective allied attacks. Both groups experienced similar casualty fatality rates prior to the attacks. However, after the attacks, the group of regiments located in targeted frontline sections experienced a large absolute and relative casualty fatality rate increase.
Figure 4c indicates that the group of regiments that were overrun in the mapped battles did not just experience a temporary spike in casualty fatality rates. Instead, the singular shock of the military offensives was sufficiently strong to increase the total WW1 casualty fatality rate of these regiments relative to military units that participated in the same battles in the same time periods but at different sections of the frontline.
This variation in the casualty fatality rate across regiments, in turn, had a direct effect on the spatial variation of the casualty fatality rate within Germany. German troop replenishment was organized in military districts: recruits were assigned primarily to those regiments that were stationed in their respective military “home” districts. Thus, recruits stemming from the same communities had a high chance of being assigned to the same military units. Figure 4d illustrates the birthplaces of recruits of two military units that were overrun at the Battle of the Somme and those that were spared. The spatial concentration of regiment casualties makes it plausible that battlefield dynamics translate into meaningful variation in casualty fatality rates across German counties, since battlefield losses by regiment were highly concentrated within counties: we estimate that, on average, 5% of all regiments in a county suffered more than 80% of the county’s losses.
Taken together, we interpret these empirical patterns as evidence of exogenous variation in the casualty fatality rate resulting from battlefield dynamics and army recruitment patterns. One objection to this argument could be that (1) recruits from the most nationalist counties may have self-selected into certain (high-risk) military units and that (2) the German army’s leadership assigned these units to frontline sections where it expected allied offensives.
We provide three pieces of evidence against this objection. Below, we demonstrate first that counties with a high versus low casualty fatality rate are statistically indistinguishable with respect to a wide variety of political and socioeconomic pre-WW1 characteristics. Second, in Figure B.10 in the Supplementary Material, we show that attacked versus spared regiments’ casualties did not differ with respect to important socioeconomic and political covariates. Third, in Section B.5 of the Supplementary Material, we compile historical evidence that the German army leadership based its frontline deployment decisions primarily on troop availability and logistical considerations. In sum, this evidence makes it very unlikely that nationalist segments of counties/recruits selected into specific military units, certain battlefields, and/or high-risk locations at the frontline.
The plausibly exogenous variation in exposure to WW1 deaths across counties is conditional on two variables. The first is the military district (Wehrkreis) in which a county is located. Prior to WW1, military districts corresponded to the army corps, the basic organizational formation of the German Empire’s army. The deployment of army corps governed large parts of the assignment of regiments to more or less deadly theaters of war, and thus by extension, the risk that military districts from which recruits were drawn incurred higher or low casualty fatality rates. It is therefore more plausible that regiment assignment to frontline areas was mostly exogenous to factors “at home” within military districts or army corps than between. To account for these regional differences, we include pre-WW1 military district fixed effects in all subsequent analyses (see Figure B.7 in the Supplementary Material).
The second variable is a binary indicator that distinguishes between urban and rural areas. Historical statistics indicate that rural areas experienced above-average numbers of war fatalities, relative to the share of the male population that was required to perform military service (Statistisches Reichsamt 1922). One possible reason is that many urban industrial workers were recalled to work in the armament industry. However, careful historical research suggests that the casualty fatality rate may have actually been higher in urban rather than rural areas (Ziemann Reference Ziemann2006). One reason is that younger age cohorts were more strongly represented among the urban population. These younger cohorts, in turn, were primarily assigned to units involved in heavy fighting. To account for any systematic variation in casualty fatality rates between urban and rural areas, we include urban/rural fixed effects in all of our analyses (see Section B.2 of the Supplementary Material).
In Figure 5, we demonstrate that conditional on these two sets of fixed effects, the casualty fatality rate is in fact orthogonal to a large set of prewar covariates measured at the county level. Contrary to the alternative treatment definition discussed above (war deaths per pre-WW1 county population), we do not find a statistically significant association between the casualty fatality rate and pre-treatment characteristics of affected communities.
Crucially, investigating a wide array of indicators of pre-WW1 nationalism, we do not find any evidence for a selection process where regions with higher pre-WW1 levels of nationalism also display higher casualty fatality rates (see Table A.1 in the Supplementary Material for an overview and description of all data sources used). In Figure B.8 in the Supplementary Material, we also show that regional variation in war enthusiasm, proxied by variation in the volume of war bonds signed, does not predict regional levels of the casualty fatality rate measure.
Taken together, we view this as strong evidence supporting our identifying assumption that variation in the casualty fatality rate is largely driven by quasi-random battlefield action, rather than systematic characteristics at the county level.
Estimation
To investigate the relationship between WW1 fatalities and nationalist voting, we estimate a series of OLS models of the following form:
 $$ \begin{array}{rl}\begin{array}{rll}{\mathrm{Vote}\ \mathrm{share}}_{cdep}=\hskip-0.5em & {\alpha}_d+\beta \hskip2.22198pt {\mathrm{Casualty}\ \mathrm{fatality}\ \mathrm{rate}}_c+& \\ {}& \gamma {1}_{\mathrm{City}}+{\rho}_e+{\epsilon}_{cdep},\end{array}& \end{array} $$
where c indexes counties, d indexes military districts, p indexes parties, and e indexes election rounds. $ {\mathrm{Vote}\ \mathrm{share}}_{cdep} $
measures our main outcome variable, the vote share in percentage points of a given party or party family p in county c in election round e. Our primary outcome of interest is the combined vote share of nationalist parties in each election. Our treatment variable
$ {\mathrm{Vote}\ \mathrm{share}}_{cdep} $
measures our main outcome variable, the vote share in percentage points of a given party or party family p in county c in election round e. Our primary outcome of interest is the combined vote share of nationalist parties in each election. Our treatment variable $ {\mathrm{Casualty}\ \mathrm{fatality}\ \mathrm{rate}}_c $
is a binary variable that measures whether the share of fallen soldiers among all casualties in a given county was above the median (see above). We are interested in
$ {\mathrm{Casualty}\ \mathrm{fatality}\ \mathrm{rate}}_c $
is a binary variable that measures whether the share of fallen soldiers among all casualties in a given county was above the median (see above). We are interested in $ \widehat{\beta} $
, the OLS estimate for the marginal effect of high county-level exposure to WW1 fatalities on electoral support for different parties in the Weimar Republic. We estimate models with and without fixed effects for each election round (
$ \widehat{\beta} $
, the OLS estimate for the marginal effect of high county-level exposure to WW1 fatalities on electoral support for different parties in the Weimar Republic. We estimate models with and without fixed effects for each election round ( $ {\rho}_e $
), each of the 24 military districts (
$ {\rho}_e $
), each of the 24 military districts ( $ {\alpha}_d $
), as well as for urban versus rural counties. We report heteroskedasticity-robust standard errors clustered on counties throughout.
$ {\alpha}_d $
), as well as for urban versus rural counties. We report heteroskedasticity-robust standard errors clustered on counties throughout.
MAIN RESULTS
We present the results in Table 1. Model 1 presents the simple bivariate correlation between the binary casualty fatality rate treatment and the vote share of nationalist parties. Models 2–4 add fixed effects for election rounds, military districts, and cities to account for temporal, regional, and urban/rural heterogeneity. In column 5, we present results for the continuous measurement of the casualty fatality rate. In columns 6 and 7, we report the results from measuring exposure to WW1 deaths based on the number of deaths scaled by pre-WW1 county population size in a median-split and continuous version. Across all models, we find a positive, statistically significant relationship between high exposure to WW1 fatalities and electoral support for nationalist parties at the county level.
When we compare the operationalization of WW1 intensity through both casualty fatality rate (models 1–5) and deaths scaled by population (models 6 and 7), we observe a substantially larger effect estimate for the latter treatment measure. However, we caution against a causal interpretation of the deaths divided by population measurement as it is likely endogenous to a variety of county-level characteristics (see above). We therefore proceed in all subsequent analyses with the plausibly exogenous casualty fatality rate measure.
Based on the more conservative models 3 and 4, we find that, on average, high exposure to WW1 deaths increased the vote share of nationalist parties by approximately 2.6 percentage points. This effect is sizable, particularly compared to other important correlates of the Nazi vote share reported in the literature. Adena et al. (Reference Adena, Enikolopov, Petrova, Santarosa and Zhuravskaya2015, 1919) find that a standard deviation in radio subscriptions increased the Nazi vote share between 1932 and 1933 by approximately 2 percentage points, an effect roughly similar in magnitude to the one we report. Alternatively, consider the effect of Protestantism, one of the most robust predictors of NSDAP votes (Falter Reference Falter1991; Spenkuch and Tillmann Reference Spenkuch and Tillmann2018). According to our covariate point estimates in Table C.3 in the Supplementary Material, an increase in one standard deviation (38%) of the population share of Protestants is associated with a 7 percentage point increase in the vote share for nationalist parties in the Weimar Republic’s Reichstag elections. Our reported effect size amounts to more than a third of the magnitude of this effect of Protestantism.
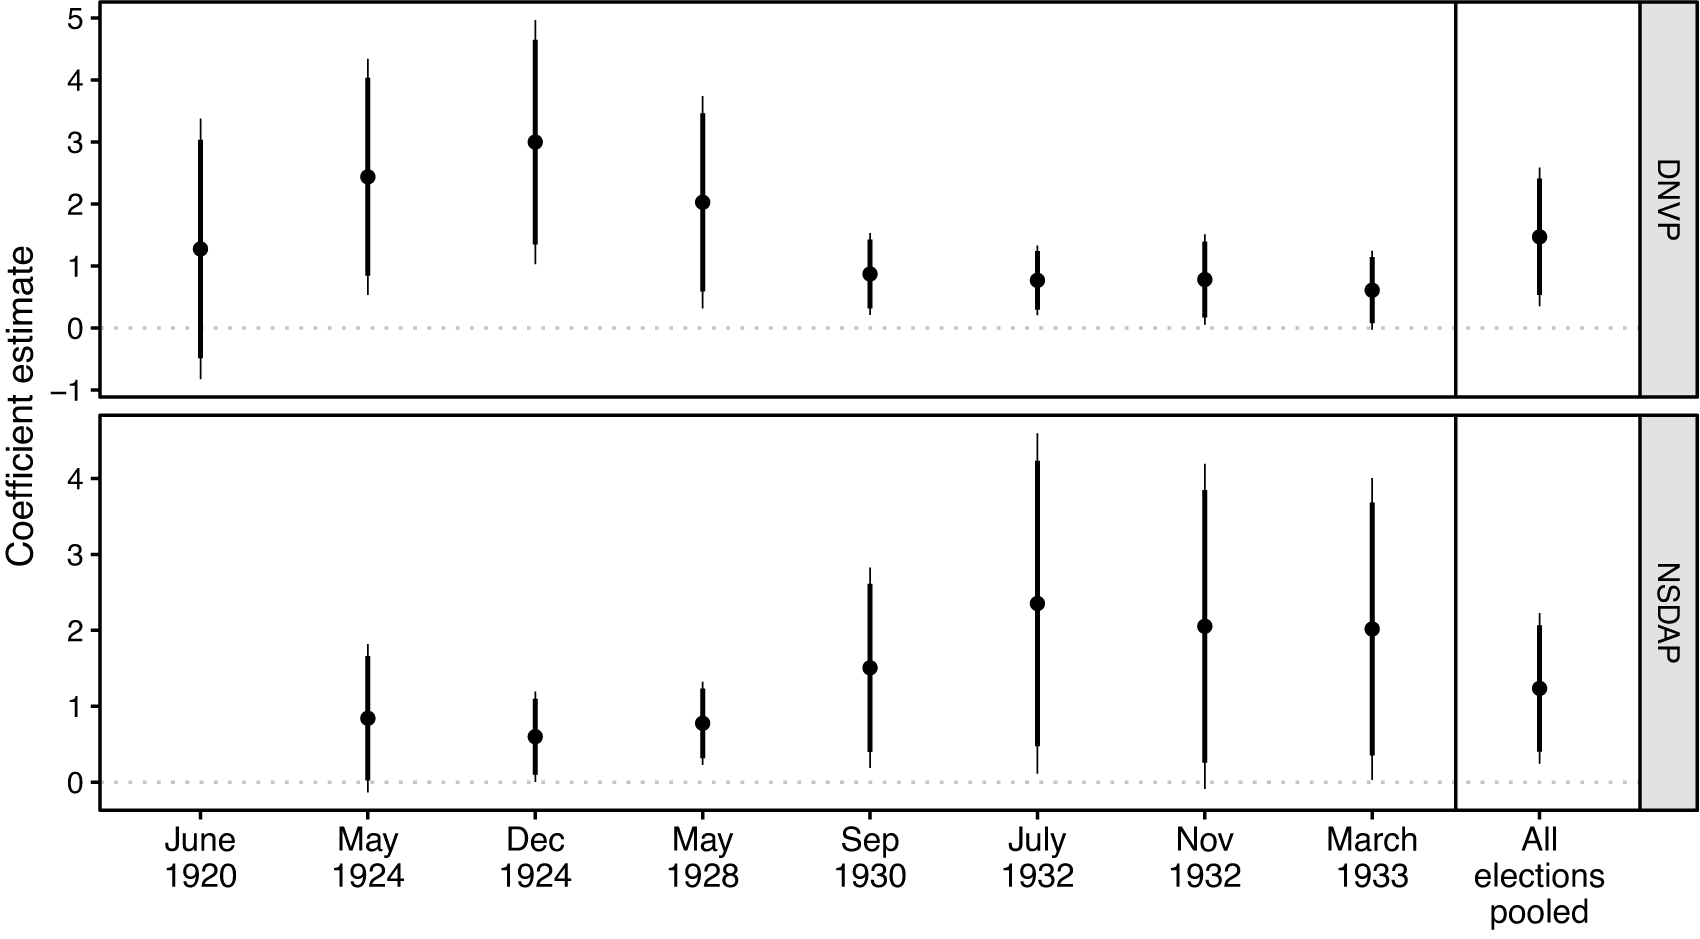
Figure 6 demonstrates that the findings in Table 1 likely capture the effects of WW1 on nationalism rather than on other types of political preferences. The figure disaggregates the effects of the casualty fatality rate by election round and by party (NSDAP and DNVP). The temporal development indicates that while the casualty fatality rate had a relatively stable effect on nationalist voting throughout the interwar period, we see inverse developments for the NSDAP and the DNVP. This pattern is in line with the assumption that the DNVP was able to mobilize the war-induced nationalist sentiments in the early elections. However, over time, the NSDAP was able to establish itself as the primary advocate of extreme nationalist preferences, crowding out the DNVP.
Effect of Local WW1 Casualty Fatality Rate on Election Results over Time
Note: Estimated coefficients from regressions of the vote share of the DNVP and the NSDAP on the binary dummy for the casualty fatality rate. Results are reported for separate models for each election. Each model includes military district and city fixed effects. The vertical lines indicate 95% (thin) and 90% (thick) confidence intervals based on heteroskedasticity-robust standard errors (clustered by county in the pooled models). Unit of observation is the county (Kreis). See Section A.1 of the Supplementary Material for how we measure the DNVP’s and the NSDAP’s vote shares over time. Results in tabular form are available in the Dataverse replication archive.
In the Supplementary Material, we implement a series of tests to ensure the robustness of our main results. Our first set of robustness tests addresses issues related to spatial autocorrelation. First, we reestimate the main models using a range of different standard errors to account for spatial autocorrelation at different geographic levels, including Conley standard errors at varying distance cutoffs (Figure C.11 in the Supplementary Material). Second, we estimate a number of different fixed effects specifications to guard against potential biases due to unmodeled spatial heterogeneity. These specifications include pre-WW1 election districts, state/government districts, randomly drawn 100 km x 100 km grid cells, and Weimar election districts (see Section C.2 of the Supplementary Material). Third, we also estimate models including a variety of demographic, occupational, geographic, and political covariates, as well as spatial lags of the outcome variables to account for spatial clustering in voter preferences (Table C.3 in the Supplementary Material). Fourth, we investigate the heterogeneity of the main effect across different regions (Figure C.13 in the Supplementary Material). Fifth, we consider different measurements of localized exposure to WW1 deaths (Figure C.15 in the Supplementary Material): we demonstrate that our results are robust to using (i) a mean split instead of a median split, (ii) a trichotomized split where we compare the upper and lower 33% of the casualty fatality rate distribution, and (iii) a median split within military districts. Sixth, we add controls for the number of wounded in a county to rule out that our main findings are driven by the “wounded” component of the casualty fatality rate measure (Table C.4 in the Supplementary Material).Footnote 10 Finally, we estimate models using mostly variation from the regiments for which we can identify exogenous exposure to WW1 battles from the archival maps to strengthen our confidence in the identification assumptions (Table C.5 in the Supplementary Material).
Our main result remains unchanged across these robustness checks: we find a positive, statistically significant relationship between local WW1 exposure and nationalist voting.
MECHANISMS
Our theoretical argument (1) links exposure to WW1 deaths to nationalist voting through attitudinal change among civilians: civilians experience the loss of community members but—contrary to war veterans—they do not observe the ambiguities of the war (i.e., in terms of violence committed by ingroup members, victimization of outgroup members, and the disillusionment over the war). In addition, we also expect that (2) preexisting traditions of collective commemoration can amplify this mechanism. In this section, we test 10 observable implications (OI) of the main mechanism and the moderating effect of commemoration (see Table 2). In Section E of the Supplementary Material, we present evidence against two alternative mechanisms: economic effects of the war and the “red scare” (anti-Communist backlash) argument proposed by Acemoglu et al. (Reference Acemoglu, De Feo, De Luca and Russo2022). In the same Supplementary Material section, we also discuss how our results relate to the findings by Koenig (Reference Koenig2023) on the role of war veterans.
Observable Implications of the Theory

Exposure to War Death Increases Nationalism among Civilians
The casualty fatality rate captures the number of fallen soldiers relative to the number of wounded returnees. Thus, in contrast to our interpretation, our main results may also reflect lower levels of nationalism among higher numbers of returning veterans. The election data used in our main analysis does not allow us to differentiate the voting behavior of civilians and veterans. We therefore rely on alternative data sources to differentiate between treatment effects on civilians and veterans: individual-level data on membership in nationalist organizations and attitudes expressed in the “Abel letters” introduced above.
Membership in Nationalist Organizations
We begin by analyzing an individual-level dataset of more than 40,000 NSDAP members. These data were collected and generously shared by Jürgen Falter. To measure our key outcome variable, nationalist preferences, we rely on the party entry date (“party entry” refers to individuals becoming a member of the NSDAP). Specifically, we consider party members who joined before the election on March 5, 1933 to have been particularly committed to Nazi ideology and nationalism. New party entries surged after the Nazi Party seized control following the election. Scholars have argued that a large share of these “late” members joined to personally profit from the political success of the NSDAP—rather than because of their deep national-socialist convictions. The NSDAP itself was deeply suspicious of these alleged opportunists (Falter Reference Falter2013). We therefore compare “early” and committed Nazi Party members (coded as “1”) to those who only joined later (coded as “0”). To capture local WW1 intensity, we match each individual’s birth location to our casualty fatality rate measure at the county level.
We first compare NSDAP membership patterns among civilians and veterans. Given the high total number of German war fatalities, most civilians experienced the loss of community members. Thus, in light of our argument on the sociopsychological effects of indirect war exposure, we expect that civilians were more likely to join the NSDAP as early members than returning war veterans. In Table D.6 in the Supplementary Material, we report the results from regression analyses where we regress early NSDAP membership on eligibility for the WW1 draft—comparing eligible male age cohorts (born between 1875 and 1900) to non-eligible male cohorts and women. In line with OI 1.1, we find that civilians—both men and women—were more likely to be early (i.e., more committed) NSDAP members than war veterans while controlling for age and cohort effects.
Next, we investigate how variation in death exposure conditions this main effect. Figure 7 shows the results of regressions of early NSDAP membership on the casualty fatality rate in different subsets of the data. In line with OI 1.2 and 1.3, we find that the casualty fatality rate has a positive effect on early NSDAP membership in two subsets of civilians: cohorts of men that were not eligible for the WW1 draft and women. While statistical uncertainty is higher in the subset of women (the sample size is about 90% smaller compared to the male sample), we obtain almost identical point estimates for men who were not eligible for the WW1 draft and the full sample of women—ruling out that these findings represent pure age or gender effects. When we further differentiate between women of different ages, we find even higher point estimates for those women who were most likely to suffer the loss of their spouse or brother during WW1, that is, women within the age cohorts of draft-eligible men. However, as the sample size for women is small, this variation across female cohorts should be interpreted with caution. Crucially, we find statistically insignificant effect estimates close to zero among men who were eligible for the WW1 draft (OI 1.4). This result supports our argument that the county-level effects of the casualty fatality rate result from higher levels of nationalism among civilians rather than lower levels of nationalism among veterans.Footnote 11
Civilians in Areas with WW1 Exposure Were More Likely to Become Early NSDAP Members
Note: Estimates of the effect of county-level WW1 casualty fatality rate on early membership in the NSDAP. We estimate individual-level regressions where the outcome variable is a binary indicator for party members who joined the NSDAP “early,” that is, before March 5, 1933. We impute draft eligibility based on birth year. Drawing on data from the 1939 census, we consider individuals born between 1875 and 1900 (inclusive) as eligible for the WW1 draft (see Section D.1 of the Supplementary Material). All models include individual-level covariates (marital status, birth year, and birth year squared) as well as fixed effects for cities, military districts, different subsamples of the Falter data, and different types of membership files. Standard errors are clustered at the county level. Vertical lines indicate 95% (thin) and 90% (thick) confidence intervals. Results in tabular form, including covariate coefficients, are available in the Dataverse replication archive.

We further probe these findings with biographical data from approximately 18,000 soldiers who served in WW2 (i.e., civilians in the time of the Weimar Republic). We find that the casualty fatality rate in a soldier’s birthplace substantially increases the probability of being a member of the Hitler Youth (OI 1.5). These additional results (presented in Section D.4 of the Supplementary Material) demonstrate the generalizability of the findings on NSDAP membership in terms of the type of nationalist organization (youth organization instead of political party), the sample composition (sample of the general male population rather than NSDAP members only), and the specification of the outcome (membership yes/no rather than timing of membership).
Political Attitudes Expressed in Nazi Letters
These differential effects on civilians and veterans presumably result from the ways in which these two groups experienced war and death: veterans did not only experience the tragic deaths of their comrades, but also atrocities committed by German forces and, at times, the inanity of the German military leadership, and thus the futility of the war itself. This set of experiences can operate as a deterrent against falling prey to nationalist war rhetoric. In contrast, civilians lacked these experiences while simultaneously being exposed to war losses among their home community members and nationalist propaganda.
This argument generates two empirical expectations. First, we expect that civilians—compared to veterans—express more positive associations with the German war effort (OI 1.6), endorsing Hitler’s enthusiastic and nationalist rhetoric of the war as “freedom fight” over the “being or non-being of the German nation.”Footnote 12 Second, we also expect that veterans without combat experience—compared to veterans with combat experience—express more positive associations with the German war effort (OI 1.7). The effects of combat exposure outlined above might be attenuated for soldiers in the military administration, logistics or medical corps who lacked direct combat exposure. Thus, the attitudinal effects of war on these non-combat veterans may be more similar to that of civilians—as they experienced the loss of friends and family but did not observe human suffering of outgroup members at the frontline.
We rely on the Abel letters introduced above to test the plausibility of these expectations. The letters represent, of course, a highly selective sample. Nevertheless, we believe they provide a unique glimpse into the mindset of highly nationalist individuals at the time. We exploit information on whether the letter authors served in the military and whether they were injured during their service. We take the latter information as a proxy indicator for combat experience. We use this information to assign the authors of the letter to three groups: (1) civilians, (2) non-combat veterans, and (3) combat veterans.Footnote 13 We then investigate if these groups vary in the way they refer to WW1: we hand-coded all occurrences of the term “Krieg” (war) in the letters into three categories: (1) supportive/enthusiastic, (0) neutral/descriptive, and (–1) negative/deprecative and use the share of supportive/enthusiastic mentions as the dependent variable.Footnote 14
Table 3 shows the results of these analyses. Models 1 and 2 show that civilians are not more likely to mention the war than veterans. However, according to the results of models 3 and 4 civilians mention “Krieg” with a substantially more positive connotation (OI 1.6). Models 5 and 6 show that war attitudes of non-combat veterans are significantly more positive than those of combat veterans and closer to those of civilians than to those of combat veterans (OI 1.7)—presumably because non-combat veterans shared similar war experiences as many civilians.
While the differences are in line with our theoretical expectations, without information on the authors’ prewar attitudes, we cannot determine empirically whether war attitudes among combat veterans deteriorated during their deployment, or vice versa, war attitudes among civilians and non-combat veterans improved during the war.
Civilians and Non-Combatant Veterans (Among NSDAP Supporters) Associate War More Positively than Combat Veterans

Notes: Table shows OLS estimates. Models 1 and 2 report the association between civilian status (versus veteran status as reference category) and whether the word “Krieg” (war) was mentioned in a letter. Models 3 and 4 use the civilian status to predict the share of “Krieg” described positively among all occurrences of “Krieg” (see Section A.3 of the Supplementary Material for coding details). Models 5 and 6 further disaggregate veterans into front soldiers (injured veterans) as reference category, non-injured veterans, and civilians. All estimations use robust standard errors. Results in tabular form, including covariate coefficients, are available in the Dataverse replication archive. Significance levels: ***p < 0.001; **p < 0.01; *p < 0.05; +p < 0.1.
Traditions of Collective Commemoration Amplify the Effects of Exposure to War Death
Next, we investigate whether our main result—the effect of WW1 fatalities on nationalist voting—is amplified in localities with a strong preexisting tradition of collective remembrance of fallen soldiers. To measure the pre-WW1 existence of such a tradition, we collected data on memorials from the 1870/71 German-French war. This measurement relies on the assumption that (1) war monuments constitute an important and widespread element of collective (i.e., public and community-wide) remembrance and that (2) their preexistence (relative to WW1) indicates a certain tradition of commemorating war losses collectively.
We geocoded these memorials and spatially match their locations to the Weimar counties (see Section A.4 of the Supplementary Material for more details). By just including pre-WW1 memorials in our measurement, we not only focus our analysis on preexisting traditions of commemoration but also ensure that our proxy is not itself affected by WW1, which could lead to posttreatment bias. For each county, we scale the total number of pre-WW1 memorials by the prewar population of the county (as of 1910).Footnote 15
Before moving on to the heterogeneity analysis, we validate a number of assumptions underlying our analysis. First, we demonstrate that our proxy measure for local traditions of collective commemoration—pre-WW1 memorials—is not systematically correlated with other social, economic, and political characteristics (see Figure D.19 in the Supplementary Material). We do not detect systematic differences between counties with a high and low memorial density across a wide variety of covariates. Most importantly, we do not find statistically significant associations between pre-WW1 memorials and (i) the WW1 casualty fatality rate, and (ii) the local presence of nationalist and veteran associations. Second, we show that local practices of commemoration (i.e., collective vs. private/individualistic) are persistent over time. In Figure D.20 in the Supplementary Material, we establish that pre-WW1 memorials are a strong predictor of memorials established after WW1. In fact, pre-WW1 memorials are a much stronger predictor of WW1 memorials than WW1 fatalities. This aligns with our theoretical argument, which posits that long-standing practices of local commemoration shaped the response of communities to WW1 fatalities.
Against this background, we conduct a series of tests to investigate whether the effects of WW1 fatalities are amplified by local traditions of collective commemoration. We estimate similar specifications as for our main results but now interact the casualty fatality rate treatment with our measure of pre-WW1 memorial density. We present the results in Figure 8. We find that, on average, the effect of the casualty fatality rate on nationalist voting is higher in areas with high memorial density (OI 2.1, left-most coefficient in Figure 8).
Interaction Between Casualty Fatality Rate and Memorial Density
Note: Estimates of the interaction effect of the casualty fatality rate treatment and the moderator variables as labeled on the x-axis. Outcome is the combined vote share of the DNVP and the NSDAP. All models include election period, pre-WW1 electoral district FEs as well as covariates for urbanization and population size to account for the spatially clustered density of 1870/71 war memorials (see Figure A.5 in the Supplementary Material). The vertical lines indicate 95% (thin) and 90% (thick) confidence intervals. Standard errors are clustered by county. Results in tabular form, including covariate coefficients, are available in the Dataverse replication archive.

To test whether these results really represent the moderating effects of traditions of collective commemoration rather than effects of specific types of commemoration (e.g., particularly nationalistic ones), we disaggregate our measure of memorial density. We differentiate memorials according to their location, distinguishing religious (churchyards, cemeteries) from non-religious ones (town squares). We also code inscriptions on monuments to distinguish monuments with a more or less nationalist character, based on the mentioning of nationalist keywords, such as “fatherland,” “heroes,” or “nation.” Section A.4 of the Supplementary Material presents examples of the inscriptions, their coding, and the different placement of memorials in religious versus non-religious locations.
Figure 8 illustrates the interaction effects between the casualty fatality rate and all four types of memorials. We find statistically and substantively significant interaction effects across all types of memorials. This finding supports our argument that established traditions of collective commemoration matter—rather than any specific (nationalist or non-nationalist) practice of commemoration (OI 2.2).
Finally, we implemented a series of placebo tests to rule out that our commemoration measure simply represents levels of pre-WW1 nationalism. Evidence of similar interaction effects with prewar nationalism indicators as reported in Figure 8 would weaken our claim that it is the tradition of commemoration amplifying the effect of county-level death exposure. We estimate interaction models between the casualty fatality rate and various measures of prewar nationalism used in our balance checks. We report the results in Figure E.21 in the Supplementary Material. Across a series of specifications, we do not find any evidence that prewar nationalism conditions the effect of the casualty fatality rate (OI 2.3).
In sum, evidence across all 10 observable implications strongly supports our main argument that the casualty fatality rate increased support for nationalist parties among civilians amplified by traditions of collective commemoration.
EXTERNAL VALIDITY
To what extent do our theory and findings generalize beyond the specific post-WW1 context? To explore the external validity of our theory, we use data from the “Life in Transition Survey,” conducted in 34 mostly East-European and former Soviet countries with a total sample size of more than 51,000 respondents collected in 2016.Footnote 16 Importantly, this survey includes questions on respondents’ family exposure to WW2 for 32 out of the 34 countries, specifically whether parents or grandparents have been injured or killed. This question reflects our concept of indirect exposure to war losses at the individual level. We use this binary measure to predict two outcome measures associated with nationalism: acceptance of ingroup and outgroup members (Mummendey, Klink, and Brown Reference Mummendey, Klink and Brown2001).Footnote 17
In line with our argument and findings, we expect WW2 exposure to increase ingroup favoritism and to decrease outgroup acceptance. We find support for this expectation in the full sample of countries, based on models with a baseline set of socioeconomic covariates (age, education, and income) and country fixed effects (Section D.5 of the Supplementary Material). We find the expected negative effect of WW2 exposure on outgroup acceptance in 16 of 32 countries, in 10, we find no statistically detectable effects, and in the remaining six, we find positive effects.
Several political and socioeconomic factors may account for the observed cross-country variation in effect direction and size. Investigating the role of these factors goes beyond this article. We believe that future research can use the effect heterogeneity as a starting point to explore which social, political, and economic factors help reduce the ways in which war trauma fuels nationalism.
CONCLUSION
Does war breed nationalism? We have addressed this question in the context of post-WW1 Germany and the rise of the Nazi Party. Our analyses demonstrate that counties with high exposure to WW1 fatalities voted more strongly for extreme nationalist parties—namely, the DNVP and, in later elections, the Nazi Party. Additional analyses are in line with our argument that (1) combat deaths of family members, friends, and community members can strengthen civilians’ ingroup acceptance and outgroup hostility and that (2) traditions of war commemoration reinforce this effect. We also provide evidence for the generalizability of this effect beyond WW1.
Our work has several implications for future research. Existing studies have largely examined the war-nationalism link through the lenses of threats in the international system or top-down, institutional and historical processes. Our results suggest that future studies should complement these macro-level theories with a micro-level, sociopsychological perspective on the effects of war, loss, and political attitudes.
Moreover, we show that different types of war exposure can elicit different types of attitudinal effects in different population subgroups. War deaths increased support for radical nationalist parties among civilians who experienced the human costs of the war, but not the brutal and often disillusioning nature of battlefield violence. Returning veterans, in contrast, fostered a general political shift toward conservative parties. Their war experiences appear to have inhibited veterans from supporting more extreme right-wing nationalist parties like the NSDAP (see also Koenig Reference Koenig2023). Investigating what drives differences in the attitudinal effects of war between civilians and veterans remains an important area for future work.
Finally, our analyses indicate a regional heterogeneity of the effects of death exposure on nationalism. We show that variation in preexisting traditions of war commemoration accounts for some of this variation. Future research should explore the moderating role of other socioeconomic variables to generate a more comprehensive understanding of the conditions under which war exposure fosters or inhibits nationalist preferences.
SUPPLEMENTARY MATERIAL
To view supplementary material for this article, please visit https://doi.org/10.1017/S000305542300014X.
DATA AVAILABILITY STATEMENT
Research data that support the findings of this study are openly available in the APSR Dataverse at https://doi.org/10.7910/DVN/WOEWJ3.
ACKNOWLEDGMENTS
We thank Maja Adena, Jey Alizade, Carles Boix, Sebastian Bondzio, Nils-Christian Bormann, Volha Charnysh, Christoph Dworschak, Christian Gläßel, Marina Henke, Hanno Hilbig, Macartan Humphreys, Christoph Koenig, Erez Manela, Daniel Meierrieks, Jonas Meßner, Jan Pierskalla, Christoph Rass, Adam Scharpf, Seth Soderborg, Alex Watson, Andreas Wiedemann, Julian Wucherpfennig, Daniel Ziblatt, Yuri Zhukov, and workshop participants at the AFK methods section meeting, Harvard, Oslo, WZB Berlin, seminars and the APSA annual conference 2021 for helpful comments. We also thank Jürgen Falter for generously sharing data. We are grateful to Dora Gergis, Fredric Lüssenheide, Anton von Poblozki, and Julian Voß for excellent research assistance. Thomas Tichelbaecker has benefited from research stays at GESIS – Leibniz Institute for the Social Sciences and MZES Mannheim.
FUNDING STATEMENT
Felix Haass acknowledges funding from the European Research Council (ERC) under the European Union’s Horizon 2020 research and innovation program (Grant Agreement No. 863486).
CONFLICT OF INTEREST
The authors declare no ethical issues or conflicts of interest in this research.
ETHICAL STANDARDS
The authors affirm this research did not involve human subjects.


 Open access
Comments
No Comments have been published for this article.