

The first Millennium Development Goal ‘Eradicate extreme poverty and hunger’, target 1.C ‘Halve, between 1990 and 2015, the proportion of people who suffer from hunger’, was evaluated by means of the prevalence of underweight children under 5 years of age (indicator 1·8). More recently, a 40 % reduction in the number stunted children by 2025 has been endorsed as the first global target by the World Health Assembly( 1 ) and discussed in negotiations around the post-2015 development agenda and the Sustainable Development Goals (https://sustainabledevelopment.un.org/%20/n%20_blank).
According to standard criteria( 2 ), precise age data are necessary for assessing underweight (defined by weight in relation to sex and age) and stunting (height for sex and age). In fact, the UNICEF–WHO–World Bank Joint Child Malnutrition Estimates are based on samples of children with correct age reporting( 3 ).
However, while rich countries can rely on accurate demographic and epidemiological information from civil registration systems, periodic censuses and health surveys, in sub-Saharan Africa and South-East Asia millions of people ‘are born, and live and die uncounted and ignored’( Reference AbouZahr, Cleland and Coullare 4 ).
In order to fill information gaps on vital statistics, the global efforts of international organizations, national governments, academia and public–private collaborations have been directed to both strengthening national civil registration systems and promoting complementary interim measures, such as population censuses, demographic surveillance sites, household registration systems and household sample surveys( 5 , 6 ).
Internationally coordinated household surveys, such as the Demographic and Health Surveys (DHS) supported by the US Agency for International Development( 7 ) and the Multiple Indicator Cluster Surveys (MICS) supported by UNICEF( 8 ), provide international political and academic organizations the great majority of epidemiological and demographic data on low- and middle-income countries. These data are widely used by governments and development agencies for planning and monitoring health programmes and social policies. DHS and MICS are based on robust sampling techniques, with a multistage cluster sample design planned to reach a complete coverage of the population residing in households( Reference Eisele, Rhoda and Cutts 9 ). However, household survey estimates can be affected by a certain level of sampling (selection bias) and non-sampling error, i.e. information bias and information error( Reference Eisele, Rhoda and Cutts 9 ).
Selection bias affects DHS and MICS estimates because the surveys may under-represent insecure areas and slum-dwelling populations, and by design they omit parts of the population (people who are more likely to be at risk of undernutrition) such as the homeless, refugees, nomadic people, and those living in residential care facilities, long-stay hospitals or orphanages( Reference Eisele, Rhoda and Cutts 9 – Reference Carr-Hill 11 ). Moreover, in the case of nutritional analysis, a coverage bias occurs because children without a ‘valid date of birth – month and year’ have a zero probability of selection.
However, children with quite accurate age data, such as those with their births registered, cannot be representative of the whole population since children from the richest segments of society, or children who have a well-educated mother, are more likely to be registered and receive adequate nutrition( 5 , 12 ).
On the other hand, the age of unregistered children is subject to both information bias and error. In fact, where birth registration (BR) is uncommon, the age of children must be estimated by asking their parents or careers, who may not be able to provide reliable information. Further, age data from surveys are frequently rounded up or down to the nearest year or half-year because of age-heaping errors introduced by interviewers( Reference Alderman 13 ).
The aim of the current paper was to study the effect of selection bias, information bias and information error, due to insufficient or imprecise age data, on undernutrition estimates. Such errors predominantly affect those regions where the coverage of BR is incomplete, thus causing a drawback of ‘uncounted people’ still not described. The problem is discussed using DHS and MICS data from sub-Saharan Africa. This geographic area was selected considering the availability of published data, the high prevalence of undernutrition and low BR rates, and in order to reduce the confounding effects due to intercontinental variability.
Methods
Thirty-seven sub-Saharan African countries have been included in the analyses (Table 1). Data have been retrieved from the DHS( 7 ) and MICS( 8 ) reports and data sets in September 2014. The more recent reports where both BR rate and undernutrition prevalence were present (in the total sample and in wealth quintiles) have been used.
Data on nutritional status and birth registration in the thirty-seven sub-Saharan African countries considered in the present research

Code, three-letter code for each country provided in ISO 3166; n NS, sample size used for nutritional assessment (as retrieved from reports (nutritional status)); BR, birth registration; n tot, total sample size (retrieved from reports (birth registration)); DHS, Demographic and Health Survey (http://www.dhsprogram.com/data/available-datasets.cfm); MICS, Multiple Indicator Cluster Survey (http://www.childinfo.org/mics_available.html).
* More recent reports have been published, but they lack some necessary data (BR or wealth quintiles).
† Total sample size retrieved from the data set.
‡ More recent reports have been published for sub-regions: South Madagascar and Nyanza Province of Kenya.
§ More recent reports, related to new Somaliland and Somalia (Northeast Zone), have been published, but they lack data on BR and nutritional status.
As described in reports, undernutrition prevalence is evaluated in all or in a sub-sample of children. The different indicators of undernutrition – stunting, underweight and wasting – are defined as, respectively, the prevalence of children with height-for-age, weight-for-age and weight-for-height below −2 sd from the median value of the standard (i.e. height-for-age Z-score (HAZ), weight-for-age Z-score (WAZ) and weight-for-height Z-score (WHZ) <–2)( 2 ).
Weight measurements are obtained using mother–infant scales. Standing height is taken for children older than 24 months, while younger children are measured lying down on the board (recumbent length). Particular attention is given to the collection of age data, by checking consistency between answers to different questions (age of the child, date of birth, birthday) and with dates reported within certificates, when available. The analysis of birth history, where women report the details of each live birth separately, and of the contraceptive calendar represents a further probe for age quality. In some countries, the use of calendars of events, i.e. customized historic calendars with dates of significant events for each geographic area and even for each ethnic or religious group within each country, contributes to reduce errors in estimating a child’s date of birth( 14 ).
In the present study the indices based on the WHO Child Growth Standards( 15 ) were preferentially selected, using those based on the National Center for Health Statistics international growth reference( Reference Hamill, Drizd and Johnson 16 ) only for the 2006 or 2007 surveys and limited to within-country analyses. Sample weights were used as reported by DHS and MICS data sets.
The full study protocol and a database have been made freely available on the Cagliari University repository (http://veprints.unica.it/1119/). The database comprises seven variables, detailed for the total sample and wealth quintiles: prevalence of (i) stunting, (ii) underweight and (iii) wasting in children under 5 years of age; (iv) size of the sample used for nutritional evaluation (‘nutritional sub-sample’); (v) BR rate; (vi) total sample size of surveyed children; and (vii) survey (DHS or MICS, year of the survey).
Composition of the samples
The numbers of children selected for anthropometry (‘nutritional sub-sample’) and the proportions of registered children included in the nutritional sub-sample and in the total sample were retrieved from the DHS and MICS data sets relative to thirty-four countries. Guinea-Bissau, Equatorial Guinea and Mauritania were not included because the data sets relative to the more recent surveys were not yet available.
The difference in BR rates between the nutritional sub-sample and total sample was assessed using a permutation test, a non-parametric statistical test that does not require the assumption of normality.
Effects of selection bias due to birth registration on undernutrition prevalence
This analysis was performed in the thirty-three countries where nutritional indices were based on the WHO Child Growth Standards( 15 ).
The relationship between BR and undernutrition was explored using logistic regression, i.e. a linear regression between the undernutrition indicator, considered in the logit scale where ${\mathop{\rm logit}\nolimits} (Y)=\ln [Y/(1{\minus}Y)]$
, and the explanatory variables: BR and country. The variable Y represents the observed proportion of undernutrition in each wealth quintile.
${\mathop{\rm logit}\nolimits} (Y)=\ln [Y/(1{\minus}Y)]$
, and the explanatory variables: BR and country. The variable Y represents the observed proportion of undernutrition in each wealth quintile.
In more detail, if B and C represent BR and country, respectively, and B×C indicates the interaction between BR and country, the model can be represented as follows:
 $${\mathop{\rm logit}\nolimits} (Y)=\beta _{0} {\plus}\beta _{B} B{\plus}\beta _{C} C{\plus}\beta _{{B{\times}C}} B{\times}C,$$
where we assumed a common undernutrition mean β 0 and slope β B , plus a country-specific mean and slope represented by parameters β C and β B×C , respectively. The goodness-of-fit of the model was assessed by looking at the residuals and Cook’s distances, in order to exclude the presence of outliers. The significance level was assessed using the χ 2 test for the residual deviance. The analysis was repeated for each nutritional indicator separately.
Further, in each wealth class of twenty-eight countries (excluding those with BR ≤10% or ≥90%), we tested the hypothesis that the undernutrition proportion has the same mean in registered and unregistered children against the hypothesis that it is higher in unregistered ones. For this purpose, the data sets ‘Household Member Recode file’ (DHS) and ‘Mothers or primary caretakers of children under the age of five’ (MICS) were used, selecting the variables: HAZ, WAZ, WHZ; wealth index quintile; birth certification/registration; and sampling weights. The Student’s t test with Welch correction was used and the multiplicity of tests was accounted for using the Benjamini–Hochberg procedure( Reference Benjamini and Hochberg 17 ).
Effects of age bias and information error on undernutrition prevalence
The effect of age misreporting on the estimates of stunting and underweight was evaluated in the case of Swaziland using the variables: sex, age (in months), weight and height. The case study of Swaziland was chosen because of its relatively small sample size, that is easier to handle and check for quality, and that can furnish a more reliable variance upper bound.
The effect of 1, 3 and 6 months of magnitude error in age, both in excess and deficit, was evaluated. Only children 24–60 months of age were analysed because an error of 6 months was considered improbable in younger children. The effect of age bias on undernutrition estimates was considered equal to the prevalence of children with a stature (or weight) between the −2 sd stature (or weight) value of their true age and the −2 sd stature (or weight) value of a defined incorrect age. The random error was considered as the differential effect between over- and underestimating age on undernutrition prevalence. The significance of both bias and random error was evaluated by the Student’s t test on the hypothesis of zero mean.
All statistical analyses were performed using the R program (http://www.R-project.org).
Results
Composition of the samples
Different sampling designs were detected among countries (Fig. 1). In some cases the number of children selected for anthropometry was half or less of the total number of surveyed children (38–52 %), while in others it approached the total number (90–99 %; Fig. 1(a)). Heterogeneities were also present in the proportion of registered children included in the nutritional sub-sample, which ranged from less than 10 % to 99·7 % (Fig. 1(b)). In general, the proportion of registered children was greater in countries with higher BR and in higher wealth classes. A slight but highly significant tendency (P<0·0001; mean difference=0·5 %) towards an over-representation of registered children in the nutritional sub-sample with respect to the total sample was observed (Fig. 2).
(colour online) Sample composition: (a) prevalence of children analysed for nutritional assessment (nutritional sub-sample; ![]() ) in the total sample (total bar length) and (b) prevalence of registered children (
) in the total sample (total bar length) and (b) prevalence of registered children (![]() ) in the nutritional sub-sample (total bar length); data from Multiple Indicator Cluster Surveys and Demographic and Health Surveys in thirty-four sub-Saharan African countries (countries’ acronyms are provided in Table 1). Each country is represented by five bars corresponding to wealth quintiles
) in the nutritional sub-sample (total bar length); data from Multiple Indicator Cluster Surveys and Demographic and Health Surveys in thirty-four sub-Saharan African countries (countries’ acronyms are provided in Table 1). Each country is represented by five bars corresponding to wealth quintiles

Distribution of the means of proportion differences in 10 000 permutations of the total with the nutritional sub-sample along with the observed value (vertical dotted line), indicating the significant over-representation of registered children (0·5 %) in the nutritional sub-samples

Effects of selection bias due to birth registration on undernutrition prevalence
A negative relationship between BR and undernutrition prevalence was observed (Fig. 3). The relationship was also present within countries, where lower wealth quintiles (represented by dots ‘1’) are mostly positioned in the left and upper section of the plots, corresponding to lower BR rates and higher malnutrition prevalence. Stunting and underweight showed stronger negative associations with BR than did wasting. This association was shared by all countries irrespective of wealth class and thus can be regarded as a general negative association.
(colour online) The relationship between birth registration (BR) rate and malnutrition prevalence: (a) stunting; (b) underweight; and (c) wasting, according to wealth quintile (where 1 represents lower wealth quintiles, 5 represents higher wealth quintiles, and 2, 3 and 4 represent intermediate quintiles); data from Multiple Indicator Cluster Surveys and Demographic and Health Surveys in thirty-three sub-Saharan African countries

The relationship was further supported by the logistic regression results, where all of the explanatory variables (country, BR and their interaction) were highly significant (P<0·0001; Table 2 and online supplementary material, Table S1). The association between BR and stunting or underweight was significantly less accentuated in some countries (e.g. stunting: GAB, MDG; underweight: CAF, TCD), although still negative (P<0·001; Table S1). Wasting showed a greater homogeneity of results among countries (Table S1).
Logistic regression between birth registration and undernutrition rates; data from Multiple Indicator Cluster Surveys and Demographic and Health Surveys in thirty-three sub-Saharan African countries
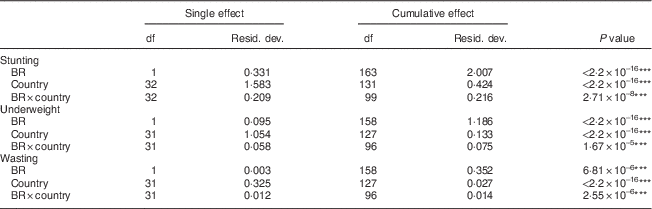
Resid. dev., residual deviance; BR, birth registration rate (B); BR×country, interaction between BR rate and country (B×C).
***P<0·001.
Registered children generally presented a better nutritional status than unregistered ones, with significantly higher HAZ mean values in forty cases out of 140 comparisons (28·6 %; Fig. 4(a)), higher WAZ mean values in fifty-one cases (36·4 %; Fig. 4(b)) and higher WHZ mean values in thirty-eight cases (27·1 %; Fig. 4(c)).
(colour online) Values of (a) height-for-age Z-score (HAZ), (b) weight-for-age Z-score (WAZ) and (c) weight-for-height Z-score (WHZ) in registered v. not registered children within wealth quintiles (where 1 represents lower wealth quintiles, 5 represents higher wealth quintiles, and 2, 3 and 4 represent intermediate quintiles); data from Multiple Indicator Cluster Surveys and Demographic and Health Surveys in twenty-eight sub-Saharan African countries (countries’ acronyms are provided in Table 1). Dots represent significant comparisons (P<0·1)

Effects of age bias and information error on undernutrition prevalence
Figures 5 and 6 show the effect of age bias and random error in the case of Swaziland.
The effect of age bias on stunting and underweight prevalence in the case of Swaziland children aged between 24 and 59 months. Error bars represent the 95% bootstrap confidence interval of the variation (underw, underweight; –1/1, 1 month under-aged/over-aged; –3/3, 3 months under-aged/over-aged; –6/6, 6 months under-aged/over-aged; F, females; M, males)

Box-and-whisker plot showing the effect of random error of age on stunting and underweight prevalence in the case of Swaziland children aged between 24 and 59 months. The bottom and top edge of the box represent the first and third quartiles (interquartile range); the line within the box represents the median; the ends of the bottom and top whiskers represent the minimum and maximum values in the absence of dots, otherwise they indicate the range of non-outliers observations; and the dots represent outliers (1, ±1 month; 3, ±3 months; 6, ±6 months)

The error in undernutrition prevalence increased with the increase of systematic error of age (Fig. 5) and was greater in younger children (online supplementary material, Fig. S1). The shift was more pronounced in stunting than in underweight and in ‘over-aged’ than in ‘under-aged’ children, but similar in males and females. The difference in undernutrition prevalence ranged from 0·44 % (underweight, +1 month, males) to 28·2 % (stunting, +6 months, females; Table S2). The effect was significant in all cases, with the exception of 1 month deviation in underweight (both sexes).
The random error caused an overestimate of undernutrition prevalence, because of the greater error due to overestimation of age (Fig. 6). As for systematic error, the effect increased with the increase of age error, becoming significant in the case of a ±6 months deviation, when it caused an overestimate of stunting (2·7 %; P=0·005) and underweight (1·8 %; P=0·002; online supplementary material, Table S3).
Discussion
The 2011 MICS conducted in the Northeast Zone of Somalia( 18 ) does not give information on child undernutrition because ‘in the absence of birth registration and other services relating to vital statistics, it is extremely difficult to get correct age related data’. It is an uncommon choice that a national health survey omits such relevant information.
However, insufficient or unreliable information about a child’s age is a concrete obstacle to nutritional assessment, because the indicators stunting and underweight cannot be accurately calculated without such data. Unsurprisingly, the problem has emerged in a region of Somalia, i.e. a country with one of the lowest rates of registered children (Table 1). However a similar problem could occur in other countries too, where the coverage of BR is still incomplete, even if established structures for vital data collection are functioning. In those regions, undernutrition prevalence can be affected by different errors: a selection bias towards children with a valid date of birth, such as registered children, and information errors or information biases, that more probably affect estimates based on unregistered children.
Effects of selection bias due to birth registration on undernutrition prevalence
Children whose births are registered have better nutritional status than unregistered ones and this is apparent from the comparison among countries, among wealth quintiles within countries and between groups within quintiles.
The negative relationship between BR and child nutritional status observed in the present research among sub-Saharan countries has not been previously analysed in detail. However, a similar pattern was suggested by UNICEF( 12 ) when stating that ‘children receiving adequate nutrition are more likely to be registered’.
The negative relationship is also present within countries, where wealth status is positively associated with BR( 5 ) and nutritional status( Reference Barros, Victora and Scherpbier 19 ), as can be seen in Fig. 3.
Furthermore, within each wealth quintile registered children have better nutritional status than unregistered ones. This difference can be related to the wealth variability among households within the same quintile or to the residual variability not accounted for by the wealth index that can appear when other socio-economic factors are held constant. In particular, cultural differences, such as religious or ethnic background, can produce disparities in BR rates( 5 , Reference Barros, Victora and Scherpbier 19 ) and also in nutritional status( Reference Brockerhoff and Hewett 20 – Reference Beiersmann, Bermejo Lorenzo and Bountogo 22 ). Mothers’ education may also have an effect, since it influences in a similar way behaviours related to feeding, child-care practices and health-service utilization( Reference Barros, Victora and Scherpbier 19 , Reference Ssewanyana and Kasirye 23 ). In fact, children whose mothers have received at least primary schooling have higher BR rates( 5 ) and better health( Reference Barros, Victora and Scherpbier 19 , Reference Beiersmann, Bermejo Lorenzo and Bountogo 22 – Reference de Onis, Dewey and Borghi 25 ) than those with uneducated mothers.
An additional explanation for the better nutritional status of registered children is the possibility that their age was declared lower than their true age. When considered for nutritional assessment, these children are compared with younger ones – with smaller body dimensions – and their nutritional status appears better than it actually is. This kind of information bias has been observed in some countries where people have an advantage in registering their newborns close to their birthday( 5 , 12 , Reference Oshaug, Pedersen and Diarra 26 ).
The better nutritional status of registered children could cause the underestimation of undernutrition if they were preferentially included in nutritional surveys. This is a likely possibility, considering the need for exact age knowledge for the assessment of nutritional status. Even if DHS and MICS sampling designs are directed to produce statistically reliable estimates of most indicators at the national level, and children are not selected based on the availability of birth records, those without full birth date are excluded from nutritional analysis, as detailed within reports. In fact, the results of the present research have shown a significant selection bias, with registered children slightly more represented in the nutritional sub-samples.
Effects of age bias and information error on undernutrition prevalence
Comparing reports from two different Malian regions, Hatløy( Reference Hatløy 27 ) showed that age heaping was much lower in the survey where 55 % of the children had a birth certificate, compared with where birth certification was less than 10 %. In general, when nutritional status is assessed in unregistered children, it is more probable to rely on an incorrect child’s age due to information bias and information error.
Information bias can occur because of the tendency to overestimate the age of a well-nourished child and underestimate that of a malnourished one, especially if not wasted( Reference Oshaug, Pedersen and Diarra 26 , Reference Bairagi, Edmonston and Hye 28 ). An upward age heaping has been effectively observed in Somalia and Kenya( Reference Bairagi and Langsten 29 ), whereas a tendency to downward heaping was found in Bangladesh( Reference Bairagi and Ahsan 30 ) and Burundi( Reference Bairagi and Langsten 29 ).
In sub-Saharan Africa, age misreporting is quite a common phenomenon( Reference Hatløy 27 , Reference Bairagi and Langsten 29 ). According to Bairagi and Langsten( Reference Bairagi and Langsten 29 ), about 20 % of Kenyan children surveyed in 2007 had only their year of birth, and no month imputed; nevertheless, an age in months was attributed to these children. Further, during recent fieldwork on child nutrition in Uganda and Tanzania, we have found insufficient or inconsistent data on age in more than 40 % of the 960 examined children.
Both information bias and error have an effect on undernutrition prevalence estimates. Using data from Swaziland children, we have shown that age bias has a more pronounced effect in younger children (as similarly observed by Bairagi and Gorstein)( Reference Bairagi 31 , Reference Gorstein 32 ), in stunting than in underweight values (as in Oshaug et al. and Bairagi)( Reference Oshaug, Pedersen and Diarra 26 , Reference Bairagi 31 ) and in ‘over-aged’ than in ‘under-aged’ children (also in Oshaug et al.)( Reference Oshaug, Pedersen and Diarra 26 ). The magnitude of error ranged between 0·4 % and 28·2 %, according to the nutritional indicator and age bias. Similar or higher errors have been observed elsewhere( Reference Oshaug, Pedersen and Diarra 26 , Reference Bairagi 31 – Reference Bairagi, Edmonston and Khan 33 ), with a maximum underestimation of stunting prevalence by about half in 1-year-old children with a 1 month age reduction( Reference Gorstein 32 ).
Under the assumption of equal probability of deviations in excess and in deficit, random error has no effect on the mean age because the deviations compensate for each other. The corresponding effect on undernutrition prevalence, however, is not necessarily null (online supplementary material, Fig. S2). The magnitude of such an effect depends on the child’s age and degree of undernutrition. In the case of Swaziland, random error caused an overestimate of undernutrition prevalence of up to 2·7 %.
In short, non-sampling error probably produces the underestimate of undernutrition prevalence. In fact, information error has a smaller effect than information bias and age is more likely underestimated in undernourished children.
Actual situation due to sample composition
Sampling differences observed in the sub-Saharan African surveys, in the proportion of children analysed for assessing nutritional status (Fig. 1(a)) and the composition in terms of registered and unregistered children (Fig. 1(b)), may have an influence on the accuracy and reliability of undernutrition estimates. The different proportions of registered children (Fig. 1(b)) do not appear associated with geographic location (West and Middle v. South and East Africa), socio-economic level (low v. middle income), type of survey (DHS v. MICS), or with the sampling design shown in Fig. 1(a).
Countries represented by samples with a greater prevalence of registered children have a higher risk of undernutrition underestimation, while errors due to age misreporting are more likely to occur in countries with a high prevalence of unregistered children, particularly Somalia, Liberia and Ethiopia. When this latter source of error is associated with a low proportion of children selected for nutritional evaluation, as happens for example in Ethiopia, the imprecision of undernutrition estimates increases.
Vice versa, estimates are more reliable in countries, for example Sierra Leone and Togo, with a greater coverage of children included in nutritional analysis and of registered children in the nutritional sub-sample.
Study limitations
Although we have analysed the relevance of sampling and non-sampling error, we have not defined a statistical adjustment of undernutrition prevalence considering their effect. We limit our contribution to stress the need for more research on these topics.
Conclusion
Based on MICS and DHS data from sub-Saharan Africa, we have shown that a selection bias favouring registered children and, more generally, children with a ‘valid date of birth – month and year’ is present and can lead to underestimate undernutrition prevalence. Furthermore, unregistered children are more likely prone to information bias and error, whose probable effect is, again, the underestimation of undernutrition. Errors affect sub-Saharan African countries differently, due to the differences in sampling design and BR rates existing among them.
DHS and MICS remain the most valuable source of data on child health in low- and middle-income countries and the best tool for national and global decision making. However, these results indicate that nutritional estimates can be imprecise and the situation can be worse than shown. In particular, stunting is the indicator most affected by age error. Hence, although it is highly informative on child nutritional status( Reference de Onis, Dewey and Borghi 25 ), it is less reliable in situations where children’s ages are imprecise.
In these cases, age-independent indices of nutritional status, such as weight-for-height (as suggested by WHO for refugee situations)( 34 ) or mid upper-arm circumference with a cut-off point, should be used, even if they describe only particular facets of undernutrition. Further, as suggested by FAO( 14 ), community events calendars, such as those recently applied in the 2013–14 DHS in Togo and in the 2011 MICS in Somaliland, should be broadly used to collect more accurate information on child age. Moreover, nutritional surveys should indicate the methods used to assess child age.
In summary, considering the key role of nutritional indicators in health programmes and the central role of nutrition to sustainable development( 35 ), we stress the importance of national and global efforts to continue promoting BR. In fact, no alternative biological tool exists to assess age with enough precision to be used for nutritional assessment and which is not itself influenced by nutritional status. The global challenge for improving BR, besides being central to inequalities reduction in terms of access to health, education and housing, is also relevant to strengthen the quality of epidemiological data on nutritional status. Programmatic actions applied to fulfil this goal (free registration of birth, better communication, use of mobile and digital technology, collaboration among socio-political programmes and the health sector) have started to yield results and need to be continued until achieving universal registration of children immediately after birth( 3 ).
Acknowledgements
Acknowledgements: The authors thank Roberto Buffa for useful suggestions, Valeria Succa and Sandro Piludu for technical assistance, and Dominick John Tompkins for language revision. Financial support: This research received no specific grant from any funding agency in the public, commercial or not-for-profit sectors. Conflict of interest: None. Authorship: O.C. and E.M. conceived the project, performed the literature search and collected data; S.C. performed the statistical analysis and realized the figures; all authors defined the study design, interpreted data and wrote the manuscript. Ethics of human subject participation: This is a secondary analysis of data so formal ethical disclosure was not needed. Permission to use and analyse the data sets was obtained by registering the project on the DHS website (http://www.dhsprogram.com) and on the MICS website (http://www.unicef.org/statistics/index_24302.html).
Supplementary Material
To view supplementary material for this article, please visit http://dx.doi.org/10.1017/S136898001500333X


