





1. Introduction
If a pre-linguistic child hears the word “spoon” in the presence of a spoon, how could they know whether the word refers to the whole object, its colour, just the bowl but not the rest of the spoon, or this specific spoon but not other spoon-like objects? Despite the large number of logically possible hypotheses about the meaning of each individual word, children learn word meanings quickly (Quine, Reference Quine1954). Additionally, children are few-shot learners, and without explicit instruction or feedback, they are able to generalize the meaning of a word to new members of that semantic category that share some properties with the original referent. For example, if a child hears the word “spoon” in the presence of a spoon, they can generalize this word to other spoons, but not to forks or knives. To resolve this puzzle, researchers have proposed a variety of innate constraints, learned biases, and reasoning processes that could potentially help children identify word meanings, and successfully extend them to category members. One well-studied proposal is the idea that children have a shape bias: a tendency to generalize nouns by the referent’s shape more than other perceptual attributes like colour, texture, or size (Landau et al., Reference Landau, Smith and Jones1988; Subrahmanyam & Chen, Reference Subrahmanyam and Chen2006) or conceptual attributes like a functional, thematic, or a taxonomic match (Imai et al., Reference Imai, Gentner and Uchida1994, Reference Imai, Saalbach and Stern2010; Poulin-Dubois et al., Reference Poulin-Dubois, Frank, Graham and Elkin1999; Yoshida & Smith, Reference Yoshida and Smith2003a).Footnote 1
One reason for researchers’ long-standing interest in the shape bias relates to its hypothesized role in early word learning. In one study, Samuelson (Reference Samuelson2002) trained 17-month-old children over 7 weeks by repeatedly playing with and hearing names of unfamiliar objects from categories that were well organized by shape. Children who received the training showed evidence of generalizing new categories by shape compared with children who had not received the training, suggesting that practice with shape categories had helped them acquire a broader, more general shape bias. Further, the trained group learned more object names – as measured by parent reports – during and after the intervention, suggesting that the shape bias could be an important tool for noun learning for children in this age group (see Perry et al. [Reference Perry, Samuelson, Malloy and Schiffer2010] for further discussion). Additionally, it has been found to be weaker in children with language impairments, and in children with autism spectrum disorder (Collisson et al., Reference Collisson, Grela, Spaulding, Rueckl and Magnuson2015; Susan Scanlon Jones, Reference Jones2003; Jones & Smith, Reference Jones and Smith2005; Perry & Kucker, Reference Perry and Kucker2019; Perry et al., Reference Perry, Meltzer and Kucker2021; Potrzeba et al., Reference Potrzeba, Fein and Naigles2015; Tek et al., Reference Tek, Jaffery, Fein and Naigles2008). Although the causality direction is not yet clear, these findings suggest that the shape bias may be a useful tool for children learning nouns.Footnote 2
The shape bias is typically demonstrated in different varieties of word extension tasks. In their basic setup, these tasks typically involve giving a novel label to a single exemplar object, which is then contrasted with test objects that vary in shape, colour, texture, or other properties. For instance, in one study, 15-month-old children were shown an exemplar object that had a specific non-visual property like producing a sound when tapped (Graham & Diesendruck, Reference Graham and Diesendruck2010). Then children were asked which of the test objects – which matched the exemplar in either colour, shape, or material – belonged to the same category. Children selectively extended the non-visual property to the test objects that resembled the exemplar in shape, revealing a bias towards this dimension (Diesendruck & Bloom, Reference Diesendruck and Bloom2003; Graham & Diesendruck, Reference Graham and Diesendruck2010; Samuelson & Horst, Reference Samuelson and Horst2007).
Yet, the degree of shape bias observed in word learning experiments varies across ages, cultures, languages, experimental protocols, and items. Some of this variation has been claimed to be theoretically important – for example, cross-cultural and developmental variation – while some is likely due to procedural details, or random statistical variation. In addition, some variation may be caused by publication bias – the practice of selectively publishing results that achieve statistical significance – which has been an issue in other developmental literatures (Bergmann et al., Reference Bergmann, Tsuji, Piccinini, Lewis, Braginsky, Frank and Cristia2018; Frank et al., Reference Frank, Bergelson, Bergmann, Cristia, Floccia, Gervain, Hamlin, Hannon, Kline, Levelt, Lew-Williams, Nazzi, Panneton, Rabagliati, Soderstrom, Sullivan, Waxman and Yurovsky2017). The current article aims to synthesize evidence relating to the shape bias, using statistical meta-analysis to quantify its overall effect across different studies and, where possible, sources of variation in its magnitude.
Here, we use the term “bias” as a convenient descriptor of this behavioural phenomenon without presupposing any particular underlying mechanism. Although the underlying mechanism of the phenomenon – i.e., whether it is an automatic attentional mechanism or a more conceptually regulated process “shape as a cue” – is also debated, we do not attempt to resolve this debate in the current article. Additionally, there is a lack of explicitly shared definitions of what characterizes a “shape,” whether it involves the skeleton, topology, axes, parts, or the boundaries of an object. We do not attempt to provide a specific definition here. Instead, our goal is to ask how much evidence the literature shows regarding the robustness of the behaviour and how it varies.
1.1. Theoretical accounts of the shape bias
Although we do not attempt to resolve theoretical questions about the origins of the shape bias, theoretical accounts guide some aspects of our analysis (e.g., our selection of moderating variables). Thus, we give a brief review of potential explanations, considering four different explanations of this behavioural tendency: innateness, learning from lexical statistics, learning from syntax, and learning from environmental statistics. These explanations are not necessarily mutually exclusive – multiple sources could contribute to the developmental emergence of the shape bias.
One explanation for the shape bias would be that children have an innate tendency to generalize by shape. This possibility would be challenged, however, by the observation that the shape bias is primarily found in linguistic generalization tasks as opposed to non-linguistic similarity judgement tasks, indicating that it is unlikely to be a generalized attentional bias (Imai et al., Reference Imai, Gentner and Uchida1994; Jones & Landau, Reference Jones and Landau1992; Landau et al., Reference Landau, Smith and Jones1988; Poulin-Dubois et al., Reference Poulin-Dubois, Frank, Graham and Elkin1999; Samuelson & Smith, Reference Samuelson and Smith2000; Smith et al., Reference Smith, Jones and Landau1996; Smith et al., Reference Smith, Jones, Landau, Gershkoff-Stowe and Samuelson2002) (see Diesendruck and Bloom [Reference Diesendruck and Bloom2003] for counter-argument). Further, the magnitude of the shape bias appears to vary across ages, language onset, cultures, and languages, inconsistent with a purely nativist explanation. An alternative proposal argues that children acquire the shape bias by generalizing the lexical statistics of their language. The early vocabulary of English-speaking children in the United States predominantly comprised nouns referring to solid objects, suggesting that the shape bias may be an “over-hypothesis” that nouns tend to generalize in the same way as one another (Colunga, Reference Colunga2004; Colunga & Smith, Reference Colunga and Smith2000; Gershkoff-Stowe & Smith, Reference Gershkoff-Stowe and Smith2004a; Perry et al., Reference Perry, Meltzer and Kucker2021; Perry & Samuelson, Reference Perry and Samuelson2011; Perry et al., Reference Perry, Samuelson, Malloy and Schiffer2010; Samuelson, Reference Samuelson2002; Samuelson & Smith, Reference Samuelson and Smith1999; Yoshida & Smith, Reference Yoshida and Smith2003a). Children’s early experience with nouns referring to solid and countable objects, in turn, privileges the property of shape, leading to an inductive bias, such that as children learn more nouns, they should be more likely to pick up on shape as an organizing regularity of the lexicon. This proposal is supported by the observation that both children and computer simulations trained with larger US English vocabulary show a stronger shape bias (Perry & Samuelson, Reference Perry and Samuelson2011; Samuelson, Reference Samuelson2002; Samuelson & Smith, Reference Samuelson and Smith1999) (see Booth et al. [Reference Booth, Waxman and Huang2005], Colunga and Sims [Reference Colunga and Sims2017], Graham and Poulin-Dubois [Reference Graham and Poulin-Dubois1999], Hahn and Cantrell [Reference Hahn and Cantrell2012], Perry et al. [Reference Perry, Meltzer and Kucker2021], Tek et al. [Reference Tek, Jaffery, Fein and Naigles2008] for further discussion and counter-arguments). However, this proposal alone lacks a quantitative account of why children learning different languages (e.g., East Asian languages) show a weaker shape bias, and of how their capacity to learn nouns develops.
Additionally, this generalization may be guided by the syntax of children’s native language. For example, the syntactic marking that distinguishes count and mass nouns is not a universal aspect of languages. In English, count nouns (e.g., “ball”) are generalized by shape, while mass nouns (e.g., “sand”) that cannot be modified by numerals or combined with indefinite articles (“a” or “an”) are not. The presence of this distinction might facilitate English-speaking children (and other children learning languages with a mass–count distinction) in picking out the category of words to which the shape bias can be productively applied. In contrast, children learning languages that lack the mass–count distinction (e.g., some East Asian languages like Mandarin or Japanese) do not have access to this organizing principle. Some experiments have explicitly varied whether count/mass language is used in the presentation of new objects, directly testing whether this syntactic cue guides generalization (Larissa K. Samuelson et al., Reference Samuelson, Horst, Schutte and Dobbertin2008; Soja et al., Reference Soja, Carey and Spelke1991; Soja et al., Reference Soja, Carey and Spelke1992; Tran & Yoshida, Reference Tran and Yoshida2012).
A final proposal is that shape bias might in part be a function of exposure to manufactured artefacts, since children often see many examples of an artefact that vary in colour, size, or texture but are similar in shape (e.g., balls or toy cars). Exposure to such artefacts is higher in industrialized cultures where a built environment is more prevalent. While nearly all hammers are hammer-shaped, many plants are similar to one another in overall shape but vary in other details such as colour, texture, or sub-part shape. Children in more industrialized cultures might see relatively more hammer-like categories and relatively fewer plant-like categories compared with children in less-industrialized contexts. Supporting this hypothesis, Tsimane’ speakers in Bolivia, who have relatively less artefact experience, showed a lower level of shape bias compared with English speakers from an industrialized culture (Jara-Ettinger et al., Reference Jara-Ettinger, Levy, Sakel, Huanca and Gibson2022).
1.2. Dimensions of variation in the shape bias
Across the large literature that investigates children’s shape-based generalizations, the magnitude of the observed shape bias varies widely. We next review some of these sources of variation, which guide the research questions that we assess using our meta-analysis. Some – but not all – sources of variation relate to the theoretical proposals about the origins of the shape bias. These links between observed variation and theory are not always clear and have rarely been stated in quantitative form. To foreshadow our results, though we were initially hopeful that we could, in fact, estimate the effects of theoretically relevant moderators in our meta-analysis – and even pre-registered relevant hypotheses – the sparsity of specific moderators in the literature combined with the broad procedural variation across experiments likely makes this goal impossible.
First, the shape bias varies developmentally, but the trajectory of the change has not been mapped precisely. For example, the magnitude of the shape bias appears to emerge at or before the second birthday. In some studies, it continues to increase through the third year and into adulthood (Jara-Ettinger et al., Reference Jara-Ettinger, Levy, Sakel, Huanca and Gibson2022; Landau et al., Reference Landau, Smith and Jones1988; Samuelson et al., Reference Samuelson, Horst, Schutte and Dobbertin2008), showing a positive trend with age, while in others it decreases. For example, in one study, 3-year-olds showed a strong bias to generalize nouns by shape, while 5-year-olds and adults showed a weaker bias (Imai et al., Reference Imai, Gentner and Uchida1994; Landau et al., Reference Landau, Smith and Jones1998; Subrahmanyam & Chen, Reference Subrahmanyam and Chen2006). These developmental trajectories are closely related to theoretical accounts of the shape bias, and each form tells a different story. For example, a quadratic developmental curve was used in previous studies to support the notion that shape bias is a statistical over-generalization built over the associations children draw between the type of objects encountered in their early life, and how those objects are labelled (a noun bias), and syntactic markings (syntactic bootstrapping), resulting in a heuristic that facilitate the process of expanding vocabulary. Then, they undergo a hypothesis shift with increasing sensitivity to other category cues, producing a curvilinear trajectory (Samuelson et al., Reference Samuelson, Horst, Schutte and Dobbertin2008). Age differences were also a function of the specifics of the task, condition, and items used (Booth et al., Reference Booth, Waxman and Huang2005; Graham et al., Reference Graham, Williams and Huber1999; Imai & Gentner, Reference Imai and Gentner1997; Smith et al., Reference Smith, Jones and Landau1996; Subrahmanyam et al., Reference Subrahmanyam, Landau and Gelman1999). In our meta-analysis, we attempt to quantify developmental change in the magnitude of the bias across different studies (Research Question 1).
Second, studies on the shape bias have been conducted across a variety of languages and cultures that vary in their mass/count syntax, other linguistic properties, and many cultural dimensions including environment and industrialization. Speakers of Eastern Asian languages such as Japanese and Mandarin have been claimed to show a reduced tendency to rely on shape for word extension (Cantrell & Smith, Reference Cantrell and Smith2013; Gathercole & Min, Reference Gathercole and Min1997; Imai & Gentner, Reference Imai and Gentner1997; Imai et al., Reference Imai, Saalbach and Stern2010; Jara-Ettinger et al., Reference Jara-Ettinger, Levy, Sakel, Huanca and Gibson2022; Samuelson & Smith, Reference Samuelson and Smith1999; Soja et al., Reference Soja, Carey and Spelke1991; Subrahmanyam & Chen, Reference Subrahmanyam and Chen2006; Tran & Yoshida, Reference Tran and Yoshida2012; Yoshida & Smith, Reference Yoshida and Smith2003b). The intersection of cross-linguistic and developmental variation adds another layer of complexity. In one study, English- and Mandarin-speaking 3-year-olds generalized by shape. In contrast, Mandarin-speaking 4-year-olds and adults generalized by material while English-speaking 4-year-olds and adults showed a preference for shape (Subrahmanyam & Chen, Reference Subrahmanyam and Chen2006). As is common in cross-cultural/cross-linguistic research, observed variation across populations can be difficult to interpret due to the myriad correlated cultural and linguistic factors that differ between populations. We attempt to quantify evidence for cross-cultural and cross-linguistic differences across ages (Research Question 2).
Third, the shape bias is thought to be a distinctive extension strategy for solid objects, but it is also reported to be mediated by the complexity of the stimuli, which in turn often covaries with the perception that objects have a specific function. When they were directly given information about objects’ function, preschool children use shape to generalize the noun label, while older children are more likely to use function (Gentner, Reference Gentner1978; Graham et al., Reference Graham, Williams and Huber1999; Landau et al., Reference Landau, Smith and Jones1998; Smith et al., Reference Smith, Jones and Landau1996). However, results are more varied for studies where complexity rather than function is manipulated. For example, in some studies, English and Japanese-speaking children were found to prioritize shape for complex industrial artefacts with clear functions but only Japanese children, however, were claimed to show reduced shape generalization for simple uniform objects with no clear function (Cook et al., Reference Cook, Bassetti, Kasai, Sasaki and Takahashi2006; Gentner, Reference Gentner1978; Imai & Gentner, Reference Imai and Gentner1997; Sandhofer & Smith, Reference Sandhofer and Smith2004; Srinivasan et al., Reference Srinivasan, Berner and Rabagliati2019). In contrast, in other studies, the complexity of objects elicited less variation in shape bias (Cimpian & Markman, Reference Cimpian and Markman2005; Potrzeba et al., Reference Potrzeba, Fein and Naigles2015).Footnote 3 Thus, we also attempt to evaluate the relationship between complexity of objects and the propensity to generalize by shape (Research Question 3).
Finally, the syntax used in the presentation of stimuli varies across experiments. Some experimental procedures explicitly use mass/count marking to manipulate generalization, while other procedures avoid syntactic marking and use neutral syntax instead (using “my/this dax,” instead of “a dax” or “some dax”) (Dansereau, Reference Dansereau2017; Horst & Twomey, Reference Horst and Twomey2013; Imai & Gentner, Reference Imai and Gentner1997; Perry & Samuelson, Reference Perry and Samuelson2011; Samuelson et al., Reference Samuelson, Horst, Schutte and Dobbertin2008; Soja et al., Reference Soja, Carey and Spelke1991; Soja, Reference Soja1992). Again, sensitivity to mass/count syntax might vary developmentally; in some studies, younger children showed more sensitivity to syntax that is incongruent with the target (e.g., using count syntax with substances; Soja, Reference Soja1992). We attempt to quantify the effects of syntax and its interaction with development (Research Question 4).
One major challenge for addressing these questions is that studies vary significantly in their procedures, stimuli, and comparison dimensions. Stimuli in studies range from real objects to animate categories, artefacts, drawings, silhouettes, and pictures. For example, 2-year-olds were found to generalize by shape in the case of artefacts, while relying on both shape and texture in the case of animate categories (Booth et al., Reference Booth, Waxman and Huang2005; Yoshida & Smith, Reference Yoshida and Smith2003b) (see Graham and Poulin-Dubois et al. [Reference Poulin-Dubois, Frank, Graham and Elkin1999] for counter-argument). Likewise, shape bias was found to be more prevalent with three-dimensional objects than two-dimensional ones (Davidson et al., Reference Davidson, Rainey, Vanegas and Hilvert2018). Procedural variation is also important: in another study, the shape bias was absent when children were not forced to choose between test objects (Cimpian & Markman, Reference Cimpian and Markman2005). These studies highlight variability due to relatively minor aspects of stimulus representation or instructions.
1.3. The current study
Given the wide range of factors claimed to influence the shape bias, as well as the disparities between studies in their samples and methods, we were interested in consolidating the current base of knowledge. A previous review of the shape bias provides an important qualitative synthesis of the evidence base, and has been essential for mapping themes, methods, and interpretive debates (Kucker et al., Reference Kucker, Samuelson, Perry, Yoshida, Colunga, Lorenz and Smith2019). To our knowledge, however, there has been no systematic literature search combined with a quantitative synthesis. We believe a quantitative meta-analysis is necessary to provide quantitative estimates of effect magnitude, variance, or bias in the cumulative literature. Also, only a quantitative meta-analysis can formally test whether age, language family, syntactic marking, stimulus type, etc., account for effect-size variation above sampling error. We therefore use statistical meta-analysis to estimate the overall effect size of the shape bias. In addition, we address the four research questions earlier by coding variation in age, language/culture, stimuli/procedure, and syntactic framing. We then conduct a series of meta-regressions, testing whether these covariates moderate the estimated shape-bias effect.
At the outset, we first acknowledge that those moderators are not mutually exclusive, and we do not attempt to disentangle them. Second, we may not have enough data to fully test all of these moderators; understanding whether this is the case is in itself a useful finding, speaking to how much empirical support there is for extant theoretical accounts. Given these limitations, moderator analyses should be interpreted as quantifying the degree to which the existing evidence can support claims about systematic variation, not as definitive tests of theoretical predictions. We also report the results of all analyses attempted, as they were pre-registered before conducting the meta-analysis. Finally, we also assess the degree of publication bias in the literature and whether this bias is related to the reported magnitude of the shape bias in published data.
2. Methods
Except where noted, all hypotheses, literature search criteria, and statistical analyses were pre-registered at http://tinyurl.com/shapebias.
2.1. Literature search
We created an initial set of papers to screen for inclusion in the meta-analysis. We based this set on the combined output of google scholar searches using the keywords “shape bias,” “word generalization,” “word learning” combined. We also performed forward citation searches of two foundational papers in this literature: Landau et al. (Reference Landau, Smith and Jones1988) and Imai & Gentner (Reference Imai and Gentner1997) and added a group of studies identified through domain knowledge and checking of reference lists. Figure 1 shows a PRISMA diagram describing our screening process. We only included published papers, excluding unpublished theses and dissertations.
A PRISMA flowchart illustrating the systematic review process from initial record identification to final meta-analysis inclusion.

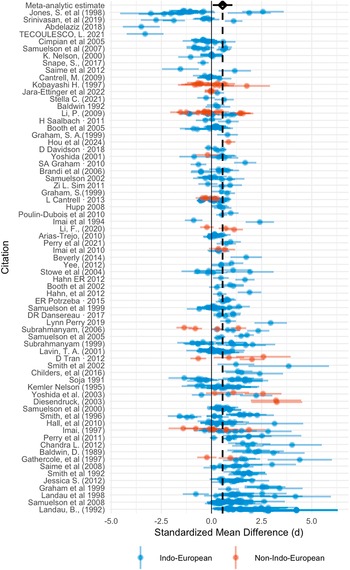
Figure 2. Long description
A forest plot with the y-axis labeled Citation and the x-axis labeled Standardized Mean Difference d. The x-axis ranges from negative 5.0 to 5.0. A solid vertical line is positioned at 0.0 and a dashed vertical line is positioned at approximately 0.5.
At the top, the Meta-analytic estimate is represented by a black diamond centered near 0.5. Below this, over 70 individual studies are listed by author and year. Each study is represented by a colored dot indicating the mean effect size and a horizontal line representing the confidence interval.
Data points are color-coded according to a legend at the bottom. Blue dots and lines represent Indo-European languages, while orange dots and lines represent Non-Indo-European languages.
Key observations include.
* The majority of blue data points are clustered between 0.0 and 2.5.
* Several early citations like Jones, S. et al 1998 and Abdelaziz 2018 show negative mean differences with wide confidence intervals extending to negative 5.0.
* Orange data points are interspersed throughout the list, with notable entries like Kobayashi H. 1997 and Diesendruck 2003 showing positive mean differences.
* The density of studies increases toward the bottom of the plot, with many blue markers showing positive standardized mean differences between 0.0 and 5.0.
In total, 170 papers were found. We filtered these first via titles and abstracts and then via full-text screening, based on the following eligibility criteria: (1) Effects must be from an experiment (e.g., with random assignment of participants to at least two conditions). (2) The experiment must include participants less than or equal to 5 years old. (3) The experiment must use a word extension task that contrasts shape with other properties of the referent.
Applying these criteria resulted in 71 papers that both satisfied our criteria and reported enough information to calculate an effect size (ES) relating to one or more experimental conditions. An ES could be directly reported or could be computed based on reporting of the proportion of choosing shape in text, tables, graphs or reporting a statistical test (typically a comparison of shape bias against chance using a test such as a one sample
$ t $
 test).
2.2. Coding of effect size and moderators
The shape bias is typically assessed through word extension tasks (Landau et al., Reference Landau, Smith and Jones1988). In this task, children are shown a novel object labelled with a novel noun such as a “dax,” presented with test objects varying in shape, and asked if each is a “dax.” Most studies use either forced choice or endorsement tasks where children judge objects based on category membership.
We coded the effect size for each experimental condition as the standardized mean difference (Cohen’s
$ d $
 ) between the proportion of children who extended the label to shape-matching objects compared with other properties (e.g., colour, texture, or material). In the case of forced choice tasks, the effect size was calculated against chance, depending on the number of choices. In the case of endorsement tasks, the effect size was calculated as the difference between the proportion of children who extended the label to shape-matching objects compared with other properties (e.g., colour, texture, or material).
We coded the variance of each effect size using the formula for Cohen’s
$ d $
 (Higgins et al., Reference Higgins, Thompson, Deeks and Altman2003). Because many of the papers we coded were decades old, reporting standards varied considerably, and effect size extraction was often a challenge. Additionally, because studies often included multiple age groups, different types of stimuli, and various manipulations, one experiment usually yielded more than one effect size, and often papers included multiple experiments. Estimation of effect sizes followed this order of precedence: If the paper reported Cohen’s d, we used it directly (N = 5). If the Cohen’s d was not reported, we looked for test statistics (N = 56). In the absence of this information, we used proportions reported in text and tables (N = 138), or graphs (N = 275) along with the standard deviation (SD) or the standard error (SE). In the absence of reported SD or SE, we computed these via standard formulae.
For each effect size, we attempted to code the following moderators: participant age; number of participants; type of syntax used – informative (count/mass) or neutralFootnote 4; alternative test objects properties (e.g., shape, colour, material); nature of the stimuli: solidity, animacy, and whether they were two- or three-dimensional; type of exposure before testing (whether the child saw multiple training examples of the target object or just a single example); child’s vocabulary size; country of test and language spoken by participants; response mode (grasping, looking, pointing, or verbalizing); measured behaviour (e.g., behavioural, eye tracking); population type (typically developing or not); total number of trials. (Effect sizes are estimated across different groups of contrasting properties: shape vs. colour, material, function, etc.). For most of these moderators, coding relied on explicit information reported and described in the article. When the moderator was not explicitly mentioned (e.g., solidity of objects, syntax), we made inferences based on the stimuli and procedure descriptions, when possible, otherwise we coded them as “null.” Coding was performed by the first author, and a second coder independently coded a random subset of 15 papers (21% of the total) with 80% agreement. Discrepancies were resolved via discussion.
For our pre-registered analyses, we excluded effect sizes from clinical populations (N = 18) and multilingual populations (N = 6), because they are known to be very heterogeneous, though these effect sizes remain in the data file we provide. Representation across languages varied substantially, such that there were 405 effect sizes for English while other languages included only 81 data points. Other languages included German (7), Spanish (10), Chinese (19), Japanese (36), Korean (2), Vietnamese (2), and Tsimane (3). The final coded sample consisted of 71 papers with 486 effect sizes.
2.3. Analytic approach
All analyses were performed using the metafor package in R (Viechtbauer, Reference Viechtbauer2010). We pooled effect sizes using a multi-level meta-analysis model with effect size nested within experiment number, in turn nested within paper ID as a random effect. This complex random effect structure was necessary due to the non-independence of effect sizes from the same experiment and/or paper, since these experiments would typically share many characteristics (e.g., measure, procedure, or stimuli). We attempted to perform confirmatory analysis of our pre-registered hypotheses via multi-level meta-regressions including age, language, item properties of the stimuli, and syntax as fixed effects. In some cases (described next), we did not have sufficient data to add particular factors to our analyses.
3. Results
Figure 2 shows the forest plot for coded effect sizes. Our initial meta-analytic model with no moderators revealed an overall effect size of 0.55 [0.36, 0.74] (
$ p $
 < .001). Nevertheless, effects varied substantially, yielding a substantial amount of within- and between-study heterogeneity (
$ {I}^2=0.95 $
< .001). Nevertheless, effects varied substantially, yielding a substantial amount of within- and between-study heterogeneity (
$ {I}^2=0.95 $
 ). Not all stimuli in our coded studies were expected to produce a shape bias, with 435 effect sizes involving solid objects and only 51 using non-solid objects. Although we did not pre-register removing studies with non-solid targets, we believe this is an important step since all theories of the shape bias would predict smaller effects for non-solid targets. In our remaining analysis, we focus on the subset of effects using solid objects, deviating from our pre-registration. Heterogeneity for this subset was
$ {I}^2=0.95 $
). Not all stimuli in our coded studies were expected to produce a shape bias, with 435 effect sizes involving solid objects and only 51 using non-solid objects. Although we did not pre-register removing studies with non-solid targets, we believe this is an important step since all theories of the shape bias would predict smaller effects for non-solid targets. In our remaining analysis, we focus on the subset of effects using solid objects, deviating from our pre-registration. Heterogeneity for this subset was
$ {I}^2=0.95 $
 . So, the heterogeneity remains high even when generalizing by shape for a set of stimuli with only solid objects, motivating the moderation analyses next.
Forest plot of all coded effect sizes, sorted by average effect size. Multiple points for an individual paper indicate multiple effects. Solid line is zero effect size, dashed line is the overall meta-analytic effect size. Colour indicates language family.

Figure 1. Long description
The flowchart begins at the top with two boxes. The left box shows Records identified through database searching n equals 156 and the right box shows Additional records identified through other sources n equals 22. Arrows from both point down to a central box labeled Records after duplicates removed n equals 170.
An arrow points down to Records screened n equals 170. From this box, a horizontal arrow points right to Records excluded n equals 51, while a vertical arrow points down to Full-text articles assessed for eligibility n equals 119.
From the eligibility box, a horizontal arrow points right to Full-text articles excluded, with reasons n equals 48, while a vertical arrow points down to Studies included in qualitative synthesis n equals 71.
Finally, a vertical arrow points to the bottom-most box labeled Studies included in quantitative synthesis meta-analysis n equals 71.
3.1. Developmental change
Due to the high overall heterogeneity, we investigated the influence of the developmental changes in the magnitude of the shape bias by adding age as a factor. Model selection followed our pre-registered strategy of comparing four types of functional forms in our multi-level model: constant, linear, logarithmic, and quadratic, using the corrected Akaike information criterion AICc. A difference of
$ {\Delta}_{\mathrm{AIC}}>4 $
 between the lowest AICc and any other AICc was interpreted as a meaningful difference (Burnham & Anderson, Reference Burnham and Anderson2004; Burnham & Anderson, Reference Burnham and Anderson2013).
All models including age did not fit significantly different than the model without age, and did not meet our pre-registered criteria (
$ {\Delta}_{\mathrm{AIC}} $
 between −0.39 for linear and −2.90 for polynomial) to justify model’s complexity. So, we adopted a constant function for our subsequent analysis with a significant overall estimate of 0.60 (
$ p $
between −0.39 for linear and −2.90 for polynomial) to justify model’s complexity. So, we adopted a constant function for our subsequent analysis with a significant overall estimate of 0.60 (
$ p $
 ≤ .001) and a heterogeneity of (
$ {I}^2=0.95 $
≤ .001) and a heterogeneity of (
$ {I}^2=0.95 $
 ).
).
3.2. Cross-linguistic differences
Based on the previous literature, we hypothesized that language and culture would be potential moderators influencing the degree of shape-based generalization. However, due to limited data availability beyond English, conducting language-specific analyses was not feasible. As a consequence, languages were categorized into two groups: Indo-European (encompassing German, Spanish, and English) and non-Indo-European (including Japanese, Mandarin, Vietnamese, Korean, and Tsimane). We acknowledge that this grouping is not ideal, as it might overlook some linguistic and cultural diversity, for example, Japanese and Tsimane being in the same group despite the vast cultural and environmental differences. However, the set of languages represented in the available studies is too limited and heterogeneous to support other types of theoretically informative categorization. Thus, we use this IE versus non-IE grouping strictly as a pragmatic proxy to compare English with studies conducted in other linguistic communities.
A model incorporating language group as a moderator revealed a significant coefficient of
$ \beta = $
 0.63 (
$ p $
0.63 (
$ p $
 ≤ .001) for Indo-European populations. The effect was negative but not significantly so for the non-Indo-European group:
$ \beta = $
≤ .001) for Indo-European populations. The effect was negative but not significantly so for the non-Indo-European group:
$ \beta = $
 −0.23 (
$ p= $
−0.23 (
$ p= $
 .112). Between-study heterogeneity remained high in this moderated model (
$ {I}^2=0.95 $
.112). Between-study heterogeneity remained high in this moderated model (
$ {I}^2=0.95 $
 ), with most of the variance at the between-paper level (
$ sigm{a}^2 $
), with most of the variance at the between-paper level (
$ sigm{a}^2 $
 = 0.52). All coefficients are shown in Table 1, and Figure 3 shows model fit compared with individual effect size estimates.
Results of the meta-regression model incorporating both language and age (in months)

Table 1. Long description
The table consists of seven columns and three rows including the header.
Columns from left to right are: Variable, beta, S E, z, p, lower C I, and upper C I.
Row 1 (Header): The headers are beta, S E, z, p, lower C I, and upper C I.
Row 2 (Intercept): beta is 0.63, S E is 0.1, z is 6.13, p is less than .0001, lower C I is 0.43, and upper C I is 0.83.
Row 3 (Non-Indo-European): beta is minus 0.23, S E is 0.14, z is minus 1.59, p is 0.11, lower C I is minus 0.51, and upper C I is 0.005.
A footnote specifies that Non-I E equals Non-Indo-European.
Two-panel scatter plot comparing standardized mean difference against mean age in months for Indo-European and Non-Indo-European languages.

Figure 3. Long description
The scatter plots share a common Y-axis labeled Standardized Mean Difference d ranging from negative 4 to 4 and a common X-axis labeled Mean age open parenthesis months close parenthesis ranging from 20 to 80. A horizontal dotted line marks the zero point on the Y-axis and a solid black horizontal line represents the mean effect size in each panel.
Panel 1 (Left): Titled Indo-European. This panel is densely populated with data points primarily from English (red), with occasional points for German (gold) and Spanish (blue). The points are concentrated between ages 20 and 60. Most points fall between negative 2 and positive 2 on the Y-axis, with the solid mean line positioned slightly above zero at approximately 0.6.
Panel 2 (Right): Titled Non-Indo-European. This panel is more sparsely populated. It includes data for Hebrew (olive), Japanese (green), Korean (teal), Mandarin (light blue), Tsimane (purple), and Vietnamese (pink). The points are spread across the age range of 30 to 80. The solid mean line is positioned slightly lower than the first panel, at approximately 0.4.
Legend: Located at the bottom, it identifies ten languages by color-coded dots with vertical error bars: english (red), german (gold), hebrew (olive), japanese (green), korean (teal), mandarin (light blue), spanish (blue), tsimane (purple), vietnamese (pink), and an unlabeled tenth category.
The pioneering cross-linguistic work on the shape bias has been instrumental in shaping the field’s theories, particularly by showing that the patterns observed in English are not always universal. At the same time, our systematic search revealed that the literature as a whole has not yet achieved the breadth needed for a large-scale quantitative comparison across many languages. The significant imbalance in the data, with a predominance of studies on English, meant we were underpowered to conduct a fine-grained cross-linguistic analysis. Our findings should therefore not be taken as evidence against cross-linguistic differences, but rather as a call to build upon the foundational non-English studies included in our review. Expanding this research to a wider and more diverse range of languages and cultures is a critical next step for the field.
3.3. Shape and complexity effects
We also hypothesized that the complexity of solid objects might moderate shape bias. However, only five papers with 24 effect sizes in our sample reported complexity as a dimension of interest and explicitly classified objects along this dimension. Thus, assessing the impact of object complexity was impractical due to sparse data, variations in stimulus types across studies, along with unclear criteria for categorizing objects as complex or simple, posing challenges for a comprehensive analysis.
Early studies examining the role of object properties like complexity and function were groundbreaking and opened up important theoretical avenues for a mechanistic explanation of shape-bias behaviour. Our meta-analysis affirms the continued importance of this topic and highlights the rich and varied ways this construct has been operationalized in the literature, often being intertwined with functionality, a collective challenge the field has faced.
3.4. Syntactic effects
Finally, we hypothesized that the use of count/mass noun syntax marking would moderate the extent of the shape bias in younger ages. A model that incorporated the nature of syntactic marking (informative or neutral) indicated no significant effect of the presence of informative syntax (
$ p= $
 .398). The majority of studies in our sample used informative syntax, with 136 of 435 effect sizes using neutral syntax. Thus, we next fit a model with only the subset of the data that used informative syntax, comparing count to mass syntax. Although mass syntax had a negative coefficient (
$ \beta = $
.398). The majority of studies in our sample used informative syntax, with 136 of 435 effect sizes using neutral syntax. Thus, we next fit a model with only the subset of the data that used informative syntax, comparing count to mass syntax. Although mass syntax had a negative coefficient (
$ \beta = $
 −0.73), this model did not yield a significant effect of count versus mass (
$ p= $
−0.73), this model did not yield a significant effect of count versus mass (
$ p= $
 .090).
Syntactic bootstrapping theories have provided an influential framework for understanding how grammatical cues might support word learning. Our meta-analysis contributes to this conversation by examining the effect of informative count and mass noun syntax across dozens of studies. Despite the statistical non-significance, interpretation of this result is not straightforward given that even this subset of experiments that compared count and mass syntax still carried over the general imbalance in the data. If this manipulation was predominantly used with English speaking children, and only 11.72% of our data came from younger than 2 years old children (with the assumption that this age group could be the least sensitive to syntax), then previous exposure to this syntactic distinction may have influenced the results. Additionally, the result – a non-significant effect of syntactic marking – suggests that the influence of these cues, when aggregated, may be more nuanced than previously understood, which raises a question for future research: under what specific conditions are syntactic cues most influential, and how do they interact with the host of other factors present in a word-learning task? Our work suggests this is a fruitful area for further investigation.
3.5. Publication bias
One potential source of bias in meta-analysis comes from publication bias, the tendency for positive findings (e.g., effects that are significant at
$ p<.05 $
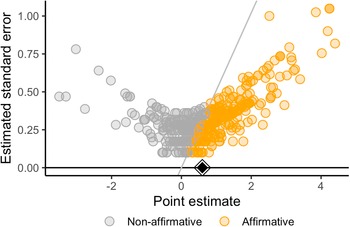
 ) to be included in papers both submitted and accepted for publication at higher rates than findings in which the authors’ key findings are not significant. We evaluated publication bias using two standard meta-analytic diagnostics. We first created a significance funnel plot (depicted in Figure 4) following Mathur and VanderWeele (Reference Mathur and VanderWeele2020) to visualize the relationship between effect size and sampling variance. This type of plot highlights positive selection biases by allowing inspection of whether there is a relationship between the effect size of studies and their standard error. This plot showed more positive studies with large standard errors than negative studies, consistent with a publication bias in which noisy studies with positive effects are more likely to appear in the literature. We also complemented the visual inspection by employing an Egger’s regression test as a quantitative measure of asymmetry within the funnel plot. The results yielded a statistically significant positive intercept and slope (
$ \beta 0= $
) to be included in papers both submitted and accepted for publication at higher rates than findings in which the authors’ key findings are not significant. We evaluated publication bias using two standard meta-analytic diagnostics. We first created a significance funnel plot (depicted in Figure 4) following Mathur and VanderWeele (Reference Mathur and VanderWeele2020) to visualize the relationship between effect size and sampling variance. This type of plot highlights positive selection biases by allowing inspection of whether there is a relationship between the effect size of studies and their standard error. This plot showed more positive studies with large standard errors than negative studies, consistent with a publication bias in which noisy studies with positive effects are more likely to appear in the literature. We also complemented the visual inspection by employing an Egger’s regression test as a quantitative measure of asymmetry within the funnel plot. The results yielded a statistically significant positive intercept and slope (
$ \beta 0= $
 4.24,
$ \beta 1= $
4.24,
$ \beta 1= $
 0.11,
$ p<0.0001 $
0.11,
$ p<0.0001 $
 ), suggesting that smaller studies tend to report larger effects and affirming the presence of asymmetry. However, these diagnostics are not definitive proof of publication bias, as other factors such as true heterogeneity among studies or methodological differences can also lead to similar patterns. Therefore, while our findings suggest the possibility of publication bias, they should be interpreted with caution.
A scatter plot showing the relationship between point estimates and estimated standard errors, categorized by affirmative and non-affirmative results.

Figure 4. Long description
The X axis is labeled Point estimate and ranges from negative 4 to 4. The Y axis is labeled Estimated standard error and ranges from 0.00 to 1.00.
Data points are represented by semi-transparent circles. Gray circles represent Non-affirmative results and orange circles represent Affirmative results.
* Non-affirmative results (gray) are concentrated between point estimates of negative 2 and 0.5, with standard errors mostly below 0.50. A small cluster of outliers exists at negative 3 with higher standard errors.
* Affirmative results (orange) show a strong positive linear correlation, starting from a point estimate of approximately 0.5 and extending to 4. As the point estimate increases, the estimated standard error also increases linearly.
A diagonal gray line originates near the 0 point on the X axis and extends upward to the right, cutting through the orange data cluster.
At the bottom of the plot, a horizontal black bar contains a white diamond marker centered at a point estimate of approximately 0.6. A legend at the very bottom identifies the gray circles as Non-affirmative and the orange circles as Affirmative.
4. Discussion
In this article, we were interested in taking stock of evidence for the shape bias, as well as quantifying its variation across cultures, ages, and experimental conditions. Synthesizing effect sizes across studies provided evidence of a positive pooled shape-bias estimate across nearly all ages and languages studied. However, the synthesis also revealed no significant cross-linguistic/cultural differences, and substantial between-study heterogeneity. The preponderance of large effect sizes from small studies in our data suggests there may be a bias to publish effects favouring the existence of a shape bias. While our study definitively supports the presence of a shape bias across many populations and ages, drawing further conclusions given this empirical picture is challenging. Nevertheless, next we discuss our findings in the context of theoretical accounts of the shape bias.
First, we were interested in age-related variation. We are hesitant to over-interpret developmental trends given the heterogeneity we observed, but a constant model provided the best fit to the full dataset, suggesting a relatively stable shape bias across the tested ages (min = 14, max = 79.92-month-old). This result presents a more complex picture than the positive, linear developmental change that is often implicitly assumed in the literature, adding a new layer of nuance to theories that emphasize the statistical learning of regularities in the input as a source of the bias. It is important to interpret this finding in the context of the literature as a whole. As noted by Cao et al. (Reference Cao, Lewis, Tsuji, Bergmann, Cristia and Frank2024), aggregated developmental data can be influenced by factors such as age-specific task calibrations or a bias towards publishing inflated effect sizes from younger children, which makes it challenging to isolate a pure developmental signal. The specifics of procedure and stimuli may exert a strong influence over the outcome of the studies (Cimpian & Markman, Reference Cimpian and Markman2005; Imai & Gentner, Reference Imai and Gentner1997; Samuelson & Horst, Reference Samuelson and Horst2007). For instance, some studies use novel objects with novel labels, while others use familiar objects with novel labels; both make claims about early label-based category induction with different age groups. Thus, while individual studies have been essential in mapping parts of the developmental story, our synthesis suggests at least that – when viewed collectively – the developmental trend is less pronounced than the variability between study procedures.
Second, we were interested in understanding cross-linguistic and cross-cultural differences in the shape bias. Statistical generalization theories of shape bias have two proposed (not mutually exclusive) sources of this generalization: lexical statistics and environmental regularities. Lexical statistics studies tend to focus on early English vocabulary, while the primary investigation of environmental regularities compared the United States and Tsimane groups in Bolivia. Direct examination of these statistical regularities hypotheses in the current meta-analysis was impeded, however, by limited data availability on the lexical statistics, early vocabulary composition, and the distribution of shape-based objects in other communities and languages. The number of studies reporting vocabulary size (corresponding to N = 38 effect sizes) was too small to be included in the analysis. Additionally, the interchangeable nature of language and location variables in our dataset (e.g., English predominantly corresponds to the United States, and Japanese to Japan), as well as the potential role of syntax in forming associations, made it challenging to differentiate the influence of these various factors in our data (Barner et al., Reference Barner, Inagaki and Li2009; Gershkoff-Stowe & Smith, Reference Gershkoff-Stowe and Smith2004b; Imai & Gentner, Reference Imai and Gentner1997; Jara-Ettinger et al., Reference Jara-Ettinger, Levy, Sakel, Huanca and Gibson2022; Samuelson & Smith, Reference Samuelson and Smith1999).
We were additionally interested in examining effects of object complexity and of syntax. Unfortunately, neither of these variables was well represented enough in the dataset to warrant inclusion in our analyses. Further work interested in these characteristics would likely need to collect new data, ideally across a wide range of ages and – in the case of syntax – across several languages that vary in mass/count marking.
In addition, the presence of a publication bias has significant implications for adjudicating between theoretical accounts of the shape bias. For example, theories that critically rely on experiments reporting the importance of specific moderators (e.g., the effect of informative syntax or object complexity) may be challenging to interpret, considering the presence of publication bias in the literature. Small, underpowered studies designed to test these moderators may only be published if they find significant effects. This practice would obscure true null findings and create a literature that makes it difficult to disentangle procedural artefacts from genuine theoretical constraints. Our results are only suggestive of this possibility, however. Because the shape-bias literature encompasses multiple paradigms that differ in sample sizes, stimuli, and coding practices, classical publication-bias tests cannot isolate selective reporting from genuine methodological heterogeneity.
In sum, the current meta-analysis provides the first quantitative synthesis of the shape-bias literature. Our pooled effect size estimate enables evidence-based power calculations for future studies; further, our literature search clearly identifies gaps in the literature. Our study also sheds light on challenges in using the empirical data to adjudicate between theories of the shape bias. We found that many studies used different types of stimuli, tasks, and measures, making it challenging to identify the potentially relevant factors and their interactions over different contexts within the same population, let alone across different populations. We also acknowledge that very high heterogeneity and inconsistent reporting constrain some inferences (e.g., fine-grained cross-linguistic moderators). Rather than being a flaw in our approach, quantifying heterogeneity and revealing reporting gaps is itself part of our contribution: it turns the field’s known concerns into measurable targets for improvement (e.g., harmonized stimuli, consistent definition, standardized reporting of vocabulary/syntax). Cumulative progress on the theoretical questions behind the shape bias may require standardized materials, shared corpora/stimulus sets, pre-registered multi-site designs, and coordinated reporting of key procedural variables to better explain this important aspect of early word learning.
Acknowledgements
We are grateful to the editor and reviewers for their careful engagement with this manuscript across three rounds of review. This study was pre-registered at http://tinyurl.com/shapebias. The coded effect-size dataset, analysis code, and manuscript source are publicly available. No part of the study procedures or analyses was pre-registered prior to the research being conducted except as noted in the pre-registration.
Author contribution
Samah Abdelrahim: conceptualization, writing – original draft preparation, writing – review and editing; Michael C. Frank: writing – review and editing, supervision.
Funding statement
The authors received no specific funding for this work.
Competing interests
The authors declare no competing interests.




 Open access

