

1. Introduction
Recent years have seen an accumulating number of studies which explore the linguistic relevance of educational and occupational transitional periods in a speaker’s life (e.g. onset of schooling, entry into the workforce) (e.g. De Decker Reference De Decker2006, Wagner Reference Wagner2008, Prichard & Tamminga Reference Prichard and Tamminga2012, Wagner Reference Wagner2012b, Riverin-Coutlée & Harrington Reference Riverin-Coutlée and Harrington2022). The idea here is that such ontogenetically relatively stable watersheds (i.e. events occurring at similar times between individuals throughout lifespan development, such as the onset of schooling) may “result in regular cyclical intraspeaker variability” (Buchstaller Reference Buchstaller2015:485; see also Chambers Reference Chambers2008). What have been systematically skirted, however, are analyses of significant inflection points in the life course that are “less straightforward to pin down and more individualistic in nature” (Buchstaller Reference Buchstaller2015:485), such as individual mobility, family planning, and changes in social networks. Granted, there is a wealth of literature attesting the substantial effects of geographic mobility (e.g. Kwon Reference Kwon2018, Beaman Reference Beaman, Ziegler, Edler and Oberdorfer2021, Steiner et al. Reference Steiner, Jeszenszky and Leemann2023b), social network structures (e.g. Lippi-Green Reference Lippi-Green1989, Milroy & Milroy Reference Milroy and Milroy1992, Labov Reference Labov2001, Vergeiner et al. Reference Vergeiner, Luttenberger, Bülow, Wallner and Britain2023), and parent and caregiver roles (e.g. Smith et al. Reference Smith, Durham and Fortune2007, Smith & Durham Reference Smith and Durham2019) on patterns of variation and change. The caveat, however, is that these studies have not taken a life-events perspective in order to investigate how changes in such life circumstances impact on individual-level shifts in linguistic behavior. For example, how does the individual experience of mobility, a new relationship, parenthood, etc. at a specific timepoint in a speaker’s life affect (differential or interindividually similar patterns of) linguistic change?
In this study, we thus scrutinize the linguistic relevance of major life events (MLEs) in the personal domain. MLEs, according to Bühler et al. (Reference Bühler, Orth, Bleidorn, Weber, Kretzschmar, Scheling and Hopwood2023:2), are defined as “time-specific transitions that indicate a new status (i.e. position, rank, role, condition) or denote the end of a previous status” (see also Bühler et al. Reference Bühler, Mund, Neyer and Wrzus2024), such as relocation, a new friendship, romantic relationship, marriage, parenthood, and grandparenthood. From the psychology literature we know that significant life events such as these often trigger behavioral, cognitive, and affective shifts in an individual (e.g. Bleidorn et al. Reference Bleidorn, Hopwood and Lucas2018), and they may therefore also yield consequences for the sociolinguistic repertoire (e.g. Eckert Reference Eckert and Coulmas1997, Buchstaller Reference Buchstaller2015). That said, the process of traversing adulthood and an individual’s life experiences along this journey are “individualized, accumulative and unequal” (Pichler et al. Reference Pichler, Wagner and Hesson2018:3), and different facets of aging will affect individuals and their linguistic behavior at different times, in different ways, and to different degrees (see also Bülow & Vergeiner Reference Bülow and Vergeiner2021, Pfenninger et al. Reference Pfenninger, Festman and Singleton2023). Naturally, this raises the question concerning “when … change happens, why it happens, [and] to whom it happens” (MacKenzie Reference MacKenzie2017:1).
This article aims to advance our understanding of the impact of life-course transitions in the personal domain on patterns of self-reported linguistic change, with an emphasis on how individual differences are connected to differential patterns of MLE-related changes in the sociolinguistic repertoire. Specifically, our main goals are (a) to find out which quantitatively captured individual differences in event experiences and (psycho)social factors affect self-reported MLE-related linguistic change, and (b) to investigate the contextual reasons for this change, that is, participants’ beliefs about why personal MLEs have influenced their linguistic repertoires, and how these beliefs vary among individuals.
We focus in this contribution on retrospective perceptions (i.e. self-reports) of MLE-related change in participants’ use of language varieties (i.e. cross-contextual use of standard German and dialectFootnote 1 ), and in affective-attitudinal factors (personal dialect accommodation, dialect identity, attitudes towards standard German). Importantly, while individuals’ perceptions of change cannot be conclusively linked to actual change in language use and attitudes, there are two main reasons why intuitions about MLE-related shifts in the linguistic repertoire nonetheless make a substantial contribution to variationist sociolinguistics: (i) Meaning-making takes place over time, just as (socio)linguistic development does, and so understanding the effect(s) of a past event on subsequent linguistic change can effectively be done retrospectively, “allowing participants time to integrate event-related changes into their self-perception,” as life-event researchers in psychology have argued (Schwaba et al. Reference Schwaba, Denissen, Luhmann, Hopwood and Bleidorn2023:1153). Of course, self-reports are no substitute for longitudinally measured change, but they can be regarded as an informative precursor to real-time studies: (ii) As outlined in section 2.2, there is a wealth of literature hypothesizing the influence of a variety of significant life events, but it is to date unclear which MLEs (especially in the personal domain) may have the most prominent impact on patterns of linguistic change in the individual. Shedding light on such real-time MLE-related linguistic change inherently requires longitudinal data, which is a (time-)costly endeavor. Studies like this which focus on retrospective perceptions of change can inform future real-time investigations by marshalling relatively large sample sizes comparatively quickly in order to narrow down (a) which MLEs may have a particularly prominent influence on lifespan linguistic change, (b) in which areas (e.g. language use, language attitudes) real-time change may be expected to occur, and (c) which aspects of life events (e.g. event-induced changes in social networks or in communicative requirements) may relate to individual-level linguistic change.
Results presented here focusing on personal life-course transitions should be considered in conjunction with the analyses of the full dataset presented in Wirtz & Pickl (Reference Wirtz and Pickl2025), in which the goal was to investigate the interindividual effects of, rather than the individual differences in, occupational, educational, and personal MLEs on perceived changes in the linguistic repertoire.
The structure of the article is as follows: In section 2, we outline the sociolinguistic context of the study and discuss the linguistic relevance of MLEs. Following the description of the methods in section 3, the results are presented in section 4. We conclude with a discussion of our results and their broader implications in sections 5 and 6, respectively.
2. Background: sociolinguistic variation and lifespan linguistic development
2.1. Sociolinguistic variation in Austria
Austria houses the Bavarian and Alemannic dialect regions (Wiesinger Reference Wiesinger, Besch, Knoop, Putschke and Ernst Wiegand1983). Whereas the latter is in the geographic minority (i.e. in Vorarlberg and a few Tyrolean villages), Bavarian dialects are prevalent throughout the rest of Austria. Structurally, Alemannic and Bavarian dialects diverge from standard German at the level of phonology, (morpho)syntax, and lexis. Sociolinguistically, the use of Bavarian and Alemannic dialects depends on both macro-sociological and micro-situational factors such as age, gender, (in)formality, subject matter knowledge, interlocutor, and so forth (Ender & Kaiser Reference Ender and Kaiser2009). At the attitudinal level, perception studies suggest that Austrians tend to have particularly positive attitudes towards dialect varieties. For example, Bavarian varieties are associated with social attractiveness (e.g. more natural, honest, emotional), whereas standard German varieties are judged more favorably on measures of competence and status (Soukup Reference Soukup2009, Bellamy Reference Bellamy2012). The few panel studies addressing lifespan linguistic change among Austrian speakers (conducted in the Austro-Bavarian context) suggest increased dialect usage in later life despite overall dialect loss in the Bavarian-speaking parts of Austria (i.e. retrograde change), but remarkable stability in terms of language attitudes (Bülow & Vergeiner Reference Bülow and Vergeiner2021, Vergeiner et al. Reference Vergeiner, Wallner, Bülow, Scheutz, Christen, Ganswindt, Herrgen and Erich Schmidt2021, Bülow et al. forthcoming).
2.2. Major life events as drivers for individual lifespan linguistic change
Eckert (Reference Eckert and Coulmas1997:157) claims that “life is about change” and thus “development is lifelong.” This reflects the idea that speakers’ linguistic repertoires remain malleable for change across the whole of life, but the question remains: What drives this change? Buchstaller (Reference Buchstaller2015:485) maintains that intraspeaker variability across the lifespan is a reaction to the “life-stage specific demands regarding demeanor and language use that we encounter as we progress through our life histories.” In other words, the kind and degree of linguistic malleability across the life course is shaped by an individual’s lived experiences (e.g. Pfenninger et al. Reference Pfenninger, Festman and Singleton2023). From this, it follows that changes in family status, social networks, place of residence, community participation, and engagement in the marketplace are bound to have implications for patterns of variation (e.g. Eckert Reference Eckert and Coulmas1997, Bowie Reference Bowie, Duszak and Okulska2010, Bowie & Yaeger-Dror Reference Bowie, Yaeger-Dror, Honeybone and Salmons2015). This necessitates approaches tailored to capturing the individuality inherent to the individual timepoints and rationales for linguistic change across the lifespan (e.g. Eckert Reference Eckert and Coulmas1997, Wagner Reference Wagner2012a, Bowie & Yaeger-Dror Reference Bowie, Yaeger-Dror, Honeybone and Salmons2015, Buchstaller Reference Buchstaller2015, Riverin-Coutlée & Harrington Reference Riverin-Coutlée and Harrington2022), such as “targeted studies of critical turning points in the life course” (Wagner Reference Wagner2012b:197) in the form of significant life events.
Indeed, recent years have seen an uptake in investigations of critical turning points in the life course. The transition from high school to college, for instance, has been found to be an important MLE for a speaker’s adherence to or avoidance of local vernacular forms (e.g. De Decker Reference De Decker2006, Wagner Reference Wagner2008, Prichard & Tamminga Reference Prichard and Tamminga2012, Wagner Reference Wagner2012b). Similarly, entry into the workforce and the associated standardization pressures are assumed to induce “retrenchment” (Chambers Reference Chambers2008:190) towards standard language (e.g. Labov Reference Labov1966, Wolfram Reference Wolfram1969, Trudgill Reference Trudgill1974, Macaulay Reference Macaulay1977, Sankoff & Laberge Reference Sankoff, Laberge and Sankoff1978), whereas the disengagement from the standard language-expectant workplace upon retirement is conversely thought to coincide with a speaker’s revival of vernacularity (e.g. Downes Reference Downes1998, Mechler & Buchstaller Reference Mechler and Buchstaller2019, Bülow & Vergeiner Reference Bülow and Vergeiner2021, Vergeiner et al. Reference Vergeiner, Wallner, Bülow, Scheutz, Christen, Ganswindt, Herrgen and Erich Schmidt2021).
Arguably, many of the aforementioned educational and occupational watersheds are “ontogenetically relatively stable” (Buchstaller Reference Buchstaller2015:485) and may thus motivate patterns of linguistic change which “recur at a particular age in successive generations” (Chambers Reference Chambers2008:188). Other significant inflection points in the life course are less straightforward to pin down and more individualistic in nature – most notably significant life events in the personal domain. In fact, we know from the psychology literature that the effects of personal MLEs on personality trait development are subject to much more substantial variability than are the effects of work-related MLEs (e.g. Bühler et al. Reference Bühler, Orth, Bleidorn, Weber, Kretzschmar, Scheling and Hopwood2023), owing to the drastic differences in the kind of demands personal MLEs place on individuals compared to life events in the work domain. Perhaps for this reason, among others, the effects of life-course transitions in the personal domain remain yet comparatively understudied in terms of their relevance for lifespan linguistic change.
There is no lack of a theoretical foundation that personal MLEs may motivate linguistic instability throughout the life course, however:
-
For example, empirical investigations on the effects of geographic (and also social) mobility (e.g. Beaman Reference Beaman, Ziegler, Edler and Oberdorfer2021, Steiner et al. Reference Steiner, Jeszenszky and Leemann2023b) and studies from the field of second dialect acquisition (see, e.g., Kwon Reference Kwon2018) promote the idea that the MLE relocation (i.e. residential mobility) can be a crucial driver both for processes of dialect retention and dialect attrition. This suggests that the MLE relocation may motivate linguistic instability in the post-adolescent years (see also Bowie Reference Bowie, Duszak and Okulska2010, Sankoff Reference Sankoff2018).
-
As concerns the MLE parenthood, research on child-directed speech has found that parents, and mothers in particular, reduce the frequency of nonstandard variants when speaking to their children, especially in order to encourage the use of variants that carry supraregional prestigious currency (e.g. Smith et al. Reference Smith, Durham and Fortune2007, Smith & Durham Reference Smith and Durham2019). In light of these standardization forces, entry into parenthood may feasibly motivate intraspeaker instability and coincide with, for example, a reduction in vernacular variants.
-
In their case study of a migrant (Mr. V), Auer et al. (Reference Auer, Barden, Großkopf and Mattheier2000) demonstrated the relationship between shifts in network structures and linguistic change. Upon becoming disabled after an operation and having to retire, Mr. V’s local networks underwent a fundamental shift, consequently affecting both his attitudes towards and use of the local vernacular. Indeed, decades of sociolinguistic research have shown that the density of local social network structures is critical as concerns the diffusion of linguistic features (e.g. Lippi-Green Reference Lippi-Green1989, Milroy & Milroy Reference Milroy and Milroy1992, Labov Reference Labov2001, Vergeiner et al. Reference Vergeiner, Luttenberger, Bülow, Wallner and Britain2023). From this, it follows that new and diversified social networks and the resultant intensive exposure to both the language use and language attitudes of select individuals in the course of new friendships, partnerships, and/or marriage may be a source for linguistic plasticity across the lifespan. Relatedly, older adults’ increased contact with new generations upon transferring to the role of grandparents may contribute to shifts in linguistic habits (e.g. Pfenninger et al. Reference Pfenninger, Festman and Singleton2023).
2.3. Event-related and (psycho)social individual differences
With a view towards individual differences in lifespan linguistic change, it has been suggested that the degree and directionality of post-adolescent development is dependent on speakers’ individualized educational and professional trajectories and thus on the standardization pressures that result from their individual life choices (Sankoff & Laberge Reference Sankoff, Laberge and Sankoff1978, Sankoff & Blondeau Reference Sankoff and Blondeau2007). For example, Wagner’s (Reference Wagner2008) panel study in Philadelphia highlighted that especially upper-class individuals with new college networks registered a significant reduction in their use of nonstandard variants, at least as concerns communally stable variables such as (ing). This underscores the need for designs that ideally consider not only the effects of macro-sociological individual differences (e.g. gender, education, etc.) on ensuing patterns of linguistic change, but also individual differences at the level of the event (e.g. individual circumstances of the event).
As Bühler et al. (Reference Bühler, Orth, Bleidorn, Weber, Kretzschmar, Scheling and Hopwood2023:19) maintain “[i]t should not be surprising … that people do not change in the same ways … or that people may react differently to the same life event.” From this, it follows that we must account for individual differences in how events may be differentially experienced (e.g. the impact of the event on an individual’s social status, the emotional significance of the event, the degree of stressfulness associated with the event). The rationale here is that it may not necessarily be the mere occurrence of an event that induces change, but rather how the event is perceived by the individual. Similar claims have been put forth in sociolinguistics. For instance, Bowie (Reference Bowie, Duszak and Okulska2010:29) hypothesized that “a significant change in social status,” which is regarded as a consequence-focused event-related characteristic in the life-events psychology literature (Luhmann et al. Reference Luhmann, Fassbender, Alcock and Haehner2021), “might result in [linguistic, M.W.] instability.” Focusing on individual differences in event experiences thus allows us to investigate in a more nuanced way which experiential facets of a significant life event affect linguistic change.
In addition to more traditional sociolinguistic factors at the person level such as age, gender, educational attainment, proficiency in a (non)standard variety, and the like, individual differences in psychological variables may also be relevant in processes of individual-level linguistic change (see, e.g., Andresen Reference Andresen2015, Tamminga et al. Reference Tamminga, MacKenzie and Embick2016, Hundt et al. Reference Hundt, Mollin and Pfenninger2017, MacKenzie Reference MacKenzie2017, Steiner et al. Reference Steiner, Jeszenszky, Stebler and Leemann2023c). In this vein, Bowie (Reference Bowie, Duszak and Okulska2010) discussed the potential relevance of sociolinguistic “coping” processes and how differences in these may aid in explaining differences in individual-level linguistic change. He asserted that “each of us is faced with assorted social pressures that we may or may not react to in a number of different ways, for instance by altering our linguistic production” (Bowie Reference Bowie, Duszak and Okulska2010:47), and differences in lifespan linguistic change (and by extension change as a function of an MLE) may be a byproduct of how differentially individuals cope linguistically. Thus, investigating the construct psychological resilience – defined as the ability to “bounce back” and cope with stressful situations (Smith et al. Reference Smith, Dalen, Wiggins, Tooley, Christopher and Bernard2008, Chmitorz et al. Reference Chmitorz, Wenzel, Stieglitz, Kunzler, Bagusat, Helmreich, Gerlicher, Kampa, Kubiak, Kalisch, Lieb and Tüscher2018) – especially in interaction with event-related characteristics holds promise. Specifically, there is a theoretical rationale for investigating the interaction between resilience and certain event-related characteristics: Given that psychological resilience has been associated with the “successful engagement with difficult events and experiences” (Ryff & Singer Reference Ryff, Singer, Keyes, Haidt and Seligman2003:21), it seems valuable to investigate whether, after experiencing a personal MLE perceived as particularly stressful and/or negative, differences in patterns of (perceived) linguistic change among individuals with varying levels of resilience may reflect linguistic coping mechanisms.
3. This study
3.1. Research questions and research design
The present data are part of a survey study conducted in Austria which investigates the role of significant life events in self-reported patterns of linguistic change. We focus here on 309 participants who reported on life-course transitions in the personal domain (as opposed to MLEs in the occupational or educational domain, the data for which are presented elsewhere). We address the following research questions:
-
1. To what extent are event-related and (psycho)social factors associated with retrospective perceptions of linguistic change following personal life-course transitions?
-
2. How do beliefs about the influence of personal MLEs on the sociolinguistic repertoire vary among individuals with a reported MLE-related strengthened orientation towards vernacularity and towards standard language?
To answer these research questions, we employ an equal-status concurrent mixed-methods design, where the rationale was that of expansion, that is “seeking to expand the breadth and range of research by using different methods for different inquiry components” (Johnson & Onwuegbuzie Reference Burke and Onwuegbuzie2004:22). In such a mixed-methods design, we place equal weight on insights generated via quantitative and qualitative approaches. Here, the quantitative approach allows us to systematically explore sources of variation for differential patterns of reported linguistic change as a function of significant life events in the personal domain, while the qualitative data facilitate individualized insights into personal circumstances, attitudes, and idiosyncrasies that would not otherwise figure in a purely numerical analysis.
Experimental materials and data are available on OSF (https://osf.io/er7zw/).
3.2. Participants
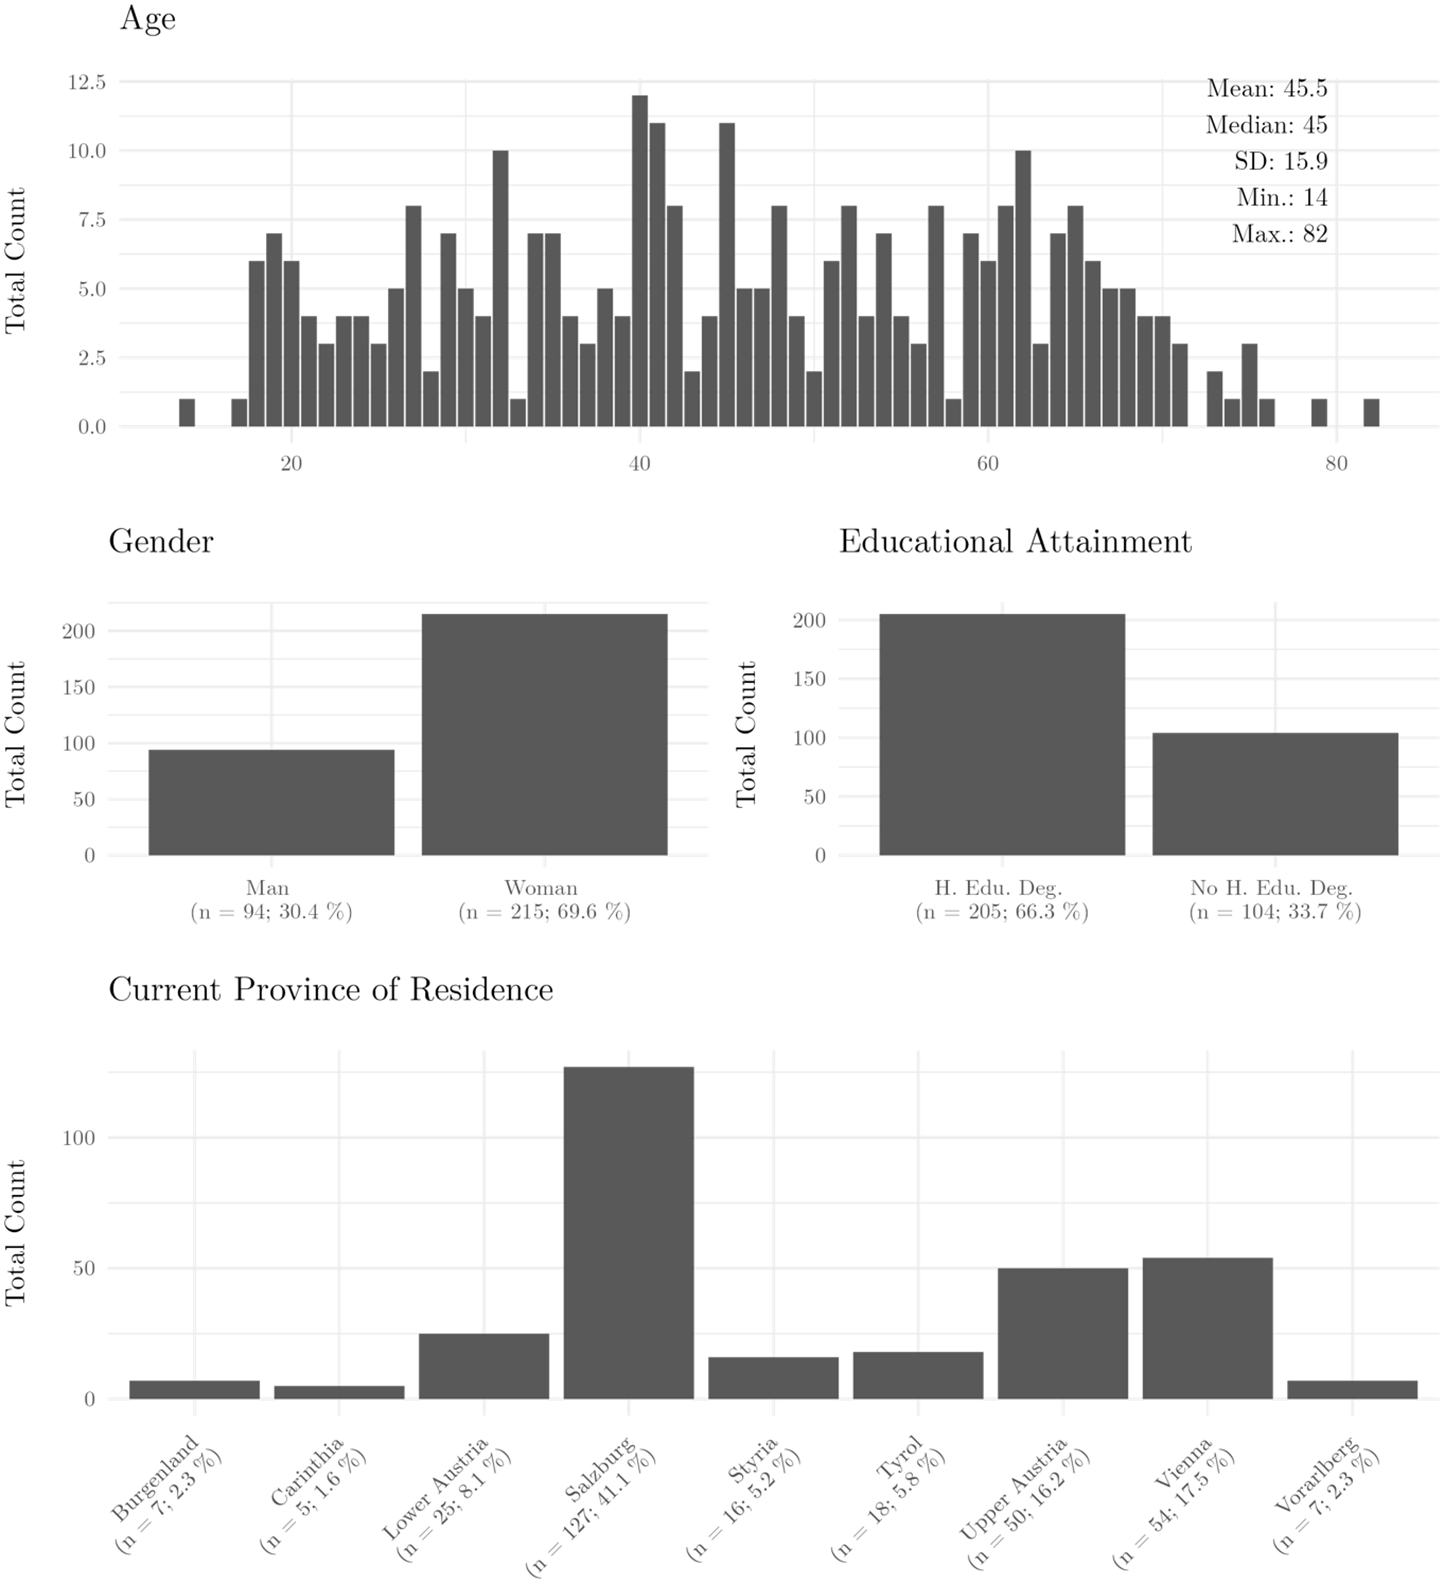
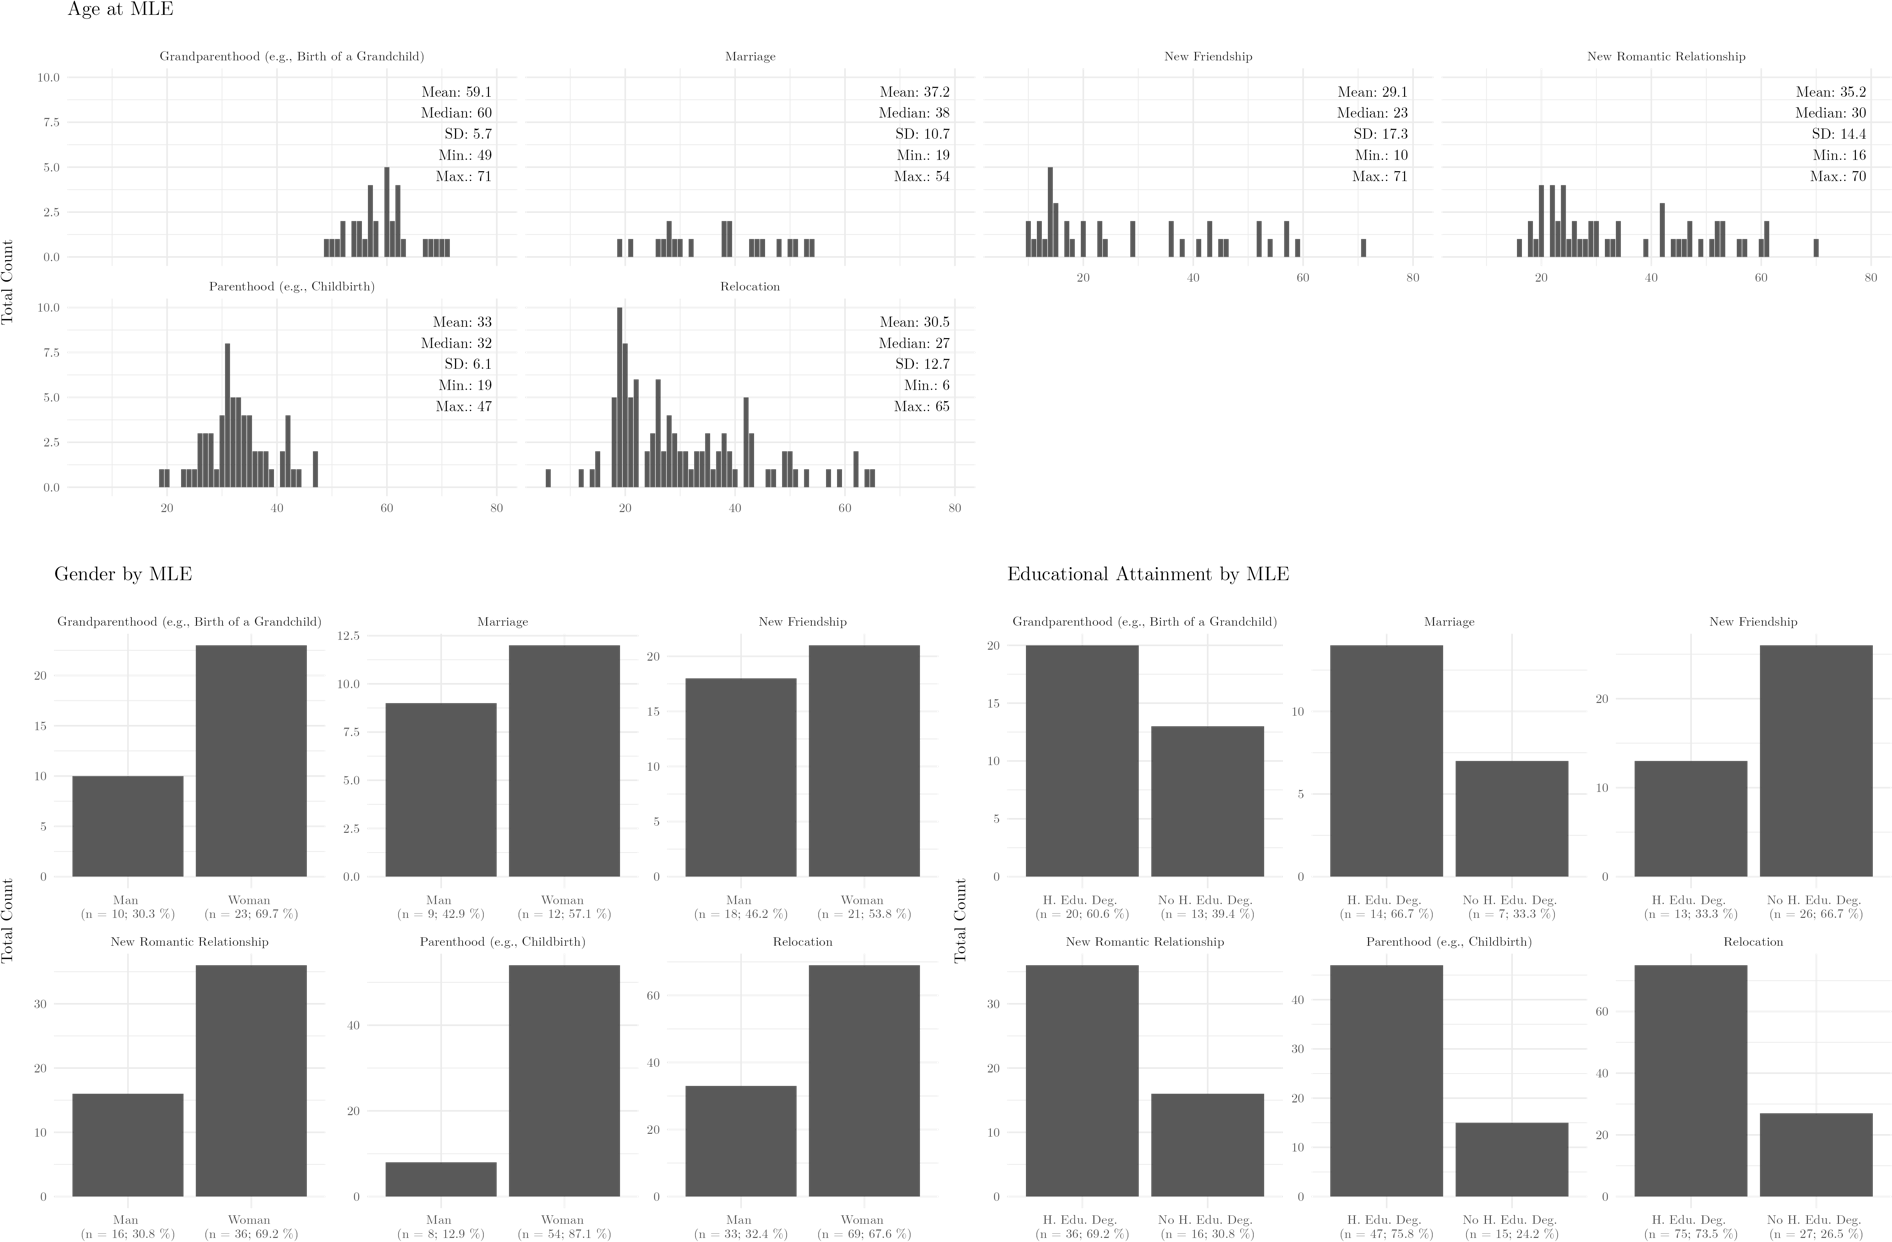
We analyze in this study a subsample of the participants from Wirtz & Pickl (Reference Wirtz and Pickl2025), namely those who reported on one of the following significant life events in the personal domain: “relocation,” “new friendship,” “new romantic relationship,” “marriage,” “parenthood,” and “grandparenthood.” We excluded participants from the full sample who (a) did not report on one of the aforementioned personal MLEs and additionally (b) two gender-diverse participants. The final sample size was thus 309, all of whom spoke German as a first language. Figure 1 presents the sociodemographic information for the sample, and figure 2 shows sociodemographic information disaggregated by MLE. Note that, in figure 1, participants’ current age (i.e. age at the time when they completed the survey) is illustrated, whereas in figure 2 participants’ age at the time when they experienced the respective MLE (i.e. “Age at MLE”) is shown. As is typical for convenience samples relying on crowdsourcing methods, we were unable to stratify by sociolinguistic factors, and the participant pool was thus unevenly distributed with respect to gender, age, educational attainment, and region.
Descriptive statistics of relevant sociodemographic variables.

Descriptive statistics of relevant sociodemographic variables disaggregated by MLE.

3.3. Procedure
The tasks presented in this section were administered via an online questionnaire coded in Limesurvey. Completion of the survey took approximately 10 to 20 minutes, and participants could withdraw and delete their answers at any point during the procedure.
Experiencing an MLE. Following Schwaba et al. (Reference Schwaba, Denissen, Luhmann, Hopwood and Bleidorn2023), participants were prompted to identify an MLE from a list of sixteen event categories (see the experimental material on OSF for a list of the categories) which occurred within the past maximum twenty years and, in their view, had a significant influence on their use of or attitudes towards different language varieties. The deliberate choice of this temporal window was to capture a relatively recent MLE that played a role in shaping an individual’s current sociolinguistic repertoire. Participants could also provide qualitative narratives in open-ended items about how the MLE impacted on their perceived patterns of linguistic change (however, this was not a required field in the survey).
Event-related characteristics. As discussed previously, event-related characteristics capture individual differences in event experiences, that is how events are (dis)similarly experienced between individuals. To this end, participants completed scales from Luhmann et al.’s (Reference Luhmann, Fassbender, Alcock and Haehner2021) Event Characteristics Questionnaire, which targeted characteristics of the MLE that they indicated as having affected changes in their linguistic repertoire. We collected data on the following event-related characteristics:
-
stressfulness of event (the degree of stress and anxiety individuals link to the event; higher values indicate an event was perceived as more stressful)
-
emotional significance (the extent to which the event elicited strong feelings, that is the event’s emotional impact on an individual)
-
social status changes (the extent of negative changes in an individual’s social status, higher values indicate the event negatively impacted one’s social status)
We chose these event-related characteristics since the variable use of standard German and dialect in the Austrian context has been related to differences in emotionality (e.g. Huesmann Reference Huesmann1998, Kroisenbrunner Reference Kroisenbrunner2015) and social status (e.g. Steinegger Reference Steinegger1998, Ender & Kaiser Reference Ender and Kaiser2009), and thus the extent to which an event is perceived as being associated with or inducing changes in these characteristics may correlate with perceived shifts in the sociolinguistic repertoire as well.
Responses were provided on 100-point slider scales from “does not apply at all” to “applies completely.” Cronbach’s alpha indicated acceptable internal consistency (computed on the basis of the full sample, i.e. N = 701; stressfulness of event: α = 0.85; emotional significance: α = 0.81; social status changes: α = 0.89).
Figure 3 presents the descriptive statistics of the event-related characteristics across MLEs.
Descriptive statistics of event-related characteristics disaggregated by MLE.

Reported MLE-related linguistic change. To assess participants’ retrospective perceptions of change in their sociolinguistic repertoires in relation to a specific MLE, we adapted the approach to measuring perceived change from the Life Event Study (Schwaba et al. Reference Schwaba, Denissen, Luhmann, Hopwood and Bleidorn2023). Participants were presented with a statement (e.g. “In an average week, I often use dialect with my family”) and asked to evaluate whether it became more or less applicable due to the MLE. Responses were given on a 200-point slider scale with five-point intervals (from -100 to 100) from “applies less due to the event” to “applies more due to the event,” with 0 representing no change as a result of the MLE.
The statements concerning perceived changes in cross-contextual standard German and dialect use were derived from Steiner et al.’s (Reference Steiner, Jeszenszky and Leemann2023a,b) Dialect Standard Profile. The scales measured perceived changes in participants’ cross-contextual use of standard German and dialect (e.g. with family, friends, with oneself, etc.) as a result of the MLE. Importantly, at the onset of the questionnaire, participants indicated their current status (e.g. in the workforce, student, retired), and later reported on their status both before and after the MLE (e.g. whether they were in the workforce both before and after the MLE). Context-specific items pertaining to varietal use with coworkers, university colleagues, and/or schoolmates were presented only if they were relevant for the participant’s individual circumstances (see the survey conditions in the codebook on OSF). All participants were asked about changes in their use of standard German and dialect varieties with family, friends, oneself, and while shopping. We also assessed perceived MLE-related changes regarding affective-attitudinal factors based on the items from Steiner et al. (Reference Steiner, Jeszenszky and Leemann2023b,c), which focus on perceived changes in personal dialect accommodation, pride in one’s own local dialect, and attitudes towards standard German.
The items from each of the aforementioned scales were then averaged in order to create the following five measures of perceived linguistic change (i.e. the outcome variables):
-
1. Perceived change in cross-contextual standard German usage (between four and ten items, depending on a participant’s individual circumstances)
-
2. Perceived change in cross-contextual dialect usage (between four and ten items, depending on a participant’s individual circumstances)
-
3. Perceived change in personal dialect accommodation (three items)
-
4. Perceived change in dialect identity (i.e. attitudes towards one’s dialect, such as pride in one’s own dialect) (four items)
-
5. Perceived change in attitudes towards standard German (three items)
(Psycho)social variables. To gauge participants’ proficiency in both standard German and dialect (referred to as varietal proficiency), we collected responses to four items assessing productive (speaking) and receptive (listening) language proficiency. Here, participants answered four item adaptations of “How well do you [speak/understand] [standard German/dialect]?” Responses were collected on 100-point slider scales from “not well at all” to “very well.” This variable was included in the subsequent models primarily because Austrians’ varietal proficiency has been shown to vary quite greatly (Ender & Kaiser Reference Ender and Kaiser2009), and thus it is feasible to assume that the degree of perceived MLE-related change in their cross-contextual use of or attitudes towards a certain variety may also be contingent on their proficiency in the respective variety.
Respondents also completed the German version of the Brief Resilience Scale (BRS) (Chmitorz et al. Reference Chmitorz, Wenzel, Stieglitz, Kunzler, Bagusat, Helmreich, Gerlicher, Kampa, Kubiak, Kalisch, Lieb and Tüscher2018; see also Smith et al. Reference Smith, Dalen, Wiggins, Tooley, Christopher and Bernard2008 for the original BRS). This is a six-item measure that assesses participants’ ability to “bounce back” from stress and overcome particularly negative situations, and has been shown to correlate with well-being, social support, optimism, and coping strategies (Chmitorz et al. Reference Chmitorz, Wenzel, Stieglitz, Kunzler, Bagusat, Helmreich, Gerlicher, Kampa, Kubiak, Kalisch, Lieb and Tüscher2018). Responses were provided on 100-point slider scales from “strongly disagree” to “strongly agree”. Internal consistency was acceptable (computed on the basis of the full sample, i.e. N = 701; α = 0.84).
Figure 4 presents the descriptive statistics of the (psycho)social variables across MLEs.
Descriptive statistics of (psycho)social variables disaggregated by MLE.

3.4. Data analysis
For the first research question, we ran a series of Bayesian models using the brms package (Bürkner Reference Bürkner2017) in R (R Core Team 2020). We computed an individual model for each of the five measures of self-perceived change for each MLE as a function of our set of predictor variables (i.e. a total of thirty models). By virtue of the slider scale, our response variables were bounded by −100 and 100. To prohibit the model from making predictions outside of these bounds, we truncated the model by defining the lower and upper modeling bounds as −100 and 100 respectively. The fixed effects included the event-related characteristics (three variables), psychological resilience (one variable), varietal proficiency (two variables), age at MLE (one variable), gender (contrast coded: −0.5 = men, 0.5 = women), and educational attainment (contrast coded: −0.5 = no higher education degree, 0.5 = higher education degree). We also included interactions between resilience and individual differences in event experiences relating to the degree of stressfulness of an event and negative changes in social status, in line with our previous discussion regarding the potential relationship between psychological resilience and certain event-related characteristics.
Importantly, Bayesian models generate an entire posterior distribution of plausible values for each parameter value (e.g. for the effect size of a predictor variable), where values closer to the mean in these distributions are more probable. Since model estimates are given in distributions, visualization of the model estimates is the best way to interpret the results (e.g. Garcia Reference Garcia2021), which is why we present the model estimates visually in the form of quantile dotplots and the model predictions in the form of conditional effects plots (see section 4.2 for more details).
We also defined a region of practical equivalence (ROPE) to a range of ± 0.10, which reflects “the range of parameter values that are equivalent to the null value for practical purposes” (see Kruschke Reference Kruschke2018:272). We judge there to be compelling evidence for an effect when the 95 percent highest density credible interval (HDI; essentially, the Bayesian analog to the frequentist confidence interval) does not fall within the ROPE.
Finally, because linear models can be susceptible to outliers, we computed models both with and without them (values of independent variables 2.5 standard deviations above or below the mean were classified as outliers). While we report on the models without outliers, we pay particular attention to effects that withstood both modeling procedures (the results of the analyses including the outliers are available on OSF).
The qualitative open-ended questionnaire items were subjected to an inductive qualitative analysis using MAXQDA (version: 2022; www.maxqda.com). We began by familiarizing ourselves with the data by reading each statement separately. During this process, we generated initial codes in the form of single words, short phrases, formulaic expressions, and so forth. Following, we divided participants into two groups: Those with a perceived MLE-related strengthened orientation towards vernacularity (i.e. reported increase both in cross-contextual dialect use and dialect identity) and those with a perceived MLE-related strengthened orientation towards standard language (i.e. reported increase both in cross-contextual use of standard German and attitudes towards standard language). Within these two cohorts respectively, we then searched for interactions between the codes from the first phase, focusing on identifying patterns and relationships between the coded elements. In a final phase, we collated the codes into overarching themes, and translated the relevant coded extracts from German to English.
4. Results
4.1. Descriptive overview of MLE-related linguistic change
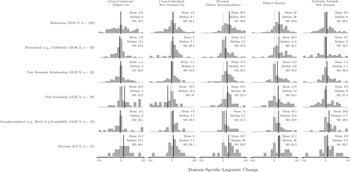
Figure 5 visualizes the descriptive statistics, that is, the interindividual patterns of perceived linguistic change as a function of the respective significant life events. Positive values indicate a positive directionality in perceived change (e.g. higher rates of dialect use, stronger dialect identity, more positive attitudes towards standard language), and negative values a negative directionality.
Descriptive overview of perceived linguistic change across MLEs.

It becomes clear that, for the most part, participants perceived that affective-attitudinal facets of the sociolinguistic repertoire were most notably influenced by MLEs, whereas they reported that their cross-contextual use of standard German and dialect remained comparatively stable (i.e. the mean trends hovered around zero).
As the grey shading visualizes, however, the within-MLE variation is considerable. This emphasizes that no single event influences all individuals in the same way. Our goal in what follows is thus to investigate what may explain some of this variance.
4.2. Quantitative individual difference predictors of perceived linguistic change
Bayesian models were specified to examine the effects of event-related characteristics alongside (psycho)social variables on patterns of perceived MLE-related linguistic change (without outliers, see OSF for the model summaries including the outliers). Recall that we place emphasis on effects which withstood both modeling procedures (i.e. with and without outliers) in order to ensure the stability of the effects. Appendix figures A1–A6 present the visual model estimates.
Conditional effects plots of background sociodemographic predictors on perceived linguistic change.
Note. We superimposed the raw data onto the conditional effects plots, with each point representing a participant. As shown in the respective captions, subfigures (a) and (b) refer to the MLE “relocation,” (c) and (d) to “parenthood,” and (e), (f), and (g) to “grandparenthood.”

Overall, the effects of the individual differences predictors were relatively infrequent, and we did not identify any overarching patterns as concerns the strength and directionality of the effects on perceived MLE-related linguistic change. The following main observations can be made on the basis of the Bayesian modeling and the corresponding visualizations:
-
1. Age at MLE, gender, and educational attainment: Participants’ age at the time of the respective MLE (i.e. “Age at MLE”) emerged as a significant predictor in both modeling procedures in five cases, following the MLEs relocation, parenthood, and grandparenthood (figures 6a–6e). Interestingly, the age effect was not consistent across MLEs, neither in terms of directionality nor as concerns the change dimension with which it correlated. For example, after a relocation, older individuals reported an increase in cross-contextual dialect use and a retreat away from standard language. Conversely, upon parenthood and grandparenthood, age-predicted differences in affective-attitudinal factors were reported. Specifically, younger parents reported an MLE-related strengthened dialect identity and increased accommodation tendencies, whereas older parents reported remaining comparatively stable. Upon grandparenthood, older individuals reported more positive attitudes towards standard language. Only one gender effect withstood both modeling procedures, which suggests that after becoming a grandparent, women reported more positive attitudes towards standard German (figure 6g). Similarly, the effect of educational attainment only remained significant in the grandparenthood model, which indicated that grandparents with no higher educational degree perceived the event to have a strengthening effect on their dialect identity (figure 7f).
Figure 7.Conditional effects plots of varietal proficiency predictors on perceived linguistic change.
Note. As shown in the respective captions, subfigures (a), (b), and (d) refer to the MLE “relocation,” (c) to “grandparenthood,” (e) to “new friendship” and (f) to “parenthood.”

-
2. Varietal proficiency: Differences in varietal proficiency as predictors of perceived MLE-related patterns of linguistic change withstood both analyses in six cases and correlated with perceived changes in affective-attitudinal variables (figures 7a–7f). For example, individuals with a more pronounced proficiency in dialect reported a strengthened dialect identity following a relocation. Additionally, proficient standard language users either reported more positive attitudes towards or otherwise reported remaining comparatively stable in terms of their attitudes towards standard German following the significant life events relocation, new friendship, and parenthood.
-
3. Psychological resilience: Psychological resilience as a simple effect withstood both analyses and emerged as a significant predictor in two cases (figures 8a and 8b). For example, upon becoming a parent, more resilient individuals did not perceive much change in their attitudes towards standard German. Conversely, more resilient individuals reporting on the linguistic relevance of a new friendship reported a strengthened dialect identity, whereas less resilient individuals did not perceive much change in this affective domain.
Figure 8.Conditional effects plots of psychological resilience on perceived linguistic change.
Note. As shown in the respective captions, subfigure (a) refers to the MLE “new friendship” and (b) to “parenthood.”
-
4. Event-related characteristics x psychological resilience: The significance of individual differences in event experiences as simple effects did not withstand both modeling procedures. However, we found three instances in which the interaction effect between MLE-induced negative changes in social status and resilience predicted differential patterns of perceived linguistic change (figures 9a–9c). Specifically, highly resilient individuals who associated either relocation or grandparenthood with negative changes in social status reported a retreat from vernacularity in favor of standard language, whereas their less resilient counterparts either reported remaining stable or reported lower rates of standard language use.
Figure 9.Conditional effects plots of the interaction effect between MLE-induced negative changes in social status and psychological resilience on perceived linguistic change.
Note. Color coding is used to represent model predictions, with blue indicating higher and red indicating lower perceived linguistic change in the respective change dimension. The contour lines connect points with identical values. As shown in the respective captions, subfigures (a) and (b) refer to the MLE “relocation” and (c) to “grandparenthood.”


4.3. Additional drivers for patterns of perceived linguistic change
As a next step, the qualitative data were inspected in order to showcase the most relevant appraisals from the participants’ point of view as concerns additional potential change-inducing variables. In other words, the open-ended responses give a richer insight of the feelings, emotions, rationales, and so forth pertaining to perceived MLE-related linguistic change that would be hard to capture numerically.
To begin, we focus on participants who evinced a perceived increase in both cross-contextual dialect use and dialect identity, indicating that their orientation to vernacularity was, in their view, substantially influenced by the experience of a significant life event.
Here, a reoccurring theme in participants’ narratives was MLE-resultant changes in social networks and event-induced contact with new and/or different dialect varieties:

Relatedly, MLE-resultant increases in the overall intensity of exposure to vernacular varieties, for example upon relocating to rural environments, seem to be a critical driver for participants’ perceived shifts towards dialectality:

What is more, we found evidence that perceptions of MLE-related increases in vernacularity may also manifest as a (more or less conscious) assertion of belonging and identity in the face of new social and/or geographic circumstances:

With respect to parenthood, it was noted that perceptions of increased dialectality may reflect a parent’s (socio)linguistic responsibilities for sensitizing their children to dialect diversity in the Austrian context, likely also as a way to foster a joint sense of (family and dialect) identity:

Finally, a perceived strengthened orientation towards vernacularity and dialect identity appears to be fostered not only through increased contact with (new) dialect varieties, as examples (1)–(5) illustrated, but importantly also to environments and relationships in which dialect usage is celebrated rather than stigmatized:

We now turn our attention to participants who reported an increase in their cross-contextual use of standard German and attitudes towards standard language, patterns which are indicative of a perceived MLE-related strengthened orientation towards standard language.
Similar to the more vernacular-oriented cohorts, a reoccurring, multifaceted theme here was the MLE-resultant changes in social networks, such as:
(a) the increased intensity of contact with individuals who engage in “sophisticated” or “precise” language use:

(b) shifts in event-induced contact with different language varieties and especially with individuals not proficient in the (same) vernacular variety, thus necessitating the supraregional standard language to ensure comprehensibility:

Event-resultant external social pressures to employ language varieties in a certain way were also a reoccurring theme, appearing most notably in relation to dialect as an undesirable form of language (especially in the midst of standardization pressures):

Finally, specific to the MLE parenthood, participants noted their (socio)linguistic responsibilities of caregiving, which include establishing and guiding the next generation in terms of how parents wish their children to be perceived in the eyes of others and how they believe their children can best excel (socio)linguistically in later life:

5. Discussion
The purpose of the current study was to evaluate how individual differences of psychosocial nature impact on both differential and interindividually similar patterns of perceived linguistic change resulting from significant life events in the personal domain (i.e. relocation, new friendship, romantic relationship, marriage, parenthood, and grandparenthood), from both a quantitative and qualitative angle. Specifically, we ask for whom personal MLEs motivate strong versus subtle perceived linguistic change, under what circumstances they may incite either interindividually similar patterns of perceived linguistic change or particularly idiosyncratic individual variation, and also why and in which direction these patterns of perceived change occur. The findings further the results from other ongoing research on the linguistic relevance of significant life phases and events (e.g. De Decker Reference De Decker2006, Wagner Reference Wagner2008, Prichard & Tamminga Reference Prichard and Tamminga2012, Wagner Reference Wagner2012b, Riverin-Coutlée & Harrington Reference Riverin-Coutlée and Harrington2022).
5.1. Research question 1: Event-related and (psycho)social individual differences
In the quantitative analysis employing Bayesian regression modeling, we did not find any overarching predictors which explained the variance in perceived linguistic change across the majority of MLEs. Rather, the significant relationships that emerged and especially the directionality thereof were highly event-specific.
Among the most notable predictors for individual differences in perceived linguistic change was age at the time of the significant life event. For example, after a relocation, above-average-aged individuals in this subsample (i.e. approximately 35 years and above) reported an increase in cross-contextual dialect use and a retreat away from the standard language, whereas the reverse was found for younger adults (i.e. below 35 years). These effects are perhaps best interpretable against the backdrop of sociological and gerontological research on life-course mobility. It has been asserted that, especially during young adulthood, engagement in residential mobility is an arguable necessity in order to accomplish developmental tasks in the education and work domains (e.g. Zimmermann & Neyer Reference Zimmermann and Neyer2013), and mobility in this life stage has moreover been linked to enhanced employment opportunities and occupational achievement (e.g. Mulder & van Ham Reference Mulder and van Ham2005). What is more, from the sociolinguistic literature we know that economically active adults are affected by the linguistic marketplace (e.g. Büchler et al. Reference Büchler, Bülow and Britain2024), which often incites a shift away from stigmatized variants due to increased exposure to formal language in the workplace (e.g. Sankoff & Laberge Reference Sankoff, Laberge and Sankoff1978, Bowie & Yaeger-Dror Reference Bowie, Yaeger-Dror, Honeybone and Salmons2015, Buchstaller Reference Buchstaller2015). Given the relationship between mobility and the linguistic market, then, it is not surprising that young(er) adults reported a retrenchment towards standard language. The perceived increase in vernacularity by adults in midlife, however, is perhaps surprising at first glance, but again, there is likely to be a multidimensionality at play here. For one, mobility research has found that midlife adults show a propensity to favor rural destinations upon residential mobility (Stockdale Reference Stockdale2011). For another, residential mobility among midlife adults is typically no longer driven by labor force considerations, but rather by family, amenity, and housing considerations (e.g. Millington Reference Millington2000). Thus, the middle-aged population may relocate in order to, for example, return to one’s home community in light of strong family ties, raise children (near family) (e.g. Schmitt-Wilson et al. Reference Schmitt-Wilson, Hanson and Mitchell Vaterlaus2019), or to take on caregiver responsibilities for relatives (Lachman Reference Lachman2015). Especially because rural areas are often associated with high rates of exposure to nonstandard varieties (e.g. Labov Reference Labov2001; for Austria, see Vergeiner et al. Reference Vergeiner, Luttenberger, Bülow, Wallner and Britain2023), and because the return to one’s home community will facilitate increased contact with an individual’s native dialect, the propensity towards rurality and/or returning to the home community upon relocation most likely explains the perceptions of increased vernacularity observed among midlife adults in our sample. This interpretation is also supported by the qualitative data (e.g. midlife adults who reported an increase in vernacularity provided statements such as “Moving from the big city back to the countryside” [P382_W_OÖ_Relocation] or “Moving to my home province” [P1234_W_OÖ_Relocation]).
We also identified a perhaps unexpected age effect upon grandparenthood suggesting that older individuals reported more positive attitudes towards standard language, whereas the younger grandparents reported remaining comparatively stable in terms of their attitudes towards the standard language. Among those who became grandparents at an older age (i.e. above the sample mean of approximately 60 years), 10/15 were retired, whereas those who became a grandparent at a below-average age reported still being in the workforce (10/11 individuals) and thus likely to be actively affected by the related standardization pressures. In this vein, it has been argued (e.g. Mechler & Buchstaller Reference Mechler and Buchstaller2019) that the exit from the workforce and disengagement from the associated standardization pressures can induce more negative attitudes towards the standard language. As our results may suggest, however, the increased contact with the younger generation through the transferring of roles to grandparenthood (see, e.g., Pfenninger et al. Reference Pfenninger, Festman and Singleton2023) and thus a more prominent contact with the dialect-leveling situation taking place in (primarily the younger generations in) Austria (e.g. Scheuringer Reference Scheuringer1990, Scheutz Reference Scheutz1985) may exert a “push” against the negative attitudes towards standard language acquired upon exit from the workforce.
Alongside age at the time of the MLE, differences in proficiency in (non)standard varieties exerted notable effects on patterns of perceived linguistic change. That said, the effect was only noticeable on perceived changes in affective-attitudinal variables such as dialect identity and attitudes towards standard language. Following life events such as relocation, new friendship, parenthood, and grandparenthood, individuals with a more pronounced proficiency in dialect reported a strengthened dialect identity, whereas proficient standard language users reported more positive attitudes towards standard German. This finding is in line with previous work on the relationship between proficiency and attitudes (e.g. Ender Reference Ender, Hundt, Kleene, Plewnia and Sauer2020), which suggests that attitudinal preferences are complexly intertwined with an individual’s affinity for and proficiency in the respective (non)standard variety. Importantly, while the regression analysis suggests a directionality of the effect (i.e. the independent variable varietal proficiency predicts perceived changes in affective-attitudinal factors), there is likely to be a multidirectionality at play here as well, in that changes in affective-attitudinal factors may also affect an individual’s use of and thus proficiency in a certain variety.
Interestingly, we also found a positive association between the simple effect psychological resilience and perceived changes in dialect identity among individuals reporting on the linguistic relevance of a new friendship. Specifically, less resilient individuals did not perceive much change whereas highly resilient individuals reported a strengthened dialect identity. At the same time, the descriptive results revealed that individuals reporting on the effects of new friendships tended to perceive an increase in dialect use, indicating a shift towards vernacularity within their peer groups and social networks (see also Ender & Kaiser Reference Ender and Kaiser2009). Recall that resilience resources involve the ability to “bounce back” from and cope with new and stressful situations, and they have also been found to correlate with personality traits such as extraversion and openness (e.g. de Holanda Coelho et al. Reference Holanda Coelho, Hanel, Cavalcanti, Rezende and Veloso Gouveia2016, Chmitorz et al. Reference Chmitorz, Wenzel, Stieglitz, Kunzler, Bagusat, Helmreich, Gerlicher, Kampa, Kubiak, Kalisch, Lieb and Tüscher2018). Since more resilient speakers may thus also be more sociable, better connected, and more open to new experiences than their less resilient counterparts, their perceived strengthened dialect identity may reflect their disposition to more readily adjust their attitudes to coincide with those of their vernacularity-oriented peer groups and social networks.
Finally, we identified several instances in which the interaction between psychological resilience and negative changes in social status withstood both analyses. Following relocation, for example, highly resilient individuals who associated the respective MLE with negative changes in social status reported a retreat from vernacularity in favor of standard language, whereas their less resilient counterparts either did not perceive much change or reported an increased use of dialect varieties. As we see it, and in line with our rationale for including interaction terms between resilience and certain event-related characteristics, the observed effects may be reflecting what Bowie (Reference Bowie, Duszak and Okulska2010) hypothesizes as sociolinguistic coping mechanisms. That is, in order to cope with the negative social consequences incurred as a result of the life event, individuals may more readily employ standard language as a means to index professionality, competence, and/or education and so increase their social standing (e.g. Soukup Reference Soukup2009, Bellamy Reference Bellamy2012). What is more, because the interaction effects were most pronounced following a relocation, the present findings also highlight the close relationship between social and geographic mobility (e.g. Beaman Reference Beaman, Ziegler, Edler and Oberdorfer2021).
5.2. Research question 2: Contextual rationales and beliefs about linguistic change
As has been argued previously (e.g. Cheshire Reference Cheshire, Ammon, Dittmar, Mattheier and Trudgill2006, Beaman Reference Beaman, Ziegler, Edler and Oberdorfer2021), it is advantageous for quantitative studies to include more qualitative analyses that consider individual experiences and life histories to augment the purely statistical findings. Here, the goal was to more closely interrogate the contextual reasons for perceived MLE-related linguistic change, that is, participants’ beliefs about why personal MLEs have influenced their linguistic repertoires, and how these beliefs vary among individuals, both within and across MLEs. To do so, we scrutinized participants who reported an MLE-related strengthened orientation towards vernacularity (i.e. increased cross-contextual dialect use and strengthened dialect identity) versus those who reported a strengthened affinity for standard language (i.e. increased cross-contextual standard German use and more positive attitudes towards standard language).
Regardless of whether speakers perceived a retrenchment towards standard language or an increase in vernacularity, MLE-resultant shifts in social networks appear relevant with respect to changes in how individuals report managing their sociolinguistic resources, and this across significant life events. By and large, this finding underscores a plethora of sociolinguistic work highlighting the relevance of social network structures for a speaker’s patterns of language behavior (e.g. Lippi-Green Reference Lippi-Green1989, Milroy & Milroy Reference Milroy and Milroy1992, Vergeiner et al. Reference Vergeiner, Luttenberger, Bülow, Wallner and Britain2023), specifically that entry into new networks and thus increased exposure to new linguistic norms can be a catalyst for intraspeaker instability (e.g. Bortoni-Ricardo Reference Bortoni-Ricardo1985). What is more, Sharma & Dodsworth (Reference Sharma and Dodsworth2020:355) argue that “networks do not affect linguistic variation simply by determining a speaker’s level of exposure to a given style of speaking; rather, any such influence is filtered through an evaluative process.” The qualitative insights readily underscore this notion, in that a perceived MLE-related strengthened orientation towards either vernacularity or standard language is dependent “at least in part on the expectations of those with whom one habitually interacts” (Gal Reference Gal1979:141), that is, on the social evaluations and attitudes of those in an individual’s environment. For example, we found that in addition to the prominent role of intensity of exposure to dialectality in new social environments, peer-group acceptance of dialect was an important factor for participants’ perceptions of a strengthened orientation towards vernacularity. This stresses that socioaffective factors can have a pronounced influence on patterns of (perceived) linguistic change (e.g. Beaman Reference Beaman, Ziegler, Edler and Oberdorfer2021, Steiner et al. Reference Steiner, Jeszenszky and Leemann2023b).
What is more, no one significant life event gave rise to the same patterns of linguistic change for all individuals. This highlights that even individuals who experienced the same MLE may react differently to the new social environment and linguistic demands therein. In the psychology literature, it has been asserted that MLEs in the personal domain are subject to substantial variability (e.g. Bühler et al. Reference Bühler, Orth, Bleidorn, Weber, Kretzschmar, Scheling and Hopwood2023), likely owing to the differences in and individualistic nature of the kind of demands personal MLEs place on individuals. As voiced by the participants in this study, the different demands of an MLE in combination with the issue concerning how an individual strives to represent their identity appear to be critical drivers for perceptions of linguistic change. For instance, entry into new social networks (e.g. vis-à-vis relocation, new friendships, new relationships, etc.) may be marked by some individuals by a strengthened orientation towards standard language to facilitate comprehensibility in the new social environment, whereas others may intensify their orientation towards vernacularity as a conscious assertion of identity and belonging and, at the same time, demarcate themselves from other (social) groups. These findings corroborate pervious insights stressing that an individual’s dialect is a critical marker of (local) identity (e.g. Le Page & Tabouret-Keller Reference Le Page and Tabouret-Keller1985, Scheuringer Reference Scheuringer1990, Spiekermann Reference Spiekermann2008), whereas standard language as a supraregional variety fulfils functional purposes such as ensuring comprehensibility (e.g. Ender & Kaiser Reference Ender and Kaiser2009, Vergeiner Reference Vergeiner2019). As another example, we also found categorically different trajectories of perceived linguistic change upon the MLE parenthood. Because standard language has prestigious currency outside the community, some parents or caregivers may employ standard variants as a way to “bias [children] toward the more positively evaluated variant” (Foulkes et al. Reference Foulkes, Docherty and Watt2005:199; see also Smith et al. Reference Smith, Durham and Fortune2007). At the same time, others may employ vernacular variants with children as a way to promote a linguistic repertoire more accepted in the local and familiar environment. Which trajectory parents or caregivers choose (or, more accurately in our case, perceive to have chosen) appears to be related to the (socio)linguistic responsibilities of caregiving. More specifically, this theme seems to relate to a sort of “linguistic generativity,” that is, a concern for establishing and guiding the next generation in terms of (a) how parents wish their children to be perceived in the eyes of others and (b) how they believe their children can best excel (socio)linguistically.
6. Conclusion
Cheshire (Reference Cheshire, Ammon, Dittmar, Mattheier and Trudgill2006:1558) argues alongside other sociolinguists that “[p]redetermined life stages […] cannot take account of all the important events and experiences that make up each individual’s life history, nor are they intended to do so” (see also, e.g., Pichler et al. Reference Pichler, Wagner and Hesson2018, Bowie & Gerstenberg Reference Bowie and Gerstenberg2023). Instead, it is necessary to more aggressively address the issue as to how we can better disentangle biological and physiological processes of maturation from the “life experiences that give age meaning” (Eckert Reference Eckert and Coulmas1997:167). In line with Wagner (Reference Wagner2012b), this may entail scrutinizing critical turning points in the life course in the form of significant life events. However, there has been a dearth of studies hitherto which address how individualistic MLEs in the personal domain such as relocation, a new friendship, romantic relationship, marriage, parenthood, and grandparenthood at a specific timepoint in a speaker’s life relate to (differential or interindividually similar patterns of) individual-level linguistic change.
Our study underscores the substantial effects of geographic mobility (e.g. Kwon Reference Kwon2018, Beaman Reference Beaman, Ziegler, Edler and Oberdorfer2021, Steiner et al. Reference Steiner, Jeszenszky and Leemann2023b), social network structures (e.g. Lippi-Green Reference Lippi-Green1989, Milroy & Milroy Reference Milroy and Milroy1992, Labov Reference Labov2001, Vergeiner et al. Reference Vergeiner, Luttenberger, Bülow, Wallner and Britain2023), and parent and caregiver roles (e.g. Smith et al. Reference Smith, Durham and Fortune2007, Smith & Durham Reference Smith and Durham2019) on patterns of variation and change, and critically adds to these results by demonstrating that changes in such life circumstances are at least perceived by individuals to be powerful drivers for intraspeaker linguistic instability at any point in the life course. What is more, both the quantitative and qualitative analyses highlight that no single significant life event impacts speakers in the same way (e.g. Buchstaller Reference Buchstaller2015, Mechler & Buchstaller Reference Mechler and Buchstaller2019). This should be taken as motivation for future research to carefully consider both quantitatively captured individual difference variables alongside the contextual reasons for MLE-related changes in the (socio)linguistic repertoire.
Finally, it is to be critically noted that we exclusively collected retrospective perceptions (i.e. self-reports) of MLE-related linguistic change rather than measuring change across the six MLEs in the form of a panel study. We acknowledge that intuitions about linguistic behavior may not necessarily correspond to actual linguistic behavior. Labov (Reference Labov, McNair, Singer, Dobrin and Aucon1996), for instance, demonstrated several cases in which speakers’ introspective judgments of the acceptability of a linguistic variant “fail” (e.g. rejecting a variant despite using it in a sociolinguistic interview), and Jamieson et al. (Reference Jamieson, Smith, Adger, Heycock and Thoms2025) argued that the reliability of speaker intuitions is variable-dependent. We hoped to mitigate this issue in the current study as much as possible by focusing on participants’ perceptions of their use of and attitudes towards entire language varieties (i.e. standard German and dialect) rather than on select sociolinguistic variables. Specifically, because (a) standard German and dialect varieties in Austria evince clear perceptual differences (e.g. Ender & Kaiser Reference Ender and Kaiser2009), (b) speakers make a largely dichotomous distinction between dialect and standard German in terms of their language awareness (e.g. de Cillia Reference de Cillia, Dannerer and Mauser2018:70), and (c) Austrians are adept at discriminating standard German and dialect varieties (e.g. Kaiser et al. Reference Kaiser, Ender, Kasberger, Bülow, Fischer and Herbert2019), it is the hope that the retrospective reports of change focusing on these distinct varieties will at least roughly correlate with actual linguistic change therein. Initial evidence from psychology focusing on personality development indeed suggests that retrospectively judged change correlates moderately to strongly with measured change (e.g. Schwaba et al. Reference Schwaba, Denissen, Luhmann, Hopwood and Bleidorn2023). Such results, however, are lacking for issues relating to the correlation between retrospective perceptions of change in the (socio)linguistic repertoire and longitudinal linguistic change. Thus, in addition to the necessity of more panel studies that home in on the linguistic relevance of critical inflection points in the life course (e.g. Wagner Reference Wagner2012b), analyses which compare and contrast retrospective change and longitudinally measured change in the productive and affective-attitudinal sociolinguistic repertoire would be beneficial from a methodological perspective in order to broaden the operational toolbox for measuring individual-level linguistic change across the lifespan.
Appendix A. Visual model summaries
The model estimates below are presented in the form of quantile dotplots, which aid in visualizing the variance surrounding the respective effects, with wider intervals representing more variance surrounding the effect. Specifically, these visualize the posterior probability distribution of a predictor variable’s effect size. Each dot in the figure represents a 1% likelihood of a given value. Effects that overlap with the ROPE are shaded grey, indicating nonsufficient evidence for an effect. Green and red shading specify a significant effect with a positive and negative directionality respectively. The purple bars visualize the 50%, 80%, and the 95% HDIs (from darker to lighter). The black point displays the posterior mean, and the thin and thick black bars show the 98% and 66% HDIs respectively. The red shaded area is the ROPE set at ± 0.10.
Visual model summaries of individual difference predictors of perceived linguistic change following the MLE “relocation” (n = 90 after outlier removal; men = 27, women = 63; no higher education = 23, higher education = 67).

Visual model summaries of individual difference predictors of perceived linguistic change following the MLE “new friendship” (n = 32 after outlier removal; men = 16, women = 16; no higher education = 22, higher education = 10).

Visual model summaries of individual difference predictors of perceived linguistic change following the MLE “new romantic relationship” (n = 45 after outlier removal; men = 13, women = 32; no higher education = 16, higher education = 29).

Visual model summaries of individual difference predictors of perceived linguistic change following the MLE “marriage” (n = 18 after outlier removal; men = 8, women = 10; no higher education = 7, higher education = 11).

Visual model summaries of individual difference predictors of perceived linguistic change following the MLE “parenthood” (n = 53 after outlier removal; men = 8, women = 45; no higher education = 12, higher education = 41).

Visual model summaries of individual difference predictors of perceived linguistic change following the MLE “grandparenthood” (n = 26 after outlier removal; men = 9, women = 17; no higher education = 9, higher education = 17).


 Open access