


Introduction
The Echinococcus canadensis cluster (comprising several genotypes) belongs to a group of cestode species called Echinococcus granulosus sensu lato (s.l.) (Vuitton et al., Reference Vuitton, McManus, Rogan, Romig, Gottstein, Naidich, Tuxun, Wen and Menezes da Silva2020). These are tapeworms that cause cystic echinococcosis (CE) in humans – a disease recognized by the World Health Organization as a neglected tropical disease (World Health Organization, 2021). Within the E. canadensis cluster, the genotypes G8 and G10 are predominantly maintained in a sylvatic transmission cycle, involving wolves (Canis lupus) as definitive hosts harbouring adult worms, and wild cervids such as moose (Alces alces), elk/wapiti (Cervus canadensis) and roe deer (Capreolus capreolus) as intermediate hosts harbouring larvae (Marcinkuté et al., Reference Marcinkuté, Šarkūnas, Moks, Saarma, Jokelainen, Bagrade, Laivacuma, Strupas, Sokolovas and Deplazes2015; Romig et al., Reference Romig, Deplazes, Jenkins, Giraudoux, Massolo, Craig, Wassermann, Takahashi and de la Rue2017). Synanthropic transmission cycle involving semi-domesticated reindeer (Rangifer tarandus) and dogs, and a semi-synanthropic life cycle involving wild cervids and free-roaming and/or hunting dogs are also known to occur (Oksanen and Lavikainen, Reference Oksanen and Lavikainen2015; Romig et al., Reference Romig, Deplazes, Jenkins, Giraudoux, Massolo, Craig, Wassermann, Takahashi and de la Rue2017). The larval stage of this parasite represents a fluid-filled cyst predominantly found in the liver of the intermediate hosts. However, the available evidence suggests E. canadensis (G8/G10) is more prone to establish infection in the lungs, with a more benign CE pathology than CE infections caused by other Echinococcus spp. (reviewed in Oksanen and Lavikainen, Reference Oksanen and Lavikainen2015). Protoscoleces proliferate within the cyst and subsequently develop into adult worms in the small intestine of the definitive hosts upon ingestion of infected internal organs of the intermediate hosts (Thompson, Reference Thompson2017). Humans are considered as accidental intermediate hosts and represent a ‘dead-end’ for the parasite (Kern et al., Reference Kern, Menezes da Silva, Akhan, Müllhaupt, Vizcaychipi, Budke and Vuitton2017). Although the exact pathways of infection are not yet fully understood, it is thought the infection typically occurs through ingestion of food or water that are contaminated with Echinococcus eggs (Alvarez Rojas et al., Reference Alvarez Rojas, Mathis and Deplazes2018).
According to mitochondrial (mt) cytochrome c oxidase subunit 1 (cox1; 366 bp) and NADH dehydrogenase subunit 1 (nad1; 474 bp) gene fragments, 10 genotypes, i.e. G1–G10 (formerly known as strains), were originally defined within E. granulosus s.l. (Bowles et al., Reference Bowles, Blair and McManus1992, Reference Bowles, Blair and McManus1994; Bowles and McManus, Reference Bowles and McManus1993; Lavikainen et al., Reference Lavikainen, Lehtinen, Meri, Hirvelä-Koski and Meri2003). A number of these genotypes have now been classified as distinct species within the cluster and two genotypes are considered as invalid (G2 and G9) (Kedra et al., Reference Kedra, Swiderski, Tkach, Dubinsky, Pawlowski, Stefaniak and Pawlowski1999; Kinkar et al., Reference Kinkar, Laurimäe, Sharbatkhori, Mirhendi, Kia, Ponce-Gordo, Andresiuk, Simsek, Lavikainen, Irshadullah, Umhang, Oudni-M'rad, Acosta-Jamett, Rehbein and Saarma2017; reviewed in Lymbery, Reference Lymbery2017). The species status of genotypes G6/G7 (formerly camel and pig strains, respectively) and G8/G10 (cervid strains) has, however, remained unclear. The mtDNA data show G10 to be more closely related to G6/G7 than to G8 (e.g. Nakao et al., Reference Nakao, McManus, Schantz, Craig and Ito2006; Moks et al., Reference Moks, Jõgisalu, Valdmann and Saarma2008; Knapp et al., Reference Knapp, Nakao, Yanagida, Okamoto, Saarma, Lavikainen and Ito2011), while evidence from nuclear genes has indicated that the cervid G8 and G10 form one clade, and G6/G7 another (Saarma et al., Reference Saarma, Jõgisalu, Moks, Varcasia, Lavikainen, Oksanen, Simsek, Andresiuk, Denegri, González, Ferrer, Gárate, Rinaldi and Maravilla2009; Laurimäe et al., Reference Laurimäe, Kinkar, Moks, Romig, Omer, Casulli, Umhang, Bagrade, Irshadullah, Sharbatkhori, Mirhendi, Ponce-Gordo, Soriano, Varcasia, Rostami-Nejad, Andresiuk and Saarma2018a). As such, some have suggested that G8/G10 should be regarded as one species (E. canadensis) together with G6/G7 (e.g. Nakao et al., Reference Nakao, McManus, Schantz, Craig and Ito2006), while others have proposed three (Lymbery et al., Reference Lymbery, Jenkins, Schurer and Thompson2015) or two species (Thompson, Reference Thompson2008; Saarma et al., Reference Saarma, Jõgisalu, Moks, Varcasia, Lavikainen, Oksanen, Simsek, Andresiuk, Denegri, González, Ferrer, Gárate, Rinaldi and Maravilla2009; Laurimäe et al., Reference Laurimäe, Kinkar, Moks, Romig, Omer, Casulli, Umhang, Bagrade, Irshadullah, Sharbatkhori, Mirhendi, Ponce-Gordo, Soriano, Varcasia, Rostami-Nejad, Andresiuk and Saarma2018a). Until the taxonomic dispute has been resolved, the authors have herein elected to refer to genotypes G6–G8 and G10 as genotypes of the E. canadensis cluster or whenever E. canadensis is mentioned, genotypes are also specified (Vuitton et al., Reference Vuitton, McManus, Rogan, Romig, Gottstein, Naidich, Tuxun, Wen and Menezes da Silva2020).
The distribution range of E. canadensis (G8/G10) is circumpolar and limited to North America (Canada; Alaska, USA), Fennoscandia (Finland; Sweden), continental north-eastern Europe (Estonia, Latvia) and Russia (Yakutia, Siberia) (reviewed in Oksanen and Lavikainen, Reference Oksanen and Lavikainen2015 and Romig et al., Reference Romig, Deplazes, Jenkins, Giraudoux, Massolo, Craig, Wassermann, Takahashi and de la Rue2017). The prevalence of E. canadensis (G8/G10) in European wildlife has been documented rather sporadically, while human infections are considered rare but have likely been underreported (reviewed in Marcinkuté et al., Reference Marcinkuté, Šarkūnas, Moks, Saarma, Jokelainen, Bagrade, Laivacuma, Strupas, Sokolovas and Deplazes2015; Oksanen and Lavikainen, Reference Oksanen and Lavikainen2015, Davidson et al., Reference Davidson, Lavikainen, Konyaev, Schurer, Miller, Oksanen, Skírnisson and Jenkins2016; Deplazes et al., Reference Deplazes, Rinaldi, Alvarez Rojas, Torgerson, Harandi, Romig, Antolova, Schurer, Lahmar, Cringoli, Magambo, Thompson and Jenkins2017; Casulli et al., Reference Casulli, Abela-Ridder, Petrone, Fabiani, Bobić, Carmena, Šoba, Zerem, Gargaté, Kuzmanovska, Calomfirescu, Rainova, Sotiraki, Lungu, Dezsényi, Ortiz, Karamon, Maksimov, Oksanen, Millon, Sviben, Shkjezi, Gjoni, Akshija, Saarma, Torgerson, Snabel, Antolova, Muhovic, Besim, Chereau, García, Chappuis, Gloor, Stoeckle, Müllhaupt, Manno, Santoro and Santolamazza2022a, Reference Casulli, Massolo, Saarma, Umhang, Santolamazza and Santoro2022b). To the best of our knowledge, the only published case in Europe of human infection with confirmed E. canadensis G10 was recorded in Finland (Hämäläinen et al., Reference Hämäläinen, Kantele, Arvonen, Hakala, Karhukorpi, Heikkinen, Berg, Vanamo, Tyrväinen, Heiskanen-Kosma, Oksanen and Lavikainen2015). Although in other countries e.g. in Estonia and Latvia where E. canadensis (G8/G10) is known to be present in wildlife, human CE infections are known to occur, but are not molecularly characterized. Data on E. canadensis (G8/G10) prevalence in wild mammals in Europe have shown that e.g. 0.8% of moose (16 of 2038) and 3.8% of wolves (1 of 26) in Estonia harbour E. canadensis (G8/G10; Moks et al., Reference Moks, Jõgisalu, Saarma, Talvik, Järvis and Valdmann2006, Reference Moks, Jõgisalu, Valdmann and Saarma2008), while in Latvia the parasite has been detected in 2.9% of wolves (1 of 34) (Bagrade et al., Reference Bagrade, Kirjušina, Vismanis and Ozoliņš2009), and in Finland in 10% of wolves (during 2000–2010, 25 of 252) (reviewed in Oksanen and Lavikainen, Reference Oksanen and Lavikainen2015).
To date, studies exploring the genetic diversity of genotypes G8 and G10 have been scarce. This is likely due to difficulties in obtaining parasite samples from wildlife species (wolves, wild cervids), particularly as surveillance of the parasite infection in wildlife is not regularly performed and the detection and collection of Echinococcus spp. parasite tissue are laborious tasks (Moks et al., Reference Moks, Jõgisalu, Valdmann and Saarma2008; Schurer et al., Reference Schurer, Shury, Leighton and Jenkins2013; Romig et al., Reference Romig, Deplazes, Jenkins, Giraudoux, Massolo, Craig, Wassermann, Takahashi and de la Rue2017). However, by analysing selected mt loci, predominantly cox1 and/or nad1 gene fragments, available studies have provided valuable first insight into the genetic variation of these genotypes (e.g. Lavikainen et al., Reference Lavikainen, Lehtinen, Laaksonen, Ågren, Oksanen and Meri2006; Moks et al., Reference Moks, Jõgisalu, Valdmann and Saarma2008; Nakao et al., Reference Nakao, Yanagida, Konyaev, Lavikainen, Odnokurtsev, Zaikov and Ito2013; Schurer et al., Reference Schurer, Shury, Leighton and Jenkins2013; Yang et al., Reference Yang, Zhang, Zeng, Zhao, Zhang and Liu2015; Dell et al., Reference Dell, Newman, Purple, Miller, Ramsay, Donnell and Gerhold2020; Priest et al., Reference Priest, McRuer, Stewart, Boudreau, Power, Conboy, Jenkins, Kolapo and Shutler2021). For example, such studies have indicated that the extent of genetic variation within the two E. canadensis genotypes (G8 and G10) is considerably lower and less complex than within other Echinococcus species or genotypes, such as E. granulosus sensu stricto (s.s., G1/G3) and G6/G7 of the E. canadensis cluster (Romig et al., Reference Romig, Ebi and Wassermann2015; Kinkar et al., Reference Kinkar, Laurimäe, Acosta-Jamett, Andresiuk, Balkaya, Casulli, Gasser, van der Giessen, González, Haag, Zait, Irshadullah, Jabbar, Jenkins, Kia, Manfredi, Mirhendi, M'rad, Rostami-Nejad, Oudni-M'rad, Pierangeli, Ponce-Gordo, Rehbein, Sharbatkhori, Simsek, Soriano, Sprong, Šnábel, Umhang, Varcasia and Saarma2018a, Reference Kinkar, Laurimäe, Balkaya, Casulli, Zait, Irshadullah, Sharbatkhori, Mirhendi, Rostami-Nejad, Ponce-Gordo, Rehbein, Kia, Simsek, Šnábel, Umhang, Varcasia and Saarma2018b; Laurimäe et al., Reference Laurimäe, Kinkar, Romig, Omer, Casulli, Umhang, Gasser, Jabbar, Sharbatkhori, Mirhendi, Ponce-Gordo, Lazzarini, Soriano, Varcasia, Rostami Nejad, Andresiuk, Maravilla, González, Dybicz, Gawor, Šarkūnas, Šnábel, Kuzmina and Saarma2018b).
The aim of the current study was to explore the extent of genetic variation based on complete mtDNA sequence data of E. canadensis (G8 and G10) specimens originating from the main distribution range of the parasite in Europe and provide a high-quality reference dataset for future genetic studies.
Materials and methods
Biological material
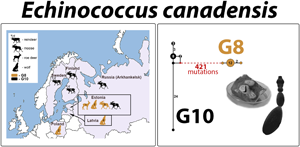
A single Echinococcus cyst or adult worm per host animal was analysed. Echinococcus cyst samples (n = 22) were obtained from three intermediate host species (moose, n = 15; reindeer, n = 6; roe deer, n = 1) from four countries (Sweden, Finland, Russia and Estonia), whereas adult worms were collected from a definitive host species (wolf, n = 7) from three countries (Estonia, Latvia and Poland) (Fig. 1; Table 1). The samples were not collected specifically for the purposes of the current study – cyst material or adult worms were obtained during routine inspections at slaughter or inspection of hunted animal carcasses during hunting season and were donated to the University of Tartu (Estonia). All biological material was stored at −20°C until further analysis.
Map of sampling locations for genotypes G8 and G10 of the Echinococcus canadensis cluster, and their respective host species. Samples designated as genotype G8 are represented by light brown colour, and G10 by black. A number inside the silhouette of a host species represents the number of parasite specimens analysed (a single cyst or adult worm per host animal). Three-letter abbreviations represent the names of haplotypes based on complete mt genome sequences.

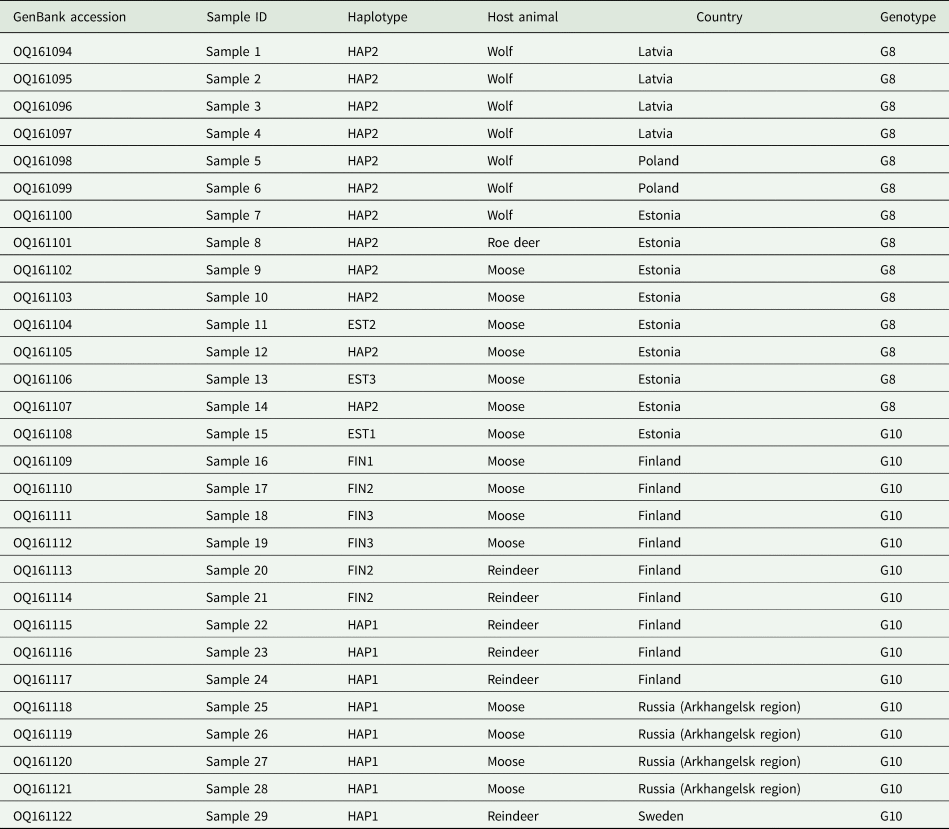
Identity and origin of Echinococcus canadensis G8 and G10 specimens analysed in the current study
Sample preparation, polymerase chain reaction (PCR) and sequencing
Genomic DNA was extracted from parasite material using a High Pure PCR Template Preparation Kit (Roche Diagnostics, Mannheim, Germany), according to the manufacturer's instructions. PCRs and amplification were carried out as described in Laurimäe et al. (Reference Laurimäe, Kinkar, Romig, Omer, Casulli, Umhang, Gasser, Jabbar, Sharbatkhori, Mirhendi, Ponce-Gordo, Lazzarini, Soriano, Varcasia, Rostami Nejad, Andresiuk, Maravilla, González, Dybicz, Gawor, Šarkūnas, Šnábel, Kuzmina and Saarma2018b). Briefly, 13 primer pairs were utilized to amplify the complete mt genome (~13 500 bp) of the parasite. Each PCR was carried out in a volume of 20 μL, with 0.25 μ m of each primer, 1× BD Advantage 2 PCR buffer (BD Biosciences, Franklin Lakes, NJ, USA), 0.2 mm dNTP (Fermentas, Vilnius, Lithuania), 1 U Advantage 2 Polymerase mix (BD Biosciences) and <1 μg of template DNA. Touchdown PCRs were carried out as described in Laurimäe et al. (Reference Laurimäe, Kinkar, Romig, Omer, Casulli, Umhang, Gasser, Jabbar, Sharbatkhori, Mirhendi, Ponce-Gordo, Lazzarini, Soriano, Varcasia, Rostami Nejad, Andresiuk, Maravilla, González, Dybicz, Gawor, Šarkūnas, Šnábel, Kuzmina and Saarma2018b), with initial denaturation at 95°C for 1 min, followed by 10 cycles of 95°C for 20 s, 55°C for 45 s (annealing temperature progressively reduced by −0.5°C in each cycle) and 68°C for 2 min; followed by 25 cycles of 95°C for 20 s, 50°C for 45 s, 68°C for 2 min; and finishing with a final elongation step at 68°C for 3 min. Of the 20 μL, 10 μL of the PCR products were examined on a 1.2% agarose gel. The remaining 10 μL was subjected to purification with 1 U shrimp alkaline phosphatase and 1 U exonuclease I (both from Thermo Scientific, Waltham, USA), and subsequent incubation at 37°C for 30 min, followed by 80°C for 15 min in order to inactivate the enzymes. Sequencing was performed at the Core Facility of Genomics (Tartu, Estonia) using the same set of primers as for the initial PCR. Both forward and reverse strands were sequenced.
Sequence assembly, quality control and alignment
Consensus sequences were assembled in Codon Code Aligner v.6.0.2 and each polymorphic position was verified by eye using ‘raw’ chromatogram data. Sequence alignment using Clustal W was performed in BioEdit v.7.2.5 (Thompson et al., Reference Thompson, Higgins and Gibson1994; Hall, Reference Hall1999). An initial assessment of the genotypic identity of the samples was performed using NCBI Nucleotide BLAST.
Phylogenetic analysis
First, complete mt genome sequences of other closely related E. granulosus s.l. species were retrieved from the GenBank database (Table S1) and aligned with the sequences produced in this study, to assess the extent of genetic variation between and among distinct genotypes (datasets A and B, respectively). For this, median-joining phylogenetic networks were constructed using Network v.4.6.1.6 (Fluxus Technology Ltd; Colchester, UK.) software, with both indels and point mutations considered. As the commonly applied mtDNA markers had been developed at a time when the extent of mtDNA variation was largely unknown (particularly for G8 and G10), we also aimed to assess and compare the degree of inter- and intra-genotypic phylogenetic resolution provided by other commonly used markers (i.e. cox1, nad1 and 12S rRNA; e.g. Bowles et al., Reference Bowles, Blair and McManus1992; Bowles and McManus, Reference Bowles and McManus1993; Trachsel et al., Reference Trachsel, Deplazes and Mathis2007). Outgroups, i.e. other species/genotypes that served as reference groups, were included as required (accession numbers are listed in Table S1). Phylogenetic networks were constructed as described above.
Results
Genotypic identity and origin of analysed samples
All 29 samples analysed here were identified as E. canadensis genotype G8 (n = 14) or G10 (n = 15). For each specimen, the complete mt genome sequence was produced (13 550–13 552 bp). All sequences were deposited in the GenBank database (accession numbers OQ161094–OQ161122; Table 1). The G8 samples that were successfully sequenced originated from Estonia (roe deer, n = 1; wolf, n = 1; moose, n = 6), Latvia (wolves, n = 4) and Poland (wolves, n = 4). The G10 samples were from Estonia (moose, n = 1), Finland (moose, n = 4; semi-domesticated reindeer, n = 5), Sweden (semi-domesticated reindeer, n = 1) and Russia (moose, n = 4).
High genetic variability between Echinococcus species and genotypes
The median-joining phylogenetic network of complete mt genomes for dataset A revealed that Echinococcus ortleppi (G5) is separated from G10 and G8 by more than 800 and 1200 mutations, respectively (schematic representation of genetic distances is shown in Fig. 2). As expected (see e.g. Moks et al., Reference Moks, Jõgisalu, Valdmann and Saarma2008; Nakao et al., Reference Nakao, Yanagida, Konyaev, Lavikainen, Odnokurtsev, Zaikov and Ito2013), genotype G10 is more closely related to genotypes G6/G7 (formerly camel and pig strains) than to the other cervid genotype G8 (~400 mutations between G8 and G10, and around 200 between G10 and G6/G7). The distance between genotypes G6 and G7 was ~25 mutations, in contrast to the vast distance between G8 and G10.
Schematic representation of the median-joining network based on representative complete mt genome sequences (~13 500 bp) of (i) genotypes G8 and G10 of the E. canadensis cluster – current study; (ii) Echinococcus ortleppi (G5) and genotypes G6 and G7 of the E. canadensis cluster – retrieved from GenBank. Echinococcus ortleppi is depicted in green, E. canadensis cluster genotype G8 in light brown, G10 in black and G6 and G7 in light and dark blue, respectively. The numbers on the lines represent the approximate number of mutations between the genotypes, indicating the minimum genetic distance between the closest nodes. GenBank accession numbers for the sequences are listed in Table S1 (dataset A).

Distinct patterns of variability within G8 and G10
The phylogenetic network analysis of dataset B (complete mt genome sequences of E. canadensis G8 and G10 samples; n = 29) revealed a total of eight haplotypes, with G8 isolates represented by three haplotypes, and G10 isolates by five (Fig. 3). Within the G8 cluster, the majority of the samples (n = 12) were identical (haplotype HAP2), with HAP2 comprising samples from Estonia (n = 6), Latvia (n = 4) and Poland (n = 2), obtained from wolves, roe deer and moose. The remaining two G8 haplotypes originated from moose from Estonia (EST2 and EST3) and were separated from HAP2 by one and two mutations, respectively. The intra-genotypic variability within G10 appeared more complex than that of G8. Interestingly, the single G10 sample from Estonia from a moose was highly diverged, with 24–28 mutations separating it from the rest of the G10 samples from Sweden, Finland and Russia. The samples from the latter three countries revealed eight samples with an identical mt genome sequence; these samples originated from Sweden (reindeer, n = 1), Finland (reindeer, n = 3) and Russia (moose n = 4). The remaining samples from Finland were grouped into three separate haplotypes (FIN1–FIN3), with 1–3 mutations apart from HAP1. Similar to HAP1, haplotype FIN2 was identified from both reindeer and moose.
Median-joining network of genotypes G8 and G10 of the E. canadensis cluster (dataset B) based on complete mt genomes (13 550–13 552 bp). Genotype G8 haplotypes are depicted in light brown, G10 haplotypes are in black and median vectors as red rectangles. Numbers inside the circles represent the number of identical sequences within the respective haplotype; numbers on the lines represent the number of mutations. Note that the dashed line between the G10 and G8 haplotype clusters represents reduced edge-lengths. Haplotype names are designated as three-letter abbreviations (HAP, haplotypes representing samples originating from different countries; EST, Estonia; FIN, Finland). Black silhouettes of animals represent host species.

Comparison of commonly applied mtDNA markers
An assessment of phylogenetic resolution provided by commonly used markers showed that while both the complete gene sequence and the widely used gene fragment of cox1 (1608 and 366 bp, respectively), the complete nad1 (894 bp) and its fragment (471 bp) and the complete 12S rRNA (726 bp) gene sequences are able to distinguish between G8 and G10 (schematic representation of genetic distances is shown in Fig. S1), they lack sufficient resolution to reveal detailed patterns of genetic variation within the two genotypes. An analysis based on a fragment of 12S rRNA (117 bp) revealed that G10 was indistinguishable from genotypes G6 and G7.
Discussion
The complete mtDNA sequence data revealed a vast genetic distance (over 400 mutations) between the two cervid genotypes G8 and G10 (Fig. 2). Although previous studies have suggested the genetic distinctiveness of these genotypes (e.g. Nakao et al., Reference Nakao, McManus, Schantz, Craig and Ito2006, Reference Nakao, Yanagida, Konyaev, Lavikainen, Odnokurtsev, Zaikov and Ito2013), this marked distance is somewhat surprising, first, given their biological and ecological similarities (Romig et al., Reference Romig, Deplazes, Jenkins, Giraudoux, Massolo, Craig, Wassermann, Takahashi and de la Rue2017), and second, due to the species E. ortleppi (genotype G5) having only twice the distance to E. canadensis genotype G10 (~800 mutations). Echinococcus ortleppi has been firmly established as a distinct species and is predominantly transmitted through a cattle–dog cycle and has a distribution range distinct from the cervid genotypes (Romig et al., Reference Romig, Deplazes, Jenkins, Giraudoux, Massolo, Craig, Wassermann, Takahashi and de la Rue2017). Hence, it would be expected that the mt genetic distance between E. ortleppi and E. canadensis G8/G10 would be several-fold greater than that between G8 and G10. This result could be explained by the divergence and subsequent evolution of the two mt lineages, G8 and G10, over an extended period of time. Whether this mt genetic distinctiveness has an impact on any phenotypic traits in these taxa warrants further investigations.
The finding of lower intraspecific variation within G8 and G10 could likely reflect the effect of limited sampling on the findings. Although the extent of genetic variation appeared to be lower than as reported for e.g. E. granulosus s.s. (Kinkar et al., Reference Kinkar, Laurimäe, Acosta-Jamett, Andresiuk, Balkaya, Casulli, Gasser, van der Giessen, González, Haag, Zait, Irshadullah, Jabbar, Jenkins, Kia, Manfredi, Mirhendi, M'rad, Rostami-Nejad, Oudni-M'rad, Pierangeli, Ponce-Gordo, Rehbein, Sharbatkhori, Simsek, Soriano, Sprong, Šnábel, Umhang, Varcasia and Saarma2018a, Reference Kinkar, Laurimäe, Balkaya, Casulli, Zait, Irshadullah, Sharbatkhori, Mirhendi, Rostami-Nejad, Ponce-Gordo, Rehbein, Kia, Simsek, Šnábel, Umhang, Varcasia and Saarma2018b) or E. granulosus s.l. G7 (Laurimäe et al., Reference Laurimäe, Kinkar, Romig, Omer, Casulli, Umhang, Gasser, Jabbar, Sharbatkhori, Mirhendi, Ponce-Gordo, Lazzarini, Soriano, Varcasia, Rostami Nejad, Andresiuk, Maravilla, González, Dybicz, Gawor, Šarkūnas, Šnábel, Kuzmina and Saarma2018b), it was nonetheless observed that the intra-genotypic variation within G8 and G10 could be more complex than previously observed (e.g. Moks et al., Reference Moks, Jõgisalu, Valdmann and Saarma2008; Nakao et al., Reference Nakao, Yanagida, Konyaev, Lavikainen, Odnokurtsev, Zaikov and Ito2013). It is also worth noting that obtaining Echinococcus spp. samples is a labour-exhaustive task (typically involving slaughterhouse/abattoir surveys with veterinary supervision to inspect the internal organs of animals for possible Echinococcus cysts), particularly due to the low prevalence of E. canadensis G8 and G10 and its predominant perpetuation through a wildlife cycle. However, it could be hypothesized that the lower intraspecific variation could possibly be to some extent also explained by the small population size due to low prevalence and density of the parasite, as well as the rather restricted host spectrum (wild cervids and wolves) compared to other Echinococcus taxa e.g. E. granulosus s.s. G1 (Romig et al., Reference Romig, Deplazes, Jenkins, Giraudoux, Massolo, Craig, Wassermann, Takahashi and de la Rue2017), and would lead to reduced mt genetic diversity over time (James and Eyre-Walker, Reference James and Eyre-Walker2020). Opposing theories have, however, stated a lack of such a correlation, possibly due to the stochasticity and high mutation rate of the mtDNA (Bazin et al., Reference Bazin, Glémin and Galtier2006). The lower genetic variation within G8 and G10 might also mirror local adaptation to these geographical regions. Although little is understood about the adaptive role of mutations in mtDNA in cestodes, it has been estimated that up to 23% of non-synonymous nucleotide substitutions in the mtDNA are fixed through adaptive evolution in mammals (James et al., Reference James, Piganeau and Eyre-Walker2016).
Interestingly, the pattern of mt genetic variation within G8 and G10 appeared to some extent reflect the dispersal pattern of their wild host animals. This is somewhat expected given that E. canadensis (G8/G10) is an obligatory parasite that relies on wild animals (wolves and moose) to maintain its life cycle. For example, genetic analyses of moose and wolf populations across Europe have suggested limited dispersal between Fennoscandia (Sweden, Finland) and continental Europe (including Estonia, Latvia and Poland), while dispersal within both regions, as well as between Finland and Russia (Arkhangelsk region) appears to be continuous (Niedziałkowska et al., Reference Niedziałkowska, Jędrzejewska, Danyłow and Niedziałkowski2016; Hindrikson et al., Reference Hindrikson, Remm, Pilot, Godinho, Stronen, Baltrūnaité, Czarnomska, Leonard, Randi, Nowak, Åkesson, López-Bao, Álvares, Llaneza, Echegaray, Vilà, Ozolins, Rungis, Aspi, Paule, Skrbinšek and Saarma2017). Indeed, results of the current study seem to suggest that samples of genotypes G8 from continental Europe are genetically similar, as evidenced by the shared haplotype (HAP2) from Estonia, Latvia and Poland; whereas within G10, the Fennoscandian (Finland, Sweden) and Russian samples showed close genetic similarity, while in contrast the sample from continental Europe (Estonia) appeared only distantly related to the rest of the G10 samples (Fig. 3). In the future it would be relevant to include more samples from other regions, including from North America and Far-East Asia, to determine the existence of other genetically divergent haplotypes/-groups within the two genotypes. This in-depth knowledge of genetic variation patterns within a parasite population could aid in the design of surveillance and control efforts in the future, should a need arise. Consequently, it could be hypothesized that were a new genetic variant or species of parasite (e.g. with higher pathogenicity and genetic variability) introduced into the wolf and moose populations in these areas, the parasite would likely be dispersed across vast distances, and depending on the phenotypic and biological characteristics of the new variants, could be a cause for concern for local wildlife, or even human health in some cases.
Finally, an assessment of phylogenetic resolution provided by the widely applied mtDNA markers highlighted the importance of selecting a genetic marker in accordance with the aim of the analysis, as also discussed in previous studies for other Echinococcus taxa (Kinkar et al., Reference Kinkar, Laurimäe, Simsek, Balkaya, Casulli, Manfredi, Ponce-Gordo, Varcasia, Lavikainen, Gonzále, Rehbein, Giessen, Sprong and Saarma2016; Laurimäe et al., Reference Laurimäe, Kinkar, Romig, Omer, Casulli, Umhang, Gasser, Jabbar, Sharbatkhori, Mirhendi, Ponce-Gordo, Lazzarini, Soriano, Varcasia, Rostami Nejad, Andresiuk, Maravilla, González, Dybicz, Gawor, Šarkūnas, Šnábel, Kuzmina and Saarma2018b). Complete mtDNA sequence datasets could be used to explore the genetic variation of Echinococcus taxa, whereas single mtDNA genes or gene fragments are better suited for species/genotype identification in instances where sequencing of complete mtDNA is not feasible.
The current study provides insight into the genetic variation of the elusive E. canadensis G8 and G10 genotypes based on complete mt genome data, highlighting marked mt genetic divergence between G8 and G10, and higher levels of intra-genotypic genetic variation than previously observed. Understanding the mt genetic composition of a species provides a baseline for future studies exploring the nature and extent of nuclear genomic variation, which might lead to an enhanced understanding of the molecular epidemiology of the E. canadensis cluster.
Data availability
All sequences are deposited in the GenBank (accession numbers OQ161094-OQ161122; Table 1).
Supplementary material
The supplementary material for this article can be found at https://doi.org/10.1017/S0031182023000331.
Acknowledgements
The authors would like to sincerely thank Antti Lavikainen and Inga Jõgisalu for providing parasite samples.
Author's contribution
T. L.: wrote the original draft, prepared the figures and performed laboratory work, as well as performed phylogenetic and genetic analyses. L. K.: performed laboratory work, reviewed and edited the manuscript. E. M. and G. B.: collected and provided samples, commented on the manuscript. U. S.: conceived and designed the study, supervised the research, acquired funding, reviewed and edited the manuscript.
Financial support
This work was supported by funding from the Estonian Ministry of Education and Research (grants IUT20-32 and PRG1209), and by funding from the European Union's Horizon 2020 Research and Innovation programme under grant agreement No. 773830: One Health European Joint Programme (MEME project; https://onehealthejp.eu/jrp-meme/).
Competing interests
The authors declare no conflict of interest.
Ethical standards
No ethics permissions were required for the current study as all the biological material was donated to the University of Tartu (Estonia) and no biological material from animals was collected specifically for this study.


 Open access