


Obesity and chronic disease disparities within low-income communities are a major public health concern(Reference Larson, Story and Nelson1). Increased attention has been placed on the relationship between chronic disease disparities and the local food environment(Reference Walker, Keane and Burke2). The health of individuals and communities has been correlated with the quality of food accessible in the neighbourhood(Reference Black, Moon and Baird3–Reference Caspi, Sorenson and Submaranian5). Low-income communities have less access to healthy food sources, such as supermarkets and grocery stores, than higher-income neighbourhoods, which may contribute to differential rates of obesity and chronic disease(Reference Giang, Karpyn and Laurison6,Reference Mead7) .
One strategy to address these disparities has been to incentivise supermarkets to establish locations in underserved areas. However, this strategy alone appears insufficient to improve healthy food consumption in low-resource neighbourhoods(Reference Ghosh-Dastidar, Hunter and Collins8). Healthy food access is a multifaceted issue, involving more than increasing supermarket accessibility in food deserts.
Another strategy growing in popularity has been supporting the placement of farmers’ markets in areas with limited healthy food sources(Reference Young, Karpyn and Uy9,Reference Cole, McNees and Kinney10) . Farmers’ markets are attractive intervention tools because they have the potential to address multiple dimensions of healthy food access, including physical access, affordability and cultural appropriateness(Reference Caspi, Sorenson and Submaranian5). Because of flexibility and lower infrastructure requirements, they can operate in geographic locations where supermarkets may not be feasible(Reference Sadler11,Reference Ward, Slawson and Wu12) . They increase accessibility by providing healthy food shopping opportunities in places convenient to people’s daily activities, including schools, clinics, workplaces and public transit lines(Reference Grace, Grace and Becker13). They often eliminate the middlemen in sales, which increases affordability(Reference Lyson, Gillespie and Hilchey14). Additionally, many markets are working to improve access for individuals participating in the federal Supplemental Nutrition Assistance Program (SNAP), primarily through developing programs that allow SNAP participants to use their Electronic Benefit Transfer (EBT) cards at the market. This access is critical to affordability in low-income communities(Reference Colasanti, Conner and Smalley15,Reference Jones and Bhatia16) .
However, most farmers’ markets are small businesses, rather than social enterprises(Reference Hodgins and Fraser17). Markets choosing to locate in low-income communities can face greater challenges to financial viability than those targeting more affluent consumers(Reference Krokowski18). Such challenges include increased consumer price constraints and transportation barriers, cultural/racial/social-class discrepancies between market farmers and community members and a greater need for community buy-in (Reference Young, Karpyn and Uy9,Reference Colasanti, Conner and Smalley15,Reference Markowitz19) . These markets may require additional support to remain successful long term(Reference Inda, Washburn and Beckham20).
Conceptual model
Research suggests multiple factors are critical to successful farmers’ market operations in low-income communities. While prior research has focused on identifying these individual factors in market operations, these factors may be both layered and interdependent. In reviewing the literature, it appears that factors related to market success can be organised into three structured categories of market operations: foundational (related to the underlying strength of the market’s business model), operational (related to the market’s daily operations) and supplemental (including community-based activities to build consumers’ interest/skills in specific market products) (Fig. 1). Given the diversity of factors that can affect EBT program success, it may help in intervention design to view these three categories as operating within a hierarchical structure. Foundational factors may need to be addressed first, then operational and then supplemental factors. This may help to identify where limited intervention resources should be focused at a given point in a market’s EBT program development.
Conceptual model of factors impacting farmers’ market EBT program success

Foundational factors
The foundation for a farmers’ market’s success in a low-income community relies on two major variables. First is strong management. Operating a farmers’ market requires substantial business skills, effort and time commitments(Reference Ward, Slawson and Wu12,Reference Inda, Washburn and Beckham20) . This is especially true in low-income communities where profit margins may be low and additional elements must be considered, including infrastructure required to accept SNAP EBT cards(Reference Cole, McNees and Kinney10,Reference Krokowski18,Reference Roubal, Morales and Timberlake21) . It is imperative that markets have a strong individual, or team, to manage its success. Measurable qualities of strong management include having basic market operations performed by paid staff rather than volunteers, a market manager with effective business and communication skills, and business plan goals that include a commitment to increasing healthy food access among low-income communities(Reference Roubal, Morales and Timberlake21,Reference Hasin and Smith22) .
A second foundational factor is community engagement, including partnership development with public and private sectors. Partnerships are critical for farmers’ markets to address barriers and resource constraints associated with location in low-income communities(Reference Cole, McNees and Kinney10,Reference Krokowski18,Reference Buttenheim, Havassy and Fang23) . Local community organisations such as schools, churches, health centers and non-profits can provide assistance in many areas such as administrative support, financing, flexibility in location and developing deeper connections between the market and the community through market activities and outreach(Reference Inda, Washburn and Beckham20,Reference Walkinshaw, Quinn and Rocha24,Reference George, Kraschnewski and Rovniak25) . Support from governmental agencies can be used to defray costs associated with EBT acceptance. For example, farmers’ markets can apply to the USDA FNS EBT Equipment program, which provides a terminal and covers service fees for the first 3 year(26). Local governments may also have resources to offset costs associated with EBT acceptance or may provide other technical support to markets operating in low-income neighbourhoods.
Operational factors
The literature suggests that there are four major operational variables important for a successful market in a low-income community: location, products, price and marketing. Consumers often identify the convenience of the market’s location as the main appeal of a farmers’ market(Reference Grace, Grace and Becker13,Reference Colasanti, Conner and Smalley15,Reference Freedman, Vaudrin and Schneider27) . In low-income communities, markets should be centrally located, easily accessible by public transit, open during hours convenient to consumers and near other amenities such as schools, workplaces or other shopping opportunities, so shoppers may complete multiple errands at once(Reference Inda, Washburn and Beckham20,Reference DiSantis, Hillier and Holaday28,Reference Cannuscio, Hillier and Karpyn29) . Assessing both the size of the consumer base and neighbourhood competition for EBT sales should also be considered in location(Reference Buchthal, Wolff and Kittinger30). A market EBT program’s consumer base is the number of SNAP-participating households with reasonable access to the market(Reference Buchthal, Wolff and Kittinger30). The number of alternate produce markets, supermarkets and grocery stores accepting SNAP benefits in a neighbourhood may impact farmers’ market EBT sales, due to the market’s relatively limited operating hours.
Products should be tailored to the needs of the consumer base(31). This includes carrying culturally appropriate fruits and vegetables, as well as product variety so customers could complete a significant portion of food shopping at the market, rather than making multiple stops for groceries(Reference Grace, Grace and Becker13,Reference Freedman, Vaudrin and Schneider27) .
Price is a key aspect that draws, or deters, consumers from farmers’ markets in low-income communities(Reference Colasanti, Conner and Smalley15,Reference McGuirt, Jilcott Pitts and Ward32,Reference Leone, Beth and Ickes33) . Prices must be low enough to compete with other neighbourhood retail outlets(Reference Grace, Grace and Becker13,Reference Briggs, Fisher and Lott34) . Another important pricing element for farmers’ market success in a low-income community is the acceptance of federal food assistance dollars through an EBT terminal(Reference Ward, Slawson and Wu12,Reference Briggs, Fisher and Lott34) . These EBT programs, partnered with incentives such as double bucks, are especially effective for increasing market customer base sales(Reference Young, Aquilante and Solomon35–37).
Marketing increases consumer awareness of the market. Marketing materials and messages should include the location and hours of the market, along with information about parking, public transit and acceptance of EBT benefits(Reference Colasanti, Conner and Smalley15,Reference Leone, Beth and Ickes33,37) . Marketing methods may include informal methods such as environmental signage and flyers distributed through community organisations such as churches, schools, community centers, usage of social media or formal marketing such as radio ads, articles in local newspapers or television coverage(38). Marketing strategies, however, should be creatively tailored to the target audience(Reference Inda, Washburn and Beckham20).
Supplemental factors
Community education involves supplemental market-based, or market-affiliated, consumer education activities that help to increase consumer demand within the community for market products. This factor includes activities such as cooking demonstrations, taste testing, recipe cards and nutrition training(Reference Inda, Washburn and Beckham20). These activities engage customers and teach how to use produce that may be unfamiliar. New knowledge also increases the likelihood of low-income shoppers spending their limited food dollars on farmers’ market produce and supports the likelihood of new market consumers becoming return shoppers(Reference Walkinshaw, Quinn and Rocha24,Reference Dannefer, Abrami and Rapoport39) .
Study objectives
This exploratory study was performed to assess the relationship between individual variables suggested by the conceptual model and the economic success of farmers’ market EBT programs across the state of Hawai‘i.
Study setting
The current study was conducted in the state of Hawai‘i, an archipelago state consisting of seven occupied islands. The island of O‘ahu contains the state’s only large urban area, where a majority of the state’s 1·4 million residents reside. Hawai‘i is a majority-minority state, with fully a quarter (25 %) of the state’s residents identify as multiracial. Hawai‘i residents are predominantly Asian (57 %), White (43 %) and Native Hawaiian or Pacific Islander (26 %)(40). Nearly a quarter (24 %) of Hawai‘i’s population have income below 200 % of the federal poverty level, and 52 059 households receive federal food assistance in the form of SNAP benefits(41,42) . Within the state, there are ninety-five farmers’ markets, twenty-six of which accepted EBT in 2016 (Fig. 2). Most farms providing produce for markets on the islands are small, family-run operations; a majority of these farms are minority owned(43). While most farmers’ markets serve primarily their local neighbourhoods, some larger farmers’ markets located in or near tourist areas also market themselves as visitor experiences. This includes several of the largest markets in the state; however, only one of these large tourist-oriented markets has an EBT program.
Locations of farmers’ markets in Hawai‘i in 2016 with SNAP Electronic Benefits Transfer (EBT) card access. Farmers’ markets:  , with EBT;
  , without EBT

Methods
All Hawai‘i farmers’ markets authorised to have an EBT machine in 2016 were identified, and 2016 annual EBT sales data obtained from the State of Hawai‘i Department of Human Services, the agency that administers the state SNAP program. One market showed no EBT sales data for 2016, this market was removed from the data set, resulting in a final list of twenty-two markets.
This dataset was used to provide the total dollar amount of EBT reimbursements for each market for the year 2016. In Hawai‘i, all farmers’ market EBT programs operate through a centralised market booth with a single market-operated wireless EBT machine. Customers use their EBT cards to purchase scrip at this booth, the scrip may then be used to purchase SNAP-qualified foods (fresh fruits and vegetables, eggs and fish) from market vendors. Individual vendors submit the scrip to the market manager for reimbursement; the market EBT manager provides vendor training and market oversight to ensure that these redemptions follow SNAP regulations. Consequently, this dataset does not contain information on individual vendors nor does it contain information on individual transactions.
Measurable aspects of the conceptual model’s key components were identified and developed into study variables (Table 1). Data on these measures for each market were collected using three sources: (i) key informant interviews with market managers and other informants knowledgeable about individual market operations were conducted to obtain information on market operations; (ii) a Geographic Information System (GIS) spatial analysis was performed to identify neighbourhood demographics and the number of competing EBT sales venues in each market’s access area and (iii) document review, online searches of market websites, local newspaper archives and social media platforms to confirm market hours, locations, traditional media-based marketing and promotions and social media promotion.
Operationalisation of variables from the conceptual model

EBT, Electronic Benefit Transfer.
Data collection process
Key informant interviews and document reviews
An initial list of potential informants for each market was developed from the 2016 EBT vendor list and refined using contact information provided on market websites and discussions with individuals knowledgeable about individual market operations. Because of the state’s island geography, a telephone interview protocol was selected. For each potential informant, an initial contact call and up to four follow-up calls were made. If the potential key informant identified another person as more knowledgeable, contact information was obtained and contact attempts re-started with the new informant.
Nineteen key informant interviews were completed with individuals knowledgeable about specific market operations, including market managers, market staff and community agency staff involved with EBT or partnership activities at individual markets. Interviews focused on identifying market size, structure, operating hours, market advertising history, history of the market’s EBT program and EBT incentive promotions, market engagement in community partnerships and market involvement in community nutrition education programming. Community agency staff were interviewed when the market’s EBT program or market outreach/advertising programs were managed by community organisations, rather than run by the market itself.
The research team was unsuccessful in identifying or reaching an individual knowledgeable about daily market operations for three of the twenty-two markets in the state reporting EBT sales in 2016. For these markets, a review of the market’s websites and related documents, a review of contemporaneous social media and newspaper advertising archives and information provided by community agency staff located on the island and knowledgeable about the market’s operations were used to develop documentation of market size, hours, location, number of vendors, social media advertising and presence of EBT incentive programs. All other variables for these three markets were coded as missing.
Spatial analysis of market location (access and competition)
Census geography mapping shapefiles were downloaded from the US Census Bureau Maps and Data site (https://www.census.gov/geo/maps-data/) and used to develop layers that identified both census block group boundaries in the state of Hawai‘i and a point that represents the geographic center of population for each block group unit. Census block groups are subunits of census tracts and are the smallest geographic unit for which household demographic data are available from the US Census. The center-of-population is a single point that best represents the location of people’s homes within a geographic area. Demographic data on the number of SNAP participating households and the number of individuals below 200 % of the Federal Poverty Level within each census block group were downloaded from the Census American Communities Survey 5 year (2011–2017) estimates and appended to the block group center of population shapefile.
Market addresses were obtained from the USDA Local Food Directory (https://www.ams.usda.gov/local-food-directories/farmersmarkets). Because farmers’ markets can be transient, these addresses were then cross-checked with market websites, marketing materials and key informants. A GIS shapefile layer was then developed that mapped market locations as point data.
Access to the market was operationalised as the number of SNAP participating households within a reasonable distance of each farmers’ market. Reasonable distance was defined as a 1-mile radius for urban markets and a 3·8-mile service area for rural markets – the average distances consumers are willing to travel for groceries in urban and rural areas, respectively(Reference Ploeg, Mancino and Todd44). Urban area boundaries were defined as a census-designated space with a population over 50 000(45).
Spatial analysis was performed using ESRI’s geospatial processing program, ArcGIS version 10.6 (ESRI, Redlands CA). First, a 1-mile buffer using the ArcGIS buffer tool was created around each of the urban farmers’ markets. Then, using ArcGIS network analysis tool, a 3·8-mile driving-distance service area was created around each of the rural markets. The block group center of population, a single point representing providing the best estimate of household locations within a block group, was identified and linked to block group demographic data(46). Demographic data from the block groups whose center-of-population-point fell within the calculated buffer/service area for each market were used to determine the number of people below 200 % of the Federal Poverty Level and the number of households utilising SNAP benefits within a reasonable distance to the market.
To identify competition (alternate sources for SNAP purchasing within the market access area), a geospatial data layer providing the locations of all supermarkets, grocery stores (including neighbourhood markets and small ethnic markets or bodegas) and farmers’ markets accepting EBT cards was developed, and the number of competing markets falling within the buffer/service area of each market identified. Convenience stores were excluded from the current analysis as ‘competing markets’, since in Hawai‘i these venues are primarily gas-station-affiliated markets providing very limited access to fresh fruits or vegetables.
Data analysis
Market data were recorded in an Excel spreadsheet and transferred into the statistical software package IBM SPSS statistics version 23 (Armonk, NY) for cleaning and analysis. A simple univariate analysis was performed to review the data and look for outliers and missing values.
In reviewing univariate data, it was discovered that there was extreme variability in market size across the state (from 3 to 170 vendors). This variability in market size obscured the impact of all other market factors in determining sales outcomes. To control for this factor and permit comparison across markets of different sizes, the dependent variable (EBT sales dollars) was standardised to ‘EBT sales dollars per vendor’. Because ‘number of vendors’ had originally been intended to serve as a proxy measure for the variety of products in the market, the model factor products was removed from further analysis.
Exploratory bivariate analysis was then performed to identify the strength of association of each individual model variable on market EBT sales $-per-vendor. This exploratory analysis focuses on identifying the difference in mean sales  $\left( {{\mkern 1mu} {\mkern 1mu} \Delta \overline x } \right)$ between categorical market variables and the change in sales associated with each increase in unit (β) for quantitative variables. Significance testing was not performed due to the study sample’s small size (n 22) and wide variability, which limited the power of the analysis.
Results
Farmers’ markets that accept EBT in Hawai‘i are extremely diverse (Table 2). Market size ranged from 3 to 170 vendors, and EBT sales ranged from just over $500/year to nearly $500 000/year. Both of these variables had extremely broad ranges that were highly skewed in the same direction. Standardising the EBT sales outcome measure to sales per vendor reduced the SE and SD in the outcome measure substantively and resulted in market EBT sales ranging from $25 to $6460 per vendor, with a statewide median of $355/vendor.
Univariate analysis of study variables
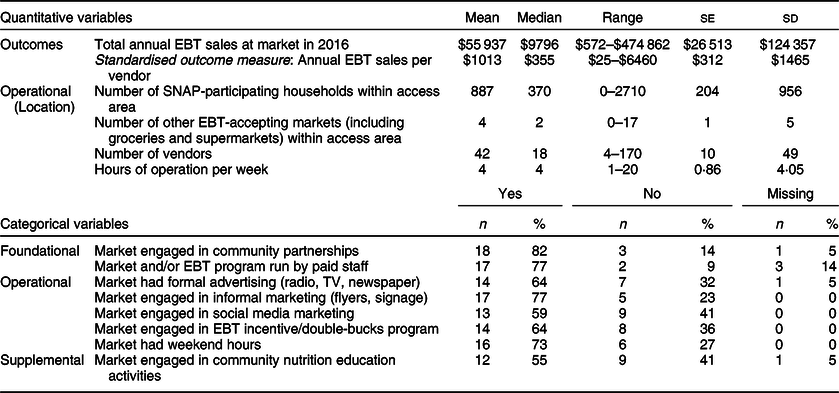
EBT, Electronic Benefit Transfer.
n 22.
The average market was open 4 h/week, and nearly three-quarters (73 %) operated on the weekend. Market hours varied widely, however, from as little as one hour/week to as much as 20 h. Market environments also varied widely in both the size of the potential customer base (number of SNAP-participating households) and competition (number of other venues where consumers could purchase fresh food using their SNAP benefits) within their access area.
Most markets used paid staff to manage market operations and EBT programs, and a majority had established community partnerships to support the market and used informal marketing (environmental signage, banners, flyers, word-of-mouth) to promote markets and their EBT programs. The majority had engaged in at least some formal marketing (radio or newspaper advertising), promoted their program through social media. Half (55 %) conducted nutrition education activities for the community, and two-thirds (64 %) had engaged in an EBT double-bucks promotion at some point during the year. Key informant interviews identified that during the 2016 year, the only formal (radio/newspaper/television) marketing conducted was a pilot project in Hawai‘i county, where community agency piloted an intermittent series of brief EBT double-bucks promotions supported by radio and newspaper advertising, and linked to multiple markets. Three Honolulu county markets conducted steady EBT double-bucks promotions through the entire year, supported by informal marketing and social media.
Impact of foundational variables on Electronic Benefit Transfer sales
The foundational variables of market strength and community partnership both showed positive associations with EBT sales (Table 3). On average, markets engaging in some form of community partnership (as defined in Table 1) averaged $852 more in EBT sales per vendor than markets that did not report partnership, and markets using paid staff averaged $31/vendor more in EBT sales than markets that did not use paid staff.
Effect of individual model components on annual EBT sales per vendor

EBT, Electronic Benefit Transfer.
* Impact calculated as the β, or change-per-unit, for quantitative variables, and as the  $\Delta \overline x {\rm{ }}$, or difference between category means, for categorical variables.
Impact of operational variables on Electronic Benefit Transfer sales
The three access and location variables were all moderately associated with EBT sales (Table 3). On average, each additional ten SNAP-participating families in a market’s access area was associated with an increase of $3/vendor in EBT sales, while each additional competing venue for EBT sales in the access area was associated with a reduction of $35/vendor in such sales. Average EBT sales per vendor increased by $137 for each additional hour that the market was open. Markets that were not open during the weekend averaged $1075 less in sales/vendor than markets with weekend hours.
Price showed a stronger association with sales. Markets that addressed price by providing double-bucks or other EBT-related price incentives during at least some portion of the year averaged $508 more in EBT sales per vendor than markets with no incentive programs.
Marketing showed surprisingly mixed results between the different marketing approaches. Vendors at markets that used social media averaged $732 more in EBT sales, and markets that used informal marketing methods averaged $290 more in EBT sales than vendors at markets that did not. However, vendors at markets that engaged in formal marketing campaigns averaged $1271 less in sales than markets that did not engage in these formal radio or newspaper campaigns.
Impact of supplemental variables on Electronic Benefit Transfer sales
Markets that engaged in nutrition education and outreach activities averaged $598 more in sales; however, the direction of this relationship is undetermined; these activities may support market profitability, or more profitable markets may be more likely to engage in supplemental activities.
Discussion
This exploratory study assessed the impact of multiple factors suggested by the literature to be important for building successful EBT programs at farmers’ markets in low-income communities. Each of the individual variables suggested by the conceptual model showed some impact on sales, but sometimes in surprising ways. Overall, the data suggest that this model may be helpful, although further tailoring of individual components may be needed.
The strong similarity between the impacts community partnership (a foundational variable) and community outreach/education (a supporting variable) had on sales per vendor at the market suggests one area for further exploration. In the current study, community partnership was loosely defined as engagement with local or county-level community organisations in the development, operation or promotion of their EBT program. The conceptual model identified community engagement as a foundational issue in market development and nutrition education activities as a supportive consumer-education tool for building product sales. However, the results suggest that these factors may be interrelated, and these two variables might instead be seen as components of the same foundational element: community engagement. Markets with community partnerships may view nutrition education and consumer outreach as integral to their partnership activities, and these partnerships may also provide the market with resources for educational activities. Other studies have demonstrated that both SNAP-oriented programming and overt linkage with SNAP and WIC programs increase SNAP participants’ purchases at farmers’ markets, suggesting that these interlinked factors have the potential to substantially impact EBT sales(Reference Grace, Grace and Becker13,Reference Walkinshaw, Quinn and Rocha24) .
It should, however, be noted that in other states community engagement can include engagement with county or local health departments; this partnership could not be assessed in the current study because Hawai‘i has no county- or city-level health departments. The Hawai‘i State Department of Health (HDOH) does not work directly with individual farmers’ markets or EBT programs, but instead supports coalition development and capacity-building for nonprofit organisations working in diverse areas of healthy food access.
All of the proposed operational variables showed some association with market sales, but not always in the expected direction. The positive impact of both social media usage and informal marketing may suggest that social media, word-of-mouth and environmental print could be effective ways to promote EBT sales at farmers’ markets. Other studies have found that environmental print is more effective than newspaper advertising for reaching low-income audiences with health messaging and that internet-based advertising and social media are increasingly viable methods for reaching low-income populations(Reference Buchthal, Doff and Hsu47,Reference Skizim, Sothern and Blaha48) . Future studies might assess whether this type of outreach is associated with a greater sense of community connectedness with the market; particularly given that in the current study the impact of social-media-based outreach appeared greater than the impact of price (double-bucks promotions) on sales. However, in reviewing these markets’ social media promotions, an emerging issue with tourism was identified that may complicate this relationship in areas with tourism-driven economies. A number of markets with EBT programs were observed using social media to promoting the market as a tourist activity. It would be instructive to observe how this emerging issue affects the market’s atmosphere, vendor and product mix and market pricing. The impact of tourism could go in either direction; it could support market operations and enrich the market experience, but it could also make the market less comfortable for lower-income and ethnic minority shoppers(Reference Larimore49,Reference Buman, Bertmann and Hekler50) .
The negative impact of formal media marketing on sales was surprising and may be an artifact of the limited and sporadic use of formal media for farmers’ market EBT promotion during the study year. In 1996, only one pilot media campaign occurred, this campaign was linked to an intermittent double-bucks program targeting small markets in a rural part of the state.
The results on the locational variables suggested that these factors could be important to assess. While geographic proximity to SNAP participants’ homes was important, ease of access (the number of hours the market is open and having weekend v. weekday only hours) and the amount of competition in the neighbourhood from other EBT-accepting groceries and supermarkets also appeared to affect market EBT sales. These results are consonant with other studies finding that market shopping trips tend to be woven into other aspects of people’s days(Reference Cannuscio, Hillier and Karpyn29).
Given the necessarily limited hours and product variety of farmers’ markets, it may make sense to target support for EBT programs to areas where there are fewer opportunities for SNAP participants to shop for fresh produce, and thus less competition. Residence in areas with few healthy food alternatives is associated with poorer health outcomes overall, suggesting that targeting EBT program support to markets in underserved and rural areas makes sense for improving EBT program viability while addressing disparities(Reference Black, Moon and Baird3).
Further exploration of market size and structure variables is warranted. One factor that clearly needs further exploration is that of market variety. Number of vendors was initially assessed in the current study as a proxy for market variety. The current study did not report the impact on sales for each additional vendor at the market because in this small dataset both EBT sales and number of vendors were highly skewed, and the 95 % CI around the assessment of the change in sales for each additional vendor was so broad as to render the data uninterpretable. It would be useful to reassess this factor in a region with more farmers’ markets, or where the farmers’ market size and sales do not show such an extreme range.
In the current study, market size/variety was defined simply as the number of vendors overall. However, in reviewing market websites and materials, it was evident that market vendor types varied widely by market. At larger markets and those with longer weekend hours, prepared foods, crafts and services appeared to make up a large proportion of vendors. It would be useful to know whether the presence of non-food vendors increases, or decreases, EBT program viability. Non-food vendors could be either a positive or a negative impact on EBT sales – by increasing the perceived convenience of the market through providing access to additional shopping/entertainment/errand-running opportunities, or by increasing a sense of discomfort among low-income populations, creating a perception that the market is primarily for upper-income or tourist populations(Reference Grace, Grace and Becker13,Reference Freedman, Vaudrin and Schneider27,Reference Mack and Tong51) .
Limitations
Although the current study included every market in the state with an EBT program active during the study period, the small sample size rendered the power of the analysis too low for reliable statistical inference testing. Because of this, the analysis was focused on determining the effect size of each of the individual variables. As such, the current study should be viewed as an exploratory study, and the generalisability of the results may be limited.
Community collaboration was loosely specified in the current study as formal or informal collaborations with community agencies for the purpose of promoting or operating the market’s EBT program, or conducting market outreach to low-income consumers in the community. These results could vary if collaboration is defined more narrowly.
Because Hawai‘i has no city or county health departments, and the state health department does not work directly with individual farmers’ markets, it is not possible to assess the impact of collaboration with these types of organisations, which may play a more prominent and stable role in supporting farmers’ market EBT programs in other states.
The effect of the operational strength variable on market sales may have been affected by the specific measure used, since the ability to rely on paid staff (rather than volunteers) to manage core market and EBT operations captures only one aspect of a market’s operational structure, but was used to provide an overall assessment of the stability and strength of market management. This measure, however, while imperfect, is critical to EBT program operations and reflects the type of operational information readily accessible to organisations seeking to identify farmers’ markets where EBT programs have the greatest likelihood of success.
Due to the geography of the state and the limited resources for the current study, site visits to each of the individual markets were not conducted; this limited the ability to assess product variety.
Conclusion
This small, exploratory study suggests that the success of a farmers’ market EBT program may be driven by the interrelated foundational and operational factors suggested in the conceptual model. Replication of this research in a larger state, or across a regional area with a greater number of farmers’ markets with EBT programs, could be instructive in further assessing the viability of this model.
Programs seeking to increase access in low-income communities by encouraging and supporting EBT access at farmers’ markets may want to look closely at the factors that are foundational to market operations, such as the market’s level of community engagement, and the size of the consumer base and amount of competition in the market area, since these may be associated with the level of EBT sales(Reference Mack and Tong51,Reference Freedman, Vaudrin and Schneider52) . The current study also suggests that consistent informal marketing through environmental signage and social media could have a substantial impact on sales; this may be a fruitful area for technical assistance and support to aid the financial sustainability of EBT programs at markets that have the foundational elements for success.
Acknowledgements
Acknowledgements: This project was made possible with the support and assistance of Daniela Kittinger of the Appleseed Foundation, Ginet Hayes of the Hawai‘i Department of Human Services SNAP-Ed Program and the Chronic Disease Prevention and Health Promotion Division of the Hawai‘i Department of Health. The authors are indebted for their partnership, guidance and support for this project. Financial support: This research received no specific grant from any funding agency, commercial or not-for-profit sectors. Conflict of interest: None. Authorship: G.W.: Drafted the background and portions of the methods sections, developed the conceptual model and study measures, performed the data collection and GIS spatial analysis and reviewed the final manuscript. D.N-H.: Provided feedback on the development of the conceptual model, participated in the study design and analysis and reviewed and edited the manuscript. O.B.: Responsible for initial development of the project, provided feedback on the development of the conceptual model and study measures, designed the study methodology, oversaw Ms. Wolff’s data collection activities, analysed the data, drafted the methods, results, and discussion sections and edited the final manuscript. Ethics of human subject participation: The current study was conducted according to the guidelines laid down in the Declaration of Helsinki. All procedures were reviewed by the University of Hawai‘i at Mānoa Institutional Review Board, who determined that the current study was not human subjects research, since it involved only the analysis of publicly available data and the collection of information solely on business operations. No personal data were collected from key informants during the data collection process.


