


Depression is common in chronic medical conditions and is associated with poorer quality of life, greater mortality, and increased service use and care costs. Reference Simon1,Reference Katon and Ciechanowski2 Depression has an estimated global prevalence of around 26 to 39% in chronic kidney disease (CKD), Reference Adejumo, Edeki, Sunday Oyedepo, Falade, Yisau and Ige3 and is associated with increased mortality among patients receiving haemodialysis. Reference Farrokhi, Abedi, Beyene, Kurdyak and Jassal4 However, depression is often under-recognised and under-treated in dialysis patients. Reference Chilcot, Wellsted, Da Silva-Gane and Farrington5,Reference Watnick, Kirwin, Mahnensmith and Concato6 The implementation of evidence-based guidance to assess and treat depression for those on dialysis is inconsistently applied. Reference Chilcot, Pearce, Hall, Busby, Hawkins and Vraitch7 There are many potential explanations for this:
-
(a) Somatic symptoms are common in depression and in chronic medical conditions, so evaluating their diagnostic significance requires care.
-
(b) CKD is associated with advancing age and comorbidities including hypertension, cardiovascular disease and diabetes. Reference Kovesdy8 Each of these adds to the risks of depression, and can create diagnostic uncertainty.
-
(c) The adverse effects associated with pharmacotherapy may deter their use despite evidence of benefits. Reference Qammar, Azeem, Kumar, Kumari, Hassan and Khurram9–Reference Musolino, Presta, Cianfrone, Errante, Andreucci and Coppolino14
-
(d) In routine care, a diagnosis is usually made by clinical assessment or through screening measures, rather than detailed structured assessments. Each approach has strengths and weaknesses. Reference Watnick, Wang, Demadura and Ganzini15 Furthermore, liaison psychology or psychiatry services offering detailed assessment may not be accessible to all.
-
(e) Diagnostic uncertainty can arise from the complex interplay of social and psychological factors. Depression is more common among people experiencing adversity, traumatic life events and discrimination, aligned more with eco-social rather than individual biomedical models of illness. Reference Wang, Feng, Fang, Lv, Sun and Yang16–Reference Hackett, Ronaldson, Bhui, Steptoe and Jackson19 Social adversities and inequalities are also common in people undergoing dialysis. Reference Chilcot, Wellsted, Da Silva-Gane and Farrington5,Reference Stein, Cox, Afifi, Shay-Lee and Jitender20–22
-
(f) When assessing ethnically diverse populations, there is a greater chance of under-estimating levels of depression. For example, among South Asians the symptoms of depression may be influenced by idioms of distress, literacy and cultural expectations; depressive symptoms often present in less intense ways. Reference Bhui, Bhugra, Goldberg, Sauer and Tylee23 Some research suggests screening measures operate differently across ethnic and cultural groups. Reference Bhui, Bhugra and Goldberg24–Reference Sharma, Norton, Bhui, Mooney, Caton and Bansal26 Consequently, comparison of assessment methods may help guide clinicians in careful diagnosis.
There is evidence of poorer outcomes of ESKD by race or ethnicity, although this evidence is inconsistent and contested. Reference Tuot, Lin, Norris, Gassman, Smogorzewski and Ku27,Reference Schouten, Haverkamp, Loosman, Chandie Shaw, van Ittersum and Smets28 At the same time, minority ethnic groups and those living in precarity are known to be under-represented in research generally and in research on chronic medical conditions, Reference Pardhan, Sehmbi, Wijewickrama, Onumajuru and Piyasena29,Reference Kayani, Willis, Salisu-Olatunji, Jeffers, Khunti and Routen30 leading to calls for more research on ethnicity, co-occurring medical conditions and an array of psychosocial influences. Reference Rifkin31
This research aims to:
-
(a) estimate the prevalence of ICD-10 diagnoses of moderate to severe depression in ethnically diverse patients with end-stage kidney disease receiving dialysis in a large, urban haemodialysis service;
-
(b) compare the estimates of depression on routinely used and validated screening instruments with an ICD-10 diagnosis of moderate to severe depression;
-
(c) consider eco-social models of illness, and test relationships between psychosocial adversities (life events and discrimination), co-occurring medical conditions, demographics (age, sex and ethnicity) and respective risks of moderate to severe depression.
Method
Barts Health provides care for people of diverse ethnic backgrounds in one of the most deprived parts of the country. The renal service at Barts Health NHS Trust runs in haemodialysis units at hospitals in Northeast London and Essex in the UK (including the Royal London Hospital, Newham General Hospital, King George’s Hospital, Queens Hospital and Whipps Cross Hospital), as well as a large home haemodialysis service.
After sharing information about the study, and seeking advice about suitability from their clinicians, patients providing written informed consent were interviewed and their clinical records were reviewed. Patients were recruited while attending dialysis and were free to withdraw from the study at any point. Included patients were attending in-patient dialysis and approved to participate by clinicians following preliminary discussion with the patient to indicate willingness, ability to participate and judged to have capacity.
Three hundred patients receiving maintenance haemodialysis under the care of Barts Health NHS Trust were interviewed between October 2021 and September 2022. This was a convenience sample of those admitted for dialysis. We identified that 62 patients refused and 22 did not meet inclusion criteria (severe illness, frailty, marked language difficulties). Overall, this gives us a response rate of 82.8% of eligible patients across centres (see Supplementary material A (available at https://doi.org/10.1192/bjo.2026.11039) for response rates by recruitment centre).
The authors assert that all procedures contributing to this work comply with the ethical standards of the relevant national and institutional committees on human experimentation and with the Helsinki Declaration of 1975, as revised in 2013. All procedures involving human subjects/patients were approved by Health Care Research Wales (reference 19/LO/1272; IRAS project ID 256696). Queen Mary University of London was the sponsor.
Interview data
In the interview, we asked about demographics, social adversities and mental health status. Additional clinical data were extracted from care records.
Demographics
The interview questions include age, sex, ethnicity (White British, South Asian, Black including Black British, Black African, Black Caribbean and Other), occupation (unemployed, employed, retired, student, working as housewife, off sick from work, other) and education (none, primary and secondary school attendance with or without completion, degree or apprenticeship level or higher, or Other meaning any other courses not formally recognised in the aforementioned categories that may be relevant to education in different countries). We also asked about marital status and smoking and alcohol use.
Discrimination and life events
Experiences of discrimination in the previous 12 months were assessed using 5 questions from the EMPIRIC study, including experience of unfair treatment at work, job refusal, physical attack, property damage or racial insults. Reference Bhui, Stansfeld, McKenzie, Karlsen, Nazroo and Weich18 A 12-item measure of threatening life events in the previous 12 months was completed. Subjects were asked if they had experienced serious illness, injury or attack; a close relative suffering serious illness, injury or attack; the death of a parent, child or spouse; the death of a close family friend; the end of a significant relationship; serious problems with neighbours, a close friend or relative; unemployment or seeking work unsuccessfully for a month; loss of work; a major financial crisis; problems with the police or courts; or loss or damage to something they valued. Reference Brugha and Cragg32
Depression measures
We evaluated the 2-item version of the Patient Health Questionnaire (PHQ2), Reference Giuliani, Gorini, Barbieri, Veglia and Tremoli33 the 17-item version of the Hamilton Depression Rating Scale (HAMD) Reference Hamilton34 and the depression items of the Clinical Interview Schedule-Revised (CIS-R) Reference Lewis, Pelosi, Araya and Dunn35 required for classification of ICD-10 diagnoses. We used an algorithm for the CIS-R items to make ICD-10 diagnoses of depression (see Supplementary material B): no depression, mild depression, combined moderate and severe depression. The algorithm to generate ICD-10 diagnoses was that used in the EMPIRIC study Reference Sproston and Nazroo36 and the Office of National Statistics’ Adult Psychiatric Morbidity Survey (2014), Reference McManus, Bebbington, Jenkins and Brugha37 with re-routing of questions to avoid repetition of items and to minimise questionnaire length. We combined diagnostic groups with or without somatic symptoms (the breakdown by sex is available in the Supplementary material C). Of note, some of the appetite, weight and social impairment symptoms items of the CIS-R were felt to be so common to all dialysis patients when piloting the questionnaires, so to avoid diagnostic confusion, these items were not asked or scored. These items, we felt, were inappropriate as nutrition and appetite are affected by dialysis, inflammation, or depression. Reference Salazar-Robles, Lerma, Calderón-Juárez, Ibarra, Pérez-Grovas and Bermúdez-Aceves38 We did not ask the impairment question, as all dialysis in-patients’ dialysis were impaired in daily function and routine. This also meant we were able to balance the items needed for a confident diagnosis of depression versus demands made of frail patients undergoing dialysis at the time of the interview.
The interview was undertaken by an experienced post-doctoral clinical psychologist aware of the common symptoms and presentations of depression (C.C.). Derived diagnoses of depression were aligned with C.C.’s clinical judgement. We also assessed depressive symptoms based on conventional thresholds for common validated screening instruments that are used in routine clinical practice and research (PHQ2, threshold of 3 or more; threshold HAMD, threshold of 19 or more). Specifically, the PHQ2 was already in use in the clinical services as a short and practical measure of depression to alert clinicians to consider depression support.
Clinical data gathered from electronic records included type of dialysis, comorbidities (hypertension, diabetes types 1 and 2, obesity, cardiovascular disease, current or past cancer, obesity, chronic obstructive airways disease, autoimmune disorders) and a previous record of seeing a specialist for mood disorder.
Data management and statistical analysis
Data were extracted from clinical records, linked to patient interviews, anonymised, stored in Excel and analysed in Stata version 16.1 (by K.B.; https://www.stata.com). The ICD-10 codes were generated in R version 4.3.3 (by C.C.; https://posit.co/download/rstudio-desktop; see Supplementary material B for algorithms and code).
Cohort description by overall and by sex and ethnic group
First, we examined demographic characteristics, social variables such as discrimination and life events overall and then by sex. We classified depression as ICD-10 diagnoses of mild depression and of moderate or severe depression, and by binary measures of depression on screening instruments (PHQ2 score ≥ 3; and HAMD score ≥ 19). We assessed demographics by depression and long-term medical conditions, overall and by sex. We then examined the same variables by ethnic groups.
Statistical associations with ICD-10 diagnosis of moderate or severe depression
The approach to statistical analysis was framed within eco-social and syndemic models of illness, whereby many contextual and individual variables can interact. Therefore, we undertook data reduction to restrict more complex models to relevant variables of sufficient quality.
In cross-tabulations, we applied chi-squared statistics and Fisher’s Exact test where cell values were less than 5. We ran separate stepwise backward logistic regression models for the following three blocks of variables, retaining those that were associated with depression at p < 0.1 level, for a final fully adjusted model.
-
Block 1: Demographics: age, sex, marital status, education, occupation, alcohol and smoking.
-
Block 2: Psychosocial variables: life events and discrimination items.
-
Block 3: Long-term conditions (hypertension, diabetes, chronic obstructive pulmonary disease, cardiovascular disease, obesity, current or past cancer, autoimmune disorders).
Variables associated with depression at p < 0.1 were entered in a full regression model, assessed for model fit by R 2 value, and noting significant variables if associated at p < 0.05 level.
Results
Cohort description by sex and ethnicity
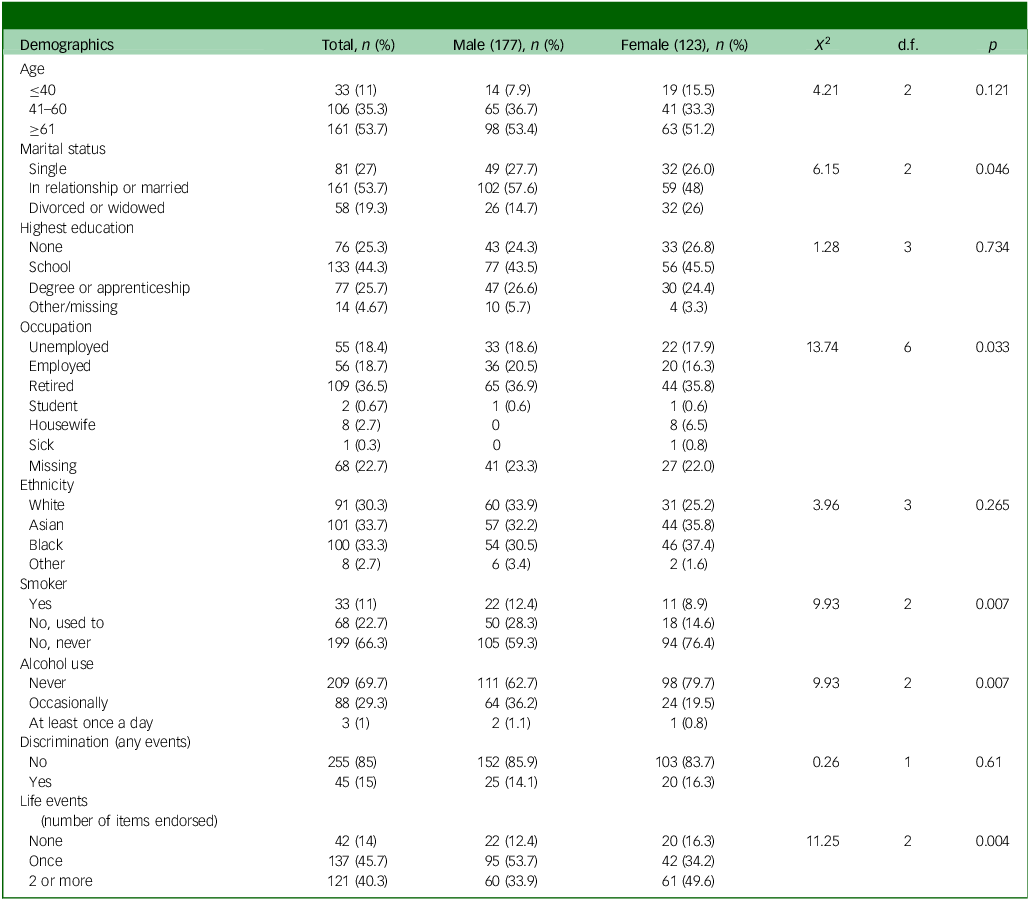
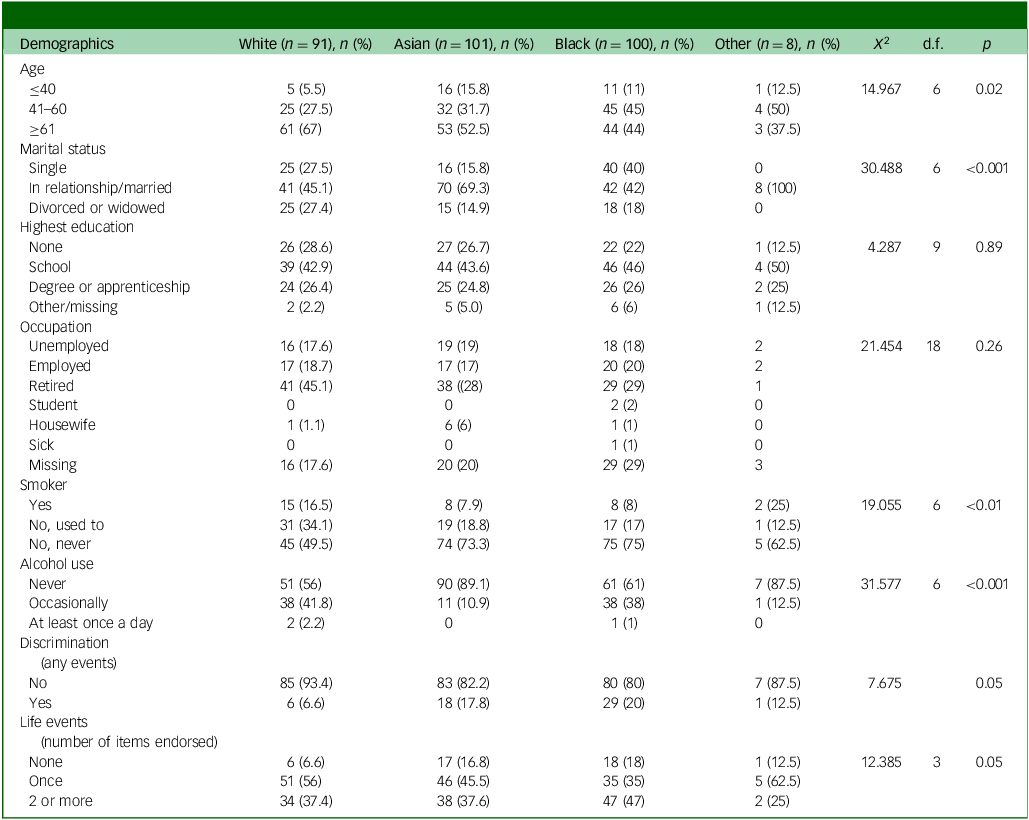
The sample’s characteristics are shown overall and by sex (Table 1), and then depression and co-occurring medical conditions are shown overall and by sex (Tables 1 and 2). The same variables are then shown by ethnicity (Tables 3 and 4). Men were more likely to be married, employed, current or past smokers and consumers of alcohol than women. Women were more likely to have adverse life events than men. The South Asian and Black groups were younger than the White British group. The White British group was more likely to smoke and drink alcohol. The Black and South Asian groups were more likely to have experienced discrimination. Black people were more likely to be single. South Asians were most likely to be married.
Demographics and social characteristics: overall and by sex

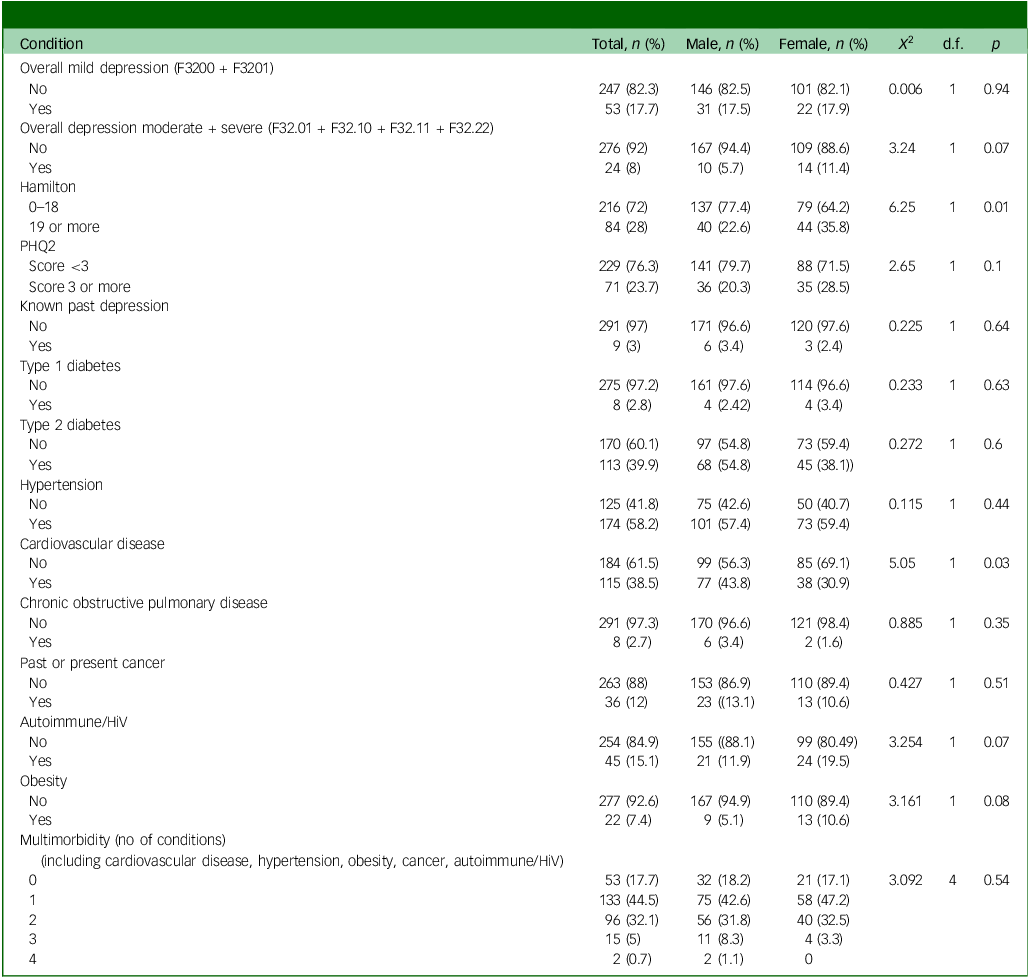
Health: overall and by sex

PHQ2, Patient Health Questionnaire.
Demographic and social conditions by ethnicity

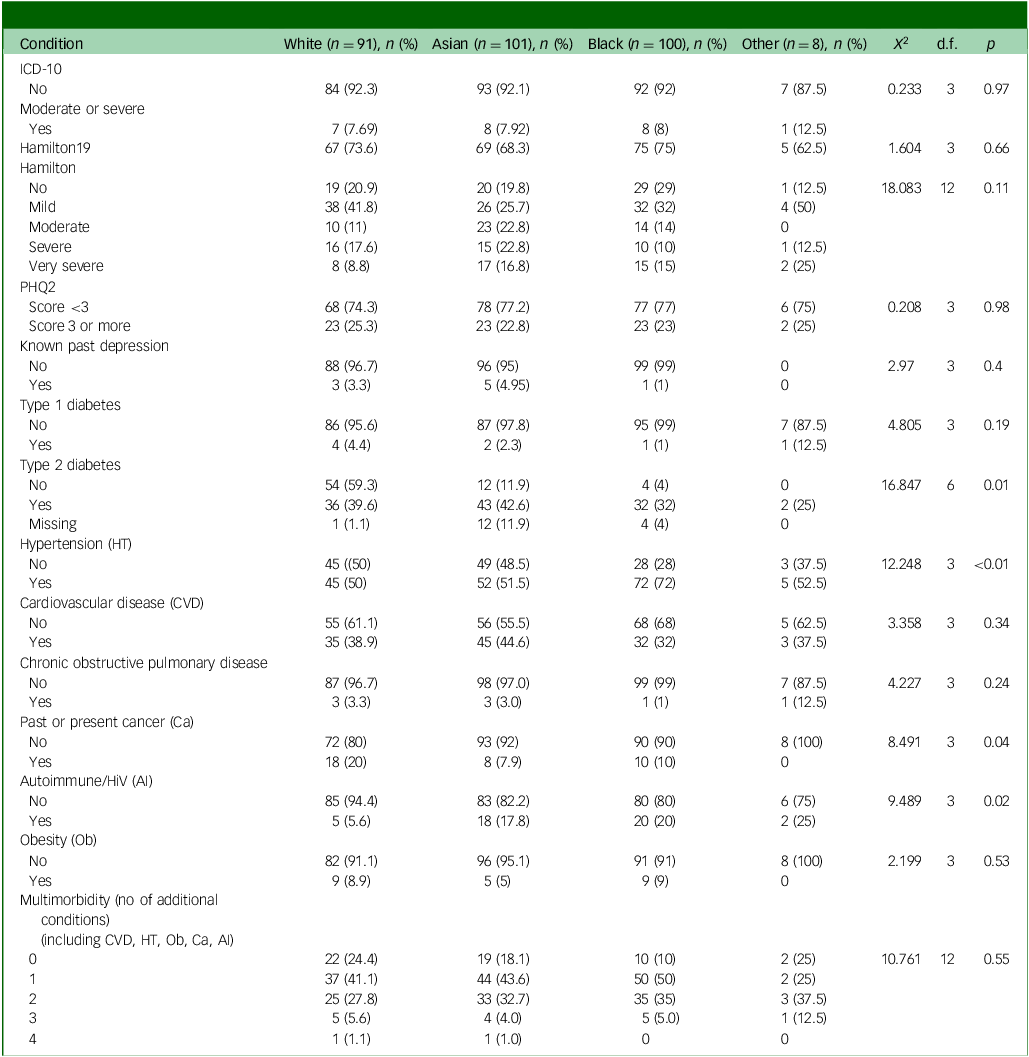
Health by ethnicity

PHQ2, Patient Health Questionnaire.
Health status
Overall and by sex (Table 2)
The ICD-10 diagnoses of depression reported included mild depression (n = 53) and moderate or severe depression (n = 24). The overall level of moderate or more severe depression was 8% (95% CI: 5.2–11.7; n/N = 24/300). Only 9 of the 300 (3%, 95 CI 1.4–3.6) had a history of seeking help for depression noted in the electronic records. There was a non-significant trend by sex, with women having a higher prevalence of moderate or severe depression (11.4 v. 5.7%). This seemed to be accounted for mainly by moderate or severe depression with somatic symptoms, see Supplementary material C).
Looking at the screening instruments for depression, on the HAMD, 22.6% of men and 35.8% of women scored above the moderate or more severe threshold (scoring 19 or above); on the PHQ2, 20.3% of men and 28.5% of women scored above the threshold score of 3 or more. Women were more likely to be classified as having very severe depression symptoms when assessed by the HAMD (score of 19 or more). Men were more likely to have cardiovascular disease. There were no other sex differences for medical conditions.
Ethnicity (Table 4)
Ethnicity was not associated with depression on any of the screening measures or ICD-10 depression diagnoses. The South Asian group was most likely to have type 2 diabetes, followed by the White British group. The Black group was the least likely to have type 2 diabetes. Hypertension was most common in the Black group. The White British group were most likely to have had or have cancer at the time of the interview. Autoimmune disorders were least common among the White British group. There were no other differences by specific condition or by levels of multi-morbidity.
Univariate associations with ICD-10 diagnosis of moderate or severe depression
Block 1: Of all the demographic factors entered in stepwise backward logistic regression models (at p < 0.1 level), education and sex were retained. Compared with the reference group of those completing school, those having attended university or apprenticeships had a lower risk of depression (odds ratio 0.28, 95% CI: 0.08–0.98, p = 0.05), as did those who did not complete schooling (odds ratio 0.27, 95% CI: 0.08–0.94, p = 0.04). There was a trend for women to be more likely to have depression: odds ratio 2.14, 95% CI: 0.92–5.00, p = 0.07)
Block 2: Discrimination did not associate with depression. Three life events were associated with depression: loss of parent, spouse or child: odds ratio 5.05, 95% CI: 1.94–13.13, p < 0.01), marital separation (odds ratio 10.03, 95% CI: 1.89–53.08, p < 0.01) and facing major financial difficulties (odds ratio 3.66, 95% CI: 1.42–9.46, p < 0.01).
Block 3: Of long-term conditions, three were retained: obesity (odds ratio 3.89, 95% CI: 1.17–12.97, p = 0.07), COPD (odds ratio 5.25, 95% CI: 0.94–29.26, p = 0.06) and type 2 diabetes (odds ratio 2.53, 95% CI: 0.93–6.85, p = 0.07).
Multivariate logistic regression showing associations with moderate or severe depression
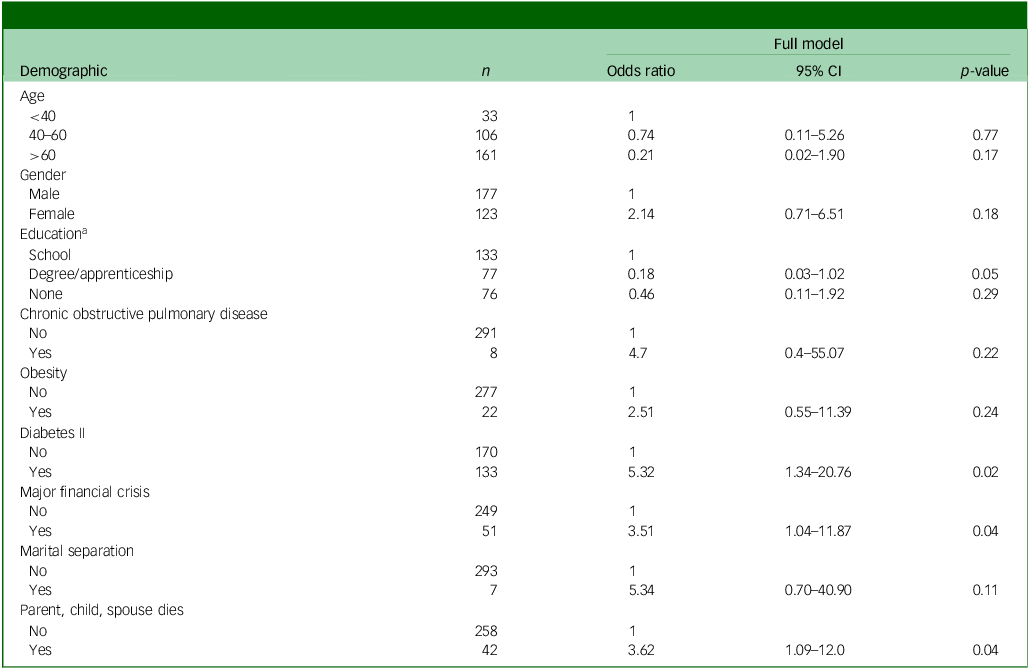
The variables identified in the three blocks of backward stepwise regression models were entered into a multiple logistic regression model. We included age and sex to address the risk of residual confounding. The full regression model included educational level, traumatic life events (loss of parent, child, or spouse; major financial difficulties, marital difficulties) and chronic conditions (type 2 diabetes, obesity and COPD). Table 5 shows the full model, highlighting those reaching p ≤ 0.05: higher odds of depression was found among those with type 2 diabetes, those facing major financial crises and those who had experienced the loss of a parent, child or spouse. Lower odds of depression were found among those with university versus school-level education.
Final logistic regression models: associations with moderate or severe depression

N = 271, X 2 (d.f. = 10) = 41.20, R 2 = 0.0.29, p < 0.0001.
a. School set as reference as it is the largest group.
Discussion
Depression is considered to be common in ESKD, a poor prognostic indicator, yet assessment and treatment is inconsistent. Reference Chilcot, Pearce, Hall, Busby, Hawkins and Vraitch7 There is emerging evidence of benefits from antidepressants, psychological therapies and psychosocial interventions in patients living with CKD. Reference Wichart, Yoeun, Chin, Evernden, Berendonk and Kerr12,Reference Chahal, Saini, Bansal, Arora, Bansal and Saini39 Despite this, sometimes the treatment of depression in ESKD is contested on grounds of limited effectiveness and concerns about adverse effects in a frail patient population. Reference Pearce, Hall, Hudson, Farrington, Tucker and Wellsted11,Reference Wichart, Yoeun, Chin, Evernden, Berendonk and Kerr12
Our main finding is that an ICD-10 diagnosis of moderate or severe depression, which warrants assertive treatment, is not as common as is usually proposed in the ESKD population. For example, we found a prevalence of 8%, whereas a careful meta-analysis reported a prevalence of 22.8% using structured diagnostic criteria. Reference Palmer, Vecchio, Craig, Tonelli, Johnson and Nicolucci40 Our estimated prevalence of 8% is only twice that found in studies of the general population. Reference Charlson, van Ommeren, Flaxman, Cornett, Whiteford and Saxena41
Furthermore, screening and symptom measures which are used in clinical services (such as the HAMD or PHQ2 scores) grossly overestimate the prevalence of depression, so should always be followed by either a clinical assessment or a structured instrument. Reference Palmer, Vecchio, Craig, Tonelli, Johnson and Nicolucci40 We highlight the importance of following up patients screening positive for depression with more accurate diagnostic assessments. The targeting of depression interventions to moderate or severe depression assessed by clinicians may help improve the risk–benefit ratio for these therapies.
Our findings suggest that financial strain and loss events are additional and important factors associated with depression. Therefore, holistic interventions (including, for example, practical financial advice and psychological support) are important aspects of care and future interventions including support for these will require further evaluation. Type 2 diabetes was also an important correlate of moderate to severe depression. Consequently, future studies could consider tailored interventions and care pathways for diabetic patients. Although there are concerns about the validity of structured and screening instruments in ethnically diverse populations, Reference Bhui, Bhugra, Goldberg, Sauer and Tylee23,Reference Bhui, Bhugra and Goldberg24,Reference Sharma, Norton, Bhui, Mooney, Caton and Bansal26 we did not find ethnic differences in the levels of depression. These findings encourage an individual and person-centred approach, taking account of factors relevant to each person’s biography and lived experiences of adversity and developing poor health.
Limitations and strengths
The study was undertaken during the early phases of the COVID-19 pandemic, and this restricted access to the most vulnerable patients, potentially skewing results. Our measure of depression was based on the CIS-R, which is a well-established structured tool, which may have underestimated the true prevalence of depression in the highly diverse, deprived and urban population included in this study, and perhaps warrants more development in renal populations, although it has been previously tested in ethnically diverse samples. Reference Sharma, Norton, Bhui, Mooney, Caton and Bansal26 Against this, the CIS-R was being applied by an experienced clinical psychologist who could make judgements about the symptom endorsement, and who applied the algorithm in accord with guidance from the EMPIRIC study of ethnically diverse population samples which has been validated in similar contexts. Reference Sproston and Nazroo36,Reference Weich, Nazroo, Sproston, Sally, Martin and Bob42 Our algorithm excluded questions about appetite, weight loss and impairment, given that these, we found, were universally endorsed and difficult sometimes to discern diagnostic significance. This might have led to underestimates of diagnosed moderate or severe depression. We considered whether our careful exclusion of diagnostically confounding symptoms (e.g. appetite, weight and social impairment) might lead to underestimation of diagnosis. In a post hoc sensitivity analysis, we re-ran the algorithm as if each of these were considered present. For combined moderate and severe depression, we found 54 cases instead of 24, suggesting a prevalence of 18%, which is still much less than previous prevalence studies, even using structured instruments. It is critical to consider whether depression treatments should be targeted only following a structured instrument rather than screening instruments, and after excluding appetite, weight and social impairment symptoms. These confounding symptoms may explain the over-estimation of prevalence in previous studies and the reluctance of clinicians to treat depression in dialysis.
In our final models, women, the presence of obesity, and marital separation showed higher odds ratios but did not reach conventional levels of significance. However, these may still be important when considering personalised care and future research. We acknowledge the wider confidence intervals and smaller numbers of people with depression overall, and this may have reduced the power to detect importance differences; larger clinical samples and secondary analysis of population data may offer replication and more precise estimates. The original study design was to recruit up to 600 patients based on estimates of 350 existing patients and 250 new patients each year, whereby the recruitment period was to run over a year. However, the study was undertaken just as the COVID-19 pandemic led to a shutdown of all research studies, especially for vulnerable groups. Hence, we recruited as many patients as possible within the study period, and even after the pandemic, access was restricted for some time for vulnerable patients.
We did not assess pathways into care, and whether patients had received health promotional material or support prior to dialysis. This might be a useful approach for future research to identify preventive opportunities for depression and CKD.
Implications
We report much lower prevalence of moderate or severe depression than has previously been reported in patients with ESKD receiving maintenance haemodialysis. We highlight the importance of following up patients with positive screening tools with more accurate diagnostic assessments, excluding appetite, weight and impairment questions. Future work should develop and test complex multi-component interventions to support ESKD patients facing financial difficulties, multiple losses events and bereavements, and those with other chronic conditions, especially type 2 diabetes.
Supplementary material
The supplementary material is available online at https://doi.org/10.1192/bjo.2026.11039
Data availability
The data is still undergoing analysis, but we welcome collaborations and suggestions for secondary analysis. The original ethics approval was not for secondary analysis, so further approvals would be required for non-intended analyses. We welcome collaborations to replicate and improve the methods, and the data are available for all reasonable requests.
Acknowledgements
With many thanks to Barts Health and all the patients who participated with generosity and a desire to see the care system improve. To Barts Charity for funding: project grant G-001414 to K.B.
Author contributions
K.B. is the principal investigator and conceived the study with M.M.Y., L.A.C. and K.M. S.R. and C.C. are researchers who contributed to data collection and management. K.B. undertook the analyses. G.M.H. supervised S.R.’s PhD with K.B., using data from the study. K.B. wrote the paper and received comments from all authors and revised the paper. D.R., S.K. and K.M. are local clinical researcher leaders and contributed to data collation and revision of the paper. B.G. and F.L. are public/patient experts by experience, offering experience in data and perspectives and guidance throughout the study. All authors were involved in the Intrepid study of which this is one output.
Funding
The study was funded by Barts Charity G-001414.
Declaration of interest
K.B. is Deputy Editor of BJPsychOpen, but played no part in the decision-making for this paper. The authors have no other competing interests that might be perceived to influence the results and/or discussion reported in this paper.


 Open access
eLetters
No eLetters have been published for this article.