

1. Introduction and background
The regional dialects of England and the British Isles present the most fruitful location for studying regional variation in English given that “geographical differentiation of local accents is densest in those places which have long been settled by English-speaking populations” (Wells, Reference Wells1982:10). This paper presents the results of a British English dialect survey with data taken from a study spanning seven years and comprising 14,438 respondents and thirty-seven linguistic variables, demonstrating the status of regional dialect variation in Great Britain today.
Our study follows a long line of tradition by surveying respondents on their use of a range of lexical, phonological, and morphosyntactic variables (Cheshire, Edwards & Whittle, Reference Cheshire, Edwards and Whittle1993; Maguire, Reference Maguire2012; Orton, Reference Orton1962; Wieling, Upton & Thompson, Reference Wieling, Upton and Thompson2014). The most famous of our precursors is the Survey of English Dialects (henceforth SED; Orton, Reference Orton1962), in which fieldworkers collected questionnaire data for 1,300+ items from nonmobile older rural males in 313 localities across England in the 1950s. As will be explained further in Section 3, we regularly compare our findings to this traditional dataset collected seventy years ago. Other surveys have been conducted since the SED, with a range of focuses from morphosyntactic (Cheshire et al., Reference Cheshire, Edwards and Whittle1993) to lexical (Vaux & Jøhndal, Reference Vaux and Jøhndal2009) and phonological (Maguire, Reference Maguire2009). This long history of dialectology studies in England and the British Isles has more recently been updated by mapping studies that use modern technology, such as mobile phone apps (Britain, Blaxter & Leemann, Reference Britain, Blaxter and Leemann2020; Jansen, Robinson, Cahill, Leemann, Blaxter & Britain, Reference Jansen, Robinson, Lynne Cahill, Blaxter and Britain2020; Kirkham, Turton & Leemann, Reference Kirkham, Turton and Leemann2020; Leemann, Kolly & Britain, Reference Leemann, Kolly and Britain2018), Twitter (Grieve, Montgomery, Nini, Murakami & Guo, Reference Grieve, Chris Montgomery, Murakami and Guo2019) and machine-learning techniques (Strycharczuk, López-Ibáñez, Brown & Leemann, Reference Strycharczuk, López-Ibáñez, Brown and Leemann2020).
The survey presented in the current paper elicits responses from throughout the linguistic grammar: phonological variation (e.g., “Do foot and cut rhyme for you?”), morphosyntactic variation (e.g., “Would people from your area use the sentence,‘You was outside when it happened’?”) and lexical variation (e.g., “What do you call the evening meal?”). In doing so, we make a number of contributions to the literature on British English dialectology. First, we draw connections between the patterns shown by variables at different levels of grammar. Second, where phonology is concerned, our elicitation strategy differs from the methods found in Orton (Reference Orton1962) and Leemann et al. (Reference Leemann, Kolly and Britain2018) by directly testing the phonemic status of a particular pair of vowels, as opposed to a broad phonetic realization (see Section 2 below for further details). This gives us the benefit of being able to map where certain vowel distinctions or mergers exist directly from an informant’s judged perception, rather than concluding such from comparing phonetic transcriptions across different words. As Wells (Reference Wells1978) points out in his somewhat critical review of the Linguistic Atlas of England (based on the Survey of English Dialects data; Orton, Sanderson & Widdowson, Reference Orton, Sanderson and Widdowson1978), the SED’s original survey data took no account of structuralist phonemics as we attempt to do here. That is, the SED fieldworkers did not obtain informant minimal pair judgments on whether, for example, two words such as foot and cut rhymed. The more recent English Dialects App (Leemann et al., Reference Leemann, Kolly and Britain2018) follows the SED in this sense. Thus, our study circumnavigates the issue raised by Wells (Reference Wells1978) through our use of minimal pair-like tests.
Additionally, throughout the paper, we compare our results to those of the SED where possible by superimposing isoglosses from the Linguistic Atlas of England (henceforth LAE) onto our maps. In some cases, such as the presence of the construction give it me, this is straightforward. However, when attempting to map the areas which, for example, showed a nurse–square merger (a sound change in England that means some areas pronounce her and hair the same; see Section 3.1.2), we can only develop an isogloss based on the SED data by comparing phonetic transcriptions across two LAE maps. Thus, we locate likely merged and distinct areas in the LAE by superimposing maps from different lexical sets on one another, revealing a possible isogloss for the 1950s data. As a result, this paper not only provides novel data but also gives a brand new perspective on some old findings.
The aim of the present paper is to provide an initial exploration of the data we have been collecting over the past seven years, providing maps, discussion, and cross-referencing across variables and a descriptive account of the current state of lexical, phonological, and morphosyntactic variation in the UK. However, we are aware of the problem raised by Britain (Reference Britain, Chambers and Schilling2013:475) of “the portrayal, the display—sophisticated and eyecatching, admittedly—of data, rather than an explanation of the patterns found” (see also Trudgill [Reference Trudgill1974] on the issue of focusing on the results rather than the process). To avoid this, we also raise issues of theoretical interest alongside these descriptions, such as the mechanisms behind geographical diffusion of innovations and related issues such as sociolinguistic factors, mobility, and hierarchical effects (e.g., urban before rural). In future work, we intend to further build on this from a theoretical and social perspective and narrow the focus to some of the areas of interest raised throughout this paper.
2. Methodology
2.1 The Our Dialects survey
The data for this study come from a survey of speakers of British English administered by undergraduate students of the authors between 2013 and 2019. The survey was modeled on those of Vaux and Golder (Reference Vaux and Golder2003) and Labov, Ash and Boberg (Reference Labov, Ash and Boberg2006). It targeted lexical, phonological, and grammatical variables and led to the creation of an online dialect atlas for the general public (MacKenzie, Bailey & Turton, Reference MacKenzie, Bailey and Turton2016). In the early years of the survey, students collected the data by hand and inputted it electronically for analysis. Beginning in 2015, survey respondents were directed to an online form where they could submit their answers directly (see MacKenzie [Reference MacKenzie, Mallinson, Childs and Van Herk2018] for details). Respondents were targeted over social media and through students’ personal networks.
At the time of initial data collection, the survey was the largest and most recent survey of phonological, lexical, and grammatical variation in British English. The data discussed here comes from 14,438 respondents; over the course of the survey, 37 different variables were targeted.Footnote 1 Most of the variables that were targeted were those that had been demonstrated to display regional variation in earlier work, such as the foot–strut split (Hughes, Trudgill & Watt, Reference Hughes, Trudgill and Watt2012), the choice of tea or dinner for the evening meal (González, Reference González1993), and the pronominal theme-goal ditransitive, as in She gave it me (Hughes et al., Reference Hughes, Trudgill and Watt2012). However, variables were also included that students hypothesized might show regional variation despite a lack of previous research.
An online survey naturally carries some disadvantages. We are forced to rely on speakers’ intuitions, which may not be accurate (Labov, Karen & Miller, Reference Labov, Karen and Miller1991; Labov, Reference Labov, Lisa McNair, Dobrin and Aucoin1996). In the case of mergers-in-progress, for example, judgments are usually ahead of actual production (Herold, Reference Herold1990:97; Labov, Reference Labov1994:320, 355). Similarly, with near-mergers, speakers may have a difference in their production but not in their judgments (Labov, Reference Labov1994:359). Apart from issues related to speaker intuition, we cannot confirm that all respondents are native speakers of British English (though we explicitly asked this question on the survey, allowing us to filter out any respondents who reported that they were not). And there is the possibility that we may receive spurious responses. However, the regional patterns we find for well-studied variables broadly match those found by other dialectological research (Cheshire et al., Reference Cheshire, Edwards and Whittle1993; Hughes et al., Reference Hughes, Trudgill and Watt2012; Orton et al., Reference Orton, Sanderson and Widdowson1978). This lends confidence to our method and is consistent with other research in British English dialectology that has found a high degree of comparability between different types of data, such as surveys and social media (Grieve et al., Reference Grieve, Chris Montgomery, Murakami and Guo2019).
An online survey additionally cannot capture information on speaker demographics in a particularly detailed way. Among other demographic information, our survey elicited respondents’ sex (operationalized as a binary choice between “female” and “male” with a third “prefer not to answer” response), age, and regional background. This latter question asked speakers for the first half of the postcode of the place where they lived for the longest time growing up (between ages 4–13). Under the UK postcode system, the first half of a postcode comprises a speaker’s postcode area (of which there are 121 in use in the UK) and their district within the area (of which there are typically around twenty per area). As we will detail in Section 2.2, we have mapped responses to our survey using this postcode district information.
Responses to our survey skewed female (58% of responses) and young (ages range from 10–96 with median 22). Additionally, 39% of our sample (5,579 respondents) were self-declared students, according to a question on the survey about respondents’ occupation. Though most survey runs did not ask respondents about current place of residence (only about where they grew up), we know that a large number of British university students choose to leave home to study: Whyte (Reference Whyte2019) puts the figure at just over 80% for the academic year 2017–18. This means that a large proportion of our sample is likely to have experienced some mobility. And mobility is well known to influence linguistic patterns: for some specific examples in the university context, see Evans and Iverson (Reference Evans and Iverson2007), Prichard and Tamminga (Reference Prichard, Tamminga and Prichard2012), and Wagner (Reference Wagner2012), or see Nycz (Reference Nycz2015) for a recent review. An upshot of this is that our sample has a considerably different social profile than that of the SED, meaning that differences between our findings and theirs are almost inevitable. Though we cannot directly investigate the effects of geographical mobility in our current dataset, this is a direction for future work. Asking explicitly about place of current residence in addition to place of childhood residence will allow us to compare respondents of matched geographical origins who differ in mobility. This can speak to whether some variables are more likely than others to change in situations of dialect contact (e.g., Chambers, Reference Chambers1992).
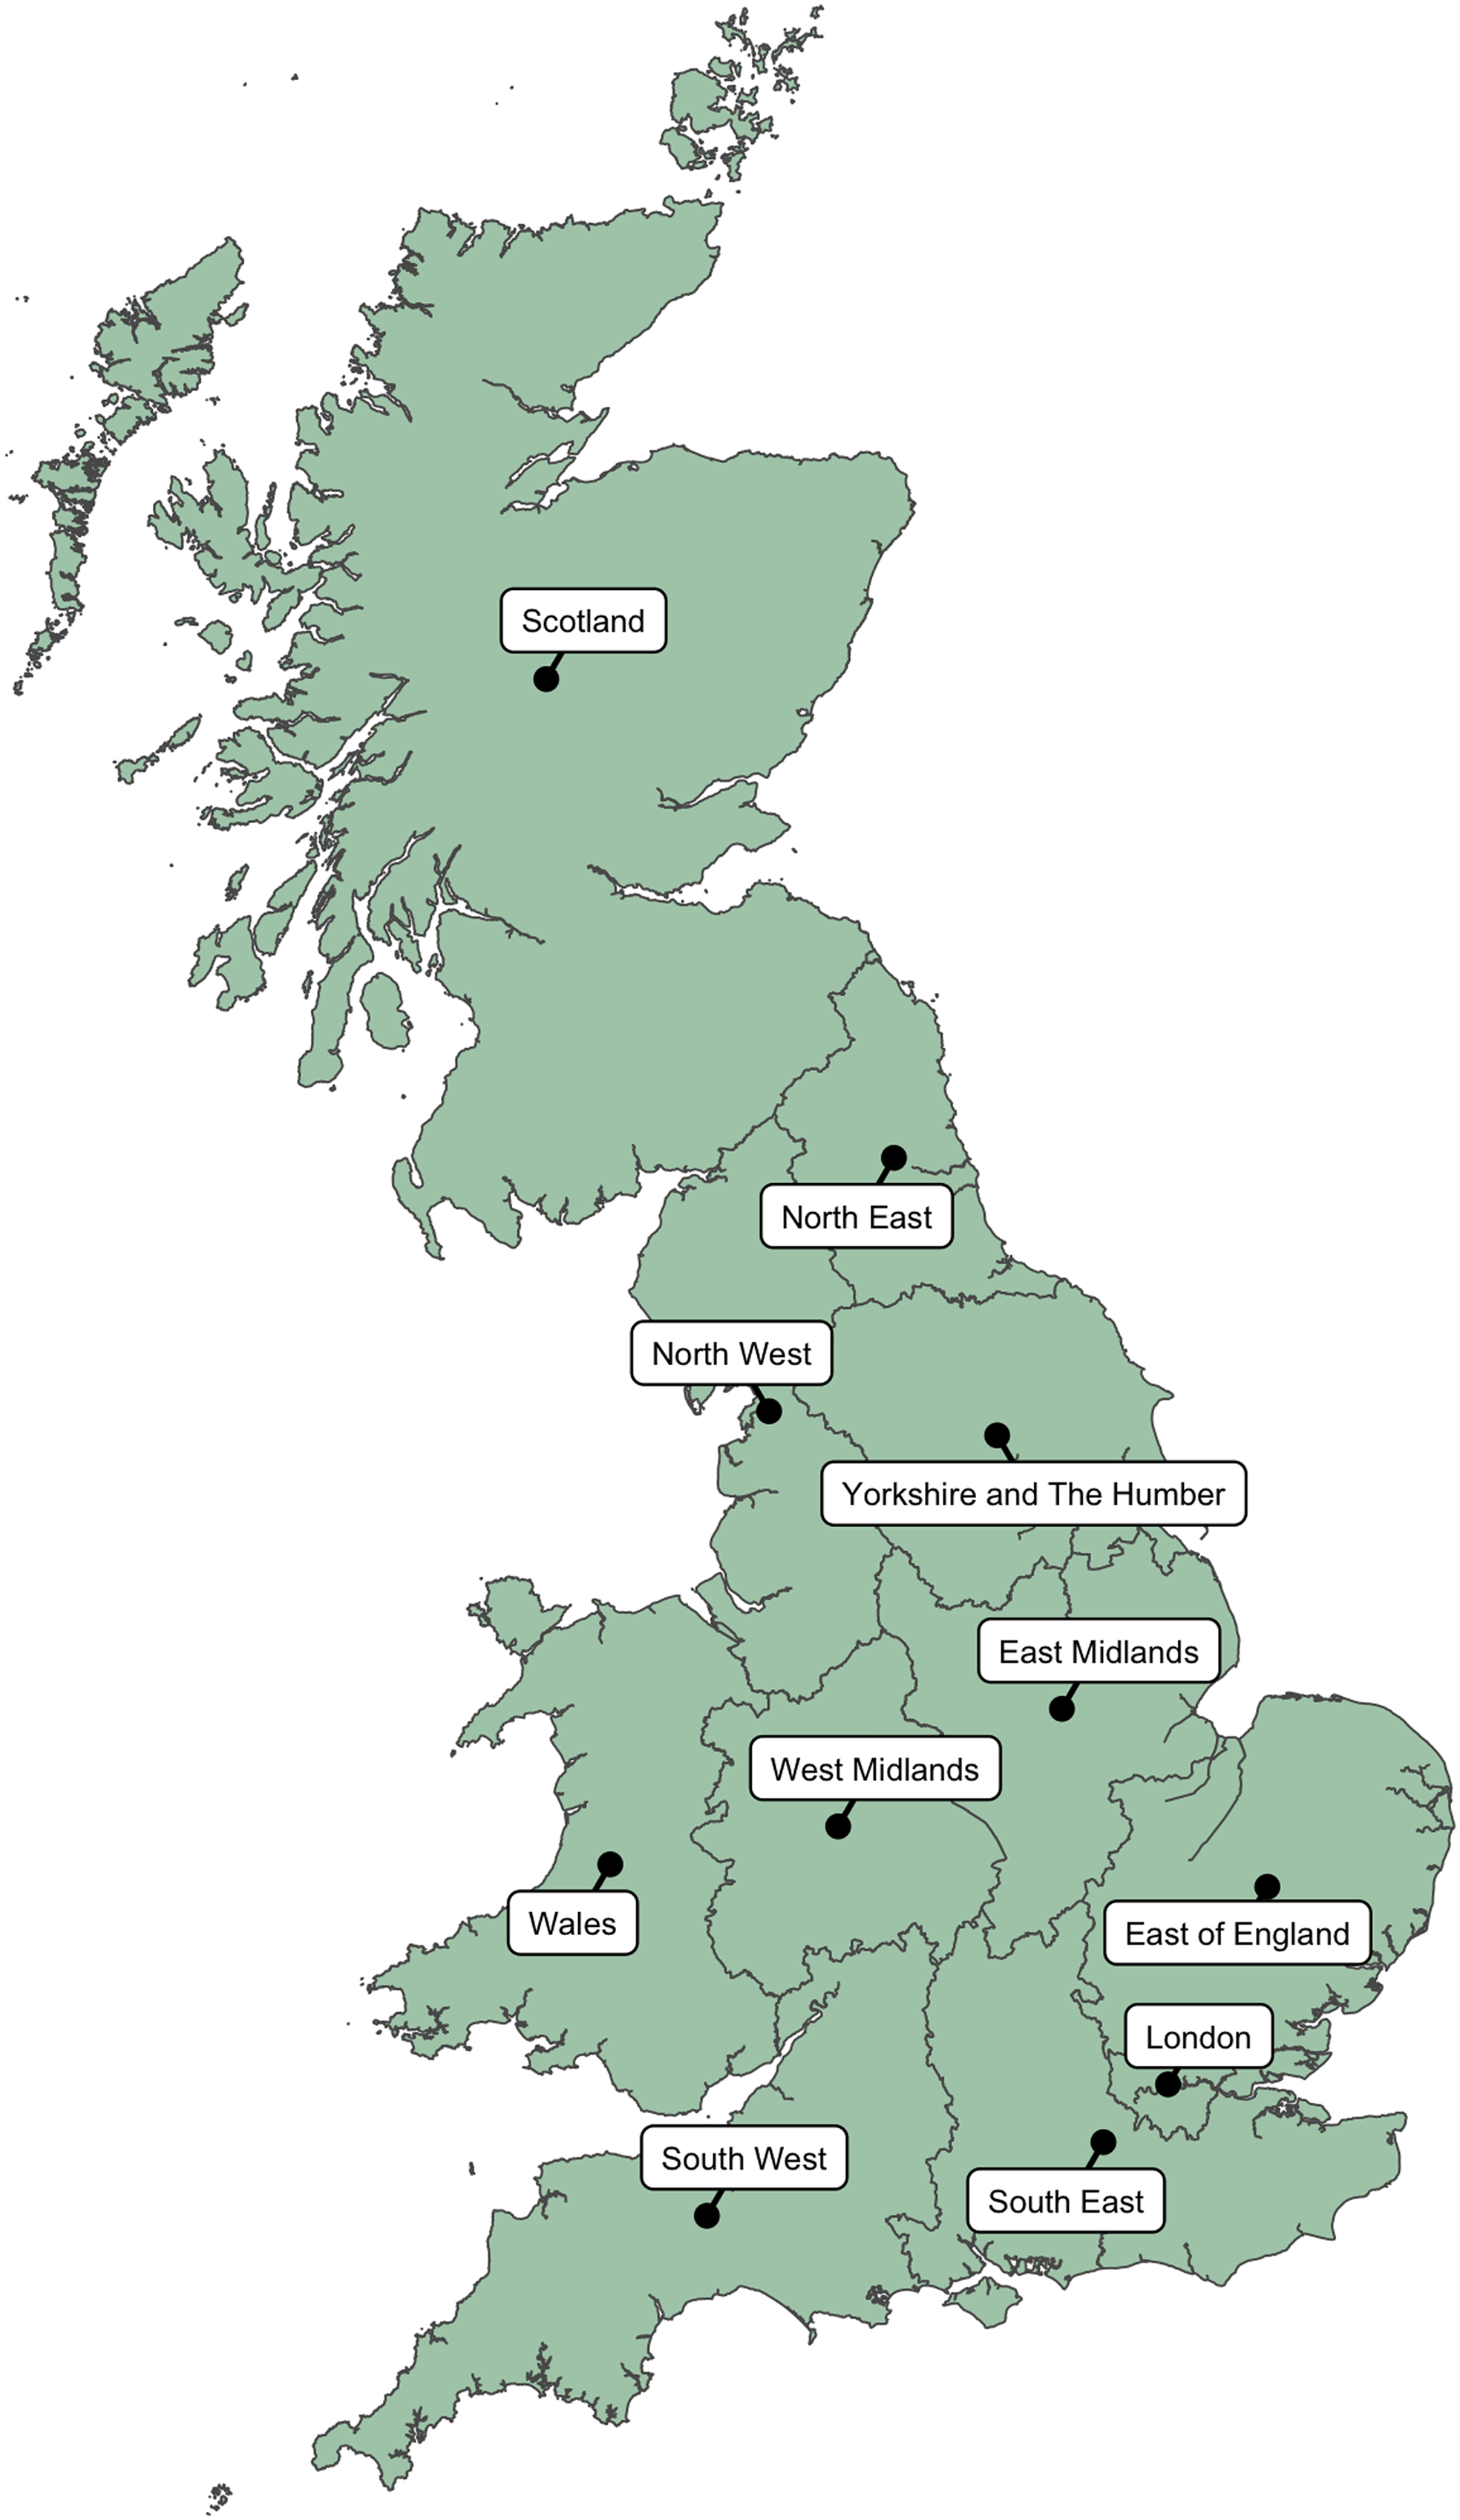
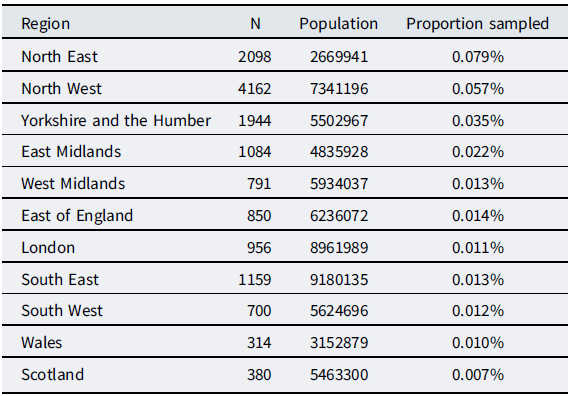
While respondents to our survey covered a wide range of the UK, they disproportionately gave Northern England—where the authors were located during the survey’s run—as the place where they grew up. A full breakdown of response numbers by region is given in Table 1; these regions are the official NUTS 1 (Nomenclature of Territorial Units for Statistics) subdivisions of the UK, including nine statistical regions of England and the countries of Wales and Scotland. As we call upon these labels throughout the results section when describing the patterns of variation, Map 1 maps these regional and national subdivisions for reference.
The official regions of England, alongside Scotland and Wales.
Number of survey responses by region and country. Population data taken from the Office for National Statistics (2020)
A full list of variables included in this paper is provided in Table 2 alongside the full wording of the survey questions and their possible answers and the number of responses for each variable. For phonological variables, the questions ask about either homophony or rhyming between pairs of words; for lexical variables, participants were given a predetermined set of possible variants and asked to choose the one they use “most often.” Multiple selections were possible for participants who use more than one variant in equal measure, enabling respondents who use, say, a regional form and a standard form in different contexts to select both. By providing predetermined responses, we depart from many earlier dialect surveys, including the SED, which asked open-ended or fill-in-the-blank questions. While offering a set of responses may artificially steer respondents toward an answer they would not have otherwise provided (Tillery & Bailey, Reference Tillery and Bailey2003), we determined that this potential drawback was preferable to the labor that would have been required to process fill-in-the-blank answers. The survey also provided an “Other” box where respondents could write in additional options, and we refer to commonly provided “other” variants throughout the paper where relevant (e.g., Section 3.2.1).
Details of the variables analyzed in this paper, with survey question wording and number of responses

For most grammatical variables, participants were asked to rate a given construction on the following five-point scale: (a) I’d say this myself; (b) I wouldn’t use it, but some people from my area do; (c) I’ve heard some people use this form; (d) A speaker of English might say this, but I haven’t really heard it; (e) No native speaker of English would say this. This phrasing is adapted from that used for grammatical variables in the Telsur survey that formed the database for the Atlas of North American English (Labov et al., Reference Labov, Ash and Boberg2006:29). The potential for mismatch between grammaticality judgments like these and actual use is well known (see, for example, Labov [Reference Labov, Lisa McNair, Dobrin and Aucoin1996] or Cornips & Poletto [Reference Cornips and Poletto2005] for a discussion in the specific context of dialectology). A known concern is the interference of the standard language on participants’ judgments: respondents may be likely to call a nonstandard sentence ungrammatical when it is in fact grammatical in their variety but socially dispreferred. Our inclusion of option (b) helps to circumvent this by giving respondents the opportunity to pinpoint a form to their region without having to admit to using it. That said, acceptability judgments can be unreliable for other reasons, too; they may reflect estimated frequency of usage rather than grammaticality, or they may reflect speakers’ difficulty judging a sentence without plausible pragmatic context (Cornips & Poletto, Reference Cornips and Poletto2005). For these reasons, we encourage future researchers to triangulate our judgment-based results with findings from large bodies of spontaneously produced speech/writing (e.g., Twitter). Where possible, we do this throughout the paper and see it as a useful direction for the future as spontaneously produced datasets continue to grow in size, making it easier to elicit low-frequency lexical and grammatical variables.
As indicated in Table 2, this paper presents the results of 12 variables from the complete set of 37. This selection was made based on three primary criteria:
-
1. variables that are underreported (e.g., the north–force and cure–force mergers)
-
2. variables that are widely reported but for which no robust sociolinguistic or dialectological data currently exist (e.g., terms used for a bread roll and the evening meal)
-
3. variables that appear to show different regional patterns in comparisons between this contemporary data and earlier dialect surveys, indicating potential language change (e.g., the foot–strut split and velar nasal plus)
2.2 Mapping & quantitative analysis
As mentioned in the preceding section, participants were asked for their postcode district (e.g., M45, BB3, etc.), which allows us to map responses on a particularly fine-grained level. There are over 2,800 postcode districts across England, Scotland, and Wales, and on average each district covers an area of just over 30 square miles. Geospatial analysis was conducted in R using the sf (Pebesma, Reference Pebesma2018) and rgdal (Bivand, Keitt & Rowlingson, Reference Bivand, Keitt and Rowlingson2019) packages, and maps were generated in R using the ggplot2 package (Wickham, Reference Wickham2016). Below, we provide a brief description of the workflow involved in identifying statistical “hotspots” from the raw survey data and producing the smoothed dialect maps that appear in Section 3. Similar methods of hotspot analysis have been used in earlier studies of regional patterns of phonetic (Grieve et al., Reference Grieve, Speelman and Geeraerts2013), morphological (Tamminga, Reference Tamminga2013), lexical (Grieve, Speelman & Geeraerts, Reference Grieve, Speelman and Geeraerts2011), and syntactic (Bart, Glaser, Sibler & Weibel, Reference Bart, Glaser, Sibler, Weibel, Carrilho, Magro and Álvarez2013; Wood, Reference Wood2019) variation.
For each question on the survey, we start by calculating the proportion of respondents in each postcode district who use a particular variant. For lexical variables, this includes respondents who use a form exclusively (e.g., those who just select barm for the “bread” question) but also those who use it alongside other variants (e.g., those who select barm and bap). For grammatical variables, we include respondents who report either of the top two acceptability judgments (i.e., speakers who either directly report use of the form in question or attest its use in their local area). From these raw values, we then perform hotspot detection— specifically Getis-Ord Gi* local spatial autocorrelation (Ord & Getis, Reference Keith and Getis1995)—to identify clusters of locations in which a variant is particularly favored or disfavored. The advantage of such methods is that isolated instances of the use of a variable are smoothed over and underlying regional patterns are more easily identified. The end result is a z-score for each location that quantifies the extent to which that location is surrounded by other locations with similar values. A positive z-score indicates an area in which the linguistic form is favored, whereas a negative value indicates an area in which the form is disfavored, and the further this value is from zero the stronger this pattern is.
The number of neighboring locations that are taken into account forms the basis of the k-nearest neighbors (k-NN) algorithm, where the value of k is decided upon by the researcher (Getis, Reference Getis2009). We generated maps using 5-NN, 10-NN, and 25-NN. In this paper, we report the results of the latter. From our manual comparisons between the raw and smoothed maps, it became clear that an analysis involving fewer nearest neighbors was prone to erroneous hotspots in areas with very few responses, while higher values of k resulted in oversmoothing and the loss of fine-grained spatial patterns for more locally-restricted forms (see Grieve [Reference Grieve, Martijn Wieling, van Noord and Bouma2017] for a discussion of considerations in setting the nearest neighbor parameter). These neighbors are assigned weights, equal to the recriprocal distance between the geographical centroid of itself and the location in question. As a result, a location’s smoothed value is more strongly influenced by the neighboring locations that are closest.
In addition to the postcode district datum on which the smoothing was calculated, each survey response is also tagged with higher-level geographic information such as county and region (see Table 1). We recognize that postcodes and local authorities are not socially meaningful units and can both span and divide relevant linguistic areas; nevertheless, we still make reference to these different levels of geographic subdivisions in our descriptions of regional patterns (Section 3), though we return to this point in Section 4. Additionally, to better help readers localize the patterns we describe, the regions enumerated in Table 1 are indicated on each map in faint gray outline, and locations of particular interest have been labeled as appropriate for each variable.
Finally, where available, we have superimposed isoglosses from the Linguistic Atlas of England (Orton et al., Reference Orton, Sanderson and Widdowson1978) onto our maps. In some cases, such as for the nurse–square merger (Section 3.1.2), this has required us to overlay isoglosses from two different LAE maps (one for the nurse vowel and one for the square vowel) to create a single set of isoglosses representing the presence or lack of the phonemic contrast. We explain the details of these procedures in the appropriate sections.
3. Results
In this section, we present the findings of our phonological (Section 3.1), lexical (Section 3.2), and morphosyntactic (Section 3.3) maps. Where applicable, we compare our findings to those of the SED to look for the possibility of real-time change. We also flag shared patterns across different variables within our own data, allowing for the identification of isogloss bundles.
Two common themes run through the results presented here. The first is the departure of our findings from those of the SED. Though patterns are broadly similar between the two data sources, the edges of many dialect regions have clearly shifted since that research was carried out in the first half of the twentieth century (see, for instance, Section 3.1.1 on the foot–strut split or Section 3.1.4 on velar nasal plus). The second theme in our results concerns the boundaries between regions: for instance, how far westward do features associated with Manchester extend, or, conversely, how far east do we find characteristic features of Liverpool? How do the Midlands pattern with respect to variables that show a strong North/South divide? We answer these questions throughout and elaborate on the directions that they raise for future research in Section 4.
While considering these results, we encourage the reader to bear in mind the specific nature of our sample (skewing young and female, with a large proportion of Northerners and students) and our questions (potentially biasing respondents toward local forms via the power of suggestion, at least for lexical and grammatical variables). To some extent, these two biases may balance each other out: young, female, mobile respondents may be more likely to avoid local forms, but a questionnaire that explicitly offers local forms as choices may make respondents more likely to choose them than they would have been otherwise. Another more concrete consequence of our sample skew is that certain regions of the country are often represented by very little data, which can lead to the appearance of spurious hotspots in the geospatial analysis. We make an effort to flag these where they arise.
3.1 Phonological variables
3.1.1 foot–strut split
Around the middle of the seventeenth century, a phonemic split occurred that saw an unrounded /ʌ/ variant emerge primarily from Middle English short /u/. Although the split also involved a number of intermediate stages and sounds that complicate this simple description, the consequence is that today speakers in certain regions of the country produce different vowels in words such as foot [fʊt] and cut [kʌt] (Beal, Reference Beal, Kortmann and Upton2008; Wells, Reference Wells1982). This change—commonly referred to as the foot–strut split—never occurred in the North of England, which means that for northern speakers these words rhyme with each other. Earlier dialectological studies established an isogloss for this variable that runs from the Severn estuary in the west of England to the Wash in the east, essentially dividing England into two halves (Orton et al., Reference Orton, Sanderson and Widdowson1978; Upton & Widdowson, Reference Upton and Widdowson1996; Wells, Reference Wells1982). Aside from the regions around Herefordshire and Berwick-on-Tweed, where northerners exceptionally exhibit this phonemic split, all dialects of England north of this Wash-Severn line are said to have a five-term short vowel system in which foot and strut are produced with the same quality.
It should of course be noted, however, that the placement of isoglosses can oversimplify what is actually a relatively complex and interesting pattern of regional variation. This is most notable in the Midlands, which has been described as a transition zone with dialects that demonstrate variation between the two forms and an intermediate realization of strut that approximates [ɤ] (Chambers & Trudgill, Reference Chambers and Trudgill1998); this was noticed over a century ago by Ellis (Reference Ellis1889) and was more recently explored by Britain (Reference Britain1991, Reference Britain, Trudgill and Fisiak2001) in the Fens. There have also been reports in Cannock, Staffordshire of lexically specific variation in which speakers have [ʊ] in rubber but [ʌ] in butter (Heath Reference Heath1980), and hypercorrect use of /ʌ/ in foot words elsewhere in the Midlands (see Map Ph143 of foot in Orton et al., Reference Orton, Sanderson and Widdowson1978).
While the nature of our data makes it impossible to investigate the exact phonetic realizations of strut, there are some advantages to the methodologies employed here: as discussed earlier in Section 1, the targeted questioning of our survey provides a more reliable indicator of the presence/absence of a phonemic split and the phonological status of this foot–strut contrast relative to other surveys such as the SED and the English Dialects App (Leemann, Britain & Blaxter, Reference Leemann, Britain and Blaxter2017; Leemann et al., Reference Leemann, Kolly and Britain2018), which target only isolated phonemes and, in doing so, potentially overestimate the extent of the split, particularly in areas of the Midlands that are known to exhibit centralization of these vowels (see, for example, Jansen & Braber, Reference Jansen and Braber2021) and the aforementioned patterns of hypercorrection. That said, the isoglosses between the two present-day studies are very similar but with Leemann et al. (Reference Leemann, Britain and Blaxter2017) erring on the side of a distinction. We return to this point later in Section 4. In Map 2, we map the distribution of responses to the question “do the words foot and cut rhyme for you?” where an affirmative response would indicate the absence of a phonemic split.
Do foot and cut rhyme for you? Light yellow areas represent the absence of a phonemic split. Black LAE isoglosses from Orton et al. (Reference Orton, Sanderson and Widdowson1978:Ph50) for the word butter.
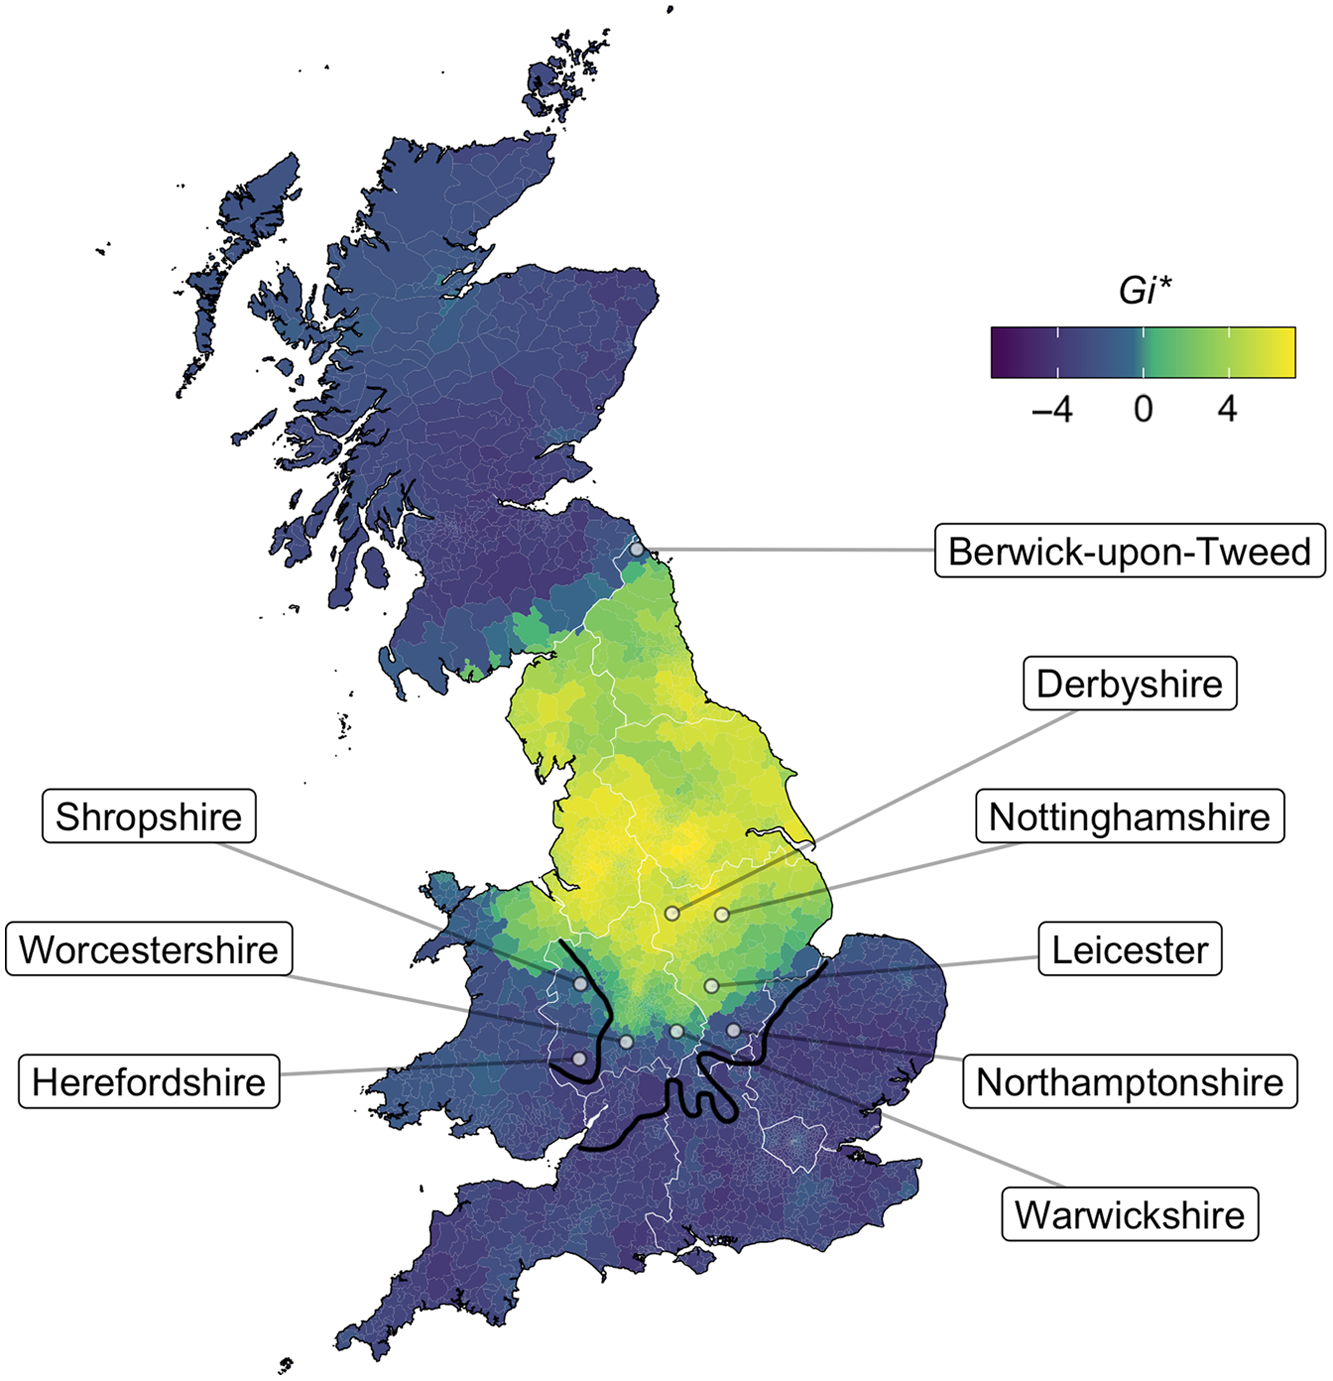
The North–South divide in England is immediately apparent, with 79% (N = 8204) of speakers across the North West, North East and Yorkshire reporting the same vowel for the foot and strut lexical sets, relative to just 5% (N = 2815) in the south of the country. The “transitional” midland zone is also reflected here, with rates of 63% (N = 1084) in the East Midlands and 47% (N = 791) in the West Midlands.
While the data in Scotland are too sparse to look for fine-grained regional patterns, it is unsurprising to find that an overwhelming 97% (N = 380) of Scottish speakers exhibit a foot–strut split. This is also the case for 92% (N = 25) of responses from Berwick-upon-Tweed, which, despite its position south of the Anglo-Scottish border, is known to be linguistically aligned with Scotland in many regards (see, for example, Pichler, Reference Pichler2008, Reference Pichler2010;Watt & Ingham, Reference Watt and Ingham2000; Watt, Llamas & Johnson, Reference Watt, Llamas, Ezra Johnson and Lawson2014). Wales is somewhat less homogenous with 78% (N = 314) of respondents reporting a distinction, but this is largely due to a concentration of speakers in North Wales who have resisted the split, possibly due to their proximity to Cheshire in the North West of England.
The status of strut is arguably most interesting in the Midlands, with our map suggesting a more northern boundary placement relative to the LAE isogloss, despite claims that this traditional Severn-Wash boundary is “remarkably stable” (Wales, Reference Wales2006:104). Although most parts of the East Midlands still demonstrate no obvious phonemic split (the words rhyme for 79% of respondents in Derbyshire and 76% in Nottinghamshire, comparable with more northern rates), some of the more southerly locales show very different behavior: only 43% (N = 56) of speakers rhyme these words in the city of Leicester, and this drops even further to just 7% (N = 116) in Northamptonshire.
Moving on to the West Midlands, the exceptional behavior of speakers in Herefordshire and the southern part of Shropshire, as noted before, is still evident. However, these more contemporary data suggest that other parts of the West Midlands also show a strong foot–strut distinction, contrary to the traditional boundaries put forward by the LAE: just 24% (N = 75) of Warwickshire speakers and 31% (N = 99) of Worcestershire speakers report the same vowel in these words, and these are largely concentrated in the more northern parts of the counties. Further research should shed light on this possible change, including both an apparent-time analysis of this survey data as well as independent community-level studies in the Midlands.
Setting aside this transitional zone, there is an interesting disparity between the two “halves” of the country when we consider those speakers who go against the regional pattern: the South of England is incredibly homogenous with just 5% reporting a foot–strut rhyme, whereas 21% of northern speakers are exceptional in reporting a phonemic split. This apparent disparity may be partially explained with reference to social class and mobility. There are claims in the literature that it becomes increasingly likely to find northerners with a foot–strut split further up the social scale (Drummond, Reference Drummond2012; Wells, Reference Wells1982); this also finds support from a recent large-scale quantitative study by Turton and Baranowski (Reference Turton and Baranowski2021), who report widespread phonetic lowering of strut, and indeed evidence of complete phonological splits among many upper-middle class speakers in Manchester. Strycharczuk et al. (Reference Strycharczuk, Brown, Leemann and Britain2019, Reference Strycharczuk, López-Ibáñez, Brown and Leemann2020) also find evidence of speakers in the North of England producing different vowels in these two sets and partly attribute this to highly mobile speakers adopting a panregional “General Northern English.” These changes in population and sampling dynamics may go some way to explaining the apparent change observed here, particularly given the highly conservative nature of the SED with its focus on nonmobile, older rural male speakers (NORMs), and how this contrasts with the largely student-dominated responses collected here.
3.1.2 nurse–square merger
The merger of the nurse and square lexical sets results in homophony between words such as fur and fair, burr and bear. It is sometimes called the fur-bear merger or the her-hair merger and is typically associated with accents in Merseyside (Knowles, Reference Knowles1973; Wells, Reference Wells1982:361; West, Reference West and Hickey2015; Watson & Clark, Reference Watson and Clark2013) and in various locations in Greater Manchester and Lancashire such as Bolton and Blackburn (Turton, Reference Turton2015). Although we cannot consider the phonetic quality of the merged vowel with our survey methods, it is commonly noted that present-day Liverpool speakers merge to a fronter-like [εː] pronunciation, whereas Lancashire has a more nurse-like [ɜː] or [ɵː] vowel (Barras, Reference Barras2006, Reference Barras and Hickey2015; Knowles, Reference Knowles1978:84; Shorrocks, Reference Shorrocks1999:205; West, Reference West and Hickey2015). It is likely that this difference is connected to rhoticity: the Lancashire areas have rhoticity or residual rhoticity, which may have a centralizing effect on the choice of vowel. This is reported for other vowels in parts of Lancashire due to the retroflex residual rhotic /r/ (Shorrocks, Reference Shorrocks1990).
Less commonly, the nurse–square merger is reported for various northern varieties on the east coast of England. This includes Hull (Suddaby, Reference Suddaby2017; Williams & Kerswill, Reference Williams, Kerswill, Foulkes and Docherty1999:146) and further north in Middlesbrough (Llamas, Reference Llamas2001), but “not north of the Teesside conurbation” (Beal, Reference Beal, Kortmann and Upton2008:125). The reason for the merger being less typically associated with these north-east areas could be because the phonetic realization is intermediate between [εː] and [ɜː] and therefore less striking than what we find in the North West. The alternative explanation is simply that it is less common in the speech of locals or is a more recent merger compared to the North West.
The results from the present investigation, which asked respondents “Do fur and bear rhyme for you?” reveal that 11% of respondents overall exhibit the nurse–square merger. This is mapped in Map 3, where an affirmative response (mapped as light yellow) indicates that the speaker has the merger. The vast majority of merged speakers are in the North West region (28% merged, N = 4162), followed by the Yorkshire and Humber region (8% merged, N = 1944), and then the North East (5% merged, N = 2098). However, these larger regions are not particularly useful in diagnosing the geographical centers of this merger. When we break the regions down into local authorities, we see a clearer picture: although the main effect is carried by Merseyside in the west (61% merged, N = 477), the eastern towns are catching up (Hartlepool: 54% merged, N = 44; both Hull and North East Lincolnshire: 46%, Ns are 44 and 59 respectively; East Riding: 38%, N = 171). At the smaller level of postcode area, the Wigan postcode area in the North West (which also includes St Helens and Skelmersdale) shows high rates of the merger (63% merged, N = 205).
Do fur and bear rhyme for you? Light yellow areas represent merged responses. Black LAE isoglosses reflect areas with the same phone in mare (Orton et al. Reference Orton, Sanderson and Widdowson1978:Ph83) and third (Orton et al. Reference Orton, Sanderson and Widdowson1978:Ph30).
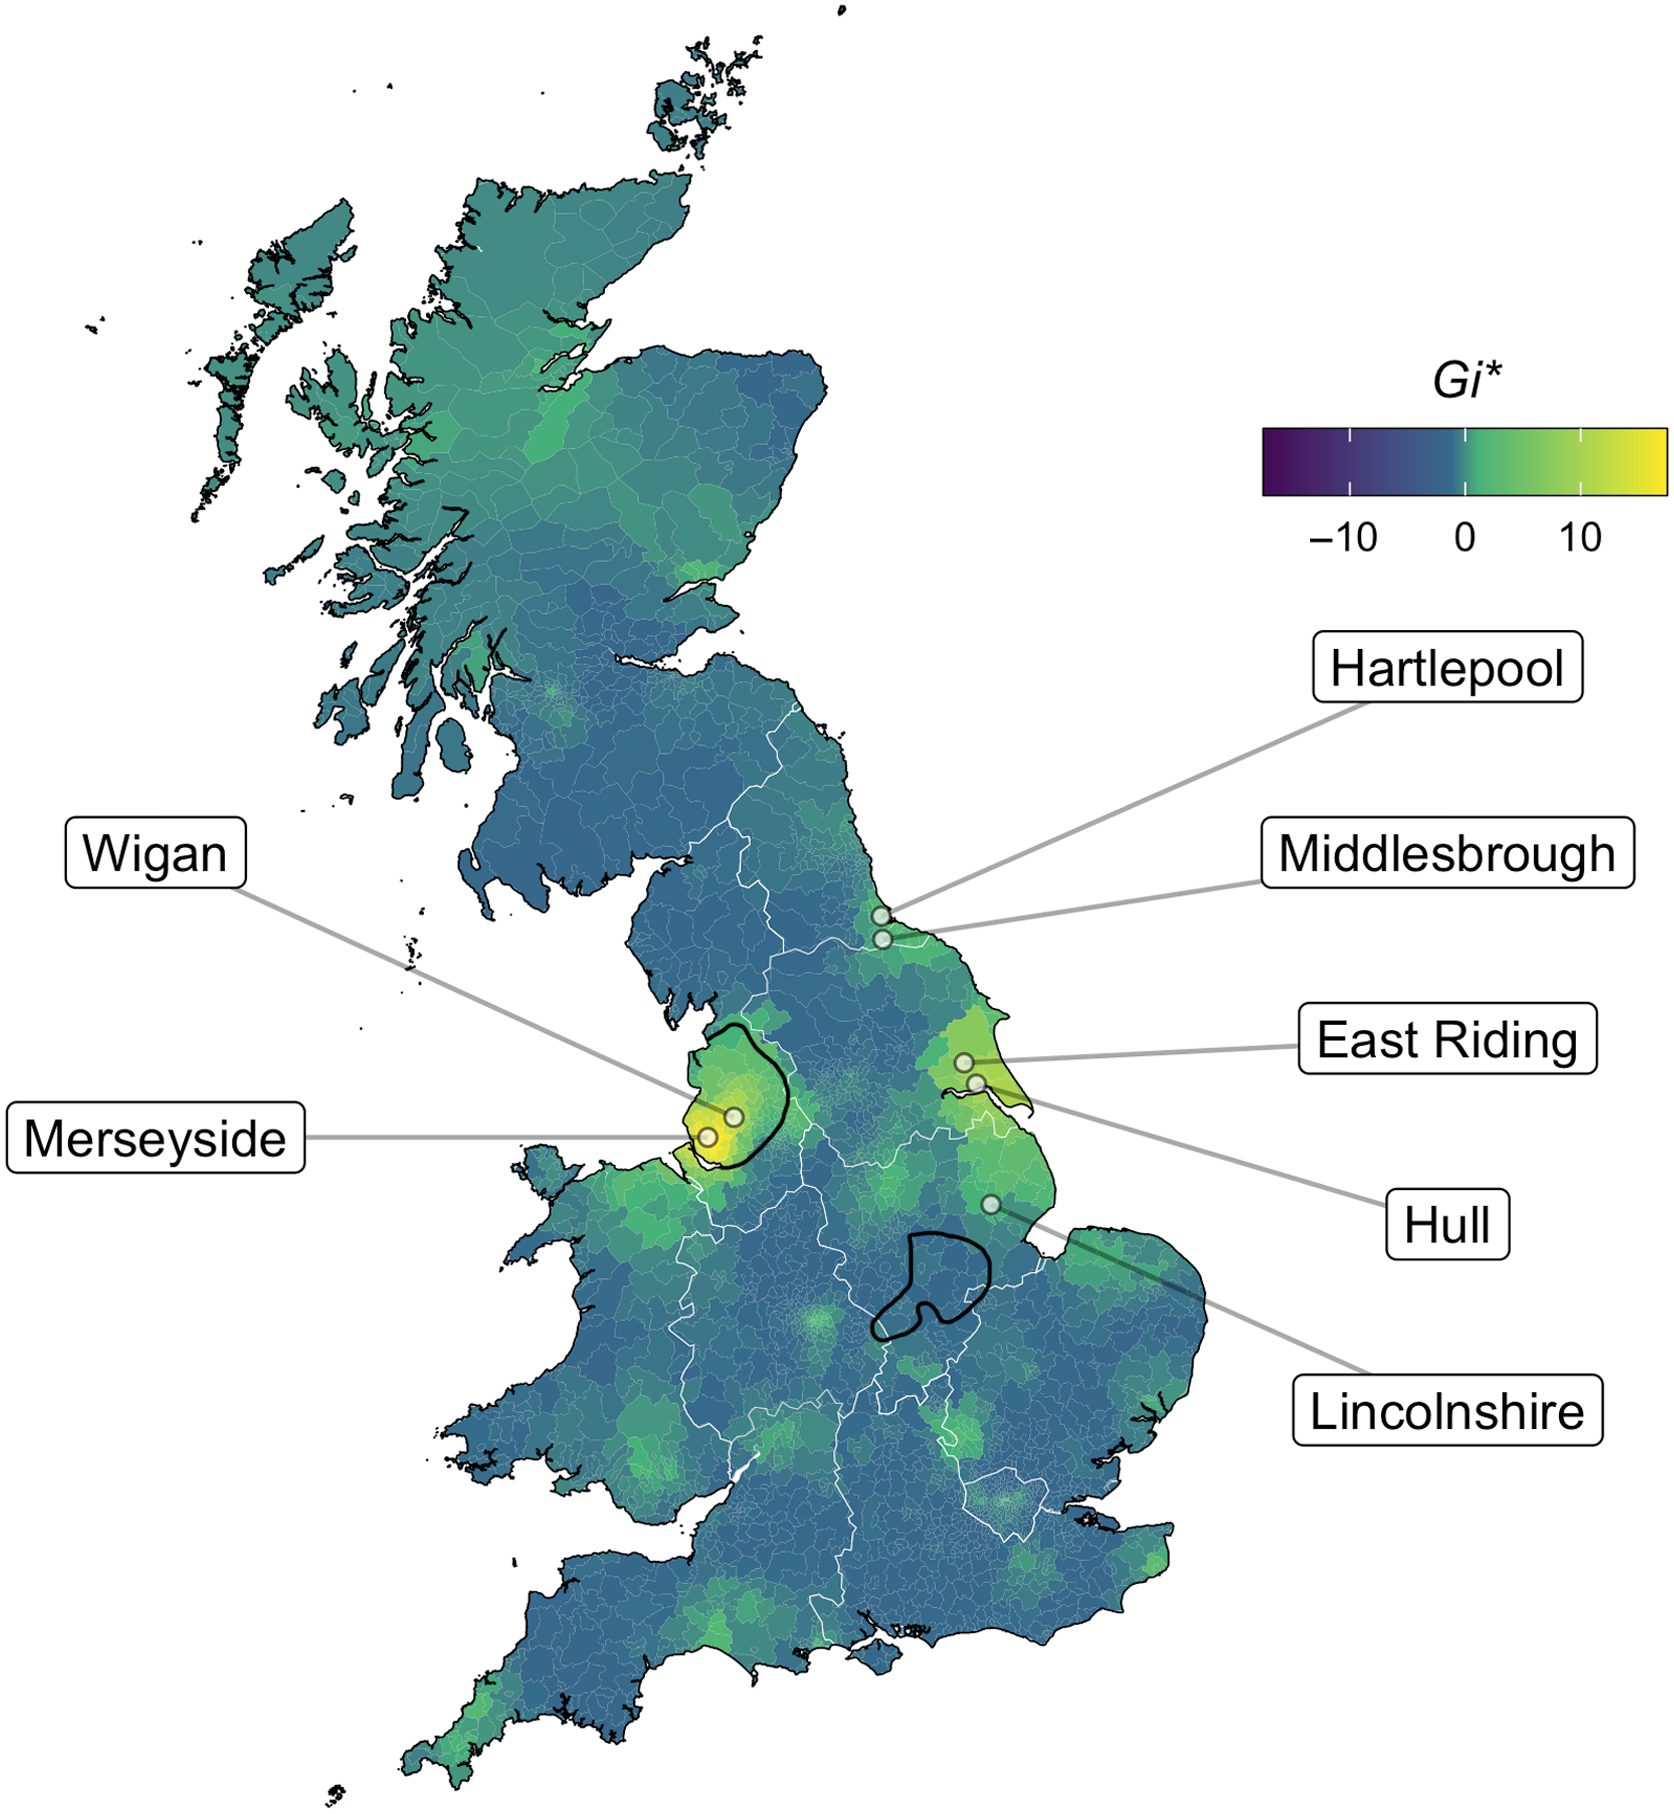
Map 3 also includes a newly developed 1950s isogloss of the merger, created from the available LAE map data. This is based on the phonetic transcriptions of the words mare (Orton et al., Reference Orton, Sanderson and Widdowson1978: Ph83) and third (Orton et al., Reference Orton, Sanderson and Widdowson1978: Ph30), selecting out areas where the two words are transcribed with the same phone. The North West area in our data maps very closely to the LAE isogloss. An additional area emerging from the LAE isogloss but which does not feature in our merged responses can be found in the East Midlands, edging slightly into the West Midlands, including areas in Lincolnshire and Leicester. Wells (Reference Wells1982:361) does mention some of these areas with respect to this merger, stating his impression that speakers in Leicestershire, the West Midlands, and Lincolnshire may be variably merged. In our data, only the North East of Lincolnshire persists in merging (as noted earlier). Thus, it seems that, potentially, a once variable merger has been stamped out in favor of the standard.
The main inconsistency between our findings and those of the LAE can be seen along the east coast. This area shows no evidence of a merger in the 1950s data, but as shown above, has some of the highest rates of the merger in our dataset. Earlier, we hypothesized that the association of the nurse–square merger with the North West may be an issue of salience rather than frequency: perhaps the central [ɜː] vowel in square stands out more than the fronted [εː] variant in nurse. However, this somewhat dramatic emergence of the merger on the east coast over the past sixty years suggests instead that it is a newer sound change in these areas. Further support for this comes from the fact that the rates in the West are higher, as well as evidence that the nurse–square merger is a change in progress led by young women in eastern areas such as Hull (Suddaby, Reference Suddaby2017). As Beal (Reference Beal, Kortmann and Upton2008) notes, this requires more research from both a sociolinguistic and dialectological perspective in these eastern towns to draw such comparisons with areas in and around Merseyside and the North West, which are well documented with respect to this merger (Barras, Reference Barras2006; Knowles, Reference Knowles1973; Watson & Clark, Reference Watson and Clark2013; Wells, Reference Wells1982; West, Reference West and Hickey2015).
3.1.3 “Book” as goose or foot
The lexical incidence of -ook words is regionally variable in British English, with some regions retaining the historical long vowel [u]—which persists in spook—in words such as book, cook, look. This means a word like book would be pronounced [buːk] and not [bʊk]. Thus, -ook words are in the goose set for these speakers, not the foot set. This is said to still be the case in areas such as Tyneside, Stoke-on-Trent, and Liverpool (Barras, Reference Barras and Hickey2015:265; Beal, Reference Beal, Kortmann and Upton2008:122; Newbrook, Reference Newbrook, Foulkes and Docherty1999; Wells, Reference Wells1982:373). For some time, it has been described a “recessive” feature of Northern Englishes (Wells, Reference Wells1982:373), restricted to the speech of older informants in areas where it is now the minority variant, such as Derby (Docherty & Foulkes, Reference Docherty, Foulkes, Foulkes and Docherty1999) and Manchester (Turton & Baranowski, Reference Turton and Baranowski2021), while showing both social class and age effects in the Wirral (Newbrook, Reference Newbrook, Foulkes and Docherty1999). Scotland retains the traditional realization, having no difference between foot and goose. For the purpose of this investigation, it means we would expect speakers from these areas to answer “yes” to our particular survey question, “Do book and spook rhyme for you?”
Map 4 confirms that the areas listed above (the North East, Stoke-on-Trent, and Liverpool) are still the representative heartlands of this traditional form, but the situation is much more stable in the North East when compared to areas in the west such as Merseyside and Stoke. The region of Tyne and Wear has the highest rates of the traditional realization (85%, N = 1200), followed by Northumberland (83%, N = 206) and Stoke (77%, N = 30). Compare this to Merseyside, which is now just 25% (N = 480). Some areas of Cumbria also pattern with the North East, showing a preference for -ook words being in the goose set, although in most places the rates are more similar to present-day Merseyside (Cumbria overall is 20% “yes,” N = 260). Various areas of Wales also report some of the highest rates of rhyme in book and spook, although overall numbers of responses are small. These include Anglesey and Gwynedd in the north, and Bridgend in the south.
Do book and spook rhyme for you? Light yellow areas represent affirmative responses.
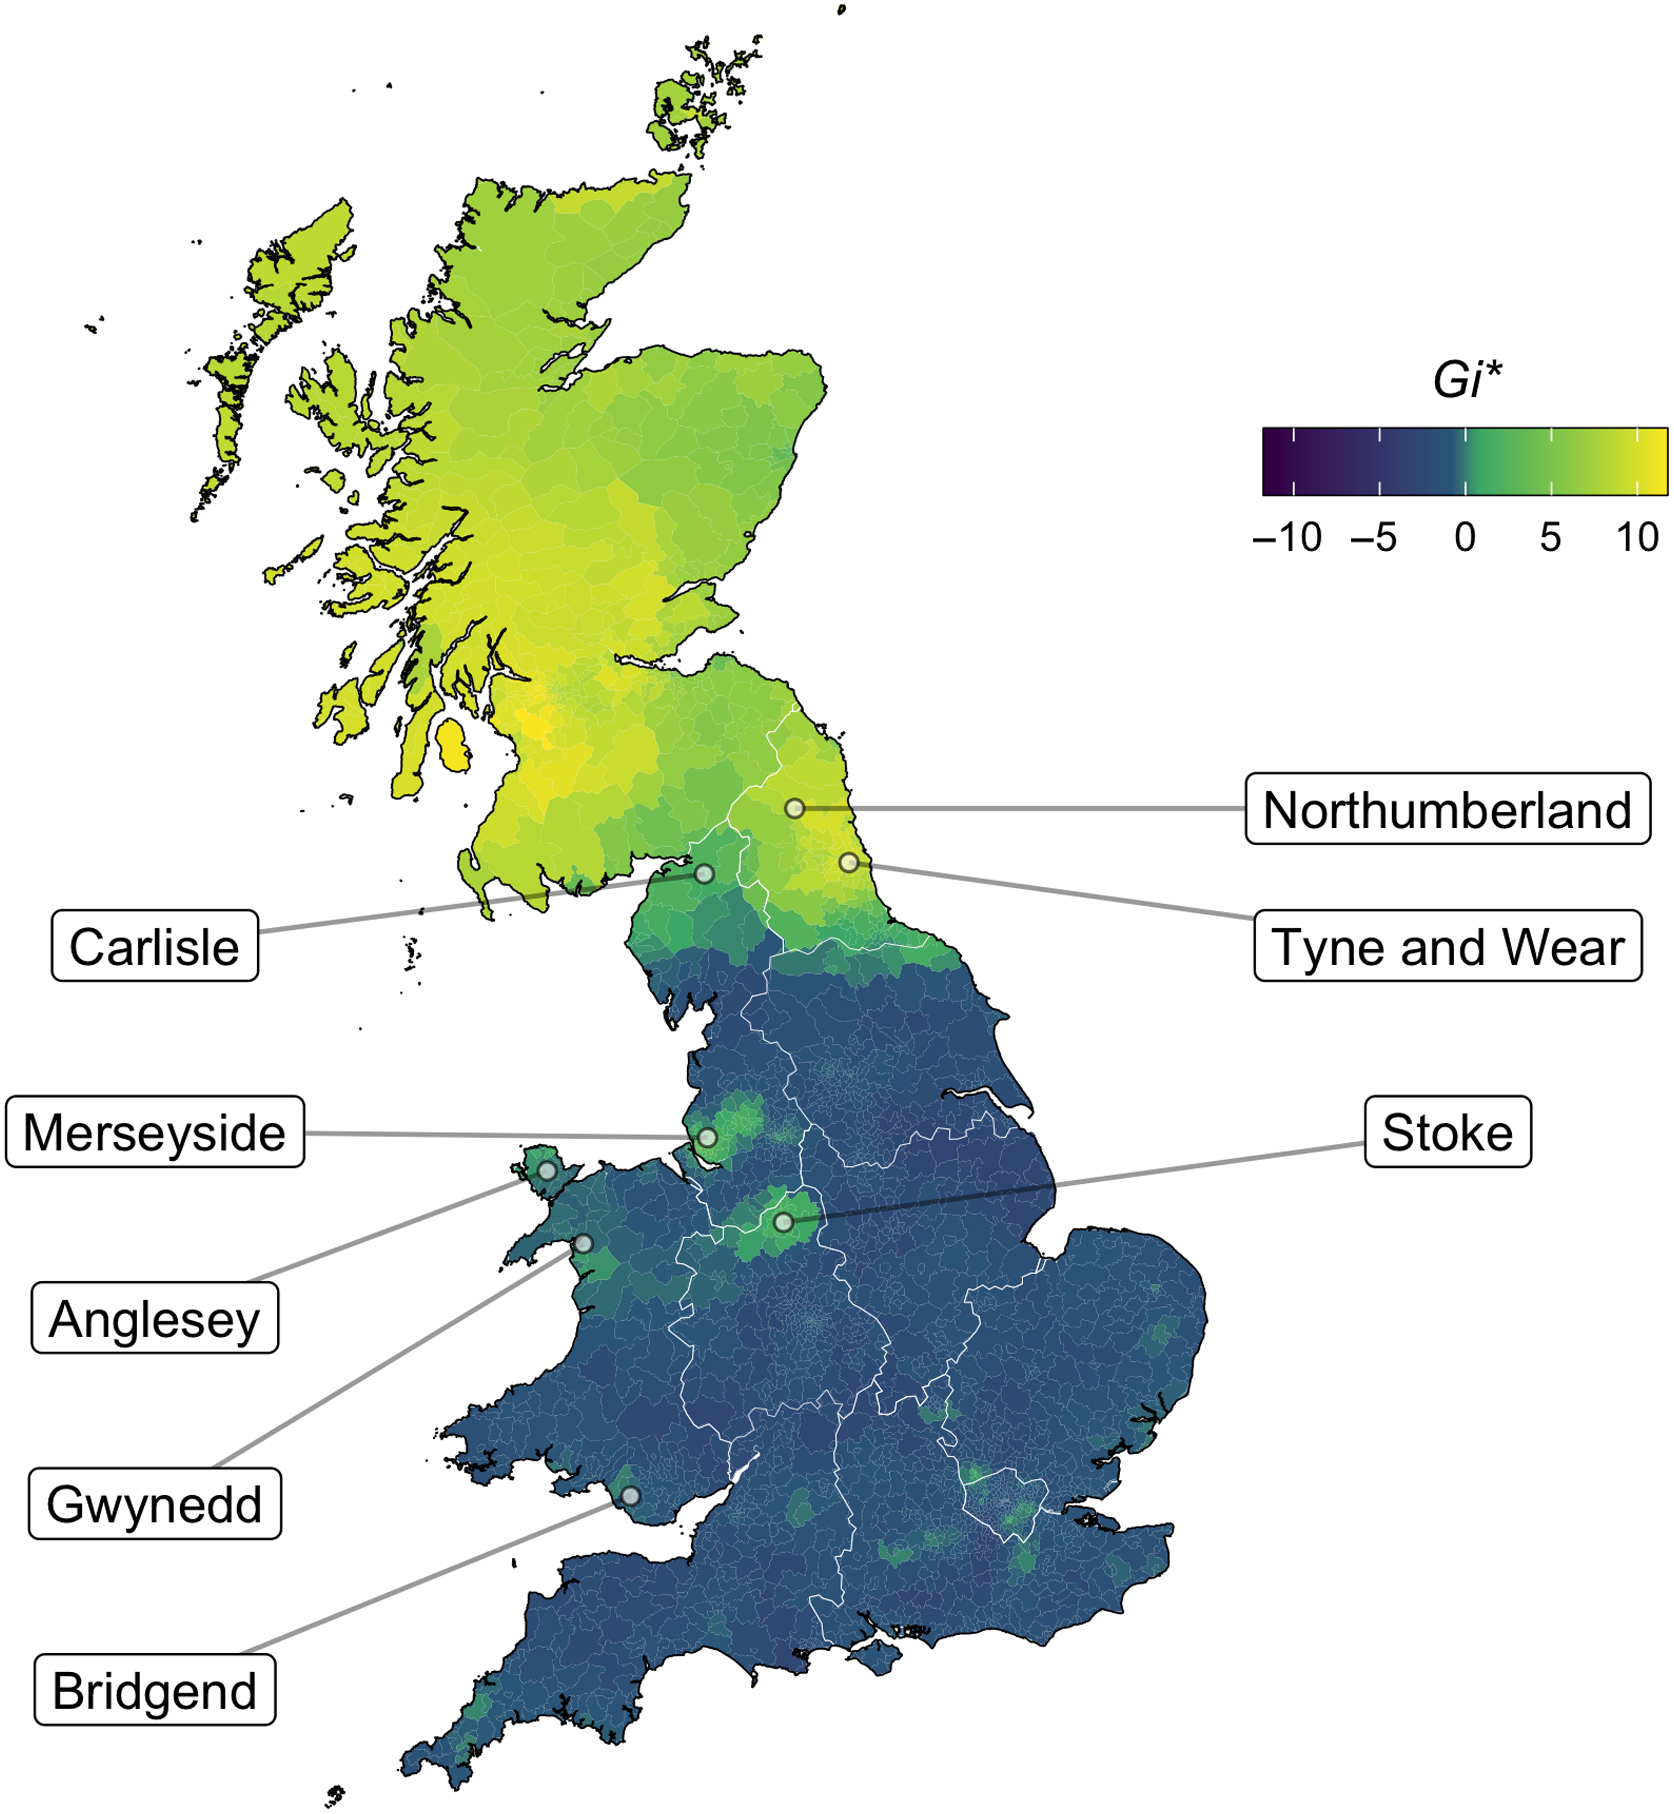
In Tyneside, the lexical incidence of this subset may be slightly different, with many speakers having foot in book, but goose in other -ook words.Footnote 2 The incidence of the -ook words as [uː] seems to be productive, with reports of one Tynesider connected with an undergraduate at Newcastle University pronouncing Brooklyn as [bɹuːklin], although this report was not agreed on from all local speakers, demonstrating lexically specific realizations that vary within the speech community (see also Newbrook, Reference Newbrook, Foulkes and Docherty1999:97).
In areas where book and spook rhyming is more variable than in, say, the stable North East, the traditional realization functions as somewhat of a shibboleth. It is likely to be leveled in the coming years: evidence for this comes from the low rates in Merseyside today, but also Lancashire, which has just 11% of reported rhyming of these words in our data. Stoke-on-Trent is the place to watch in the coming decades in order to observe the mechanisms by which this variable may change in future: Stoke has high rates of the traditional form while also being geographically isolated in terms of [buːk]-pronouncers.
3.1.4 Velar nasal plus
The singer-finger near-minimal-pair reflects a difference in ng-coalescence, specifically the variable presence of [ɡ] following a velar nasal word-medially as in singer /sŋ(ɡ)ə/ and word-finally as in tongue /tɒŋ(ɡ)/. At a much earlier point in the history of English a [ɡ] was invariably present in these words regardless of the regional variety spoken, but around the start of the seventeenth century speakers began to simplify the nasal+stop cluster by dropping the [ɡ] when it occurred either word-finally or word-medially before a morpheme boundary (Wells, Reference Wells1982:188). However, there are many varieties of British English spoken largely in the North West of England in which this change never took place and speakers exhibit synchronic variation between [ŋ]~[ŋɡ] to this day (attested in Heath, Reference Heath1980; Hughes et al., Reference Hughes, Trudgill and Watt2012; Knowles, Reference Knowles1973; Schleef, Flynn & Ramsammy, Reference Schleef, Flynn, Ramsammy, Eivind Torgersen, Mæhlum and Røyneland2015; Wakelin, Reference Wakelin and Trudgill1984; Watts, Reference Watts2005; and explored in detail by Bailey, Reference Bailey2018). For these speakers, the words finger and singer may rhyme because the postnasal /ɡ/ in singer is only variably deleted.
The exact geographical boundary of this [ɡ]-retaining area has been described as “most of the western half of the midlands and middle north, including Birmingham, Coventry, Stoke-on-Trent, Manchester and Liverpool” (Wells, Reference Wells1982:365), as well as most of Derbyshire, the northernmost parts of Shropshire, Worcestershire, and Warwickshire in the West Midlands, and the westernmost part of Leicestershire in the East Midlands. It also creeps slightly into South Yorkshire, specifically Sheffield, and was attested in a very small part of the South East around Kent in the 1950s Survey of English Dialects, which until this point remained the most recent widespread study of this form’s regional distribution.
Map 5 maps the responses to the question “do the words finger and singer rhyme for you?” with the 1950s LAE isogloss superimposed over this new contemporary data. For the most part, the regional spread of this form has remained relatively stable since the 1950s. The [ɡ]-retaining areas are clearly centered around the North West (70% rhyme, N = 4162) and the West Midlands (61%, N = 791), and many of the aforementioned counties that lie on the border of the LAE isogloss still show relatively high rates of singer-finger rhyming today, such as Shropshire (62%, N = 78) and Worcestershire (70%, N = 108).
Do singer and finger rhyme for you? Light yellow areas represent the retention of post-nasal [ɡ]. Black LAE isogloss from Orton et al. (Reference Orton, Sanderson and Widdowson1978:Ph242) for the word tongue.

There is even a suggestion that [ŋɡ] has spread beyond the southerly and northerly limits of the boundaries indicated in the LAE. The map seemingly illustrates a new hotspot appearing in the northern part of Buckinghamshire, and parts of Northamptonshire and Milton Keynes, but careful study of the raw data suggests that this is simply an artifact of the low response rate around this area. However, Herefordshire does seem to be a genuine (albeit weak) hotspot (50%, N = 24), despite it lying completely outside of the older LAE isogloss. Turning to the northern limit of this boundary, our contemporary dialect data indicate that post-nasal [ɡ]-retention is prevalent throughout the county of Lancashire (68%, N = 779), spreading further northward than the LAE isogloss with evidence of [ŋɡ] in Preston and the Ribble Valley (though does not progress as far north as Cumbria,Footnote 3 where the green-shaded regions simply reflect a handful of postcode districts in this area having a 100% rhyming rate based on a sole respondent). We also find evidence of a more eastern spread with [ŋɡ] attested in parts of Nottinghamshire, where 74% of those from the NG23–25 postcode districts report a rhyme (N = 23).
It is also interesting to note that we find evidence of [ɡ]-presence in North Wales (also noted by Wells, Reference Wells1982:390), although there is unfortunately no SED data with which we can draw comparisons. Though these patterns should be interpreted with caution due to a scarcity of data for large parts of Wales, a closer look at the raw data confirms the presence of [ŋɡ] in the Welsh counties of Flintshire (78%, N = 27) and Wrexham (68%, N = 28), adjacent to the Wales-England border and the English county of Cheshire.
The only evidence we find of retrenchment is in the South East of England, where the pocket of [ŋɡ]-users reported in the SED has all but vanished: only 26% of respondents from Kent now report a rhyme (N = 182). While 26% may still seem somewhat high, there is likely a high false-positive rate in the responses to this question with survey participants incorrectly reporting a rhyme due to the subtle nature of this alternation between [ŋ]~[ŋɡ] and its contribution to the perception of rhyme in singer-finger.Footnote 4 For comparison, the rates of reported rhyming are similar in other regions where we have no reason to believe speakers retain [ɡ] and where no obvious hotspot emerges, such as East of England (31%, N = 850) and the North East (26%, N = 2098).
It is interesting that these results point more toward [ŋɡ] spreading rather than retreating, at least when compared with earlier survey data. As discussed elsewhere in this paper, these comparisons should be interpreted with some degree of caution due to the differences in population sample demographics. However, this finding does complement the results from independent work conducted in Greater Manchester and Lancashire, where the rate of postnasal [ɡ]-presence is in fact increasing in apparent time (Bailey, Reference Bailey2019b). This might suggest that the [ŋɡ] pronunciation is becoming more widespread both probabilistically and spatially, but further work needs to be conducted targeting these peripheral communities to assess the extent to which these survey results indicate diachronic change in the regional distribution of this form.
3.1.5 north–force merger
The seldom reported north–force distinction is a residual distinction left in very few parts of the English-speaking world, resulting in a difference between pairs such as for, four; war, wore and near-pairs such as sort, sport. The merger completed in Received Pronunciation in the twentieth century after previously diphthongal force shifted from [ɔə] to [ɔː] (Wells, Reference Wells1982:235). A similar process is now happening to cure (see Section 3.1.6). As noted by Labov (Reference Labov1994:316), the north–force distinction, where it remains, is not easily deduced from the spelling and thus likely must be learned in acquisition. For speakers who maintain a distinction, force has the vowel [ɔː], and north is lower than force, approximating a low-back [ɒː].
Although Scottish English is said to have not undergone this merger (Wells, Reference Wells1982:408), there are few reports of exactly where this distinction remains in England. Labov (Reference Labov1994:315) reports that it remains in r-pronouncing dialects in the North of England. This is not true for Blackburn in Lancashire but may refer to areas like Rochdale, which is claimed to have had older rhotic speakers until relatively recently (Wells, Reference Wells1982). The merger is nearly complete in North America, although this seems to be fairly recent in some regions. Kurath and McDavid (Reference Kurath and McDavid1961:121) discuss the “extensive preservation” of the distinction in the Eastern states but note that the distinction has disappeared in New York as it has done in London (but not the “folk dialects of England”). By the 1990s, however, the distinction seems to have rapidly all but disappeared, with Labov et al. (Reference Labov, Ash and Boberg2006) reporting the distinction only among a few speakers in Eastern New England, Southern Illinois, Indiana, and the Gulf States. The two phonemes are still distinct in many areas of Ireland (Wells, Reference Wells1982:421).
Map 6, which maps responses to the question “Do for and more rhyme for you?” reveals that there are areas of Britain today that retain a robust distinction. Manchester is one of them (and note that Manchester is not an r-pronouncing area). This distinction has been studied sociolinguistically in Manchester by Baranowski (Reference Baranowski2015), who notes that it is more common in working-class speech, and also shows a rare “part of town” effect in that speakers from North and Central Manchester are more likely to have it than speakers from South Manchester. Our findings confirm this. Although overall 36% (N = 1989) of people from the larger Greater Manchester metropolitan county are distinct, this effect is much stronger in North and East Manchester, and in the satellite towns to the North and East of the city: areas like Ashton, Bolton, Oldham, Rochdale, and Wigan tend to have higher rates of distinct speakers. Around 16% of Warrington (which lies between Manchester and Liverpool, N = 125) is distinct, which is the second highest area after Greater Manchester. This may be a good variable for delineating the Manchester-Liverpool divide, although we do have 10% of Merseyside speakers reporting a distinction (N = 500). In addition to these areas, the highest proportion of distinct responses in terms of postcode area in England is found in the TD area, which spans both England and Scotland on the eastern border (58%, N = 26). Because our results also show a lack of merger in Scotland, this is potentially another feature in which the bordering areas of the North East patterns with Scotland (see also foot–strut, Section 3.1.1), although the north–force distinction is comparatively more restricted, which may be expected given its disappearance in the rest of the English-speaking world.Footnote 5
Do for and more rhyme for you? Dark blue areas represent negative responses (i.e. distinct vowels). Black LAE isoglosses reflect areas with different phones in forks (Orton et al. Reference Orton, Sanderson and Widdowson1978:Ph47) and ford (Orton et al. Reference Orton, Sanderson and Widdowson1978:Ph49).
Map 6 also includes a newly developed 1950s isogloss of the merger, created from the available LAE map data. This is based on the phonetic transcriptions of the words forks (representing north) and ford (representing force), selecting out areas where these words are transcribed with different phones. The LAE findings map fairly closely to the northernmost limit of our data, but the distinct area to the south of Manchester encompassed in the 1950s isogloss has since disappeared. There are two additional areas encompassed in our newly created 1950s isogloss: a section of the West Midlands on the Welsh border and an area running from the West Midlands to the north of Oxfordshire. Although there is some evidence that older speakers in the Black Country had a distinction fairly recently (Clark, Reference Clark, Kortmann and Upton2008:153), we find little evidence of a remaining distinction in these areas for our speaker set.Footnote 6 The apparent expansion of the distinction beyond the 1950s boundary slightly to the east of Manchester is likely merely because the SED did not survey anyone from this area. If Oldham, for example, had been included in the SED, the isogloss would be slightly farther east.
Thus, it seems the progression of the north–force merger is well on its way in England, in line with Herzog’s corollary to Garde’s Principle: that mergers expand geographically at the expense of distinctions (Herzog, Reference Herzog1965; Labov, 1994; Reference Labov2007). Further investigation of our data with reference to age patterns is a potential future avenue for research on this variable, although data from older speakers in key areas will be vital to assessing the death of this distinction. Sociolinguistic analyses, such as Baranowski (Reference Baranowski2015), are the key to understanding how such distinctions are lost within a speech community.
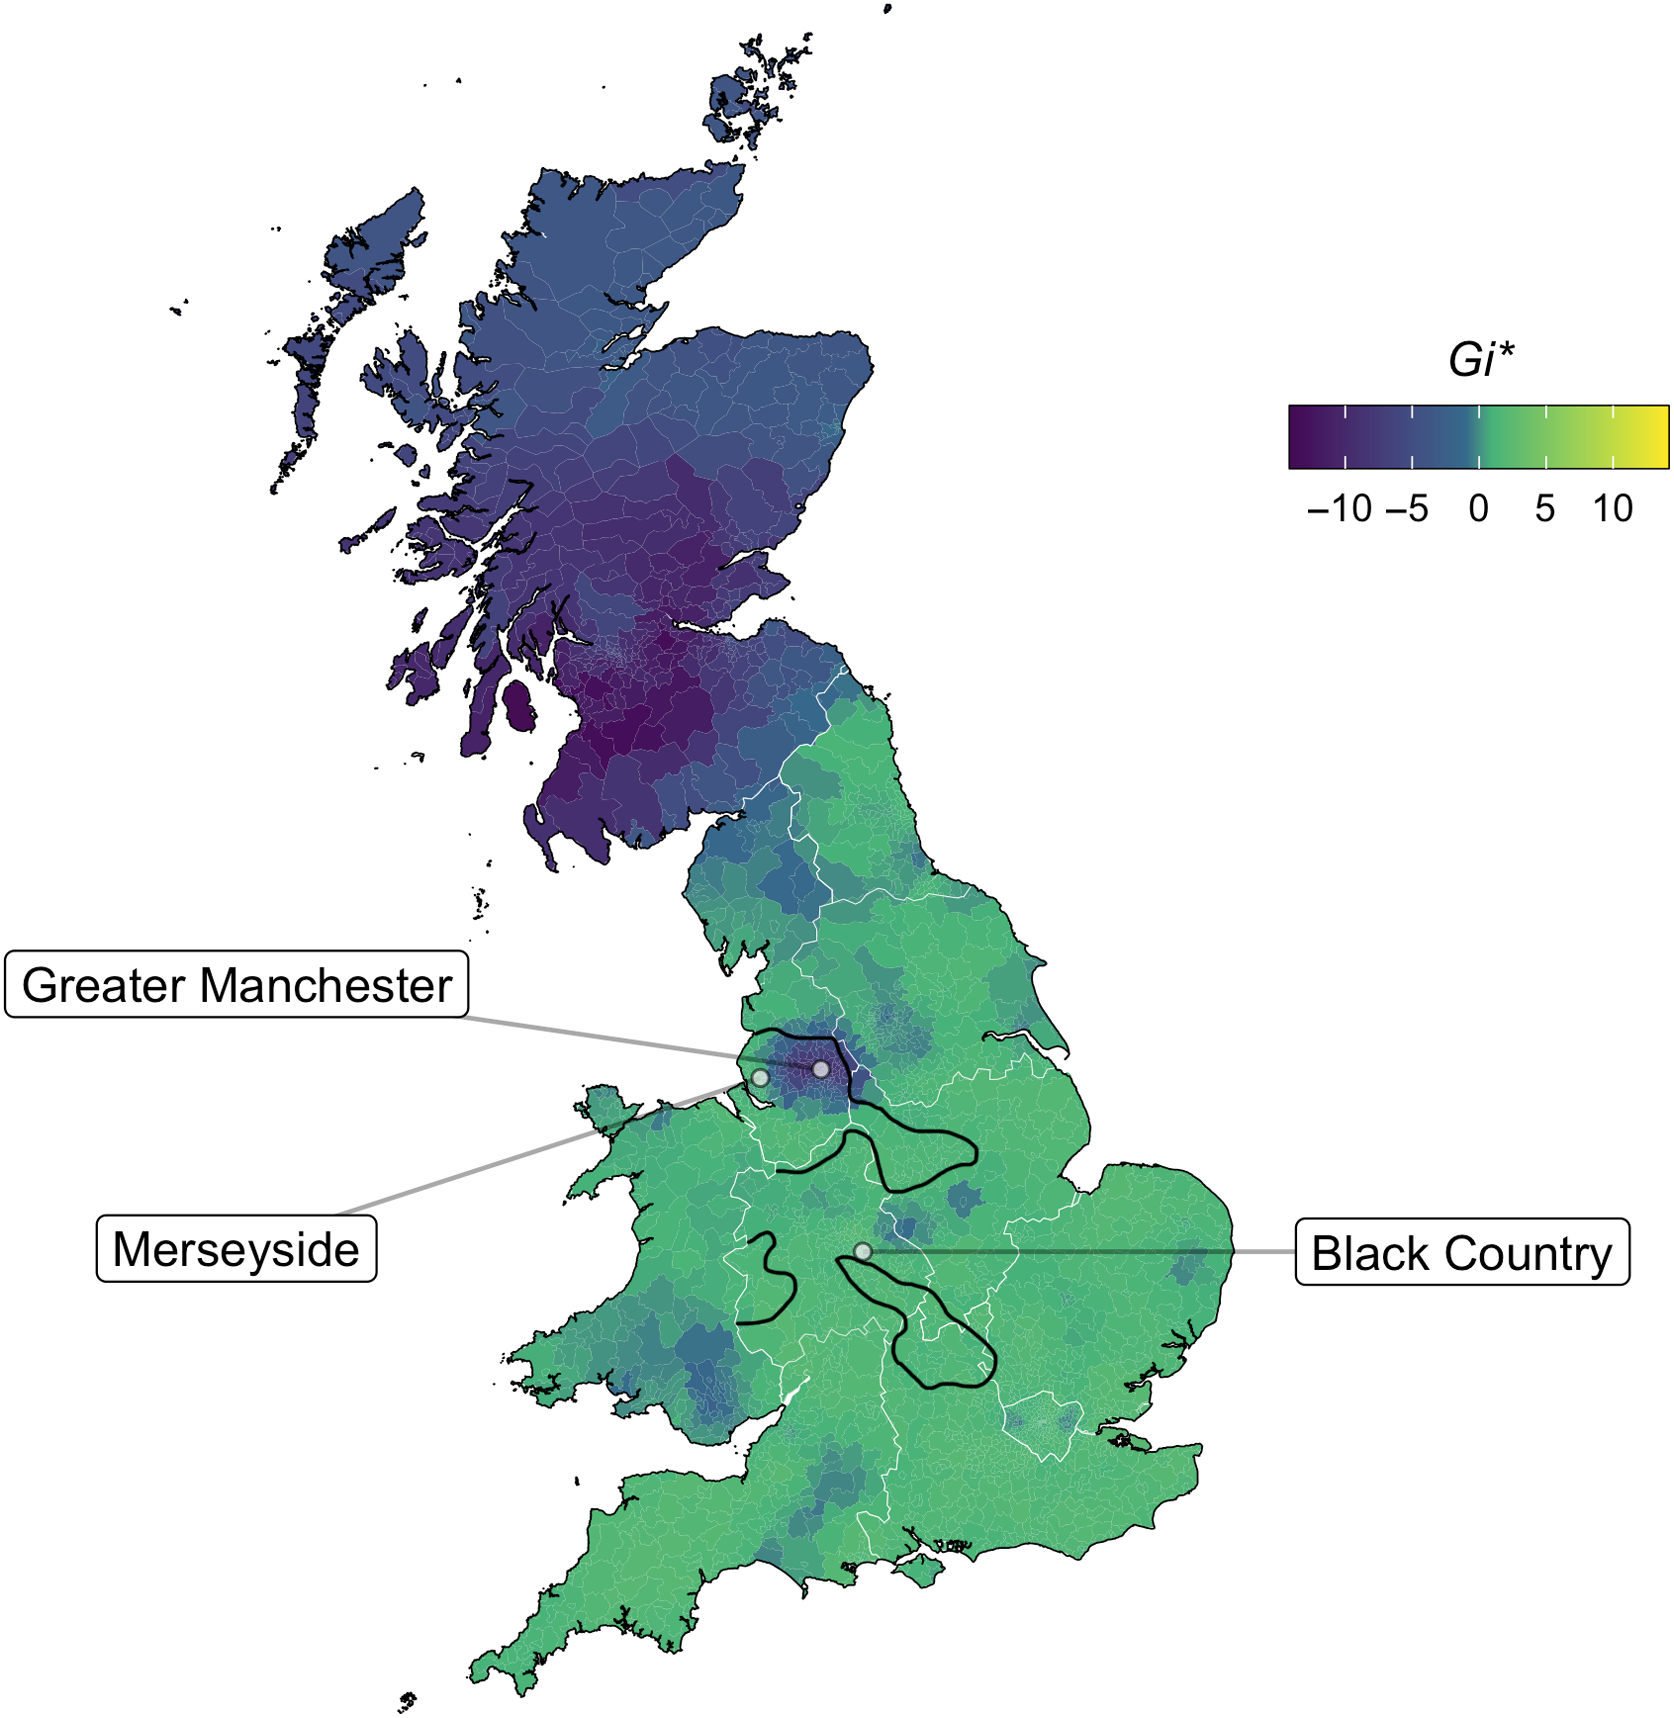
3.1.6 force–cure merger
The collapse of the force–cure distinction, labeled the second force merger by Wells (Reference Wells1982) (the first being the collapse of north–force; see Section 3.1.5), is an ongoing sound change in present-day English that likely involves a merger by transfer (Labov Reference Labov1994:321). Members of the cure set (some of which involve a preceding yod), which would traditionally be pronounced with [ʊə], move to the force set and are pronounced with monophthongal [ɔː]. For many accents today, the loss of this final schwa offglide in dipththong cure is complete, meaning that poor, traditionally [pʊə], is now realized in the same way as pour, that is, [pɔː]. Thus, these lexical sets are no longer distinct for many speakers (Hughes et al., Reference Hughes, Trudgill and Watt2012:50).
The cure vowel exists in a relatively small number of words (e.g., cure, tour, poor) for speakers in areas that retain it, and it is variable in Received Pronunciation today (Lindsey Reference Lindsey2019). For some northern varieties, the lexical incidence of various words may be different from Received Pronunciation. For example, in parts of Lancashire and Yorkshire, door can be heard as cure rather than force; see also Stoddart, Upton and Widdowson (Reference Stoddart, Upton, Widdowson, Foulkes and Docherty1999:73). On the whole, it seems as though younger speakers have mostly lost this distinction, at least in England, although there are some regional exceptions such as the North East.
Map 7 maps responses to the question “Do pour and poor sound the same to you?” where darker blue areas reflect the persistence of the force–cure distinction.Footnote 7 Overall, our data show a 23% rate of retention of the distinction. The regional preferences for a distinction are found throughout the North East, which shows an overall figure of 77% distinct (N = 2098), the highest region of all; we find as much as 94% distinct in some areas of Sunderland, Teeside, and Durham. Carlisle and the surrounding areas of Cumbria pattern with the North East, but are categorized as North West geographically, demonstrating that dialect contact and diffusion does not obey county lines. Yorkshire and the Humber is the second highest region retaining the distinction but with a steep drop to 23% (N = 1944), matching the overall average of our dataset. Major cities such as Leeds and Sheffield seem to be merged, but smaller places in between these larger urban areas retain a distinction, demonstrating that cities can show the effects of sound change first (Britain, Reference Britain, Chambers, Trudgill and Schilling-Estes2002b; Trudgill, Reference Trudgill1974). This is further demonstrated in Table 3, which shows the rates in Leeds and Sheffield alongside smaller towns in between: Rotherham and Barnsley are much further behind nearby Sheffield in terms of merging the sets. Leeds, the bigger city, is ahead with a mere 8% distinct, but this is also matched by nearby smaller Wakefield. Bradford, close to Leeds, shows a similar result of 8% distinct. This merger is ripe for further analysis of the demographic factors affecting networks in these areas, including population movement, transport routes, commuting, and sociolinguistic factors: Why are the areas close to Leeds matching the big city’s rates, but the areas that are a part of the Sheffield postcode area, Barnsley and Rotherham, remain relatively stable? It is likely that the merger will show an effect of age, with younger speakers being more likely to be merged. That said, it is important to note that in areas such as the North East, younger speakers remain firmly distinct.
Do pour and poor sound the same to you? Dark blue areas represent negative responses (i.e., distinct vowels).

Major cities of Leeds and Sheffield with in-between towns showing the force–cure distinction (from north to south). Leeds postcodes were taken as LS1–20 and LS25–27; Wakefield, WF1–4; Barnsley, S70–75; Rotherham, S60–63, and Sheffield, S1–17, S20–26, S35–36, S94–99

3.2 Lexical variables
3.2.1 Bread roll
The diversity of words for a small round bread in British English has been a topic of popular discussion since well before our survey. We elicited words for this item using a picture-naming task; the picture we asked respondents to name can be seen in the Appendix (Figure 1). Our survey gave respondents eight items to choose from: barm, bap, batch, bun, cob, muffin, roll, and tea cake, in addition to a write-in option.Footnote 8
Map 8 maps the eight variants provided by the survey. It shows that the terms for bread roll divide the country into a number of finely demarcated divisions. Barm is confined to the North West, comprising an area that runs from Manchester westward to Liverpool and northward into the western half of Lancashire (from Blackpool to Preston). Tea cake spans the eastern half of Lancashire (Blackburn, Burnley) and the western half of West Yorkshire (Bradford and areas around Leeds). Muffin is perhaps the most geographically localized, confined to East Manchester and areas such as Oldham and Rochdale. Cob is largely concentrated in the Midlands around Nottinghamshire. Batch is used in two very small areas: Liverpool, in the North West, and Coventry, in the West Midlands. Bap is fairly widespread, but is most concentrated in Staffordshire, the West Midlands (Stoke-on-Trent, Birmingham), and North Wales. Bun, similarly, is fairly widespread, but maintains a stronghold in a broad area of the North East, extending from north of Newcastle down to northern Lincolnshire, tracing a diagonal line north of Leeds over to Cumbria. Finally, roll is apparently the normative choice, the most chosen variant and the one with the widest spread across the country, predominating in the South and in Scotland. The general picture is of considerable lexical diversity in the North and Midlands, and much more homogeneity in the South.
What is your word for a small round bread? Light yellow areas represent respondents who selected the indicated variant.

Some communities are fairly homogeneous in their choice of response. For instance, in the Nottingham postcode area, 268 out of 309 respondents (87%) selected a single option. Moreover, 174 of those 268 single-choice responses were cob (65%). By contrast, Birmingham shows a similar percentage of respondents choosing a single option (81% out of 258), but no variant shows a majority, with 41% roll, 20% bap, 17% cob, 14% bun, and the remaining 8% reflecting minority variants such as batch and bread cake. A fruitful direction for future research is to determine whether these responses pattern among social or geographical lines within the metropolitan area or whether they might reflect the effects of mobility and dialect contact on our respondent population, given the ease with which new lexical variants can be acquired (Chambers, Reference Chambers1992).
The regional divisions we find in the names for bread roll do not neatly align with the regions demarcated by phonological variants. For instance, while there is some overlap in the regions with the nurse–square merger (Section 3.1.2) and the regions that say barm, the barm area goes farther east, to Manchester, while the nurse–square merger definitively stops short of that city. Similarly, there is an area of overlap in East Manchester between speakers with the north–force distinction (Section 3.1.5) and those who say muffin, but the north–force distinction extends farther west, to Warrington, where 19% of respondents report a north–force distinction, but only 1% report using muffin (N = 422). This kind of mismatching between phonological and lexical variants has been noted in other dialect surveys that consider variables at different levels of grammar (Labov et al., Reference Labov, Ash and Boberg2006).
3.2.2 Ice lolly
As is the case with the names for a small round bread (Section 3.2.1), the variation in whether a frozen confection on a stick (also known in American English by the generic trademark popsicle) is called an ice lolly or a lolly ice is the subject of considerable interest among laypeople but given little attention by dialectologists. Lay discussions of the variation pinpoint the lolly ice variant to Liverpool (e.g., Anonymous, 2012). As with the bread variable, we elicited words for this item using a picture-naming task with a set of predetermined choices; the picture we asked respondents to name can be seen in the Appendix (Figure 2).
The first thing to note about Map 9 is that it should be taken with caution, as this question was only added to our survey toward the end of our data collection period, so the response rate is much lower than for other variables (N = 1738), and responses are not distributed evenly across the country. That said, we have a decent number of responses from Merseyside (N = 72) and elsewhere in Northwest England (e.g., Lancashire, N = 144), so we can draw some conclusions about that part of the country.
What is your word for a frozen treat on a stick? Light yellow areas represent respondents who selected the term lolly ice.

The lay perception that lolly ice is a Liverpool variant is entirely accurate. The form is remarkably localized to the Liverpool area. It extends along the Wirral peninsula to the south, and eastward to St. Helens, but stops short of Greater Manchester. Its northern border is roughly Southport, still in Merseyside. Of our 72 respondents from Merseyside, 33 of them (46%) responded that they would use the term lolly ice; moreover, only two of those also identified ice lolly as a possible variant. This rate of lolly ice usage starkly contrasts with that of nearby regions in the North West: 10% lolly ice in Cheshire (N = 63), 1% in Lancashire (N = 144), and less than 1% in Manchester (N = 394). Lolly ice clearly is a variant that is used only in the Liverpool area and is used nearly exclusively among those who do use it.
We additionally find evidence for the use of lolly ice in North East Wales. The CH7 and CH8 postcode areas (both in the county of Flintshire, Wales) each show presence of lolly ice (CH8: 3 out of 4 respondents; CH7: 3 out of 7 respondents). Although the token counts are very low, instances of lolly ice usage in the rest of the country are so rare that they suggest this form to be a genuine variant in this county.Footnote 9 In this respect, the western edge of lolly ice accords with that of velar nasal plus (Section 3.1.4), where a feature of North West England was also found to extend to Flintshire. This observation is generally consistent with sociophonetic studies of North East Wales (Morris, Reference Morris2013; Reference Morris2017), and also studies of perceptual dialectology where nonlinguists have labeled this area of Wales as “Scouse” and sounding like Liverpool (Williams, Garrett & Coupland, Reference Williams, Garrett and Coupland1996).
3.2.3 Names for the evening meal
The terminology used in referring to the midday and evening meals, and the time at which the “main” meal was eaten, was once strongly divided along socioeconomic lines. In the eighteenth and nineteenth centuries, the wealthy upper classes ate their largest meal later in the evening, calling it dinner (or supper if the meal was more informal), and would have a lighter meal called lunch(eon) during the day. The working classes, on the other hand, would have dinner during the day and high tea in the evening as a source of sustenance after returning home from a long day of work (Bender, Reference Bender2009; Ayto, Reference Ayto2012). Although class divisions had arguably weakened by the mid-twentieth century, Ross (Reference Ross1954:43) does list this variable when discussing British “sociolects” and describes the use of dinner for the evening meal as a feature of “U-English” (i.e., the variety spoken by the upper class).
More recently, these class divisions have further diminished, and this variable has become a marker of regional varieties. The use of tea rather than dinner in referring to the evening meal is now considered a chiefly northern form (though this still may interact with social class, with middle-class northerners preferring dinner over the regional form), but the exact geographic perimeter of this difference is not yet known. This variable is particularly interesting, being a case of lexical variation in which confusion can arise due to cross-region polysemy: the same word (dinner) is used to mean different things depending on the variety of English spoken. In Map 10, we map the distribution of respondents who indicated that they refer to the evening meal as tea.
What is your word for the evening meal? Light yellow areas represent respondents who selected the term tea.

While a very clear pattern emerges between the North and South of England, this variable does not neatly divide the country into two halves in the same way that, for example, the foot-strut split does (as described in Section 3.1.1). Although dinner is still the preferred term throughout the South, there are areas where its use is far from categorical and where more localized hotspots emerge in which the use of tea is surprisingly high, such as Cornwall (where 45% select tea in their response, N = 62), Devon (47%, N = 75), and Somerset (47%, N = 64) all in the South West, and Suffolk (43%, N = 89) in East Anglia. As pointed out by an anonymous reviewer of this paper, it is interesting to note that the western parts of Norfolk and Suffolk, where use of tea is relatively high for the wider region, are also the ones least affected by counterurbanization and rural gentrification. Coupled with the observation that there are differences in this region between the center of Cambridge and the northern edge of the wider Cambridgeshire county, which are not connected with strong transport links, this points to the importance of interpreting these results in the context of population dynamics and the rural versus urban distinction (a point made earlier in Section 3.1.6, on the force-cure merger).
It appears from Map 10 that the most obvious contrast lies between the northern regions (i.e., the North West, North East, and Yorkshire) and the South East, where the former are tea strongholds and the latter dinner. However, it is of note that there is a much greater level of homogeneity in the South East, where 84% (N = 1159) use the favored variant dinner, and particularly in London, where that proportion rises to a near-categorical 95% (N = 956). Contrast this with the northern regions, where the dominant form tea is still only used by 67% of respondents in the North West (N = 4161) and North East (N = 2098), and by 69% of those in Yorkshire (N = 1944). The fact that more variation is found in the North may reflect some residual class effect with northerners of higher socioeconomic status resisting the regional form, similar to what we suggest for foot–strut in Section 3.1.1. There is, in fact, interesting evidence of co-variation between these variables. Of the northerners without a foot–strut distinction, 25% (N = 6462) report use of dinner, but this increases to 43% for northerners who report a phonemic split in foot-strut (N = 1742). Additionally, some survey participants report using both forms and provide qualitative comments revealing that the choice depends on the size and type of meal (for example, normally tea, but dinner if eaten in a restaurant).
3.3 Grammatical variables
3.3.1 Second person plural yous(e)
Standard English lacks a second person plural form, but many variants exist to fill that paradigmatic gap across regional and vernacular varieties (Wales, Reference Wales2004). Of these variants, our survey investigated yous (also spelled youse). This second person plural form is found throughout the English-speaking world, attested in American, Canadian, British, Irish, New Zealand, and Australian Englishes (Bauer, Reference Bauer2002; Clarke, Reference Clarke, Bernd Kortmann, Mesthrie, Schneider and Upton2004; Hundt, Hay & Gordon, Reference Hundt, Hay, Gordon, Bernd Kortmann, Mesthrie, Schneider and Upton2004; Pawley, Reference Pawley, Bernd Kortmann, Mesthrie, Schneider and Upton2004; Quinn, Reference Quinn, Peters, Collins and Smith2009; Wales, Reference Wales2004). Its considerable spread has been traced to a source in Irish English (possibly calqued from Gaelic); it is localized to areas that experienced high volumes of Irish immigration in the nineteenth century (Beal, Reference Beal, Bernd Kortmann, Mesthrie, Schneider and Upton2004; Filppula, Reference Filppula, Bernd Kortmann, Mesthrie, Schneider and Upton2004; Wales, Reference Wales2004).
Within England, commonly cited areas of yous(e) use are Liverpool and the North East (Newcastle, Tyneside) (Beal, Reference Beal, Bernd Kortmann, Mesthrie, Schneider and Upton2004; Filppula, Reference Filppula, Bernd Kortmann, Mesthrie, Schneider and Upton2004; Wales, Reference Wales2004). Beal additionally includes “inner-city” Manchester on this list (2004:114). This latter inclusion accords with the dialect survey results presented in Cheshire et al. (Reference Cheshire, Edwards and Whittle1993). Cheshire et al. find that all four survey sites in the core of the Manchester metropolitan area reported the local occurrence of yous(e) but that only one out of nine sites in the rest of the Manchester metropolitan area, and one out of four sites in the rest of the North West, reported use of the form. (The absence of Liverpool from Cheshire et al.’s survey sites likely explains the surprisingly low rate of yous(e) use in the general North West.) All of the British urban areas where yous(e) has been reported experienced substantial Irish settlement in the nineteenth century; see Honeybone (Reference Honeybone, Grant and Grey2007) and references cited therein (fn. 2).
As shown in Map 11, our survey results confirm a high rate of use of yous(e) in the North East. In the NE (Newcastle) postcode area, 51% of 1,105 respondents selected yous as an option, with usage continuing southward through Middlesbrough (TS postcode area: 44%, N = 203). Rates are much lower in other Northern urban areas, indicating that yous(e) is not simply a pan-Northern phenomenon: compare York (14%, N = 185), Leeds (11%, N = 294), and Sheffield (7%, N = 272).Footnote 10 We additionally find a relatively high rate of yous(e) acceptance in Scotland (33%, N = 263), consistent with previous findings (e.g., Filppula Reference Filppula, Bernd Kortmann, Mesthrie, Schneider and Upton2004).
How would you address a group of two or more people? Light yellow areas represent respondents who selected the pronoun yous.
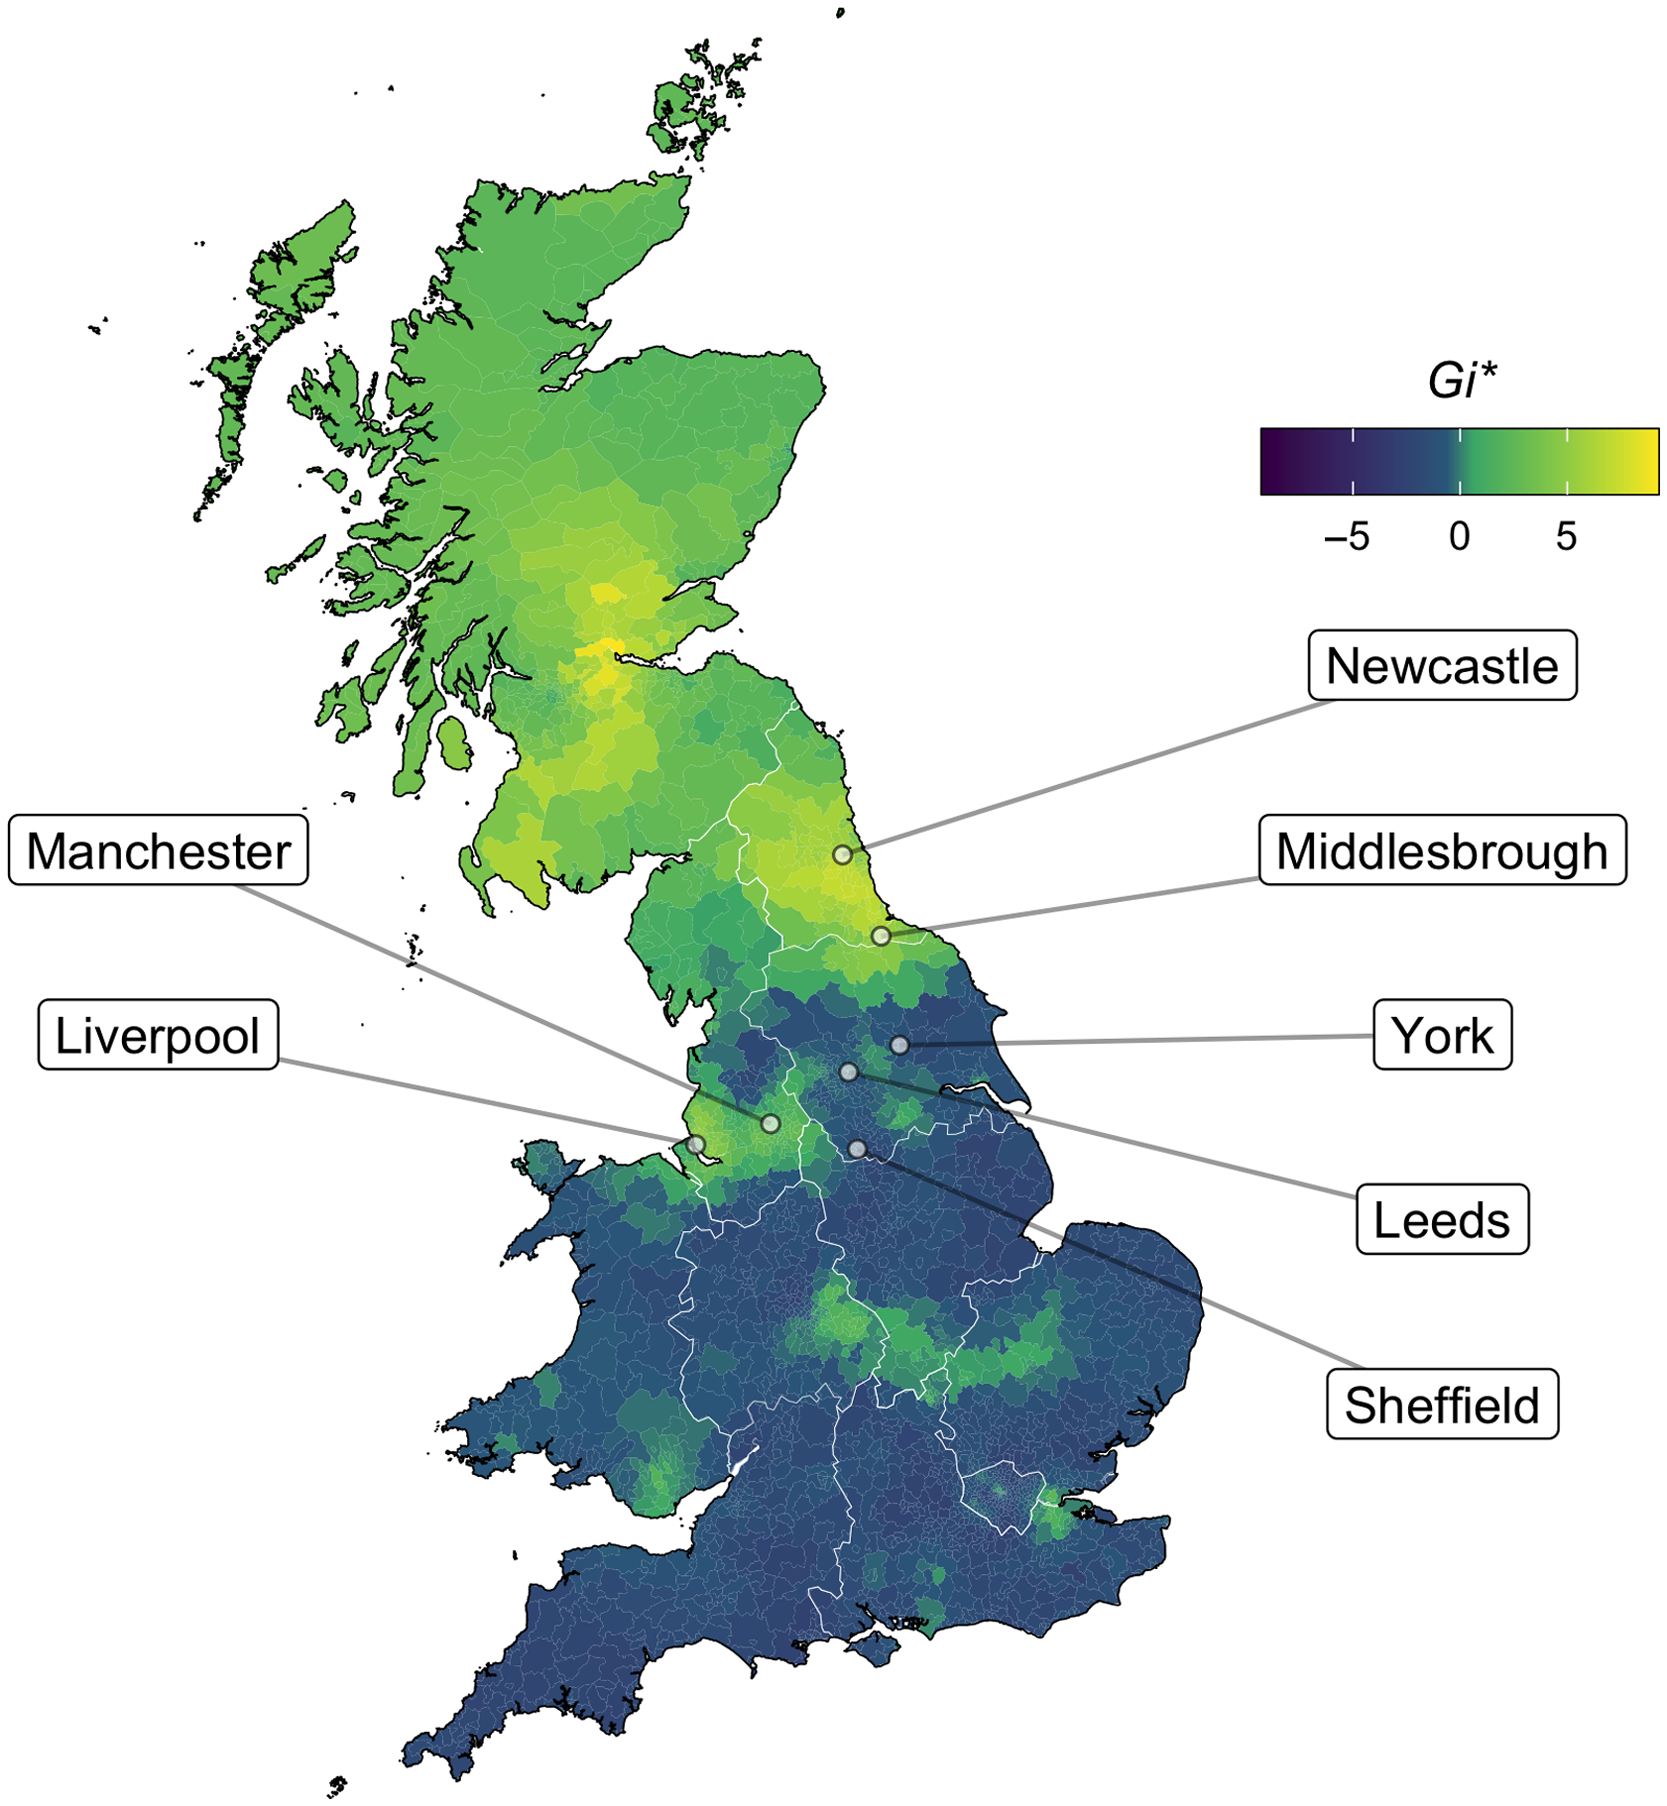
Compared to the concentration of the form seen in Newcastle, yous(e) is weaker, but still prevalent, in a corridor of the North West extending from Liverpool (L postcode: 34%, N = 164) to Manchester (M postcode: 25%, N = 448). Here, however, yous(e) competes more strongly with alternatives such as you guys and you lot. The general picture is that when yous(e) is used in England, its utterer is almost certainly from either the North East or the North West, but that speakers from the North West use yous(e) less exclusively than those from the North East do. Still, our findings agree with those of previous research in that yous(e) tracks areas of heavy Irish settlement.Footnote 11
3.3.2 Give it me
Variability in the English ditransitive, or dative, construction has been the subject of much interest in the linguistic literature. Variation between what is called the full double-object construction (with two full noun phrase objects, as in Dad read the baby a story) and the full prepositional dative (with one full noun phrase object and one prepositional phrase, as in Dad read a story to the baby) is widespread across Englishes around the world (Szmrecsanyi, Grafmiller, Bresnan, Rosenbach, Tagliamonte & Todd, Reference Szmrecsanyi, Grafmiller, Bresnan, Rosenbach, Tagliamonte and Todd2017). In addition, there are regionally localized variants.
Our interest here is in a particular variant of the ditransitive when both nonsubject arguments are pronouns. As in ditransitives with full noun phrases, speakers can allow a prepositional dative construction (e.g., Dad read it to him). While double-object constructions where the goal precedes the theme (as in Dad read him it) are uncommon (Szmrecsanyi, Grafmiller, Heller & Röthlisberger, Reference Szmrecsanyi, Grafmiller, Heller and Röthlisberger2016), speakers in parts of Britain can allow an alternative double-object construction in which the theme precedes the goal (e.g., Dad read it him). It is this third variant that is the subject of our attention here; henceforth, we call it the “alternative double-object construction,” but it should be understood that we are referring only to that construction when both objects are pronominal.Footnote 12
The Survey of English Dialects found that the alternative double-object construction is attested across much of the North West and Midlands, with small pockets of use in the extreme South West and South East as well. Research using present-day spoken corpora confirms its prevalence in the North West and Midlands (Gerwin, Reference Gerwin2013; Yáñez-Bouza & Denison, Reference Yáñez-Bouza and Denison2015), as does research using Twitter data (Stevenson, Reference Stevenson2019). Stevenson’s Twitter data additionally reveal fine-grained regional differences within the North West and Midlands in the actual rate at which the alternative double-object construction is used relative to the two other variants.
The patterns in Map 12 broadly agree with the give it me isoglosses from the Linguistic Atlas of England (superimposed in black), as well as the patterns found by Stevenson (Reference Stevenson2019) on Twitter, demonstrating consistency across different methodological approaches. Acceptance of the form predominates in the North West (80% acceptance, N = 4162), continuing down through the West Midlands (70% acceptance, N = 791) to the Severn Estuary, and into the East Midlands as well (72% acceptance, N = 1084). The farther to the northeast we go, the less acceptable give it me becomes: hence, we find 87% acceptance in Sheffield (N = 497), 56% in York (N = 256), 41% in Teesside (N = 243), and 25% in Newcastle (N = 1218). This is in direct agreement with the LAE, which also found give it me to be a North West and West Midlands form, with some spillover into the East Midlands. Though our map does show more acceptance of give it me in Yorkshire than would be expected from the LAE isogloss, it is worth bearing in mind the methodological differences between the two projects: the SED elicited one preferred dative construction from each respondent, while our survey asked for acceptability judgments of the alternative double-object construction in particular. It is thus very possible that those SED respondents who generally accepted the construction would have shown a wider distribution than those for whom this construction was their primary variant.
The acceptability of the alternative double-object construction with pronominal arguments. Light yellow areas represent respondents who said that either they or those in their area would use give it me. LAE isoglosses from Orton et al. (Reference Orton, Sanderson and Widdowson1978:S1).
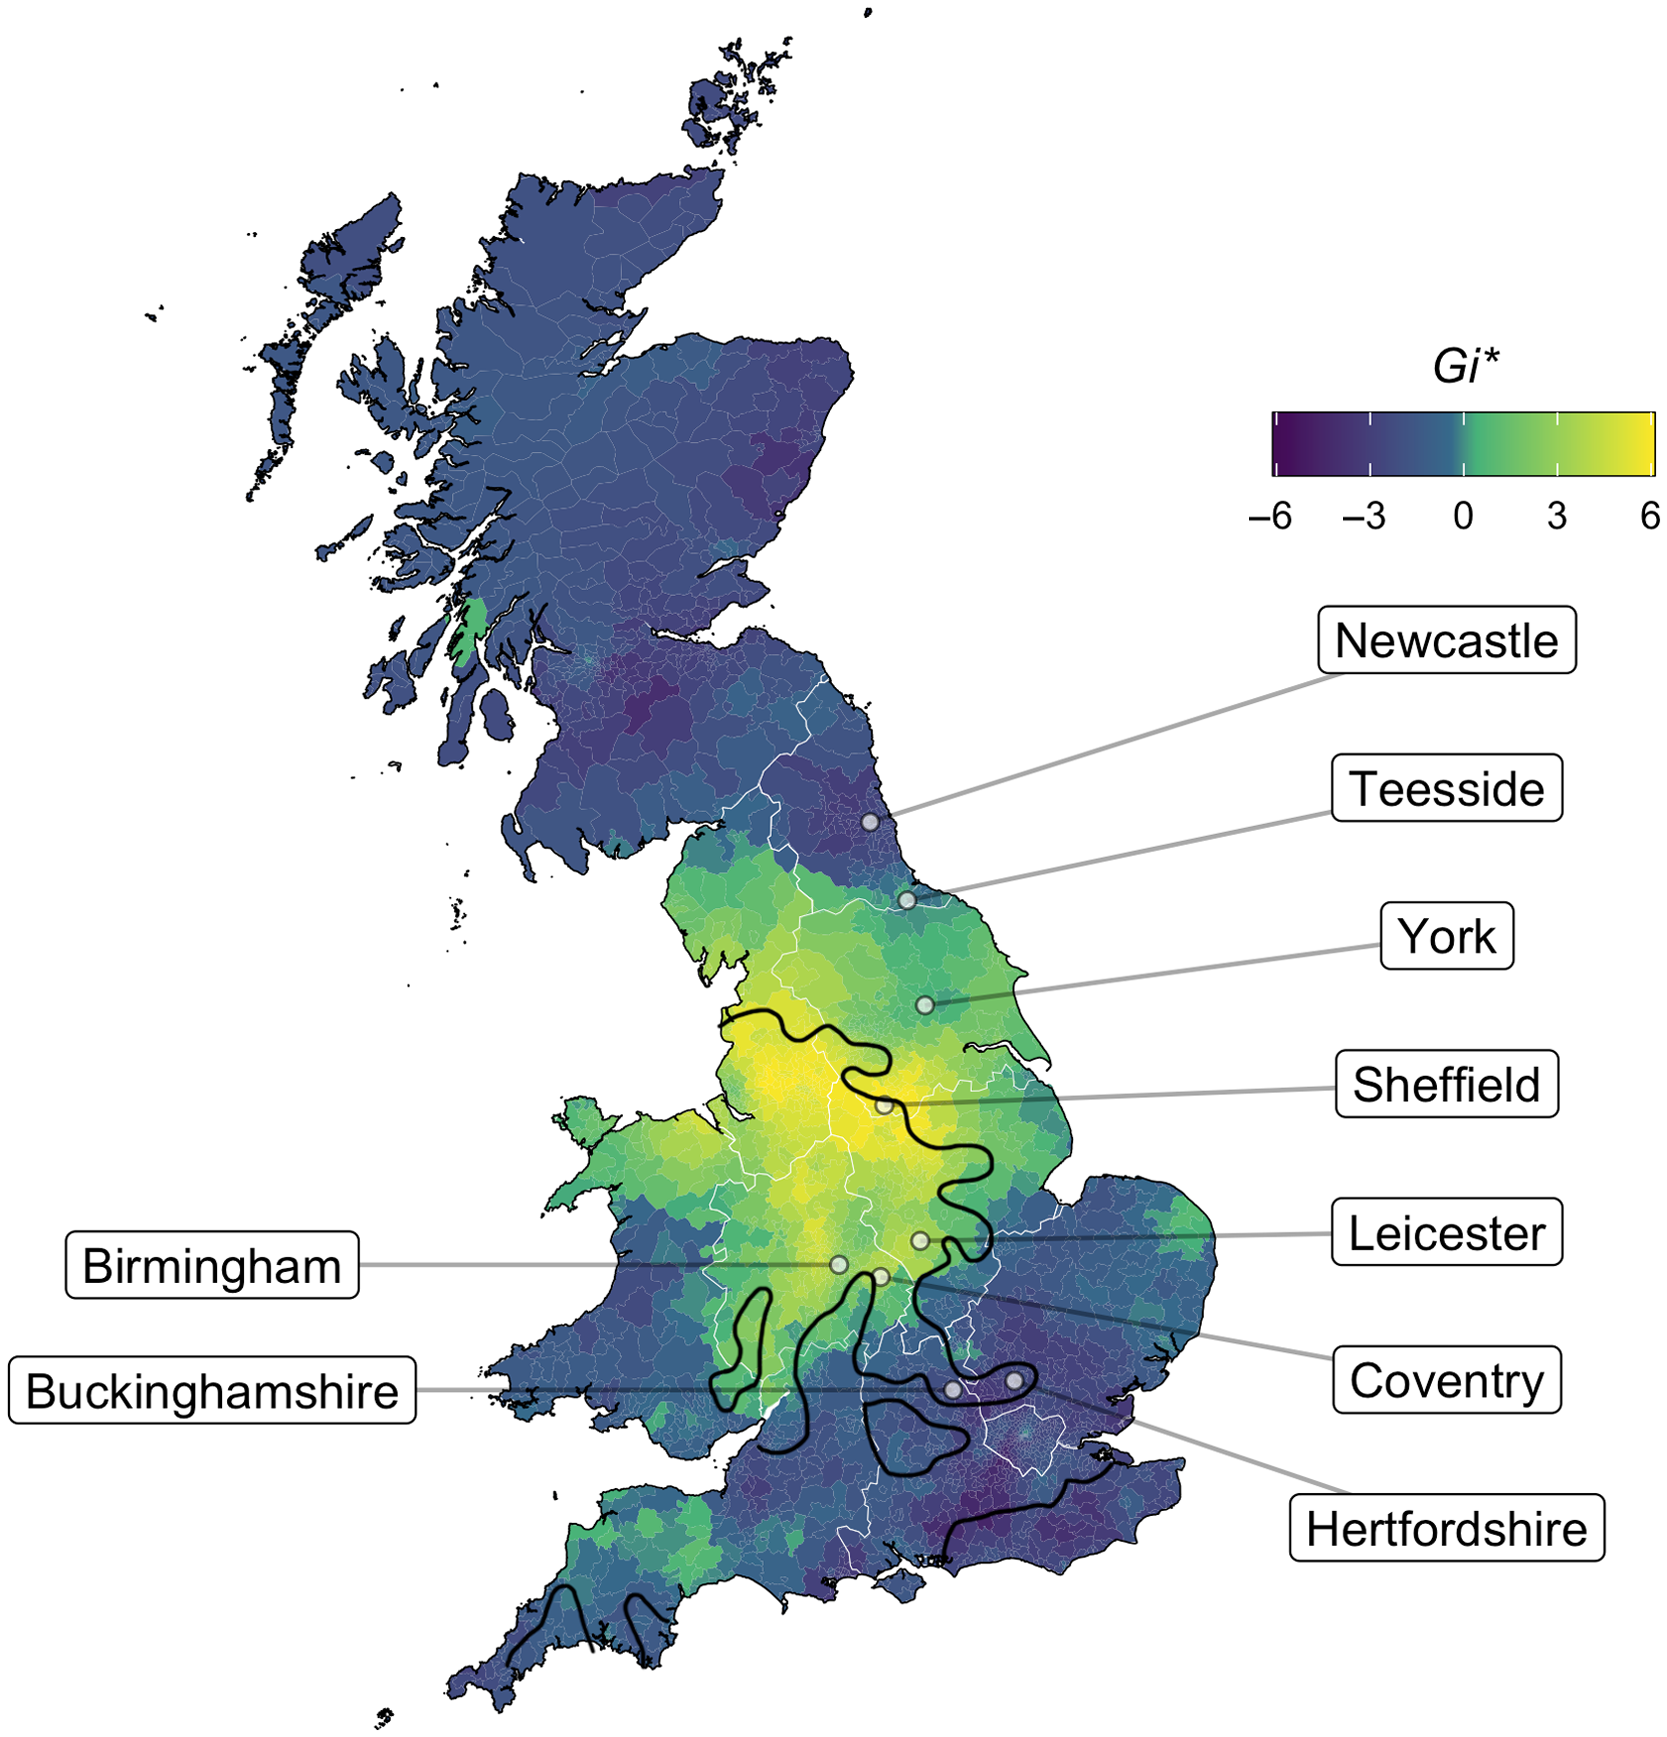
That said, we do find a slight departure from the LAE in the precise location of the southern border of the give it me stronghold. We find the boundary of give it me acceptance to be firmly in the Midlands, just south of Birmingham (65% acceptance, N = 258), Coventry (64%, N = 100), and Leicester (71%, N = 200). The LAE shows give it me usage to extend farther south than this, through Buckinghamshire into Hertfordshire, but our data find only 19% give it me acceptance in each of these counties (Buckinghamshire N = 94, Hertfordshire N = 219). The LAE additionally shows pockets of give it me use in the extreme South West and South East, which do not surface in our data.Footnote 13 This suggests that there has been some attrition of give it me in the decades since the SED data were collected, and in this respect the give it me pattern is reminiscent of what we found for foot–strut, where our data also show that the southern boundary has shifted north compared to that presented in the LAE (Section 3.1.1). In fact, the southern boundary of give it me in our data is nearly identical to that of foot–strut, suggesting that the two might covary and raising the questions of whether they have changed together over the course of the twentieth century and whether similar social evaluation underlies each.
3.3.3 Was-leveling
There is considerable dialectological and sociolinguistic research on variation in the use of was and were in nonexistential constructions. Rupp and Britain (Reference Rupp and Britain2019:ch. 4) provide a comprehensive summary and synthesis of over a hundred different studies of this variation. Throughout the literature, three main patterns of variation arise:
-
1. “Was-leveling,” where was can be substituted for standard were in all contexts: e.g., We was outside and she was outside. We wasn’t inside and she wasn’t inside.
-
2. “Were-leveling,” where were can be substituted for standard was in all contexts: e.g., We were outside and she were outside. We weren’t inside and she weren’t inside.
-
3. A “mixed system,” where was is substituted for standard were in affirmative clauses, while weren’t is substituted for standard wasn’t in negative clauses: e.g., We was outside and she was outside. We weren’t inside and she weren’t inside.
(The fourth logical possibility, a mixed system with were in affirmative clauses and wasn’t in negative clauses, is rare [Rupp & Britain, Reference Rupp and Britain2019:176].)
Within the three main patterns, there are subtleties to the variation: it is sensitive to contextual factors such as subject type, and it shows social correlates within communities. Additionally, the different patterns are not all equally attested throughout Britain, which is our interest here.
Our survey asked only about the acceptability of sentences with regularized was (i.e., was in place of standard English were) in affirmative clauses. This means we are unable to comment on the regional distribution of were-leveling (pattern #2 above), or on whether leveled was co-occurs in any region with leveled weren’t (pattern #3 above), as opposed to was being leveled throughout the system, in negative as well as affirmative clauses (as in pattern #1). However, we can still compare our patterns to those of previous research on the leveled was pattern and on the mixed system, both of which regularize past be to was in affirmatives.
Our survey initially asked only about leveled was with the second person subject you. Later instantiations of the survey contained questions with three more subjects: we, they, and the plural noun phrase the beaches. As Rupp and Britain (Reference Rupp and Britain2019:ch. 4) discuss at length, was-leveling has not been attested in all four contexts equally.
Historically, dating back to Middle English, was-leveling was found in the North with singular you, a pattern that stretched down into the Northern Midlands and has continued diffusing southward, such that was-leveling with you is now found as far south as London. Additionally, in the North there has historically been evidence of was-leveling with plural nonpronominal subjects (such as the beaches). Singular agreement with a plural nonpronominal subject like this is reminiscent of what is known as the Northern Subject Rule, a pattern under which plural nonpronominal subjects take third singular -s verbal marking in the present indicative (e.g., de Haas & van Kemenade, Reference de Haas and van Kemenade2015). This Northern pattern of was with plural nonpronominals has been observed in SED materials among speakers from the Central North; more recently, variationist studies have found it in Buckie, Scotland; Newcastle; Reading; and Inner London, demonstrating that it, too, has spread widely. Where was is leveled with plural nonpronominals, it tends to be avoided with they; this is again a Northern Subject Rule type of effect, by which there is different agreement patterning for nonpronominal versus pronominal plural subjects. Areas in East Anglia, by contrast, show the reverse pattern, with more leveled was after they than after plural nonpronominals; Rupp and Britain (Reference Rupp and Britain2019) call this the “East Anglia Subject Rule” but also suggest that it may be more broadly Southern. Finally, recent studies have shown increased leveling of was with we, an environment where it was generally not attested historically.
Map 13 plots acceptance of the four different constructions under study. Before considering the regional distribution of responses, it is informative to look at the variation in acceptability rates across the different subjects. Bearing in mind that we have much more data for you was than the other three, this construction does show the highest acceptance rate: 52% of 11,846 responses. This is consistent with the literature, which has found you to be the most common environment for was-regularization both diachronically and synchronically. That is, leveling with you has been attested since Middle English; you is also the most common environment for leveled was in many communities, including York (Tagliamonte, Reference Tagliamonte1998:180), Buckie (Smith, Reference Smith2000:66), the Fens (Britain, Reference Britain2002a:32), and London (Cheshire & Fox, Reference Cheshire and Fox2009:21).
The acceptability of was-leveling with different subjects. Light yellow areas represent respondents who said that either they or those in their area would use leveled was with the indicated subject.

The remaining two pronouns show comparable amounts of leveling: 38% acceptance of they was, and 36% acceptance of we was. Finally, acceptance of leveling with the nonpronominal subject the beaches is at only 26%.Footnote 14 Note that we only have 5,708 data points for these three constructions.
There are a few points of interest in Map 13. First of all, we can see that regions where leveling is most accepted are the North West, Yorkshire and the Humber, the Midlands (both West and East), and London. To a lesser extent, we also see acceptance of leveling in the East of England and in the South West. By contrast, acceptance rates are comparatively low in the North East, the South East (outside of London), and Scotland. To some extent, this aligns with previous research: was-leveling has been historically attested in the (North) Midlands, and contemporary sociolinguistic work confirms its presence in London. However, other findings are surprising. Specifically, the high rates of leveling in the North West (54% acceptance overall) and Yorkshire and the Humber (50% acceptance overall) contrast with studies of specific localities in these regions that uncover low rates of was-leveling: for instance, Moore (Reference Moore2011) finds extremely little evidence of was-leveling in Bolton, in the North West, and Tagliamonte (Reference Tagliamonte1998:161) finds only 6% was-leveling in York when her data are restricted to the four contexts we examined.Footnote 15 Whether these differences are attributable to differences in methodology (both of the cited studies made use of conversational speech data) or in participant demographics (perhaps reflecting contact effects among our mobile student-biased sample) remains to be seen in future work.
To some extent, regional differences in was-leveling rates may be attributable to variation elsewhere in the grammatical system. Most notably, Cheshire et al. (Reference Cheshire, Edwards and Whittle1993:72) suggest that rates of was-leveling with you may be low in regions where the second person plural pronoun yous(e) is attested. This is because you was “is thought to have been used to restore the distinction of number in second person verb forms”—in other words, historically, you was was used when the referent was singular, and you were when the referent was plural (see also Rupp & Britain Reference Rupp and Britain2019:fn. 5). Varieties that had a unique second person plural pronoun did not need to make this grammatical distinction.
Though our questionnaire did not specify the intended number of the you pronoun in our example sentence, the most likely assumption is that respondents interpreted it as singular. Thus, we can test whether you was is less common where yous(e) is prevalent. To some extent, this holds up. The two strongest regions of yous(e) usage, Newcastle and Teesside (see Section 3.3.1), both show rates of you was acceptance that are significantly lower than the national average according to a chi-square test (Newcastle: 32% acceptance, N = 1045, p<0.001; Teesside: 42% acceptance, N = 177, p = 0.014). Two weaker regions of yous(e) presence, though, do not show the expected negative correlation: Liverpool and Manchester both show 60% you was acceptance (Liverpool N = 89, Manchester N = 152), a nonsignificant difference from the national average. This raises the possibility that yous(e) usage needs to have reached a certain threshold to block the emergence of you was, though to thoroughly test this theory we’d need to have access to yous(e) rates at the time when the you was/you were distinction was still operative. Finally, there are some clear generalizations to be drawn concerning subject hierarchies. Out of the eleven regions studied here, ten of them show the highest rate of was acceptance with you, and every region shows its lowest rate of was acceptance with the beaches. The relative ordering of we and they varies by region, but both pronouns’ rates are consistently higher than that for the beaches. This means that no region shows more acceptance of was with the beaches than with they. In other words, there is no evidence for the Northern Subject Rule pattern in any region. The disappearance of the Northern Subject Rule pattern in Newcastle has been noted by Beal (Reference Beal, Bernd Kortmann, Mesthrie, Schneider and Upton2004:122); our data would seem to suggest that it has spread even further. The findings presented here are intriguing in their departure from previous literature. We hope other researchers can follow up on them with a larger set of data, ideally also comparing them to results from conversational speech in particular communities.
4. Discussion
Throughout Section 3, we have identified a number of directions for future research. Here, we summarize and elaborate on them.
First, we have found several apparent cases of change in progress that represent exciting areas for further study. These include:
-
The emergence of a foot–strut split in the Midlands (Section 3.1.1)
-
The emergence of a nurse–square merger running from North East England to the north of the East Midlands (Section 3.1.2)
-
The decrease in book–spook rhyming in areas such as Stoke (Section 3.1.3)
-
The spread of velar nasal plus beyond the LAE boundaries (Section 3.1.4)
-
The diffusion of the cure–force merger in Yorkshire (Section 3.1.6)
-
The loss of a Northern Subject Rule-type pattern of was-leveling (Section 3.3.3)
Some of these changes have been confirmed in real time by comparing our results to isoglosses (composite where necessary) from the LAE. Where we do not have real-time data, confirmation that these are indeed cases of change can come from two sources: analysis of the apparent-time patterns in our own survey data (pending further data collection from older speakers) and dedicated follow-up studies of the communities in question. In the case of was-leveling, our data offer us a rare opportunity to study a case of constraint change in apparent time (MacKenzie, Reference MacKenzie2019).
Though these particular variables are each interesting in their own right, further study of them as a group presents avenues for better understanding the transmission and diffusion of changes from above and below (Labov, Reference Labov1994:78; Labov, Reference Labov2007). Most of the phonological variables studied here are changes from above. The erosion of the traditional realization of the -ook words, the merger of cure and force, the hypothesized spread of the foot–strut distinction and the eradication of the north–force distinction are all changes that are above the level of conscious awareness, originate outside the speech community, show style-shifting, and originate in the highest social class (with the exception of cure and force in conservative Received Pronunciation). By contrast, one potential change in progress that we hypothesize is change from below—that is, below the level of conscious awareness, from within the speech community, and originating in a centrally located social class—is the nurse–square merger on the east coast (e.g., Hartlepool, Hull; see Section 3.1.2). Consulting our data on respondent occupation (recently argued to still be the optimal measure of social class in the UK; Baranowski & Turton, Reference Baranowski and Turton2018) will shed light on this. It will additionally help to clarify whether the low social awareness of this merger in this community is due to its status as a change from below or due to the low phonetic salience of the merged vowel. Experiments comparing speaker perceptions of this merger in Hull versus Liverpool will help us better understand the social differences that underlie them.
Another avenue from which to study changes in progress is in the nature of their geographical diffusion. We find tentative evidence that the cure–force merger is affecting larger towns before smaller ones. Controlling for differences in respondent age and social class between the Yorkshire towns in question will help confirm this pattern. Our data also reveal clear transitional zones between dialects, where towns may display considerable heterogeneity. These are particularly interesting in the Midlands, where several isoglosses coincide, and in the towns between Manchester and Liverpool, two major cities that both display characteristic features not found elsewhere (e.g., lolly ice, the north–force distinction). These variables should serve as the basis for targeted sociolinguistic research that documents their precise geographical spread, correlates them with communication patterns, and assesses their social meanings.
On this subject, it is worth considering more carefully our finding of the northward spread of the foot–strut isogloss. We conclude that the foot–strut phonemic split has spread northward since the 1950s. This goes against Herzog’s Principle that mergers expand geographically at the expense of distinctions (Herzog, Reference Herzog1965; Labov, Reference Labov1994), but the high social value of the prestigious distinction has previously been cited to explain the ability to overcome this linguistic tendency (Labov, Reference Labov1994; Turton & Baranowski, Reference Turton and Baranowski2021). Though our finding of the raising of the foot–strut isogloss in some ways agrees with the findings from Leemann et al.’s (Reference Leemann, Britain and Blaxter2017) dialect survey, we argue that the change may not be as vigorous as their results suggest and that their methods overestimate the proportion of split speakers in the North of England, particularly those in the Midlands close to the isogloss. This is because their method is to ask a question about pronunciation with a forced-choice response. Speakers with no phonemic split, but with a schwa-like realization for foot and strut, when faced with a choice between butter as pronounced with an RP-like [ʌ] as opposed to a Northern [], will select the RP-like option.Footnote 16 Crucially, in the same way as the SED, Leemann et al. (Reference Leemann, Britain and Blaxter2017, Reference Leemann, Kolly and Britain2018) use the selection of the [ʌ]-like form as a proxy for presence of a distinction, which may result in an overestimation of the spread of the split. Indeed, recent results from Jansen and Braber (Reference Jansen and Braber2021) in three East Midlands cities, which show that foot and strut are becoming more similar in their young East Midlands speakers, gives us added confidence in this interpretation of the state of the phonemic distinction today. In summary, these divergent interpretations on the presence of the foot–strut split in the Midlands highlight the problems with assuming phonemic status via survey methods that do not elicit structural properties, something originally highlighted by Wells (Reference Wells1978).
Still another direction for further study is the covariation of variables that seem to be changing together in real time. For instance, when we compare our data to the LAE maps, we find that the area lacking the foot–strut distinction and the area using give it me have both shrunk on their southern ends in very similar ways. This raises questions of whether similar social evaluation underlies the two variables and whether they co-vary within individuals (Tamminga, Reference Tamminga2019). We do find some evidence of intraspeaker covariation among Northerners between the presence of the foot–strut split and the use of dinner for the evening meal, both characteristically southern features. Whether speakers who report both of these forms are socially similar (for instance, in their occupation level and/or their contact with Southern speakers) remains to be determined.
Finally, by analyzing which areas affiliate with one another linguistically, we speak to questions about how people communicate. We find evidence of dialect regions crossing county and even national boundaries: for instance, -ook, foot–strut, velar nasal plus, and lolly ice all show patterns by which North Wales affiliates with Liverpool or Northwest England more generally; foot–strut also shows linguistic alignment between Berwick-upon-Tweed and Scotland. Simple geographical proximity is not a guarantee of shared linguistic repertoire, however. Central Wales does not pattern like the West Midlands, its nearest English-speaking area. These findings suggest a role for commuting and communication patterns in uniting regions, as well as the influence of local identity (e.g., Duncan, Reference Duncan2018; Llamas, Reference Llamas2007). They also suggest that a more nuanced approach to geographically subdividing the country is preferable to working with postcodes and local authorities, which may span and divide relevant linguistic areas. A direction for future research is to apply machine learning classification techniques to our data, to identify which areas are more or less similar and which features play the most crucial role in dividing them (Strycharczuk et al., Reference Strycharczuk, López-Ibáñez, Brown and Leemann2020).
5. Conclusion
This paper has analyzed the regional patterning of over 14,000 responses to twelve linguistic variables in England, Scotland, and Wales. We have additionally contributed a novel real-time perspective by comparing our findings for six variables to those obtained in the first half of the twentieth century. Bearing in mind the specific nature of our sample and questions, we find evidence for both stability and change; we document previously unverified patterns; and we identify a number of directions for future research.
Although the linguistic landscape of Britain has been investigated in several previous large-scale dialectological studies already, this paper shows that there are still novel observations to be made. In fact, we see it as a boon for British dialectology that there are now several dialect mapping projects, because they each contribute a different perspective. For instance, Orton (Reference Orton1962) provide historical data; Leemann et al. (Reference Leemann, Kolly and Britain2018) contribute phonetic data; Grieve et al. (Reference Grieve, Chris Montgomery, Murakami and Guo2019) make use of spontaneous language in context from social media. We hope that future research will continue to compare findings obtained through different methods in order to shed light on all the complex nuances of English as it is spoken throughout Britain.
Acknowledgments
The authors would like to thank Marije van Hattum and all of our student data collectors at the University of Manchester, Newcastle University, the University of York, and Lancaster University; audiences at Methods in Dialectology XV, Manchester Forum in Linguistics 2021, and the Lancaster University Phonetics Lab; and an anonymous reviewer. Parts of this research were funded by Multilingual Manchester, The University of Manchester’s Social Responsibility in the Curriculum competition, and The University of Manchester’s Learning through Research small project funding scheme.
Appendix
Visual prompt for the “bread roll” question on the survey.

Visual prompt for the “frozen treat” question on the survey.


 Open access