


1. Introduction
Long-run European market integration is described as increasing price integration starting in the late 15th century, slowing down at the beginning of the 17th century, and accelerating after the Napoleonic Wars in response to trade liberalization and globalization (Federico et al., Reference Federico, Schulze and Volckart2021). The latest research posits that the process in the European grain market was gradual and mainly pre-industrial. Some optimistic scholars identify an “emerging integrated European wheat market” in the 18th century; however, there seem to be significant regional differences to support the Little Divergence between a rapidly advancing Northwest and the rest of the Continent beginning in the seventeenth century.Footnote 1 The Spanish case fits well with this description.
Spanish markets were not optimal despite being one of the world’s greatest imperial powers at the time and the weak performance of Spanish agriculture in the early modern period has been seen as one of the roots of her economic underperformance.Footnote 2 In the 18th century, price volatility in Spanish cities was considerably larger than in their Western European counterparts. In contrast, although higher than previously described by the literature, economic integration levels seemed to be lower than in Western Europe.Footnote 3 Scholars have identified several features that explain these inefficiencies to determine regional price gaps.Footnote 4 Some of these features are exogenous to the economic system, resulting from suboptimal natural endowments such as rugged terrain or the lack of natural transportation systems like navigable rivers. Poor transportation infrastructures, like roads and canals, and institutional fragmentation have also been suggested as a potential culprit for the poor functioning of the Spanish market. The more extensive availability of aggregated historical records in the main cities has led research on Spanish market integration to focus on price differences between large urban centers.Footnote 5 Therefore, scholars tend to analyze price gaps between urban markets, failing to properly account for a large share of the population and economic activity in rural areas. This is crucial not only because that setting ignores a large part of the population but also because it prevents taking into account the supply side of the market. This paper aims to tackle this issue by exploring how the hinterlands interact with their local urban market and neighbors by studying the regional price differences of wheat.
Cities were vital players within Spanish markets.Footnote 6 They had a solid economic and institutional power, especially in the Crown of Castile, where they enjoyed better political representation than rural areas. A distinctive characteristic of Spanish cities intensified the influence of urban centers: their authority usually went beyond their walls, dominating large areas in their hinterlands until these rights collided with those of a neighboring city (Ringrose, Reference Ringrose1996: 448). This tight economic and institutional control of their hinterlands was independent of their size or status, making them the backbone of Spanish life and constituting them in what Grafe defined as urban republics (Grafe, Reference Grafe2012: 166). Therefore, cities dominated not only urban activities but also rural economies in a straightforward way. Urban centres’ control over their hinterlands was reinforced by high transport costs derived from natural factors like challenging geography, lack of navigable rivers, and poor infrastructure to compensate for these natural handicaps. The most immediate and expected consequence was that long-distance trade of commodities like grain was rare, with distances rarely covering more than 100 km (Llopis Agelán and López, Reference Llopis Agelán and López2005: 231).Footnote 7 This implied that most grain exchanges occurred within relatively short distances and that urban markets were limited to the closest city for most producers.Footnote 8
However, other institutional factors influenced regional markets. The clearest example in the Crown Castile was Madrid, the geographical and political center of the country. The effects of the capital were visible in large areas of the interior, which also affected the markets created around the neighboring cities. Consequently, market forces around Madrid worked differently than in the coastal periphery as political interventions also influenced them (Ringrose, Reference Ringrose1996: 337). The situation in the periphery was different, as the economic influence of Madrid did not reach them as easily as the regions in the interior. Although the relevance of the capital is a well-established fact in the literature, quantifying its disruption on market forces, especially beyond the city walls, is an issue that has not been adequately tackled.
This paper will analyze spatial price formation at the municipal level in the Crown of Castile in the mid-18th century. Based on the previous description of the historiography of how grain markets operated in modern Spain, we present a model of multiple price equilibria based on wheat local demand and supply conditions that follow the logic of Von Thünen’s isolated markets (Von Thünen, Reference Von Thünen1826). We use this model to analyze spatial price formation because, as described in the following section, it seems to reflect how much of the grain domestic markets operated in modern Spain, where the cities played a key role, exerting a significant influence over their surrounding areas. Scholars in the market integration literature trace this back to Cournot’s model of production competition from 1838 (Cournot, Reference Cournot1989), yet still today find gaps to capture all the dimensions of the matter (Federico, Reference Federico2012). One of the gaps found in the literature is the analysis of trade costs across space. Although scholars argue that these have decreased over time (Dobado-González et al., Reference Dobado-González, García-Hiernaux and Guerrero2012), exceptionally detailed data are needed to study them. This methodological approach on how prices formed around cities in their rural hinterlands in preindustrial times has also been used for other countries in recent studies that identify the closest urban market as the most reasonable and probable market for rural agrarian producers (Kopsidis and Wolf, Reference Kopsidis and Wolf2012; Martinelli, Reference Martinelli2014; Cermeño and Enflo, Reference Cermeño and Enflo2019). However, although all of these influential studies have assumed the existence of the same theoretical framework on the formation of prices, to our knowledge, no study has ever checked its existence with empirical evidence. The high granularity of our data and the inclusion of rural areas allow us to evaluate the validity of one of the main theoretical assumptions of the model suggested by von Thünen for the first time in the literature.
This paper attempts for the first time to empirically approach the study of the role of trade costs on price formation using rural–urban price gaps instead of distant pairs of urban markets. Our setting explores prices as an ancillary means to achieve an optimal distribution of goods based on local supply and demand conditions, as Samuelson (Reference Samuelson1952) defined. This characterization relies on the fact that prices across space only differ as much as trade costs do (i.e., the law of one price holds, at least loosely). We attempt to analyze the spatial distribution of prices and the realization of the law of one price, which, as Samuelson phrased himself, has been “so neglected in economic theory that the field is of interest for its own sake” (Samuelson, Reference Samuelson1952: 284). Although other analyses have also tried to approximate trade costs across time (Volckart, Reference Volckart2006), in our paper, we intend to do it only across space.
We can do so using a dataset with an unprecedented level of detail. Our original dataset, extracted from archival sources, consists of a cross-section of wheat prices across 5,176 municipalities in mid-18th-century Spain that we can use to infer price gaps between urban markets and their rural hinterland. We test the price differentials across space against various variables measuring trade costs using Ordinary Least Squares and adjust for spatial interactions using Spatial Auto-Regressive models. The dataset gives us a static view of prices at an unprecedented level of detail; however, we cannot speak about market efficiency since we observe only one point in time. We find that ease of access to urban markets not only reduced price gaps in rural areas, but also indicate important spatial effects that bias our estimates if they are unaccounted for. Splitting the sample between the core and the periphery, we find that prices around Madrid are formed differently and that there are strong spatial effects around the capital. This could result from disrupting institutional interventions in the grain markets around the capital. In contrast, municipalities closer to the coast with easier access to foreign markets and more difficult to control by the government seem more affected by trade costs.
The paper includes several contributions to the literature. Firstly, we fill a gap in the market integration literature by exploring for the first time how price gaps in the wheat market behave across contiguous municipalities instead of across distant markets, with a focus on the gaps between the urban centres and their rural hinterlands, being this a completely different approach to the study of gaps between urban markets available in the literature. This is possible thanks to the rich granularity of our data. Secondly, we demonstrate that datasets like ours, containing spatial information on prices, could suffer spatial autocorrelation problems that could bias the results. We also show that these effects do not have to be present in all the samples and can vary regionally. Thirdly, the overall good fit of our model suggests that a theoretical framework on price formation based on von Thünen’s isolated markets seems appropriate for the functioning of grain markets in eighteenth-century Spain. To our knowledge, it is the first time that this basic principle on von Thünen’s model on how prices form around the central urban markets, widely used in the literature, is, in this case, successfully put to the test.Footnote 9 Fourthly, we provide quantitative proof that market costs do not seem to play a role on price formation around Madrid as much as in the periphery, a fact that we believe provides new quantitative evidence of a nature that does not exist in the literature to the disrupting role of the capital in the grain markets around it. Finally, we do all this by presenting an exceptional historical database of grain prices collected directly from primary sources at a municipal level, an outstanding level of detail never explored before that we believe provide researchers with new quantitative historical evidence from archival sources at high granularity level that is presented on this paper for the first time.
The text proceeds by reviewing the literature explaining how grain markets operated in modern Spain. In the following section, we introduce our data sources. We later explain our methodology and report the main results, and the final section concludes.
2. Grain markets in 18th century Spain
Grains were the most important commodity traded in early modern Spain, and wheat occupied a privileged position. Although in areas of the north other cereals were more relevant in terms of consumption (Barquín, Reference Barquín2011), although not being the dominant cereal in regions of the north, its generalized cultivation in the whole country and its relevance as a staple consumption commodity for most of its population, explain its importance. In modern Spain, wheat could represent up to 40% of the supplies of a municipality (González Enciso, Reference González Enciso2008:25). The main role played by wheat in the Spanish economy and in the historical sources explains why an overwhelming share of the literature on historical economic integration in Spain has focused on wheat prices.Footnote 10
If wheat trade dominated the Spanish domestic market, internal trade was a phenomenon done by and for the cities (González Enciso, Reference González Enciso2008:21). However, high transport costs favoured the existence of local markets in the case of commodities with a low value in terms of weight or volume (Llopis Agelán et al, Reference Llopis Agelán, García-Hiernaux, García Montero, González Mariscal and Hernández García2009:57). The most immediate and expected consequence was that long-distance trade of commodities like grain was rare, with distances rarely covering more than 100 km (Llopis Agelán and López, Reference Llopis Agelán and López2005: 231).Footnote 11 This implied that most grain exchanges occurred within relatively short distances and that urban markets were limited to the closest city for most producers.Footnote 12 Under this framework, it is not surprising to observe that Spanish cities presented a higher volatility of their wheat price series than similar counterparts in Europe, something that was probably also the case for the rest of the Spanish cities (Llopis Agelán et al, Reference Llopis Agelán, García-Hiernaux, García Montero, González Mariscal and Hernández García2009:59). Therefore, long distance trade of grains naturally occurring within the market within Spain was rare and, under normal circumstances, the commercialization of wheat was restricted to nearby areas as it was a grain that was widely cultivated in almost all the country (González Enciso, Reference González Enciso2008:25).Footnote 13
Due to the natural economic barriers to long-distance wheat trade, cities in Spain tended to obtain grain from their surroundings through the market. However, they sometimes imposed rules and regulations on the countryside under their jurisdictions (de Castro Monsalve, Reference de Castro Monsalve1984:353). Their authorities were also able to impose regulations on the rural areas in their surroundings, including the supply of basic commodities (Marcos Martín, Reference Marcos Martín, Lobo Cabrera and Suárez Grimón1994: 201). Therefore, cities clearly appeared as the main actors of the domestic market in modern Spain, exerting rights within their jurisdictions and, as described earlier, defining a domestic trade system where the existence of local markets that worked within a certain commercial unity within them prevailed (González Enciso, Reference González Enciso2008:32).
A clear exception to this general pattern of domestic wheat trade was the capital, Madrid which due to its fast demographic growth reached more than 140,000 inhabitants by 1757 (Ringrose, Reference Ringrose1983:28). The local authorities on many occasions with the help of the central government had to rely on suppliers that reached distances that were only possible thanks to the subsidies to cover the high transport costs. This was possible, thanks to the existence of the two main instruments that civil authorities had to intervene in the wheat market, a system of price controls (tasa de granos) and the pósitos. The tasa de granos was a price control mechanism where the government established a maximum price, or tasa, for wheat, which existed in the Crown of Castile since the 16th century. The tasa showed little change during the 17th and the 18th centuries, increasing from 18 reals per fanega in 1605 to 28 reals in 1699. The other significant change in 1699 was that, until then, direct producers such as peasants selling their harvests could sell at higher prices, but they could not do so from 1699 onwards. However, although the tasa was relatively well respected by some ecclesiastical institutions in the mid-18th century, it was unsuccessful in the rest of the market (Llopis Agelan and Méndez, Reference Llopis Agelan and Méndez2001).
The Pósitos were institutions created in Spain whose existence can be traced back to the 14th century, and their main mission was to ensure a grain supply at times of scarcity for the areas where they operated. They could have a public nature, usually controlled by municipal governments, or private ones, very often under the control of the church, and operated both in urban and rural areas (Prado-Lorenzo et al, Reference Prado-Lorenzo, García-Salinero and González-Bravo2017:31). As explained earlier, the level of fulfilment of the tasa as a mechanism to control prices was very low. The real power of the pósitos, especially in urban areas, relied on the right that they had to purchase wheat paying the legal tasa when the market prices were higher, having even the authority to register and seize grain (de Castro Monsalve, Reference de Castro Monsalve1984:351). However, although they increased significantly in number in the third quarter of the 18th century, only the largest urban pósitos could have a visible effect on the market. The reason was that they usually ran into deficits; therefore, only those with enough financial muscle behind them could operate in times of particular hardship when needed the most (Llopis Agelan and Méndez, Reference Llopis Agelan and Méndez2001:54).
Within the wide network of rural and urban pósitos, the one in Madrid played a particular role in the grain markets of Castile. As explained earlier, a pósito’s ability to operate depended on its financial backup from the local governments or the private institutions that were responsible for them. In this sense, the pósito of Madrid not only had the support of the largest municipal government of Spain, but also of the central government. Madrid hosted the royal court, and avoiding subsistence revolts in Madrid became a priority for the crown (Llopis Agelán et al, Reference Llopis Agelán, García-Hiernaux, García Montero, González Mariscal and Hernández García2009:49). The interventionism of the pósito of Madrid in the internal grain markets increased during the eighteenth century, in many cases with the help of the civil and ecclesiastical authorities in other provinces to make purchases in provinces like Salamanca, Palencia or Leon hundreds of kilometers away (de Castro Monsalve, Reference de Castro Monsalve1984:356). In addition to its financial capacity, the pósito of Madrid had to cover the population of the country’s largest city, being responsible for large interventions in the market that increased its ability to affect the market. The benefits that Madrid and its pósito enjoyed for political and demographic reasons, and the difficulties found in the pósitos of the other cities of the Crown explain why the later did not seem to play a significant role in the alteration of the grain markets in Castile before 1765, while the effects on the prices of Madrid seem to be clearer (Llopis Agelan and Méndez, Reference Llopis Agelan and Méndez2001:57). This explains why even when the pósito of Madrid had priority over any other pósitos to purchase grain in times of scarcity, there are not relevant reports of such conflicts arising (de Castro Monsalve, Reference de Castro Monsalve1984:353). The strength of Madrid is also reflected by the fact that it was around the capital where the level of fulfilment of the tasa, often consequence of the purchases of its pósito, were higher (Llopis Agelán et al, Reference Llopis Agelán, García-Hiernaux, García Montero, González Mariscal and Hernández García2009:49). The interventionism of the civil authorities in Madrid was not only restricted to the sales of wheat but also included other products like bread. Since at least 1581, the municipalities around the capital were forced to provide an amount of bread to Madrid known as pan de registro. This policy was maintained until 1758, using a distance that increased its radius over time to cover more locations (de Castro Monsalve, Reference de Castro Monsalve1984:354). The effects in the capital were clear, where prices between the periods 1740–48 and 1792–1800 increased by 25%, 26%, and 32% less than in Toledo, Seville or Palencia, respectively (Llopis Agelan and Montero, Reference Llopis Agelan and García Montero2011:300).
Therefore, after reviewing how grain markets operated in eighteenth-century Spain, we decided to use a model that puts the cities in the center of the market and allows them to exert a certain level of market power over their surrounding areas. In this sense, the best approach would be the theoretical framework based on Von Thünen (Reference Von Thünen1826). We must be clear that by this we do not mean that the wheat trade only occurred in the cities, as it is obvious that there were also exchanges between smaller locations. However, when modelling an economy as we try in this paper, we have to choose a theoretical framework that is as representative of reality at the time. We believe that the evidence presented in this section by the existing literature supports that domestic trade in Spain was, at least in general, done by and for the cities (González Enciso, Reference González Enciso2008:21).
However, within this theoretical framework, the role played by Madrid as a disruptor of grain markets in Castile, well highlighted by the literature, deserves particular attention. The lines above describe in detail the different ways the local and central authorities intervened in the wheat market and also present estimations of how these interventions moderated inflation in the capital. Llopis et al. (Llopis Agelán et al, Reference Llopis Agelán, García-Hiernaux, García Montero, González Mariscal and Hernández García2009:57) point out that Madrid was a break for the integration of markets. At the same time, Gonzalez Enciso (González Enciso, Reference González Enciso2008:21) argued that the city’s growth forced its authorities to purchase grain in distant markets that were dismantled by the influence of Madrid. Our data allow us to go one step beyond the existing literature to understand and measure the relevance of Madrid as a market disruptor. In our case, the granularity of our dataset will allow us to examine how price formation in the surrounding areas of the cities worked and if, in the case of Madrid, we find a different pattern from the one existing in the rest of Castile.
3. Sources and data description
The main historical source used in this paper is the Cadastre de la Ensenada. The Cadastre was a monumental work carried out during the reign of Fernando VI, whose main purpose was to estimate wealth for introducing a new tax, the única contribución (single tax), to finance the increasing expenditures of the monarchy. The tax had to be paid by each municipality in the Crown of Castile, and the estimation of the exact amount to be paid was based on the location’s wealth and a set of objective criteria.Footnote 14 For that purpose, an army of some 1,000 judges and 90,000 local experts was mobilized to measure every plot of land, count every tree and measure the wealth of every eligible family to pay to the Crown. A significant share of the enormous amount of documentation produced during the process has survived, putting at the disposal of researchers a unique source for the study of eighteenth-century Spain.
Two main items, including socioeconomic information, are the “particular” and the «general» answers. The particular answers include the most detailed microeconomic documentation, containing information at family level including names, income, properties, credits, etc. The general answers, on the other hand, were similar to the Domesday Book, and include the answers that local officials gave to a questionnaire sent by the civil authorities. Therefore, the Catastro is one of the most important and reliable sources of information to understand the economic reality of the mid-18th century. However, it only provides a snapshot of the time when it was carried out. Economic historians have extensively used its richness, including the monumental compilation of Matilla Tascon in Reference Matilla Tascón1947 (Matilla Tascón, Reference Matilla Tascón1947). Similarly, Vilar (Reference Vilar and Sarrailh1966) identified the Catastro as a unique source for studying the socioeconomic structure of Castile in the mid-eighteenth century. This example was followed by other studies like those by the Grupo 75 (1977) to estimate income levels in Castile. Agrarian historians quickly saw the potential in the Catastro and new studies with usually a local or regional scope appeared including among many others the works by Donezar (de Ulzurrun and Javier, Reference de Ulzurrun and Javier1984) for Toledo, Garcia Sanz (García Sanz, Reference García Sanz1986) for Segovia, Mula Gomez and Gris Martinez (Gómez et al, Reference Mula Gómez and Gris Martínez1988) for Lorca, and Pezzi Cristobal (Reference Pezzi Cristobal1997) for Velez-Malaga or Lanza Garcia (García, Reference Lanza García2008) for Cantabria.Footnote 15
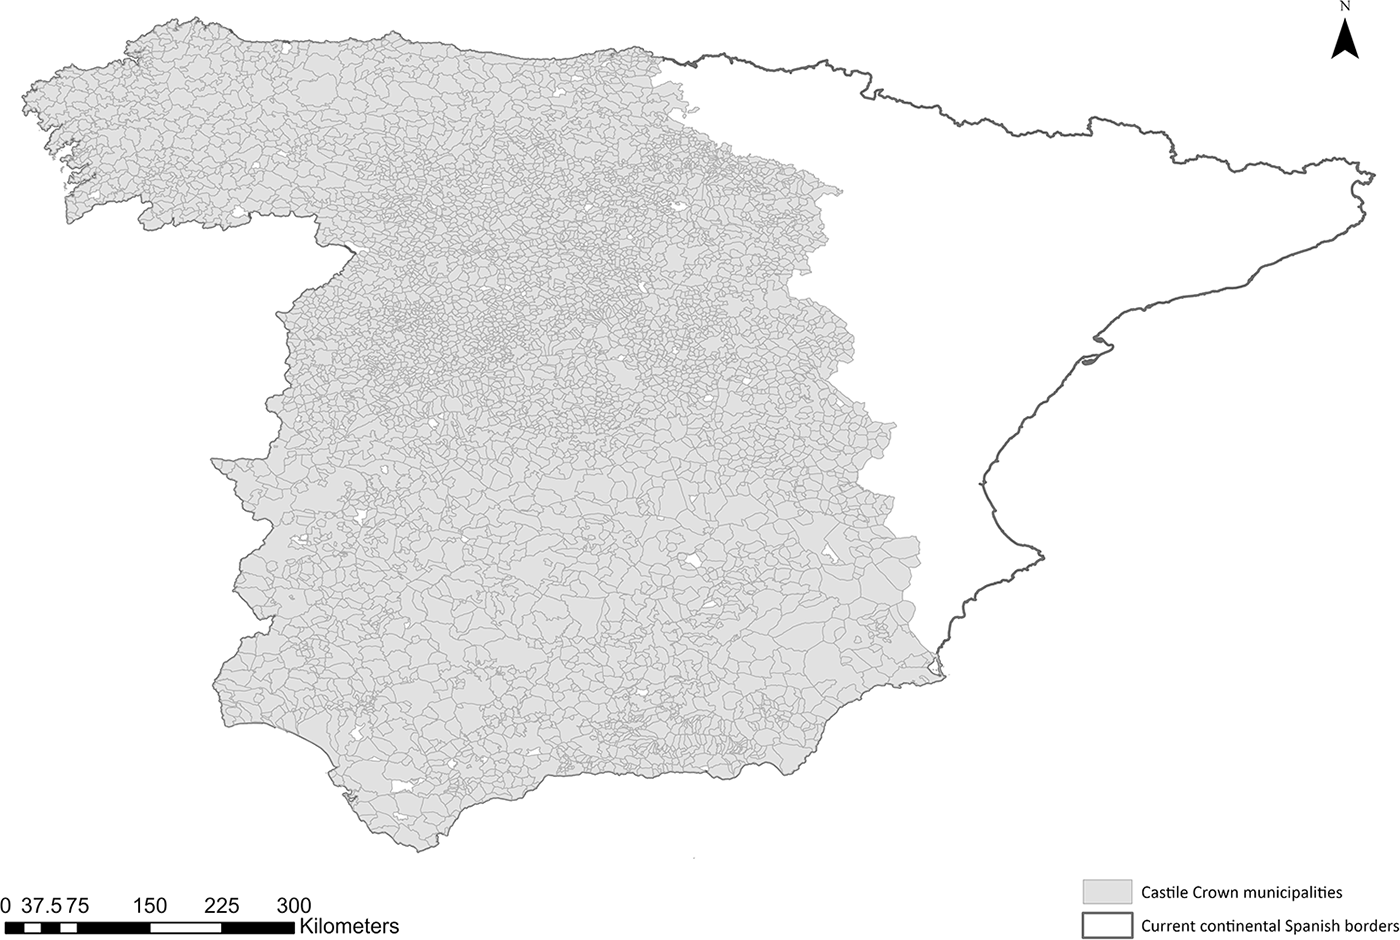
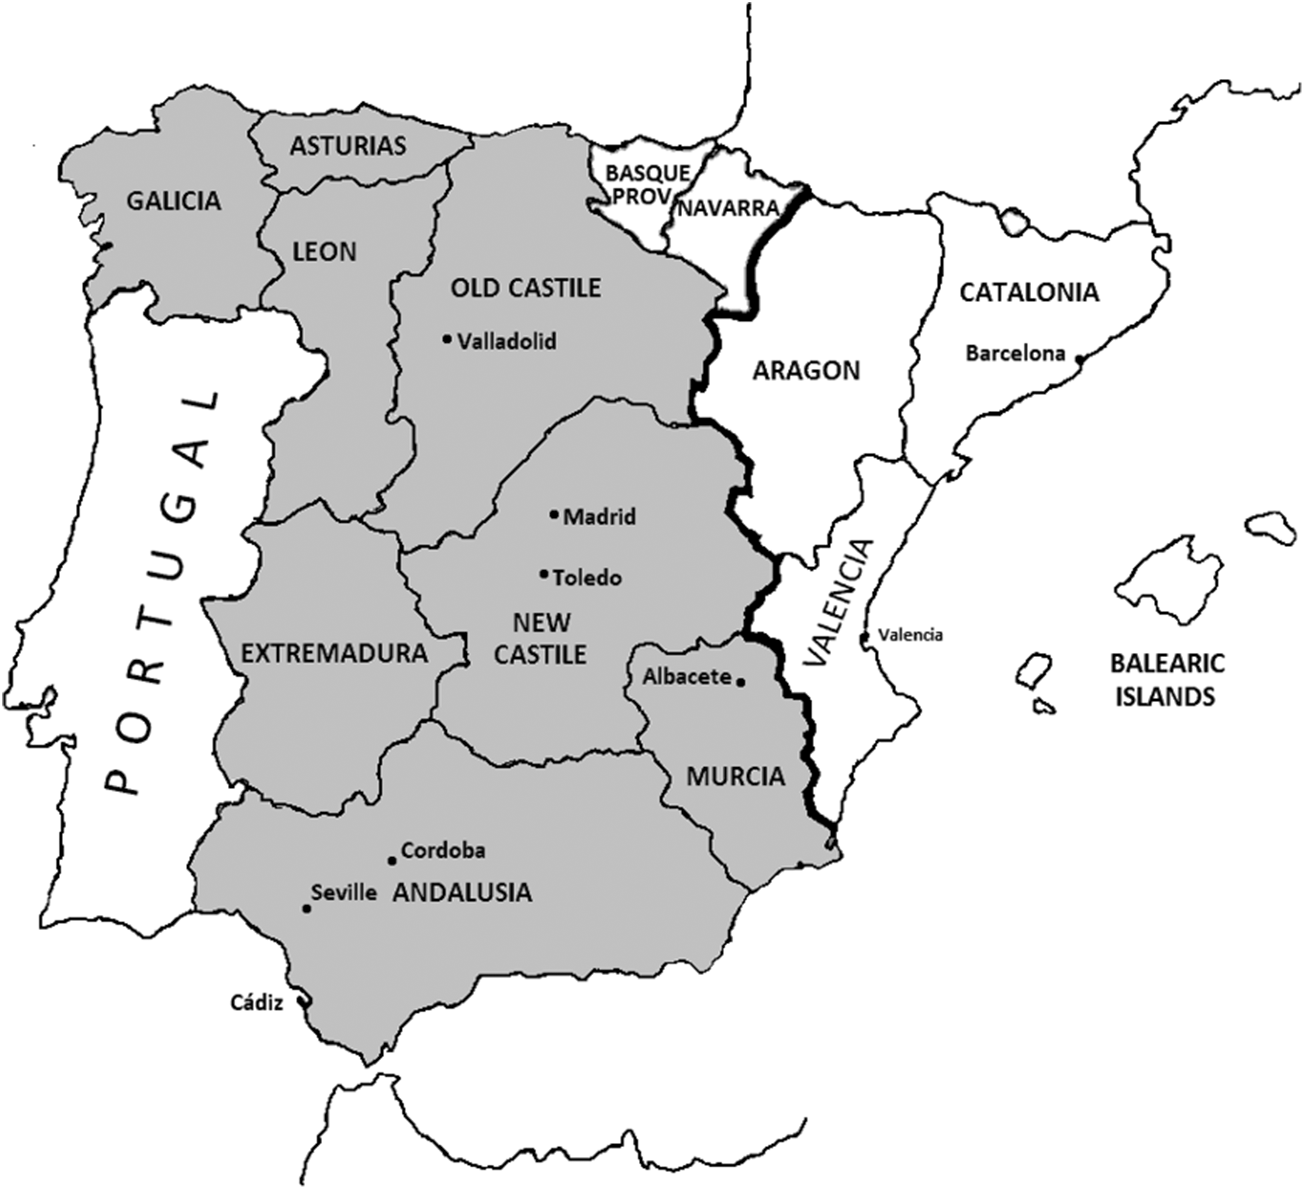
In our case, we consulted the Respuestas Generales, which, as explained earlier, were included in individual manuscripts for each of the municipalities surveyed and included aggregated information for the whole location. The main information we extracted from the Cadastre books is the price of wheat at the municipal level. To our knowledge, this is the most extensive database of prices at such a detailed level. We measure regional price gaps for each municipality and its closest urban market (city). We consulted 5,271 municipal manuscripts, which contained information on prices and local units of measurement of grain in the Cadastre.Footnote 16 We discarded the municipalities that could not be matched and mapped with contemporary maps (a total of 108) because they merged, changed borders, or changed names radically. Our final sample consists of 5,163 municipalities, represented in Figure 1.Footnote 17
Municipalities included in the sample.

As explained earlier, the local experts in each municipality had to fill in a questionnaire that was later reported to the government. We obtained the price of wheat in each municipality from the answers given to question 14, where the experts had to include a list of the prices of the main items produced or consumed in the place. To avoid the effects of short-term fluctuations in the price of agricultural products, the experts had to send the average price of each item in the previous 5 years, a procedure that minimizes the effects of volatility in our sample.Footnote 18 However, the units of measurement included in the Cadastre were not homogeneous between municipalities. The local authorities reporting the information recorded key variables like quantities or surfaces employing the measures historically used in their corresponding regions. Although the monetary unit was common (reales), the units used to measure the amounts were not always the same. To standardize the dataset, we used the information contained in the answers to question 9 of the report, where the local experts had to describe the units of measurement that they used in their municipality and their equivalent to common capacity measures like fanegas, from where we standardized all the variable Price in reales per fanega.
Our main dataset is a detailed account of regional price variations. We use it to compare municipal prices in each location relative to the closest city, which is their local reference market. Other scholars have used price gaps to study price convergence (Wolfgang and Shiue, Reference Wolfgang and Shiue2014, Reference Wolfgang and Shiue2020; Malinowski, Reference Malinowski2019). Other studies have scarce observations over time, for which they can obtain benefits by comparing bilateral price gaps over different periods. Given the large number of observations in our cross-section, following this methodology is difficult (Federico, Reference Federico2012) and irrelevant.
In our setting, central prices are set in the urban markets, and the hinterlands respond to those prices based on their relationship to the city (as a provider or consumer) and considering trade costs, including transport and information costs. Following classical marginalist theory, suppliers or merchants would sell the last bushel by which they got a profit in the urban market after accounting for the costs of selling it there; otherwise, they would keep it, hence defining the price in the hinterlands. They would bring it to the closest urban market without a significant arbitrage opportunity. This setting allows observing price gaps across adjacent rural municipalities instead of urban markets, capturing the distribution of trade costs and the rural-urban pattern.
Municipal price gaps relative to the closest urban market can be positive or negative depending on the municipality´s net trade relationship (whether it is a supplier or consumer); our dependent variable is the absolute value of the price gap between the city and the municipality, understanding that the closer this gap gets to 0 the closer the connection of the rural and urban markets. We estimate the price gaps for each municipality as Price Gapmunicipality = | Pricemunicipality—Pricecity | and use their log as dependent variable in all the models.
To identify the closest city for each municipality, we need to calculate pairwise distances from all the rural municipalities to urban centers. We use the geodesic distance between the centers of each polygon and the closest city, acknowledging that some places have better access than others and that straight lines do not capture the variance in ease of access from place to place. We separate those effects with additional independent variables such as ruggedness, distance to the coast, and a set of additional climate controls.Footnote 19
To explain our regional price variation information, our dataset includes several independent variables containing data at municipal and regional levels from historical and contemporary sources. As mentioned earlier, the first independent variable included in our models is the distance to the closest city (km to the city). This variable intends to proxy part of the transportation costs between the municipality and its nearest urban market. The most remote municipality is 149 km from the closest local market in the Crown.Footnote 20 We also account for geographic variables that could have an impact on transport costs beyond just distance, such as the distance to Madrid (km to Madrid),Footnote 21 a coast dummy (4% of our sample is coastal), or ruggedness, measured as the standard deviation of the elevation within the polygon, computed using a Digital Elevation Model over Europe from the European Environment Agency (EEA, 2017), following Nunn and Puga (Reference Nunn and Puga2012).Footnote 22
To account for accessibility to road transportation, we also calculated the distances from the center of each municipality to the closest road available at the time in the variable kilometer to Road. Most of the roads in the early 18th century were not paved. Dust in the summer and mud in winter made them impracticable for long periods.Footnote 23 The improvements in the network during the eighteenth century included transforming old roads into new ones able to accommodate wagons. Also, they included construction works like the bridge of Toledo in the capital to connect Madrid with the south of Castile and the large urban centers of Andalusia. The connections with the north also improved with the works ordered by Fernando VI, as the new path opened through the mountains of Guadarrama with the Alto del León. This paved pass was finished in 1749 and connected the capital with the grain-producing regions of Old Castile. We used the most recent estimations of the network of main roads in Spain at the time presented by Pablo-Martí et al. (Pablo-Martí and Sánchez, Reference Pablo-Martí and Sánchez2021).Footnote 24 We calculated the shortest straight-line distance from our municipalities (FigureX 7 in Appendix) to the network. Alternatively, we also use a dummy equal to 1 for the directly connected municipalities (about 10% of the sample), compared to those that did not have direct access to the road network at the time. Many of the variables described above could also work as proxies for information costs, as information travels more easily through smaller distances and good transport networks provide additional facilities.Footnote 25
Besides the measurement of centrality, the variable kilometer to Madrid provides additional meaning concerning the closeness to Madrid, given its status as the main market in the Crown’s territory that, as the capital as well as the seat of the Court, had a significant influence on the markets of the interior. As we explained before, the necessity to feed the population of Madrid forced the authorities to intervene in the market in several ways that created asymmetric information and distorted the market. Therefore, we believe that the distance to Madrid could have influenced how the grain market operated in the eighteenth century and should be considered an independent factor.
Part of the literature highlights the importance of cultural differences and language barriers (Schulze and Wolf, Reference Schulze and Wolf2009, Reference Schulze and Wolf2012). The language spoken in the Castile kingdom was mainly Castilian, although some territories in the north spoke other languages. Hence, we have included two simple variables that control for language differences across municipalities. The first one, Language, is simply a categorical variable that codes the primary language spoken at each municipality at the time, where 0 is Castilian, 1 is Galician, 2 is Astur-Leonese, and 3 is Basque (less than 20% of the municipalities in the sample municipalities had a different spoken language than Castilian, according to the table). The distribution comes from Lázaro-Carreter (Reference Lázaro-Carreter1949). The second is a dummy variable that captures whether the spoken language in each municipality differs from the one spoken in the nearest city. Most municipalities speak the same language as their nearby city (the average value is close to 1). We have not included more sophisticated measures of language homogeneity because the culture in the kingdom of Castile was largely homogeneous, with only three more languages in the sample (one of them very marginally). This way, we can capture cultural differences from the categorical variable and higher transaction costs when languages and cultures differ from the second one.
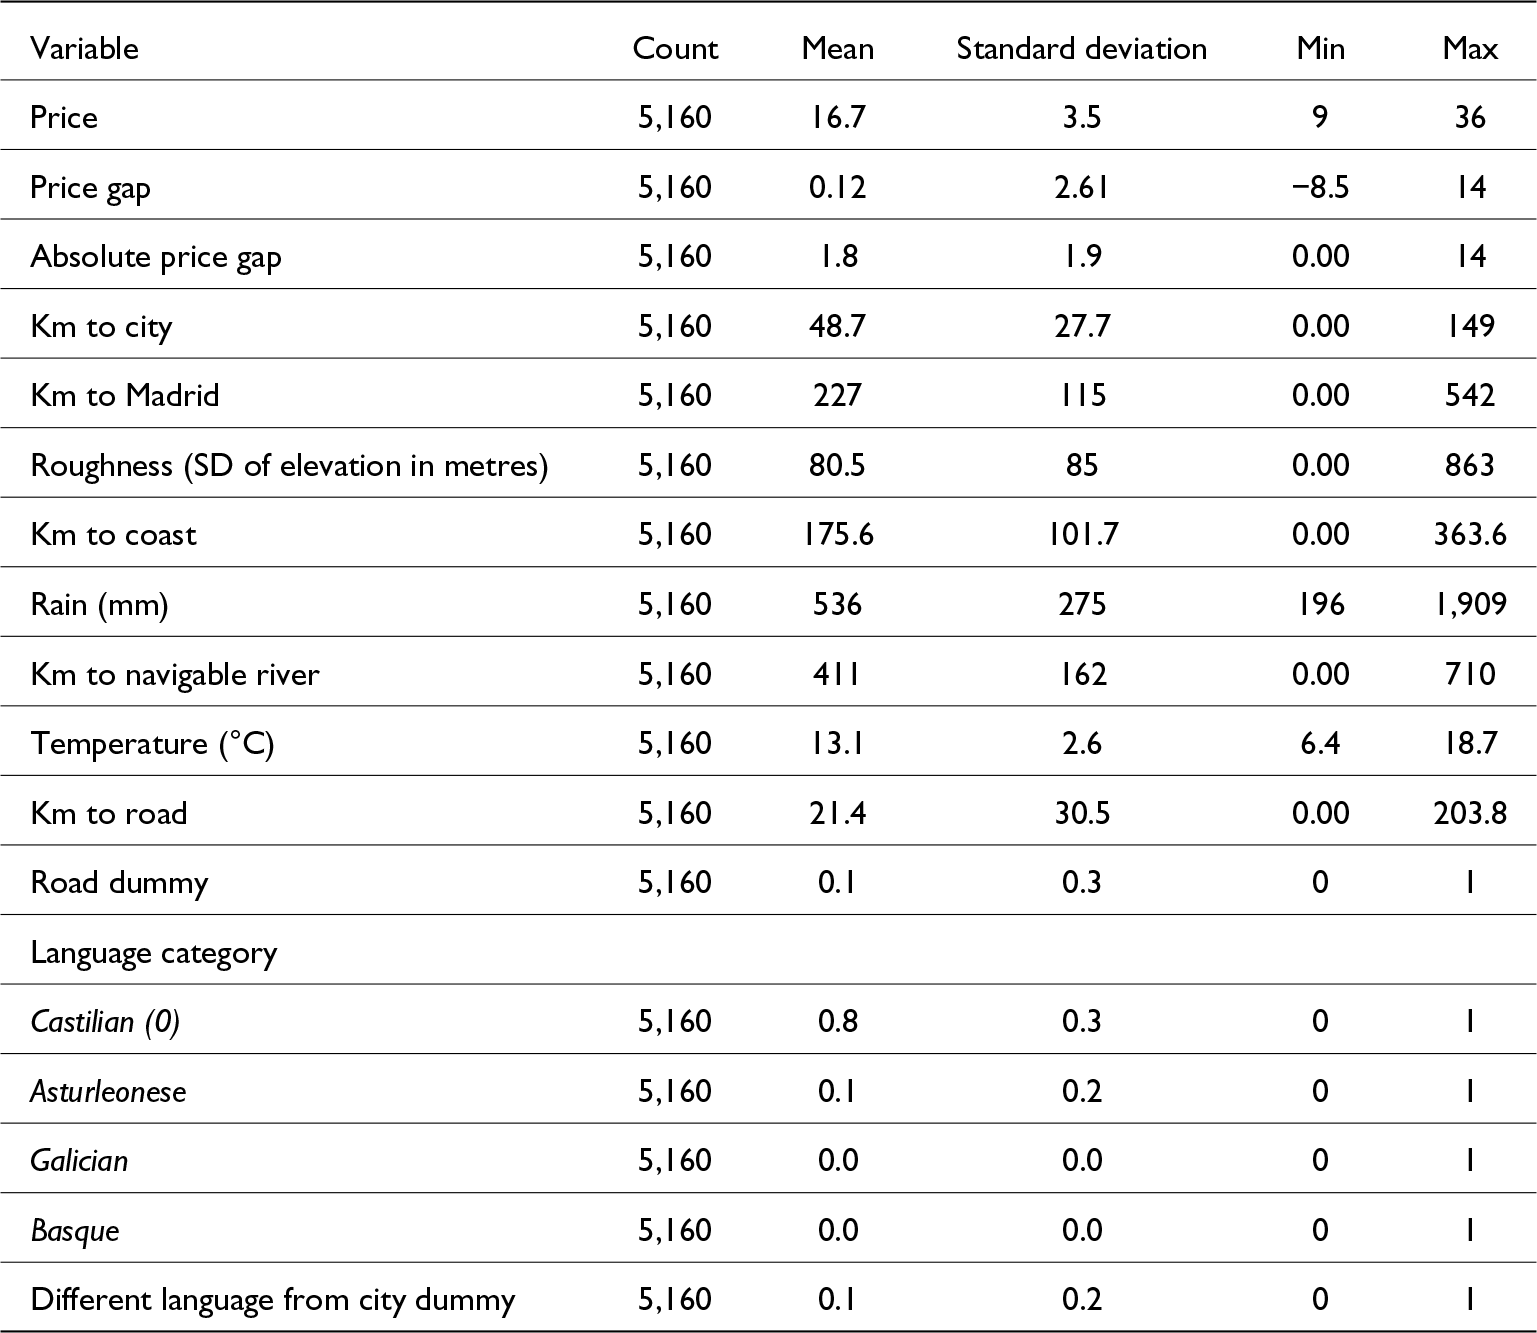
The literature has emphasized the importance of natural variables in Spanish grain production (Santiago-Caballero, Reference Santiago-Caballero2013b). Climatic information for each municipality was also collected and introduced as controls in our models, including the yearly mean temperature in degrees Celsius and rainfall levels (liters per km-squared). We used the information for the 1961–1990 average, the earliest available dataset with data from 90 climatological stations in Spain (AEMET, 2012). To estimate the most accurate information for each municipality, we provide information from the closest climatological station. We compared the data from these stations with our earliest estimates for several locations in the nineteenth century, presenting a correlation of over 95%, suggesting that regional differences in contemporary records are a good proxy of historical values, discounting the potential effects of recent events like modern climate warming.Footnote 26 In summary, Table 1 presents the descriptive statistics of our dataset’s available variables.Footnote 27
Summary statistics

Note: This table shows the summary statistics of the dependent, independent, and control variables in our models.
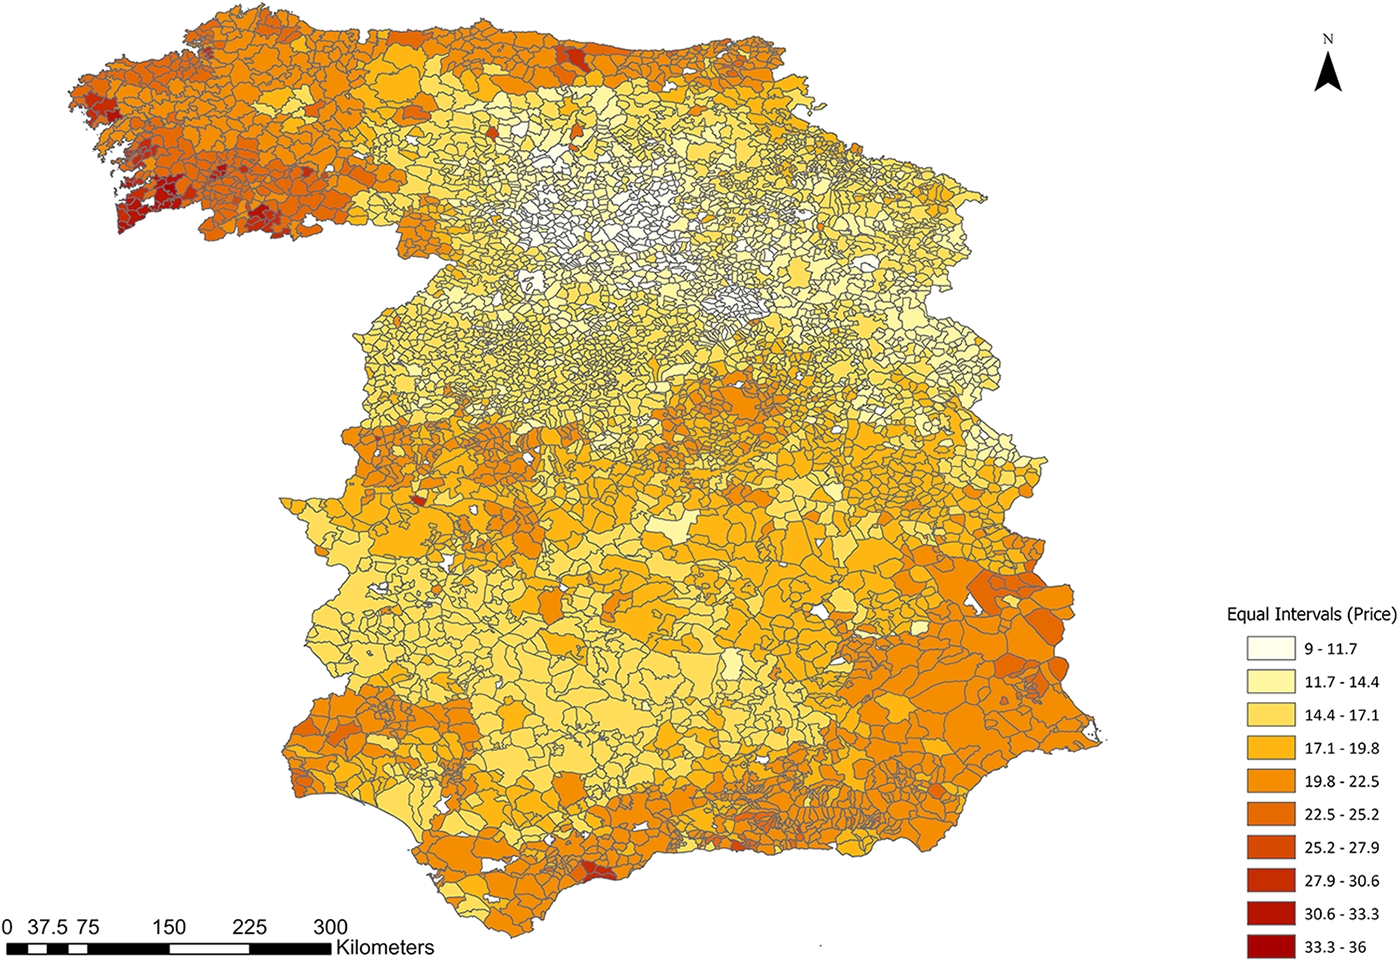
Figure 2 presents the geographical distribution of wheat prices in reales per fanega in the municipalities of the Crown of Castile included in our sample. The highest prices are located in the northwest of the country, in the region of Galicia, and on the coasts. There are also high prices in the areas surrounding large urban centers like Madrid and the regions located near the coast that were also densely populated. The lowest prices can be systematically found in the provinces of Old Castile, especially those areas traditionally considered the granary of Spain, characterized by large plains where the cultivation of grain was dominant and that were also able to reap higher yields than most of the country (Santiago-Caballero, Reference Santiago-Caballero2013a).
Price of wheat by decile in reales per fanega, mid-18th century. Sources: estimations from the Cadastre de la Ensenada.

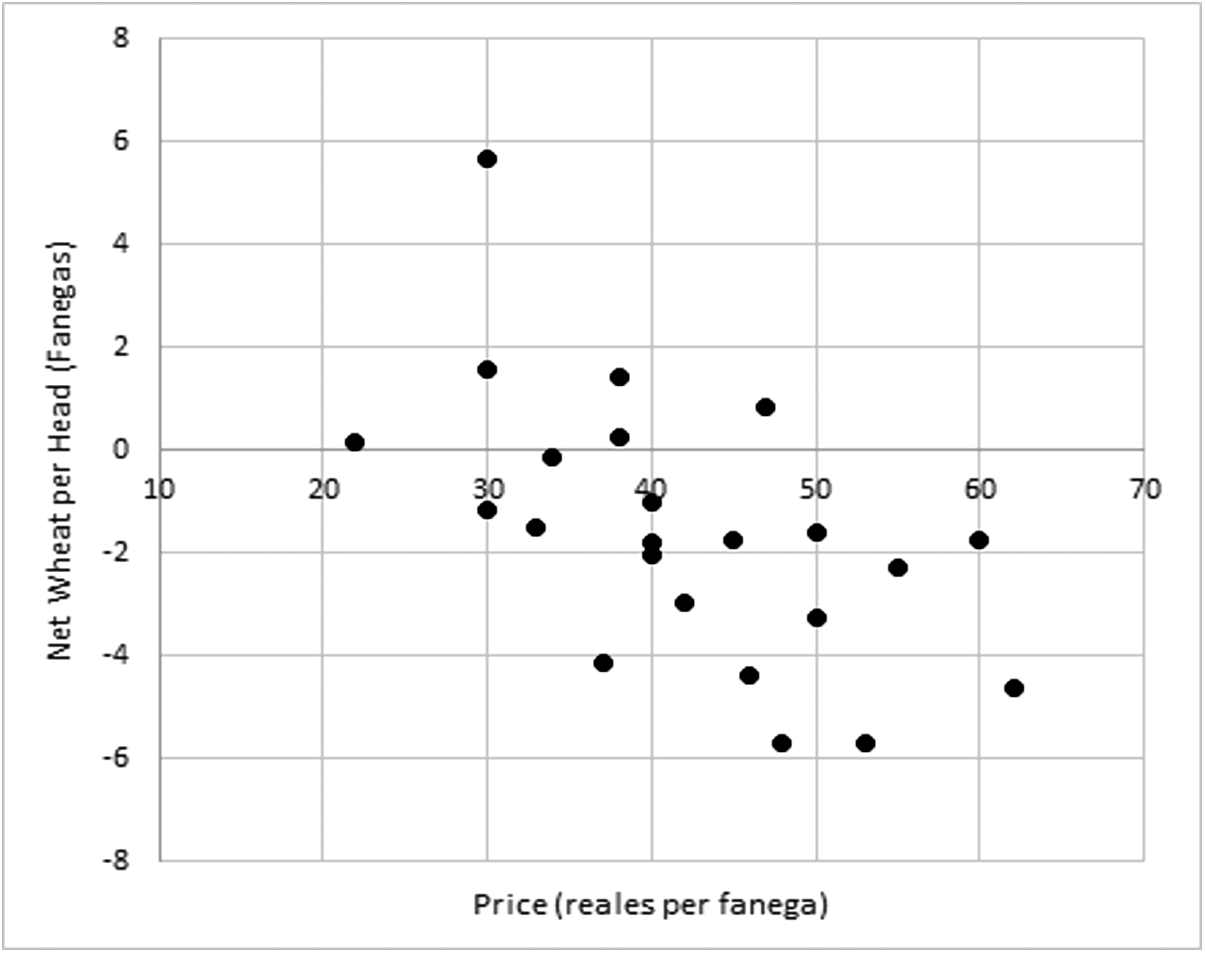
Therefore, prices were high in those areas that were more densely populated, like large cities and the coast, and low in those areas that were the leading grain producers of the Crown. To check the role played by supply and demand forces, we used the information from the Censo de Frutos y Manufacturas of 1799. This survey provides information regarding grain production, population, and prices at a regional level. Figure 3 confirms that the differences between supply and demand help to explain the different signs of the integration clusters. The grain-producing regions of Old Castile that enjoy a clear net wheat surplus present a lower price than those more densely populated regions where wheat production was smaller.Footnote 28
Wheat prices vs net wheat production per head. Sources: calculations from the Censo de frutos y Manufacturas (Polo y Catalina, Reference Polo Y Catalina1803).

The literature has supported the idea that the wheat from the interior could not reach the northern coast, where imports from other countries were necessary (Ringrose, Reference Ringrose1983: 178). The same situation is observed on the eastern coast, where imports from Mediterranean producers like Sicily covered a significant share of the consumption (Ramos and Miguel, Reference Ramos and Miguel1977). While most of the wheat surplus produced in Old Castile remained in the same region, lowering prices, the high demand on the coast had to be met by international trade. These large price differentials between relatively close regions suggest that geography could have significantly influenced price differences.
Figure 4 presents the absolute price gap estimated for each municipality as the absolute difference between the local price of wheat and the price in the closest city.
Absolute price gap. Sources: estimations from the Cadastre de la Ensenada.

The analysis of Figure 4 shows that there were clusters where that gap was considerably higher than the rest of the sample. This is especially clear in the North-East of Madrid, close to the border with the Crown of Aragon and some areas of Galicia and Asturias on the northern coast. We also find several clusters of higher gaps, mainly located in Cantabria in the north, close to the border with the Basque country, and Leon in the northwest, close to Portugal.
4. Methodology
As explained above, we explore how prices were set around cities in eighteenth-century Castile and how the variables proxying for trade costs and additional controls explain the wheat price gap between each municipality and its closest city. Therefore, our model can be summarized by Equation 1.
 \begin{align}Log{\text{ }}\left| {Price{\text{ }}Ga{p_{i,c}}} \right| = & {\beta _0} + {\beta _1}Location{\text{ }}and{\text{ }}Geograph{y_{i{\text{ }}}} + {\text{ }}{\beta _2}Infrastructur{e_i} \\ & \nonumber + {\beta _3}Cultur{e_i} + {\beta _4}Control{s_{{\text{ }}i}} + {\varepsilon _i}\end{align}
We first test a naive model using an OLS regression analysis. Because our data are geographically detailed, we can analyze the residual component in search of spatial autocorrelation. After finding an expected high degree of spatial autocorrelation, we search for the best-fit model for the spatial component of our data, and we recalibrate our coefficients using a more sophisticated spatial analysis framework that removes any bias created by the spatial dependencies. We argue that any unexplained remaining variance of the price gaps in the spatially adjusted residuals comes from the interaction with unobservable variables that we cannot measure, such as local or regional institutional components.
We expect our variables to determine the price differentials, in line with the existing literature. Consequently, we expect our price gaps to increase with distance, following the “law of one price.” Geography has been considered one of the main obstacles to economic integration in preindustrial Spain (Grafe, Reference Grafe2012). Hence, we expect a positive coefficient related to distance and rugged terrain (remote municipalities will bear higher trade costs and those that are difficult to access). Access to the coast can also enable trade and cabotage. For that reason, we expect that proximity to the coast leads to different mechanisms in the wheat price market (as explained by Grafe, Reference Grafe2012). We expect a reduction in the gap related to access to infrastructure, as the road network should alleviate transportation costs. In general, variables that tend to complicate transactions, such as different language barriers, should also increase the price gaps.
To analyze the potential effect of the seat of the government distorting market forces in Madrid and its surroundings, we also run the models in two subsamples that split the municipalities within the boundaries of the central market (Madrid) and those by the coast, which the literature suggests should have followed different principles. While Madrid was a clearly intervened market (not only being the capital but also the central city and market in the crown territory), the coastal regions were affected by different mechanisms, including foreign market forces. We present the results of all the previous specifications in the next section.
5. Results
5.1. Determinants of price gaps
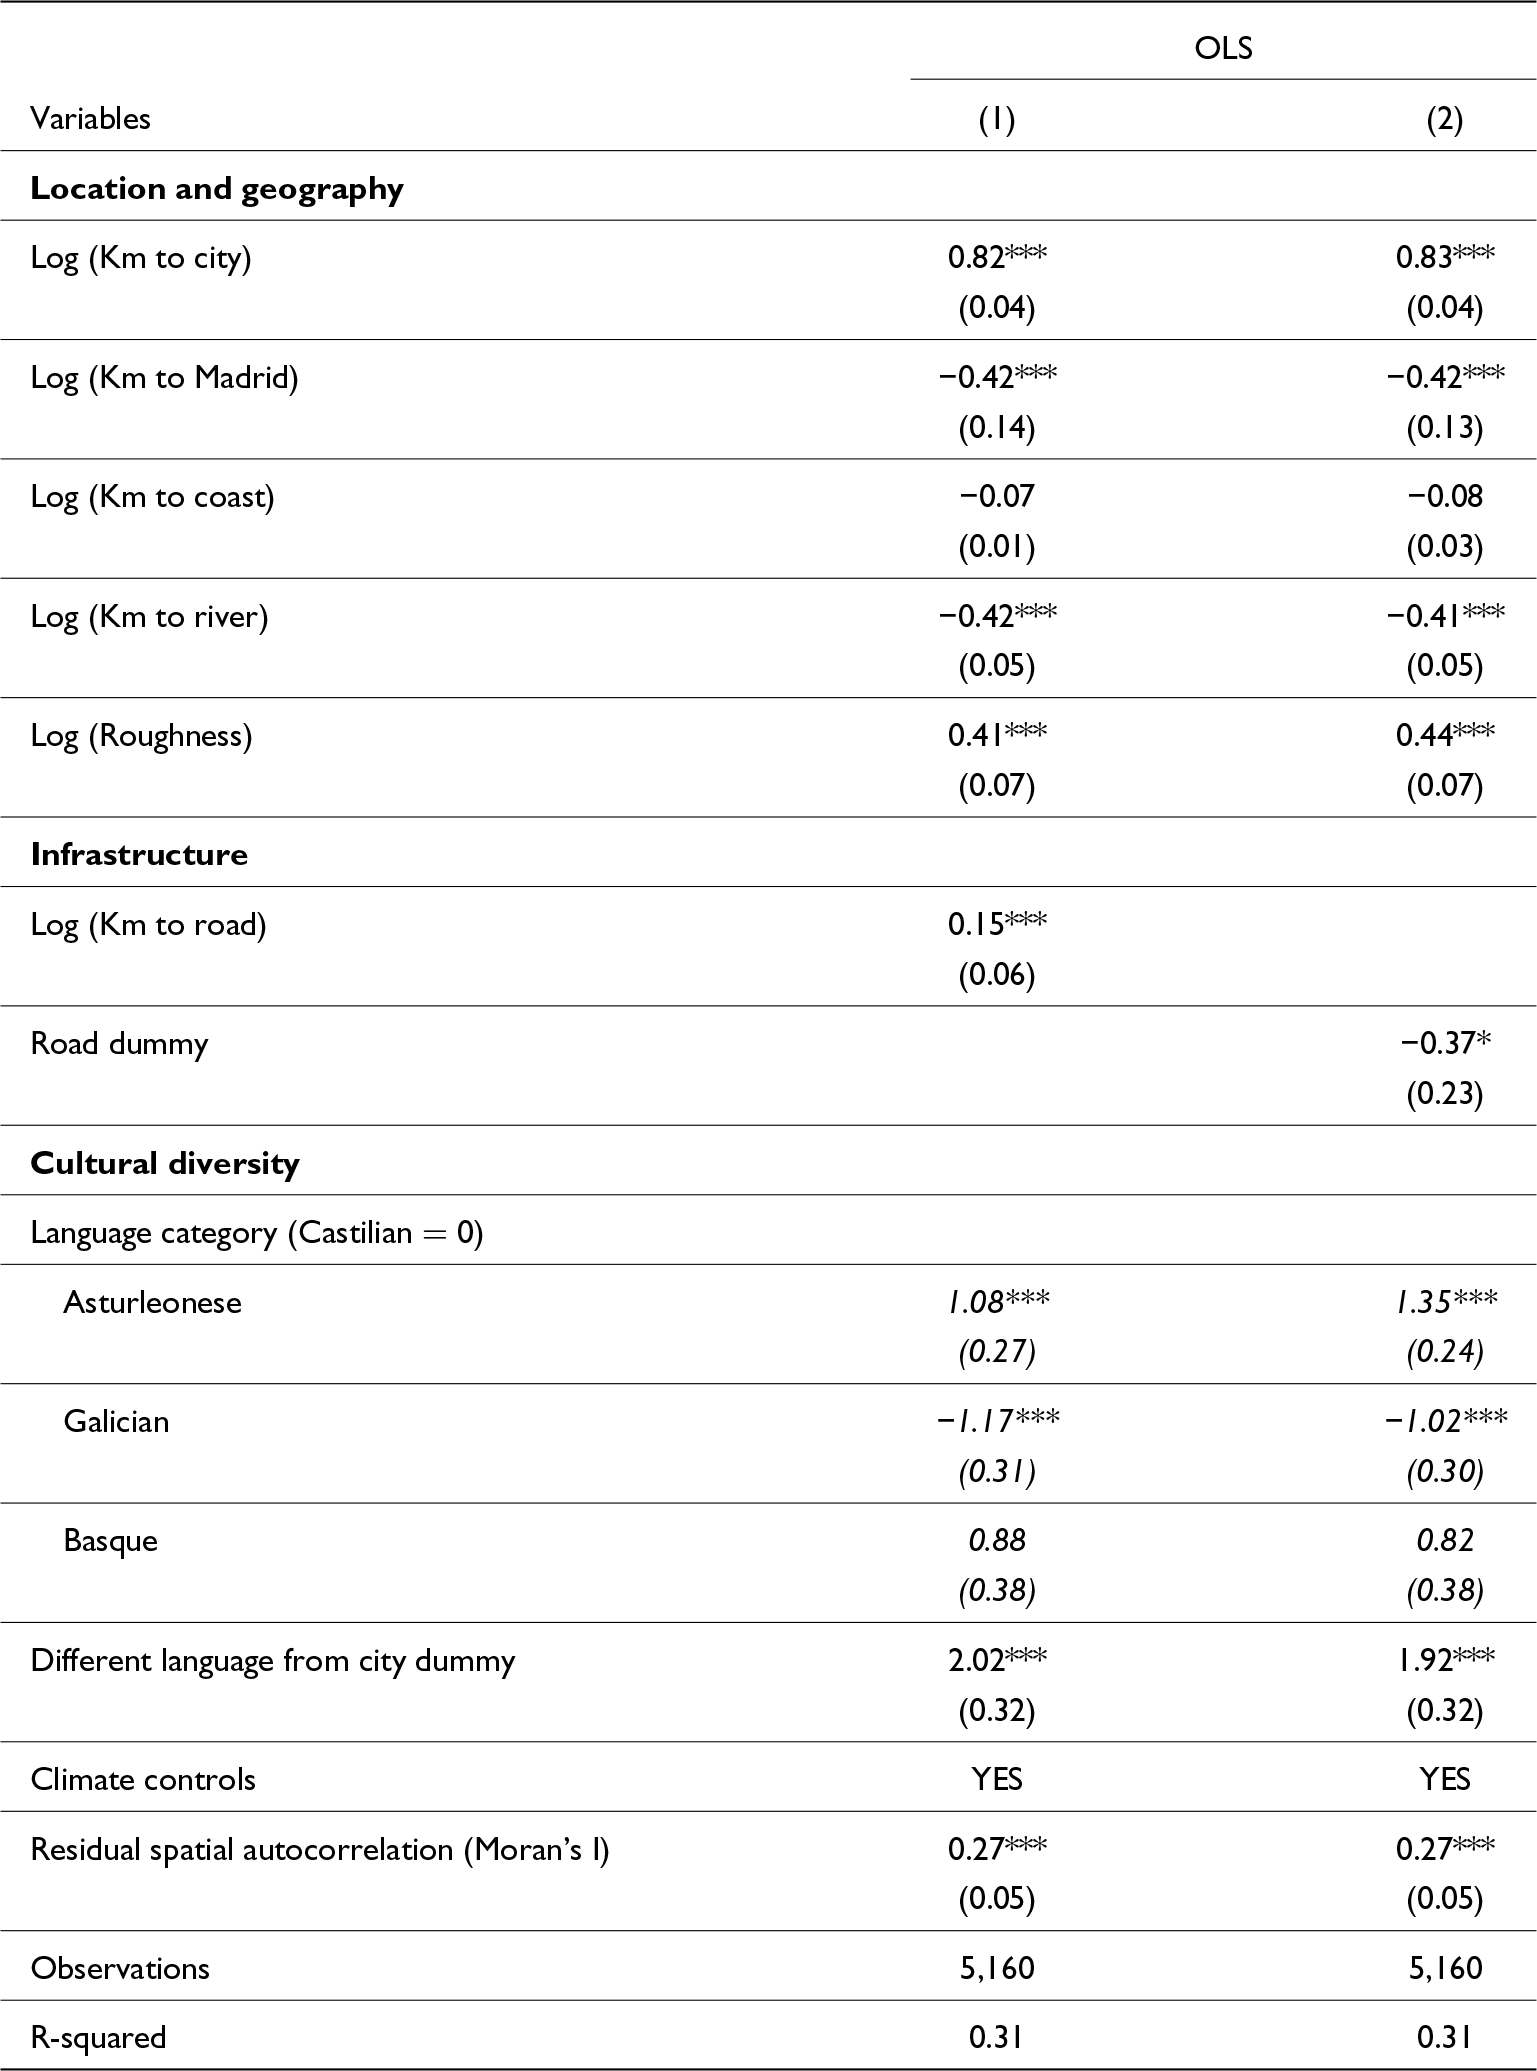
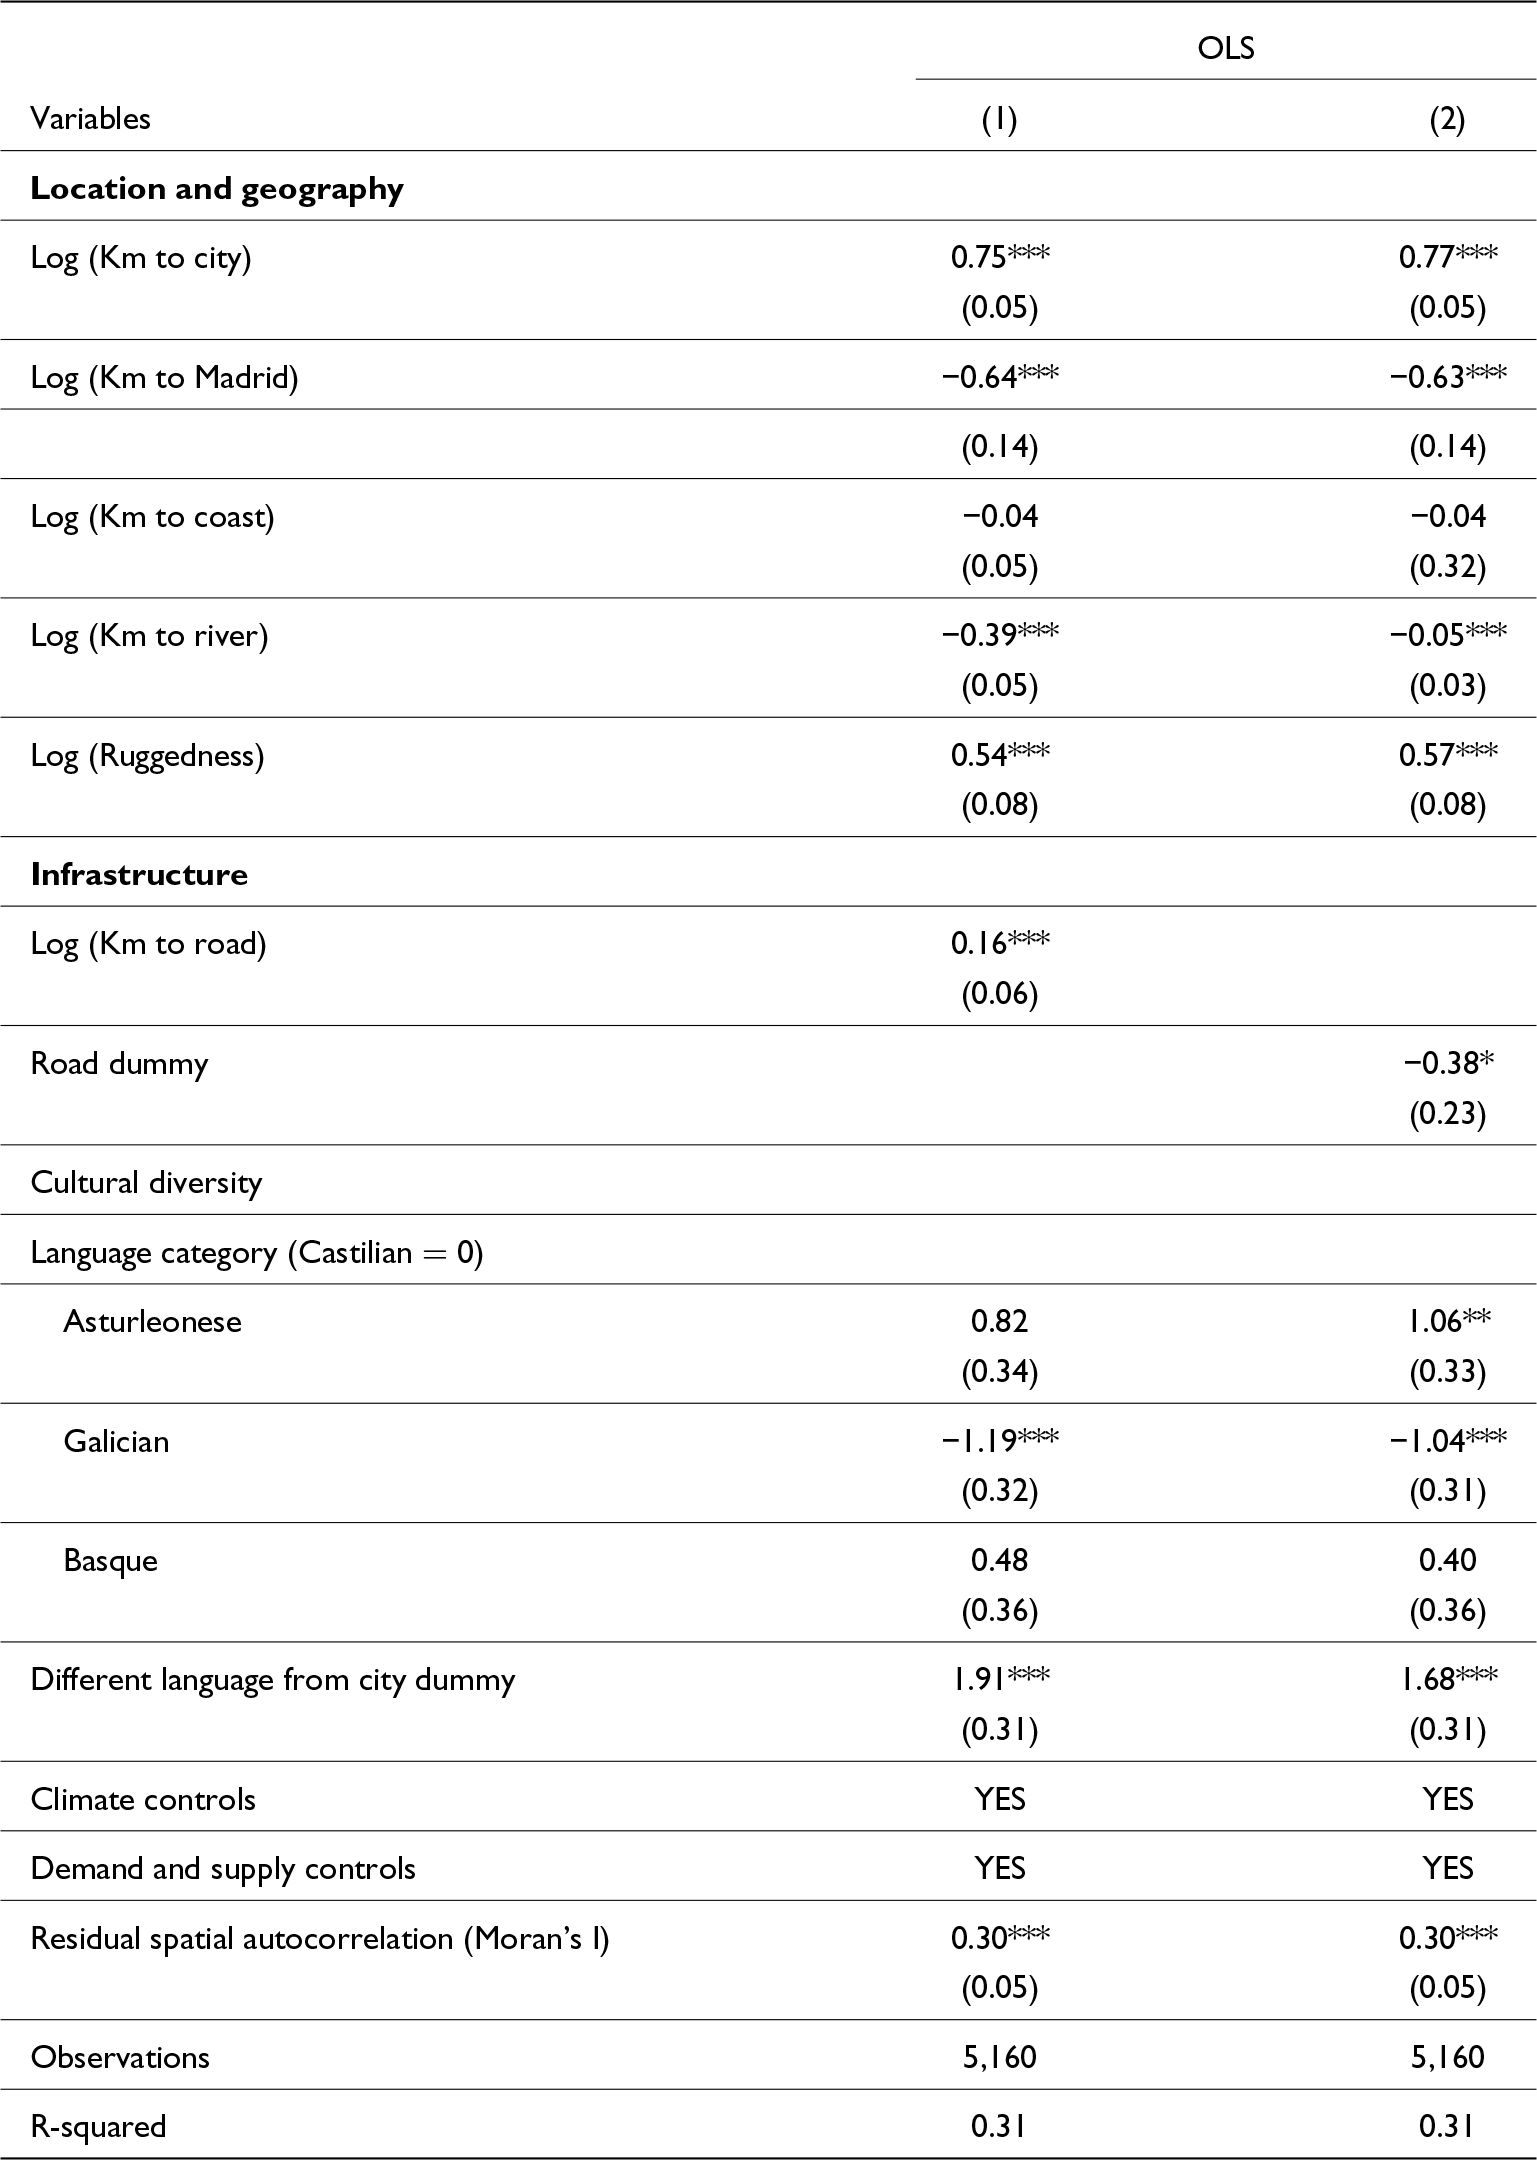
Table 2 below presents the OLS estimation. These initial attempts to find correlations with the independent variables show that easier access to the urban markets implies a reduction of the price gap: municipalities far from the local urban market are affected by larger price gaps. Using a dummy for municipalities integrated into the road network shows that direct access reduces the gap between the location and the urban market. Rugged terrain also increases the price gap, potentially due to higher transportation costs, while being closer to Madrid reduces it.
OLS coefficients for the log of the absolute value of municipal price gaps

Notes: This table shows the coefficients of OLS regressions for the absolute value of the price gap (1) and (2) and the 2SLS (3) and (4) respectively for each municipality and its closest city market in the full sample. We control for rain and temperature. All independent variables except dummies and Language (categorical) are expressed in logarithms. Spatial diagnostics of the error terms on each regression are also reported with their standard error and significance. Robust standard errors in parentheses, significance expressed by *** P < 0.01, ** P < 0.05, * P < 0.1
Finally, the variables measuring cultural differences are also significant. Municipalities where Galician is spoken show lower price gaps, while those speaking Asturleonese show higher gaps.Footnote 29 The positive correlation of the different languages from the local market suggests that language/cultural barriers might have also played a role in increasing transaction costs.Footnote 30
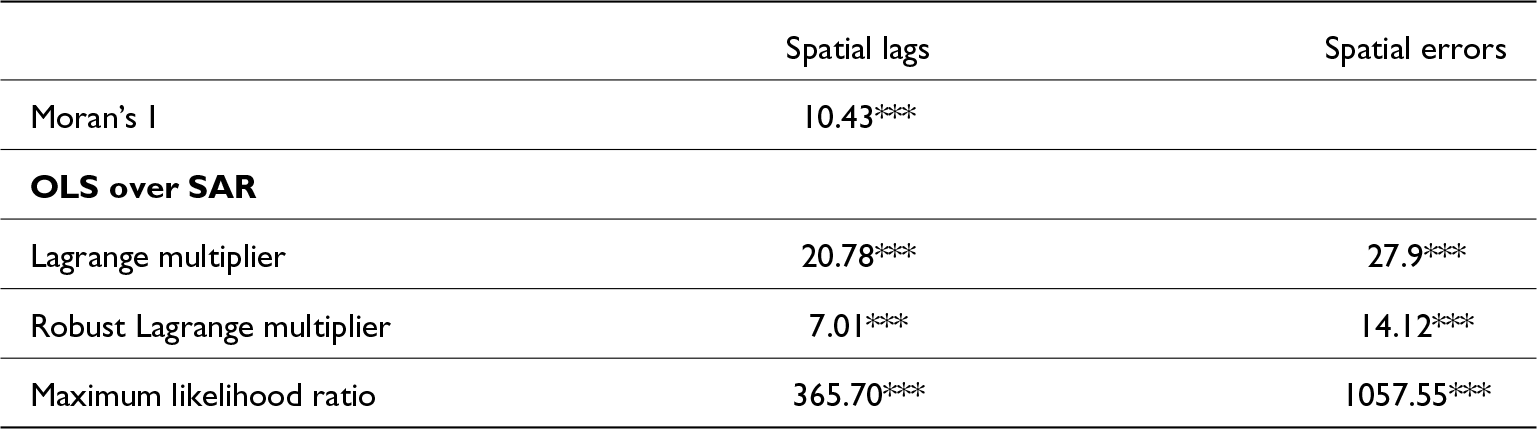
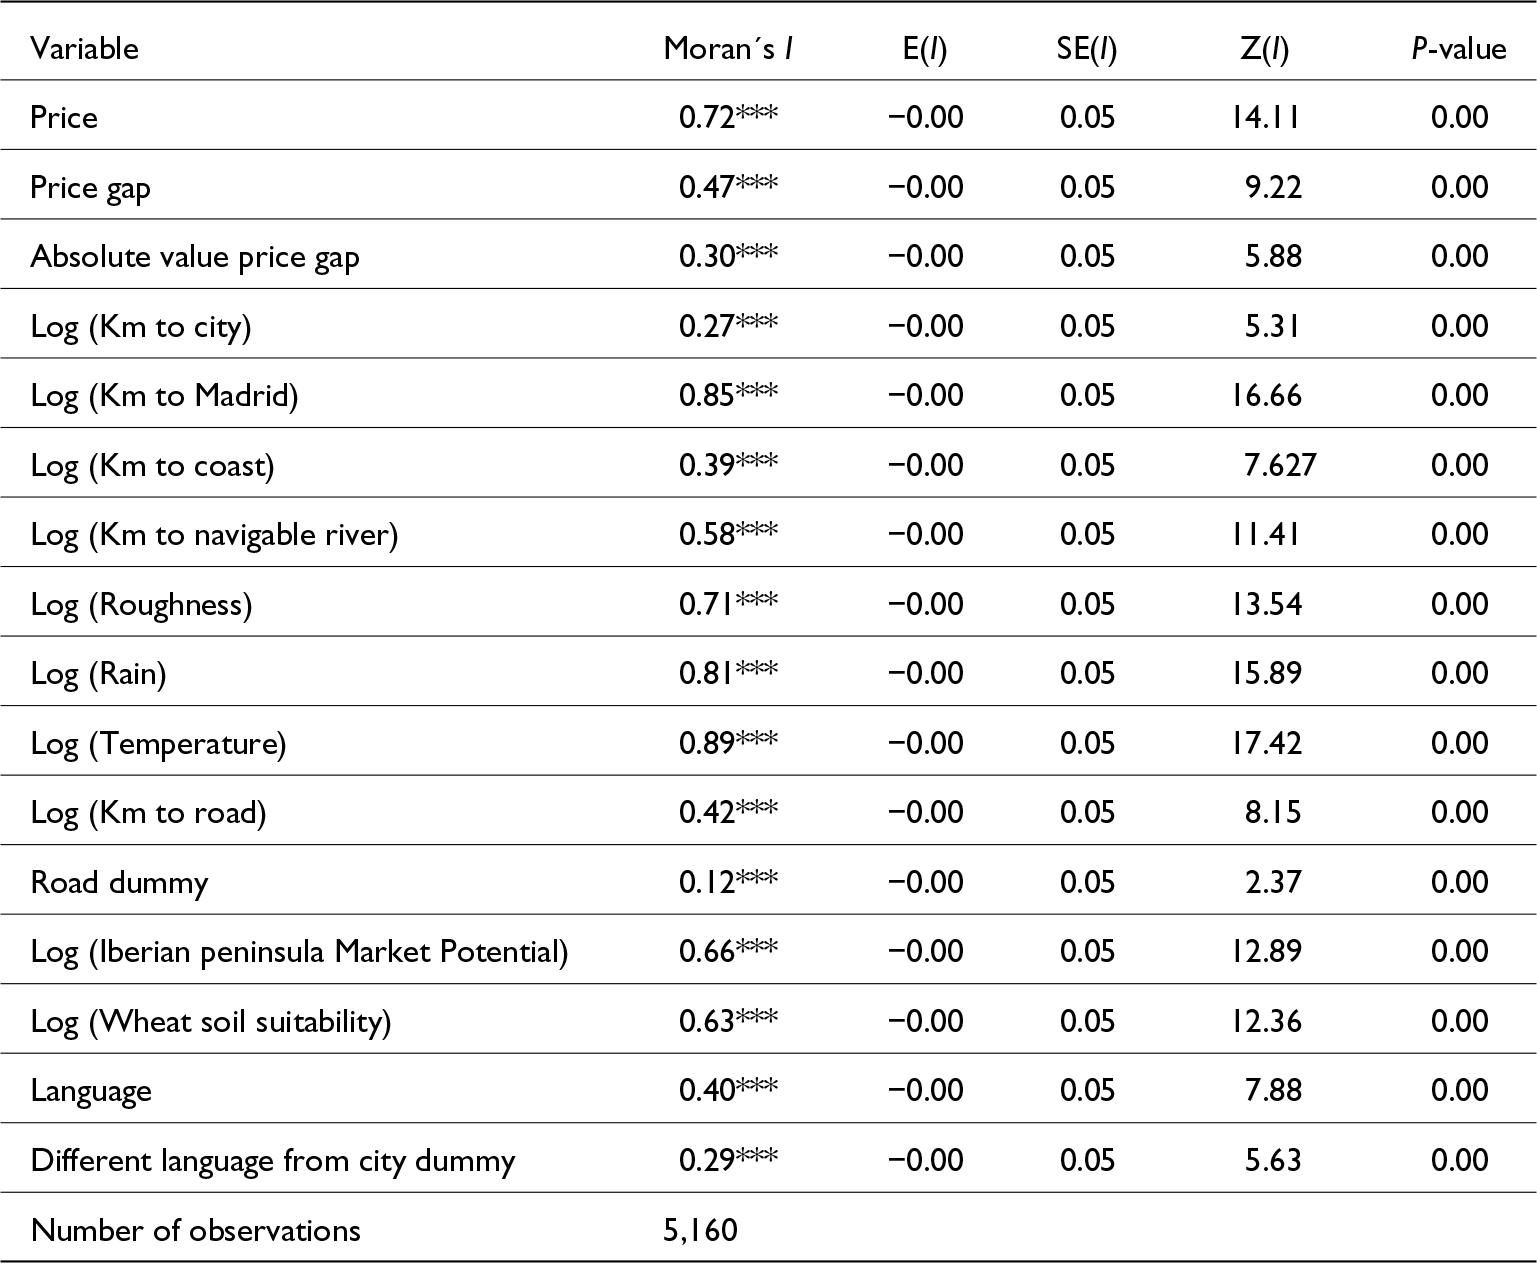
However, the nature of the dataset suggests that there are spatial dependencies. Since we have some geographical variables, using local-level observations implies that observations may share some features due to simple proximity (i.e., if a municipality is close to the center, its neighbors must also be). There is evidence of this presented in the Appendix, where Table A3 shows that all the variables in the model exhibit a significantly high degree of spatial correlation. In fact, the spatial dependence indicator (Moran’s I),shown at the end of each regression in Table 2, implies that the residuals from all the specifications are significantly spatially autocorrelated. According to spatial theorists, the cost of ignoring spatial autocorrelation in our dependent or independent variables is similar to that of an omitted variable bias (Elhorst, Reference Elhorst2010; Greene, Reference Greene2005: 133), the coefficients of the remaining variables may be biased and inconsistent.Footnote 31 Therefore, we argue that these naïve regression coefficients are biased and need to be incorporated into a regression model that takes care of these spatial dependencies. Table 3 presents our attempts to fit the model as a Spatial Autoregressive Model to capture the relationship of price gaps with its determinants, aside from spatially correlated patterns.Footnote 32
Spatial diagnostics tests

Notes: This table shows the statistics corresponding to column 1 Table 2 using an inverse weights distance matrix with a cut-off of 150 km (based on the maximum distance to the nearest city and at least one neighbor for all the municipalities) for spatial dependence in OLS regression versus a Spatial Lag Model and a Spatial Error Model. The results show evidence in favor of adopting a spatial autoregressive model. The maximum likelihood ratio tests show evidence that the true data-generation model needs to account for both Lag and Error spatial autocorrelation. Alternative matrixes have been tested leading to different results but similar conclusions. Statistical significance denoted by *** P < 0.01, ** P < 0.05, * P < 0.1.
To account for spatial dependencies, we define a spatial neighboring or weights matrix representing the gravitational forces between these municipalities. Spatial neighboring matrixes are usually constructed to capture that nearby elements have a larger effect than the ones located further away. In our case, we have designed our main matrix so that distance only matters within 150 km (the maximum distance from any of our municipalities to the closest city), decreasing its strength by a factor of 2. This is quite a conservative strategy since there is evidence that exchanges usually happened locally.Footnote 33
Spatial autocorrelation can affect our regressions in several ways: Firstly, if the dependent variable is spatially autocorrelated, then we need to include the spatial lags of the dependent variable in the model(Spatial Lag Model -SLM). Secondly, if independent variables are spatially autocorrelated, which is basically as if one unobserved independent variable is contained in the error term—Spatial Error Model. More complicated possibilities may occur in situations where both dependent and independent variables suffer from spatial dependencies, together with the error term. Spatial econometricians find that a specification inspired by time series (the Spatial Durbin model) can produce unbiased coefficients regardless of the model, but at the cost of efficiency if there is no additional correlation in the error term (LeSage and Pace, Reference LeSage and Pace2009). Finding the best way to model spatial interactions is not a straightforward task. While some econometricians prefer to apply a general-to-specific strategy (OLS without autocorrelation to Spatial Durbin), others advise the contrary (Spatial Durbin to no spatial effects). We follow the tradition in economic history, adding restrictions to the simplest specification, which is also Elhorst´s (Elhorst, Reference Elhorst2010) proposed testing for misspecification.
Hence, the first step is to test whether the Spatial Lag or Spatial Error model better describes the data than our naive OLS strategy. For that purpose, we use the classic and robust Lagrange Multiplier tests (Anselin, Reference Anselin2022). These tests consider the distribution of the residuals of the OLS model, which follow a chi-squared distribution with one degree of freedom. Table 3 shows the spatial diagnostics that compare the performance of the naïve model concerning a Spatial Autoregressive error and lag model. If the Lagrange Multipliers are significant, there is evidence that such a model would better fit the data than the OLS. The Robust Lagrange Multiplier test should unravel the tie if both are significant. From our results, a statistically significant Robust Lagrange multiplier for the Spatial Lag models but insignificant for the Spatial Error Model, it is clear that we can discard the Spatial Error Model. However, before taking the Spatial Lag Model as the true data-generation model, we follow Elhorst’s suggestion to examine whether the Spatial Durbin model can be simplified to a Spatial Lag model using the Maximum Likelihood ratio tests.
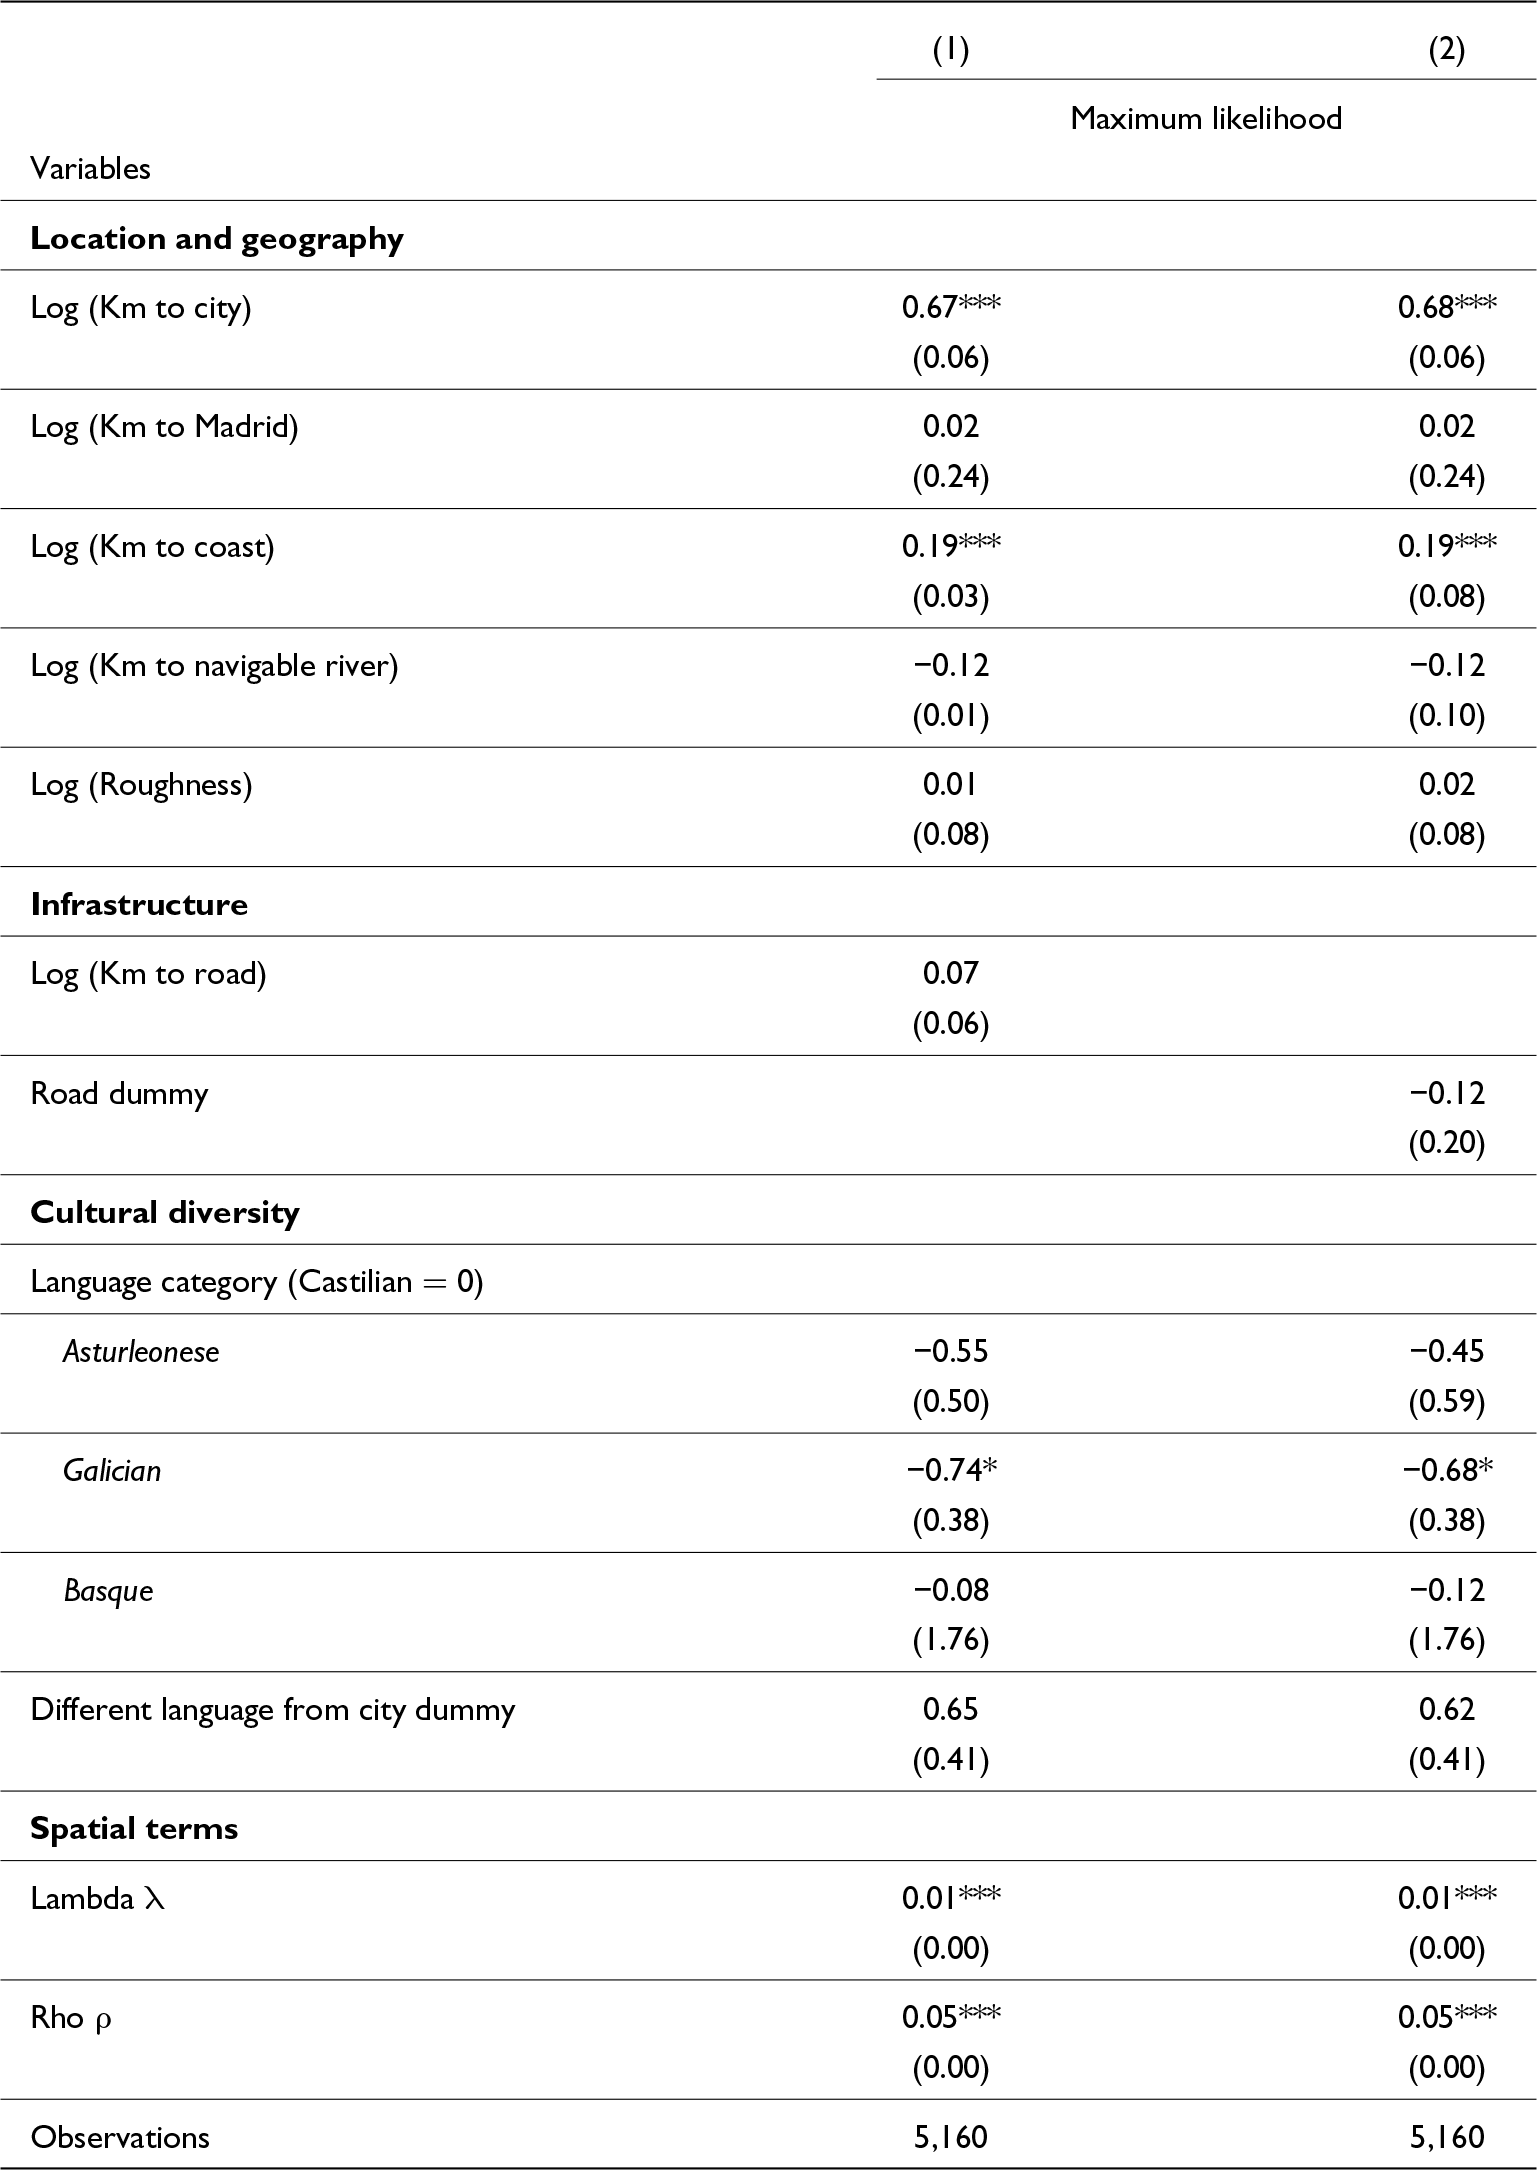
Using Elhorst´s taxonomy, the null would be H0: θ = 0, which implies that the Spatial Lag model is a nested version of the Spatial Durbin model. The ML estimator testing for the value of θ follows a chi-squared distribution with K degrees of freedom, which is high and significant. Therefore, there is evidence that using the Spatial Durbin model would imply a statistically significant improvement in model fit. Hence, we present our model using a Spatial Durbin specification estimated by maximum likelihood and GMM, which shows the autoregressive regression specification in Table 4.
Spatial Durbin model coefficients for the log of absolute value of regional price gaps in the full sample

Notes: This table shows the coefficients for the Spatial Durbin model regression for the price gap for each municipality and its closest city market in the full sample using an inverse distance matrix up to 150 km. We use maximum likelihood estimators for the simple version in Panel 1. We control for rain, temperature, demand (market potential of the Iberian peninsula) and supply (wheat soil quality). All independent variables except dummies and Language (categorical) are expressed in logarithms. Robust standard errors in parentheses, significance expressed by *** P < 0.01, ** P < 0.05, * P < 0.1
Firstly, we note that,the spatial terms (lambda and rho) are indeed statistically significant. The λ coefficient represents the effect of the dependent variable lags, and the ⍴ coefficient represents the error term autocorrelation (which can come from independent variables being spatial dependence as well as the unobservable autocorrelation). Although the size of λ and ⍴ are relatively small, their significance indicates that they influence the estimated effects of centrality-related variables. These differences between methods are consistent with findings documented in the literature (LeSage & Pace, Reference LeSage and Pace2009).
Notably, once we account for spatial autocorrelation, the coefficients for the distance to Madrid are not significant. We interpret these results as the interaction of two forces: firstly, the aforementioned market interventions to feed Madrid, not only as the geographical and political center of the country but also as the biggest population cluster, as explained by Ringrose (Reference Ringrose1996), that could have created a large area around the capital where its influence could be noted. Taken together, being close to the local market implies lower price gaps. Once spatial effects have been controlled for, the statistical significance of access to roads disappears, while being close to the coast helps to reduce the price gap, something that could be related to the possibility of cabotage.
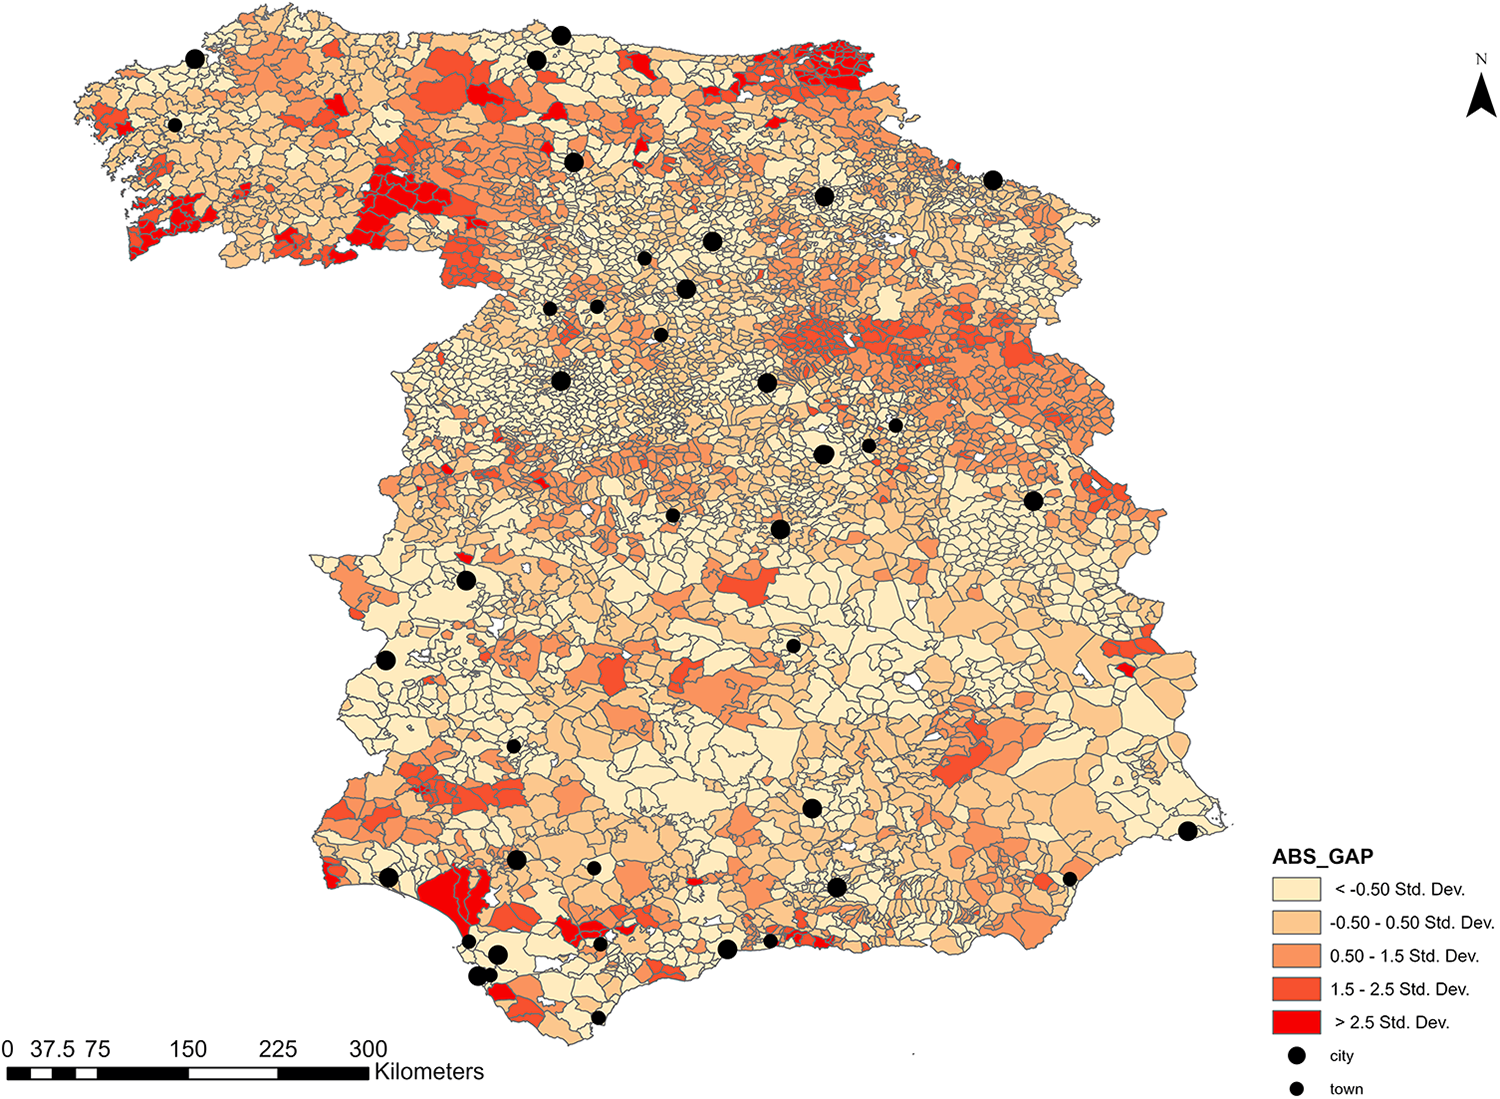
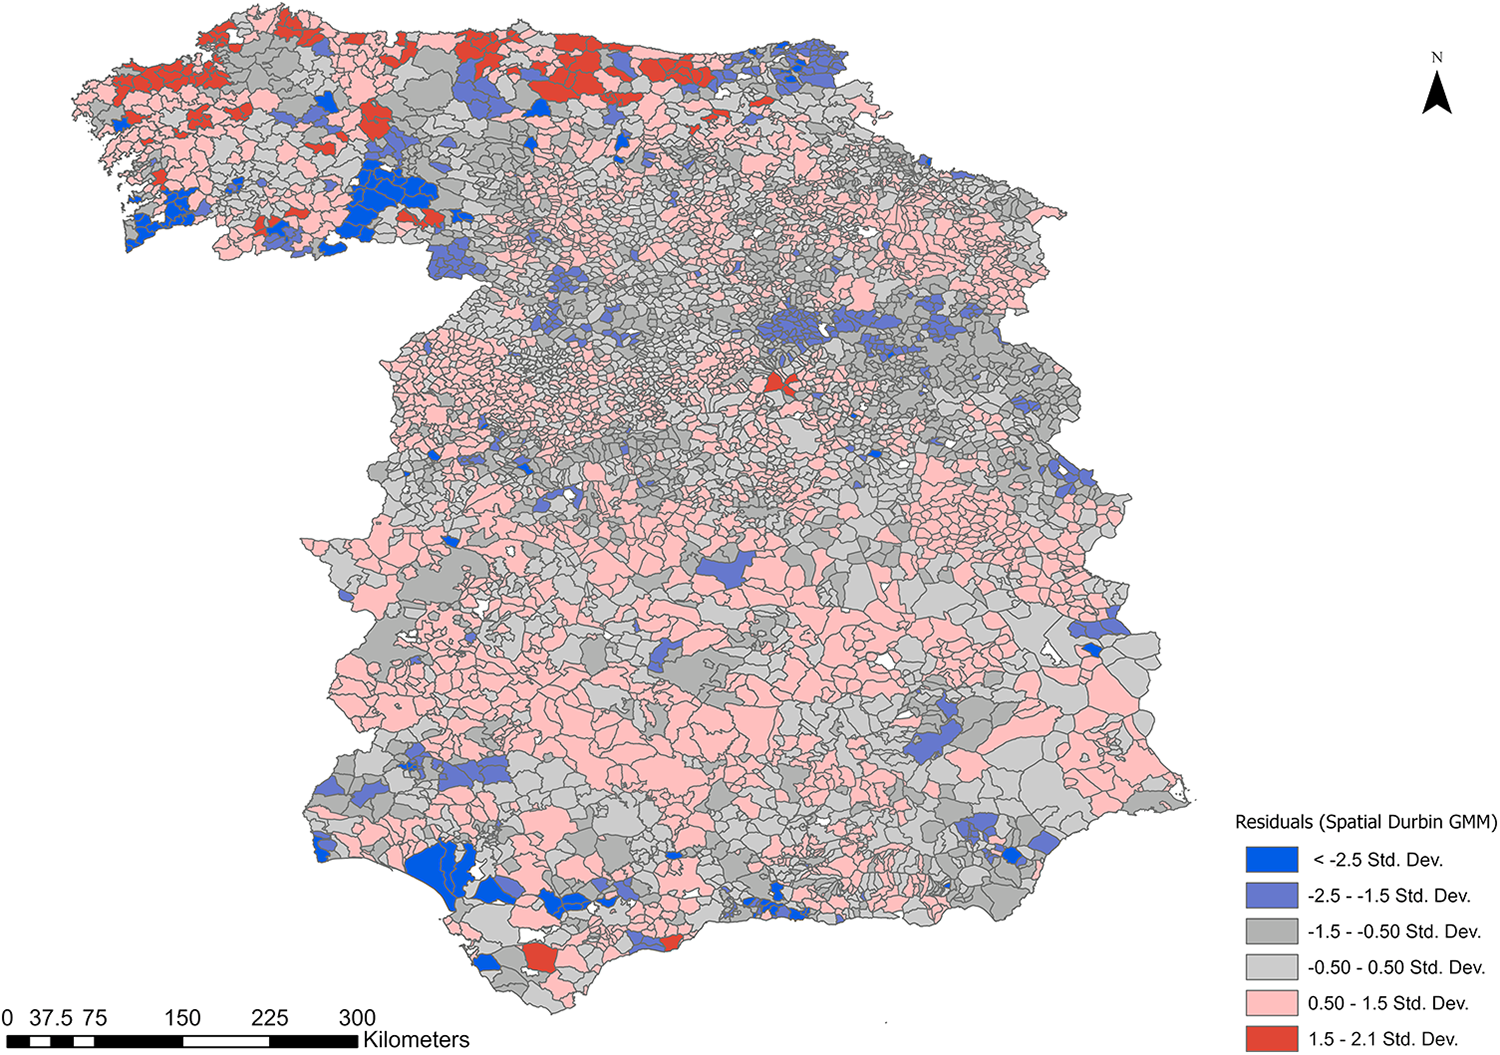
Figure 5 shows the residuals from the Spatial Durbin model with GMM specification in column (4) of Table 4. It is clear from its graphical representation that even after using the more sophisticated model to explain the price gaps, certain important regional factors remain unexplained. The map shows in blue municipalities where the model overestimates the price difference measured in standard deviations and in red those in which the model underestimates the gap. Although most municipalities show residuals within the range of ± 0.5 standard deviations, some noticeable clusters show significant differences. Extreme residuals (beyond 2.5 standard deviations) are generally close to frontier limits and may indicate a particular influence from foreign markets. Note that the model underestimates one large noticeable municipality, which is precisely the city of Madrid. Positive large residuals, on the other hand, are primarily located by the northern coast and isolated clusters in the south. Some of these clusters, especially those in the north, are located in areas that speak a different language from Castilian, pointing to possible institutions that we cannot observe. This is consistent with our results in Table 4 also indicates that language and cultural barriers are crucial in determining regional price gaps. However, we note that the language barrier is only an indicator of cultural diversity, but we cannot assess how institutions vary by region.Footnote 34
Residuals from the spatial Durbin model with instrument (GMM). Sources: estimations from the Cadastre de la Ensenada.

According to the literature and as explained in detail earlier, the central market in Madrid was institutionally intervened by the necessity to feed the capital. An example of these distortions in the market was the regular acquisitions from suppliers further than 200 miles (320 km) away, reaching even provinces from Andalusia in the south (Ringrose, Reference Ringrose1983: 150). During years of particularly bad harvests, the government forced shipping from surrounding regions, providing an example of disruptions of market incentives. The situation in the periphery was different, not only because distance and geography hampered the government’s political capacity in Madrid, which barely reached the regions on the coast, but also because overseas imports supplied grain in the largest coastal cities.
Therefore, we repeat our analysis considering both extremes: municipalities in the territory’s core around Madrid, on the one hand, and by the coast on the other. We identified the core as those municipalities which were affected by central cities (Madrid, Alcalá de Henares, Talavera de la Reina, Valladolid, and Toledo) and those in the periphery as the locations whose closest local market is a port city (Vera, Gijón, Cádiz, Puerto Real, San Roque, Sanlúcar de Barrameda, A Coruña, Málaga, Vélez-Málaga, Cartagena, and Sevilla). These are presented in Table 5, which aims to explore how the determinants of price gaps differ across regions, and whether proximity to Madrid is supposed to be a distortion in the way markets work, as suggested by Table 4. These sub-samples indicate that the spatial element in our model has a strong influence on price gaps in central markets, while it has little relevance in peripheral (port) regions. This implies a core-periphery effect in market dynamics, as noted throughout the text. Moran’s I confirms this, showing high spatial autocorrelation in the central market sample (8.43***), which indicates tight spatial interconnectedness in these areas. In contrast, spatial autocorrelation is minimal in the port sample, indicating that port markets are less influenced by neighboring regions’ price dynamics. This contrast highlights how core markets are more spatially interdependent, while peripheral markets operate with greater spatial independence.
Model calibration for central and port market samples for absolute value of regional price gaps
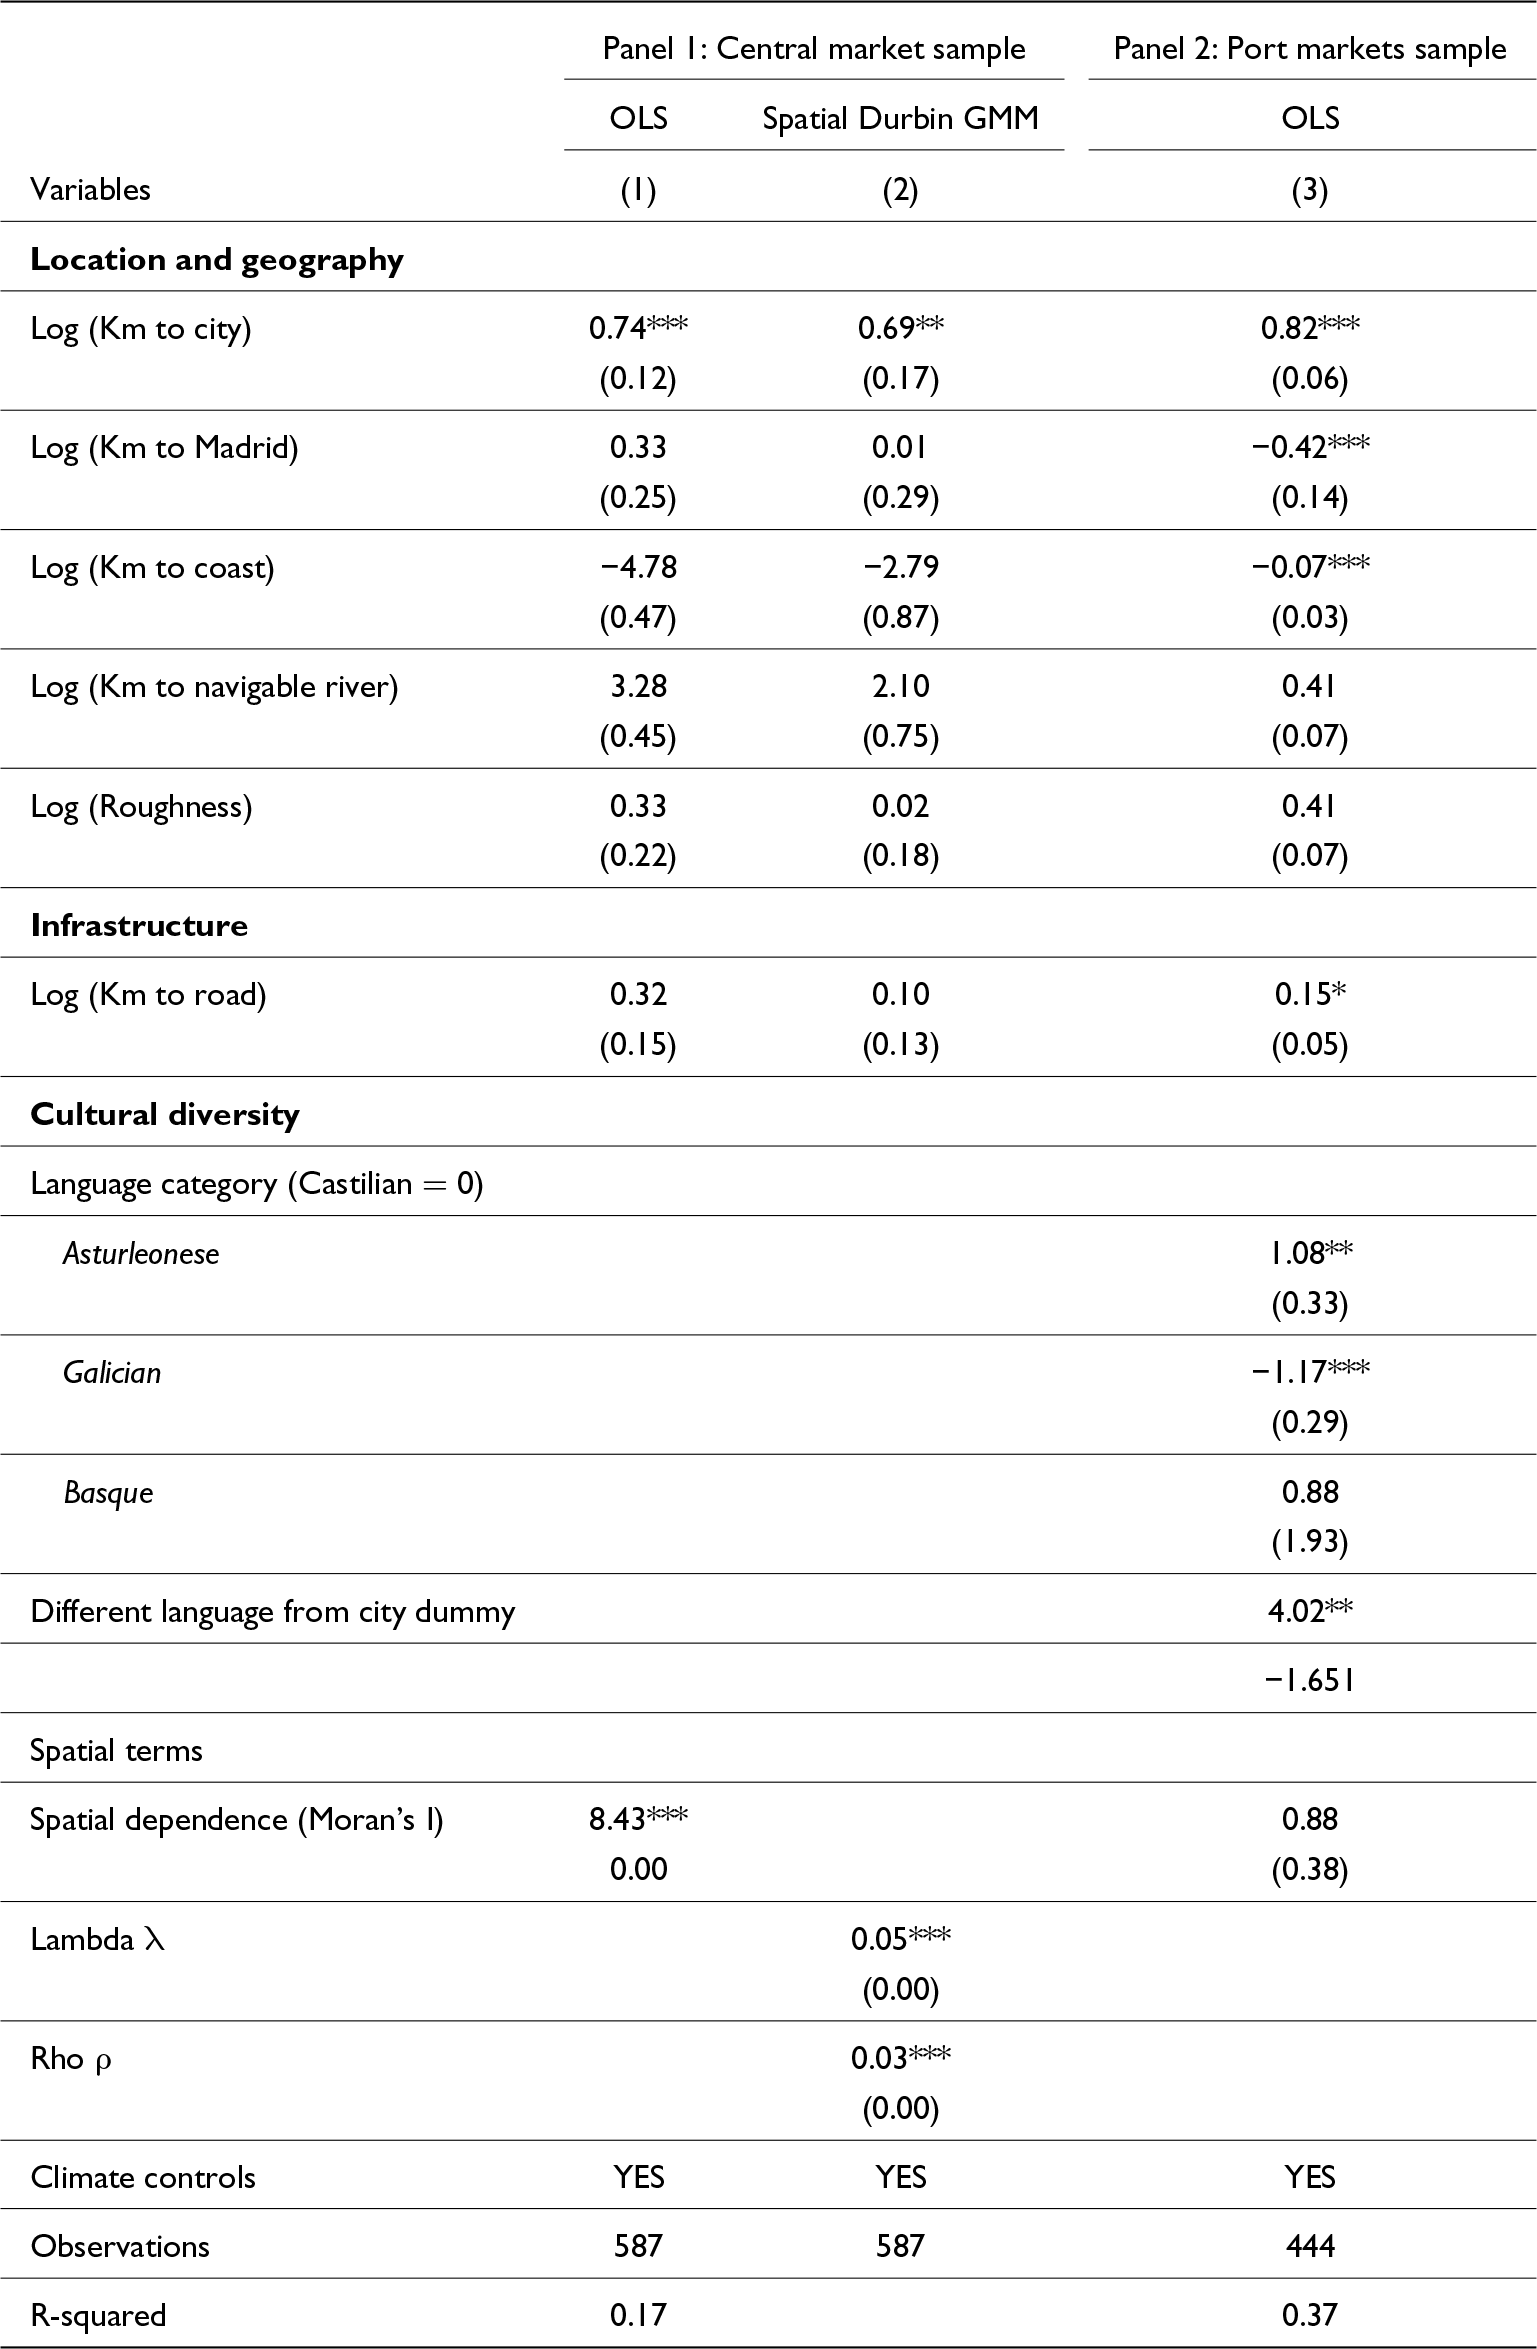
Notes: This table shows the Spatial autoregressive model coefficients for the municipalities around the central market (Madrid, Alcalá de Henares, Talavera de la Reina, Valladolid, and Toledo) in Panel A, and in the port cities (Vera, Gijón, Cádiz, Puerto Real, San Roque, Sanlúcar de Barrameda, A Coruña, Málaga, Vélez-Málaga, Cartagena and Seville) in Panel B. We control for climate and demand (market potential) and supply (wheat soil suitability). All independent variables except dummies and Language (categorical, where Castilian equals 0) are expressed in logarithms. Spatial diagnostics of the error terms on each regression are also reported with their P-value and significance. Robust standard errors in parentheses, significance expressed by *** P < 0.01, ** P < 0.05, * P < 0.1
Once spatial effects have been considered in the core, practically all the variables identified by the literature and included in our model lost significance, remaining only distance to the closest city. In the case of the periphery, the situation is different. The size of the coefficient for the distance to the closest city is significantly larger than in the central sample, and other variables relevant for the formation of prices are now significant, such as access to roads and being located by the coast, which we associate with access to transport infrastructures.
We also find a very strong effect in the distance to Madrid variable that presents a negative significant coefficient, meaning that the larger the distance from the capital the lower the price gap. Given the small probability of Madrid’s institutional influence on the grain markets reaching the locations included in our periphery sample, we believe that what this variable is capturing in this case is the distance to the coast. Being located in the geographical center of the Iberian Peninsula, the distance to Madrid is also a proxy of the distance to the coast, meaning that a larger distance from Madrid also implies a lower distance to the coast.
The strong and positive effect of the different language dummy could be related to the fact that there are very few locations in the periphery included in this group. These results confirm that the variables that we expect to play a role in price formation were weaker around the capital when the spatial effects were accounted for, while they were more relevant in the periphery. It also provides evidence supporting the idea that institutional market disruptions could be captured and therefore proxied by spatial effects.
Our findings in this paper model the distribution of price formation across the Spanish landscape from the urban center into its rural hinterlands. We show that a significant part of how prices form comes from distance. The further the city, the higher the trade costs are, and therefore the larger the price gap. We also find a significant asymmetry that could be related to the institutional interventions in the market during the 18th century. These findings confirm Spanish historiography and are consistent with recent research that claims asymmetric transaction costs during the nineteenth century (Iglesias and Maixé-Altés, Reference Iglesias and Maixé-Altés2021).
5. Conclusions
In this paper, we took advantage of the great detail of a newly assembled dataset extracted from the Cadastre de la Ensenada, a survey carried out at the municipal level in mid-18th-century Spain. We studied how trade costs worked as determinants of price gaps in our case study. Our results show that better access to urban markets reduced price gaps in rural areas, suggesting that the law of one price could be explained by traditional market forces. However, we also find that important spatial effects bias our estimates if they are unaccounted for. We show that spatial effects indeed biased the coefficients of most of our independent variables, meaning that the effect of variables such as the distance to the closest city gains relevance once spatial effects are considered, while others like being in the coast gain significance.
However, although those were the average main results for the whole sample, we also found a particular pattern around Madrid, where almost none of the variables we expected to impact price gaps worked properly. We use two sub-samples, distinguishing municipalities in the capital’s surroundings and coastland regions. Our results show that only the distance to the closest city works as a determinant of price gaps around Madrid. We believe our paper could provide new quantitative evidence supporting that Madrid was a market disruptor of the grain markets in 18th-century Castile. As explained in the text, this was probably a consequence of the interventions in the market by the authorities to prevent price hikes in the capital and the consequent potential social unrest. Therefore, our results point out the disruptive effect of political intervention in the markets. On the other hand, in the sample including cities in the periphery, the variables identified as relevant for market formation work better. We believe that this can be a consequence of the difficulties and disruptions caused by the political intervention from Madrid reaching areas in the periphery of Castile, as well as thanks to the access to international grain suppliers that created more favorable conditions for the market.
Although there is still work to be done, including testing the potential causality between the interventions around Madrid and the spatial effects, our work contributes to the literature by providing the setup for exploring the spread of prices across space from urban to rural locations. This is possible because we use a new historical database of unprecedented detail to study price gaps across space instead of using distant bilateral pairs. This lets us establish where price differentials come from. We provide quantitative evidence that institutional factors could have influenced price gaps (and consequently, market integration) in Spain, which was an accepted theory but never adequately tested. We finally demonstrate the general need to test and control for spatial autocorrelation, and show how their existence, far from generalized or nonexistent, could present important regional variations.
Supplementary material
The supplementary material for this article can be found at https://doi.org/10.1017/S0212610925100657.
Acknowledgements
We acknowledge support from the I+D+i, Ministerio de Educación y Ciencia. (PID2020-117468GB) research grant. Carlos Santiago-Caballero also thanks Fundación Ramón Areces for funding the project “Experiencias históricas en la formación de áreas monetarias óptimas.” and is grateful for the support from the Center for Economic Institutions from the Institute of Economic Research (Hitotsubashi University). Alexandra L. Cermeño is additionally grateful to the “Jan Wallander and Tom Hedelius Foundation program grant (P20-0037).
Appendix
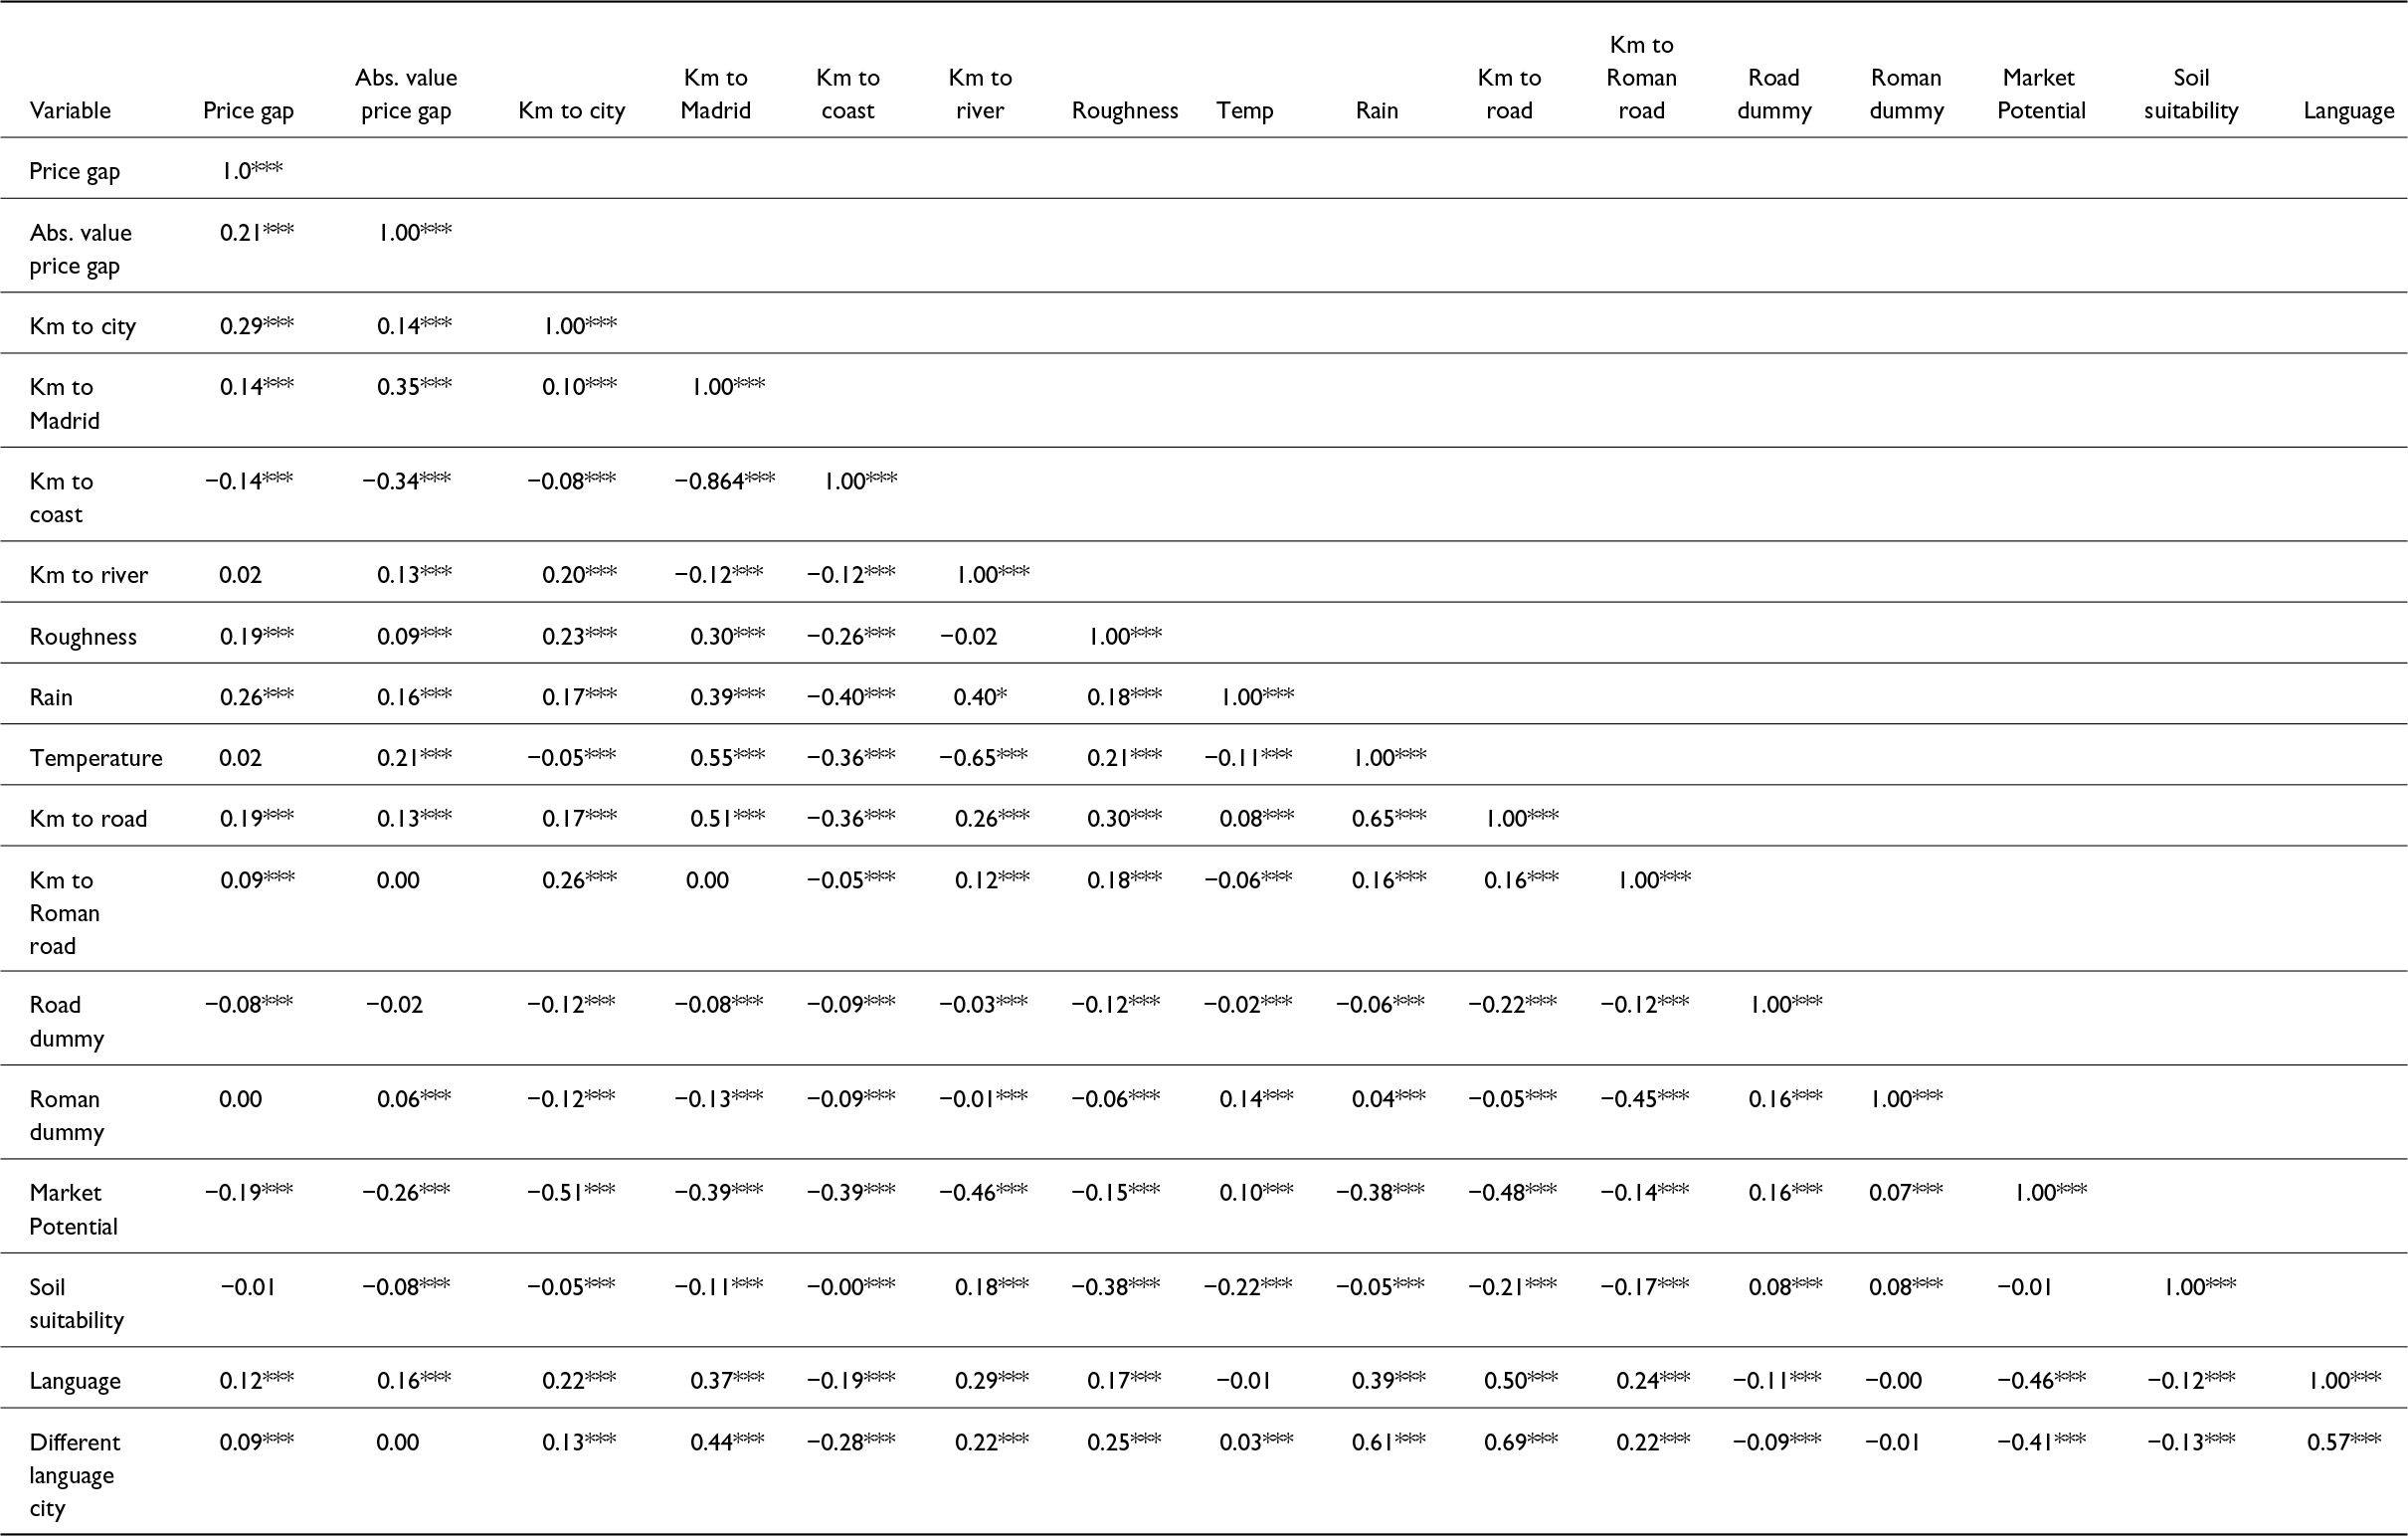
Correlation in variables in the dataset

Note: This table reports the pairwise correlation coefficients between all variables for the 5,160 observations in our dataset. Statistical significance denoted by Different language from city dummy *P < 0.05, **P < 0.01, and ***P < 0.001.
OLS coefficients for the log of the absolute value of municipal price gaps with demand and supply controls

Notes: This table shows the coefficients of OLS regressions for the absolute value of the price gap (1) and (2) and the 2SLS (3) and (4) respectively for each municipality and its closest city market in the full sample. We control for rain, temperature, demand (market potential of the Iberian peninsula), and supply (wheat soil quality). All independent variables except dummies and Language (categorical) are expressed in logarithms. Spatial diagnostics of the error terms on each regression are also reported with their standard error and significance. Robust standard errors in parentheses, significance expressed by *** P < 0.01, ** P < 0.05, * P < 0.1
Spatial autocorrelation analysis in variables

Note: this table shows the spatial diagnostics of the dependent and independent variables in our models. The Moran´s Indices have been obtained using an inverse distance spatial weights matrix with a threshold of 150 km (maximum distance to city within the Crown) and a decay parameter of 2. All the variables show statistically significant deviations from the expected value E(I) under the null hypothesis of spatial randomization. Considering smaller or larger thresholds allows us to reach the same conclusions.
Territorial coverage and main historical regions (gray).


 Open access