


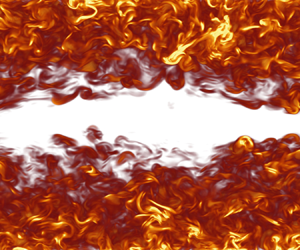





1. Introduction
A turbulent channel flow heated from the top and cooled from the bottom – so that warm and thus lighter fluid overlays cold and thus heavier fluid – is called stably stratified-turbulent channel flow. This flow is subject to a vertical (wall-normal) buoyancy force that, interacting with turbulence, can strongly change momentum, energy and mass transport. The complex physics of wall-bounded stably stratified turbulence is governed by the interplay between inertial and buoyancy forces, flavoured also by the presence of viscous forces and thermal diffusion. This interplay is commonly quantified in terms of three main dimensionless numbers: the Reynolds number  $Re$ – the ratio of inertial to viscous forces – the Richardson number $Ri$ – the ratio of buoyancy to inertial forces – and the Prandtl number $Pr$ – the ratio of momentum to thermal diffusivities. The study of stably stratified turbulence in the presence of boundaries is of great importance in a number of industrial processes, from energy supply/removal in heat transfer equipment to chemical/nuclear reactors (Dostal, Hejzlar & Driscoll Reference Dostal, Hejzlar and Driscoll2006; Pitla et al. Reference Pitla, Robinson, Groll and Ramadhyani2006), but it has also significance in a number of environmental flows, including for example the dynamics of the nocturnal atmospheric boundary layer (Mahrt Reference Mahrt2014), or the motion of organic matter in terrestrial water bodies (LaCasce & Bower Reference LaCasce and Bower2000; Lovecchio, Zonta & Soldati Reference Lovecchio, Zonta and Soldati2014).
Since the first works of Monin & Obukhov (Reference Monin and Obukhov1954) and Bolgiano (Reference Bolgiano1959), which were motivated by the study of the atmospheric boundary layer, a number of field measurements, experiments, simulations and theoretical models have been developed (we refer the reader to Fernando (Reference Fernando1991), Zonta & Soldati (Reference Zonta and Soldati2018) and Caulfield (Reference Caulfield2021), for a more complete overview on the topic) with the main purpose of inferring flow stability properties and suitable scaling laws for the relevant global quantities (i.e. energy/momentum fluxes, length scales, mixing efficiency) as a function of the observed/imposed stratification. Reportedly, detailed experimental measurements of stratified flows, in particular in proximity of a wall, are extremely challenging and difficult to realize when non-optical techniques are employed (Arya Reference Arya1975; Komori et al. Reference Komori, Ueda, Ogino and Mizushina1983; Ohya, Neff & Meroney Reference Ohya, Neff and Meroney1997). Yet, accurate measurements by optical techniques have become available recently (Williams et al. Reference Williams, Hohman, Van Buren, Bou-Zeid and Smits2017), and have contributed a lot to the advancement in the field, although their accuracy in the near-wall region remains problematic.
In this context, numerical simulations – granting access to the entire velocity and temperature field down to the region very close to the wall – have emerged as a valuable tool to understand and characterize the local as well as the global structure of the flow. It is therefore not surprising that large eddy simulations and direct numerical simulations (LES and DNS) of thermally stratified channel turbulence have been performed more and more frequently in the last twenty years. Among the first numerical studies of wall-bounded stratified flows, Garg et al. (Reference Garg, Ferziger, Monismith and Koseff2000) employed wall-resolved LES to compute the dynamics of incompressible stratified turbulence in both closed and open channel flow configurations at a constant Reynolds and Prandtl numbers ( $Re_{\tau }=180$ and $Pr=0.71$) but at different Richardson number $Ri_{\tau }$ (i.e. different stratification levels). Note that the subscript $\tau$ indicates parameters expressed in wall units, i.e. using the shear velocity $u_{\tau }$ as reference velocity. Based on the value of $Ri_{\tau }$, the flow was divided into a buoyancy-affected flow ( $Ri_{\tau }<30$, characterized by general turbulence attenuation), a buoyancy-controlled flow ( $30< Ri_{\tau }<45$, with the possibility of transient and local flow relaminarization) and a buoyancy-dominated flow ( $Ri_{\tau }>45$, with a complete flow relaminarization). Similar trends, showing the occurrence of local flow laminarization, were observed by Iida, Kasagi & Nagano (Reference Iida, Kasagi and Nagano2002) in their DNS of stratified channel turbulence at similar Reynolds and Richardson numbers ( $Re_{\tau }=150$, $Ri_{\tau }\leqslant 40$). As discussed by Armenio & Sarkar (Reference Armenio and Sarkar2002), such findings were, however, in contrast with the linear stability analysis of Gage & Reid (Reference Gage and Reid1968) that, compared with the results of Garg et al. (Reference Garg, Ferziger, Monismith and Koseff2000) and Iida et al. (Reference Iida, Kasagi and Nagano2002), predicted a complete flow laminarization to occur only at much higher values of $Ri_{\tau }$. A clearcut explanation of this inconsistency was given only later (Moestam & Davidson Reference Moestam and Davidson2005; García-Villalba & del Álamo Reference García-Villalba and del Álamo2011). In particular, performing DNS of stratified channel turbulence up to $Re_{\tau }=550$ and $Ri_{\tau }=960$, and employing large computational domains, García-Villalba & del Álamo (Reference García-Villalba and del Álamo2011) were able to show that the local flow laminarization at subcritical values of $Ri_{\tau }$ occurs when the computational domain is not large enough to contain the minimal flow unit required to sustain turbulence. In such an instance, laminar patches appear, increase in size and become as large as the entire computational domain, hence making a back transition to turbulence – which would be observed in larger computational domains – not possible.
All previous studies were particularly important since they demonstrated not only that the overall momentum and heat transfer rates are reduced for increasing stratification, but also that the structure of wall-bounded turbulence can be selectively modified. The current state of DNS research in the field of stably stratified channel turbulence is summarized in the  $(Re_{\tau },Ri_{\tau })$ phase space diagram shown in figure 1 (adapted from Zonta & Soldati Reference Zonta and Soldati2018). The black solid line represents the boundary ideally separating the laminar region (above the curve), from the turbulent one (below the curve). This curve, which has been obtained by best fit of the data reported in Gage & Reid (Reference Gage and Reid1968), should not be taken as a sharp boundary between two regimes, but more likely as a blurry transition region in which the flow is expected to (gradually) change behaviour from turbulent to laminar flow. There is indeed strong evidence that, when the marginal stability curve is approached, the flow becomes intermittent (stratification is so strong that laminar patches appear in the near wall region, although the mean flow is still able to sustain turbulence, see García-Villalba & del Álamo Reference García-Villalba and del Álamo2011; Brethouwer, Duguet & Schlatter Reference Brethouwer, Duguet and Schlatter2012). The symbols below the curve represent previous DNS (Iida et al. Reference Iida, Kasagi and Nagano2002; Moestam & Davidson Reference Moestam and Davidson2005; Yeo, Kim & Lee Reference Yeo, Kim and Lee2009; García-Villalba & del Álamo Reference García-Villalba and del Álamo2011; Zonta, Onorato & Soldati Reference Zonta, Onorato and Soldati2012b), which reach a maximum Reynolds number $Re_{\tau }=550$. Simulations at a larger Reynolds number were performed more recently by other authors (Deusebio, Caulfield & Taylor Reference Deusebio, Caulfield and Taylor2015; Williamson et al. Reference Williamson, Armfield, Kirkpatrick and Norris2015; He Reference He2016), but in different flow configurations (i.e. Couette flow or open channel). For weakly to moderate stratification, buoyancy-driven wave-like motions (internal gravity waves, IGWs) appear at the channel core and coexist with classical near-wall turbulence (see inset ‘Flow 1’ below the curve highlighting the presence of IGW via visualization of temperature contours on a longitudinal section of the channel). In this case, statistics still scale well in wall units. As already mentioned, when stratification is increased so as to approach the marginal stability curve, the situations is more complicated, since buoyancy is able to influence not only the flow region far from the boundary, but also the region close to it. This generally leads to the collapse of near-wall turbulence and to the corresponding appearance of laminar patches. For very strong stratification – stronger than the critical strength dictated by the marginal stability curve – the flow becomes laminar (see inset ‘Flow 2’ above the curve, showing a complete laminarization of the flow).
Comprehensive sketch of the  $( Re_{\tau}\unicode{x2013}Ri_{\tau } )$ diagram for stratified turbulence in closed channels (adapted from Zonta & Soldati Reference Zonta and Soldati2018). Circles represent the critical $Ri_{\tau,cr}$ (marginal stability curve) obtained from the linear stability analysis of Gage & Reid (Reference Gage and Reid1968), and properly rearranged to fit for the present parameter space. The proposed parametrization of the marginal stability curve (solid line) is: $\log (Ri_{\tau,cr})=m\times [\log(Re_{\tau } ) ]^{b}+n \times [\log ( Re_{\tau } ) -d]^{a} +c$, where the value of the parameters is $a=-0.1843$, $b=1.047$, $c=1.914$, $d=1.927$, $m=1.651$ and $n=-2.204$ (Zonta & Soldati Reference Zonta and Soldati2018). The symbols below the curve – in the range $0\leqslant Re_{\tau }\leqslant 550$ – represent previous DNS found in the literature (Iida et al. Reference Iida, Kasagi and Nagano2002; Moestam & Davidson Reference Moestam and Davidson2005; Yeo et al. Reference Yeo, Kim and Lee2009; García-Villalba & del Álamo Reference García-Villalba and del Álamo2011; Zonta et al. Reference Zonta, Onorato and Soldati2012b). The simulations performed in this work are indicated by the filled squares ( $\blacksquare$). The two insets, labelled Flow 1 and Flow 2, are used to visualize the typical flow structure (temperature contours) in the stratified-turbulence region (Flow 1) and in the strongly stratified laminar region (Flow 2).

With the final aim of assessing the current physical description and corresponding parametrizations of stratified wall-bounded turbulence at high Reynolds numbers, we perform a series of DNS of stably stratified channel flow at  $Re_{\tau }=1000$, i.e. well beyond the current state-of-the art limit of $Re_{\tau }=550$ (see figure 1), and for $0 \leqslant Ri_{\tau }=300$. Computations at high Reynolds number are crucial in this field, given the lack of indications that results obtained by low Reynolds number simulations can be upscaled to the scale of real phenomena, especially in environmental and large-scale industrial applications. The present study represents a first effort in this direction: the detailed dataset produced by the present computationally intensive simulations at high $Re_{\tau }$, can definitely help LES and Reynolds-averaged Navier–Stokes simulations to develop reliable subgrid-scale and turbulence closure models that properly account for buoyancy effects in realistic applications.
The paper is built as follows. In § 2 we describe the governing equations and the numerical method employed to run the simulations. In § 3, building on top of a detailed analysis of the flow-field structure and statistics, we characterize IGWs from a qualitative and quantitative viewpoint, we discuss the influence of stratification on the wall-normal transport of momentum and heat and we present possible parametrizations and scaling laws for the friction factor and for the Nusselt number. Conclusions are finally drawn in § 4.
2. Methodology
We consider a stably stratified-turbulent flow inside a horizontal straight channel. The origin of the coordinate system is located at the centre of the channel and the  $x$-,
$x$-,  $y$- and $z$-axes point in the streamwise, spanwise and wall-normal directions, respectively. A stable stratification in the wall-normal direction $z$ is maintained by keeping a positive temperature difference $\Delta T=T_t-T_b$ between the top (fixed temperature $T_t$) and the bottom (fixed temperature $T_b$) walls. At the same time, the flow is driven along the streamwise direction $x$ by an imposed mean pressure gradient. Conservation of mass, momentum and energy, written in dimensionless form and under the Oberbeck–Boussinesq approximation, is
 $$\begin{gather} \boldsymbol{\nabla} \boldsymbol{\cdot} \boldsymbol{u} = 0, \end{gather}$$
 $$\begin{gather}\frac{\partial \boldsymbol{u}}{\partial t} + (\boldsymbol{u}\boldsymbol{\cdot}\boldsymbol{\nabla}) \boldsymbol{u} ={-}\boldsymbol{\nabla} p' + \frac{1}{Re_{\tau}}\nabla^{2} \boldsymbol{u}+ Ri_{\tau} \theta \delta_{i,3}+\delta_{1,i}, \end{gather}$$
 $$\begin{gather}\frac{\partial \boldsymbol{\theta}}{\partial t} + (\boldsymbol{u}\boldsymbol{\cdot}\boldsymbol{\nabla}) {\theta} = \frac{1}{Re_{\tau}Pr}\nabla^{2} {\theta}, \end{gather}$$
where  $\boldsymbol {u}$ is the velocity vector, $p'$ is the fluctuating kinematic pressure, $\theta =(T-T_{ref})/(\Delta T/2)$ is temperature and $\delta _{1,i}$ is the mean pressure gradient that drives the flow in the streamwise direction only (note that $\delta _{i,j}=1$ if $i=j$, while $\delta _{i,j}=0$ if $i\ne j$). Equations (2.1)–(2.3) have been obtained using the half-channel height $h$ as reference length, the centreline temperature $T_{ref}=(T_t+T_b)/2$ as reference temperature and the shear velocity $u_{\tau }=\sqrt {\tau _w/\rho }$ as reference velocity – with $\tau _w$ the shear stress at the wall. Superscripts, which will be used throughout the paper to indicate dimensionless variables, are omitted in (2.1)–(2.3) for ease of notation. The three main parameters of the flow are the shear Reynolds number $Re_{\tau }=\rho u_{\tau }h/\mu$, the shear Richardson number $Ri_{\tau }=\beta (\Delta T/2) g h/u^{2}_{\tau }$ and the Prandtl number $Pr=\mu c_p/\lambda$. The acceleration due to gravity is g. Fluid density $\rho$, viscosity $\mu$, thermal conductivity $\lambda$, specific heat $c_p$ and thermal expansion coefficient $\beta$ are all evaluated at the reference temperature $T_{ref}$. Present simulations are run at fixed Reynolds and Prandtl number ( $Re_{\tau }=1000$ and $Pr=0.71$) but at different values of the Richardson number $Ri_{\tau }=50,100,200,300$. A reference simulation at $Ri_{\tau }=0$ (neutrally buoyant) is also performed. From a physical point of view, the simulation set-up can represent the flow of air inside a channel of height $2h\sim 1.5\ {\rm m}$ at a reference bulk Reynolds number $Re_b=\rho u_b h/\mu =2 \times 10^{4}$ and subject to a wall-to-wall temperature difference up to ${\approx }10\ {\rm K}$.
The initial conditions for the simulations have been prescribed following the strategy already used in previous investigations (Armenio & Sarkar Reference Armenio and Sarkar2002; García-Villalba & del Álamo Reference García-Villalba and del Álamo2011). First, we run the preliminary case of the turbulent channel flow at  $Re_\tau =1000$ and $Ri_{\tau }=0$ (temperature is a passive scalar), until we converge to a statistically steady state. Then, we use one of the last flow fields of the case at $Ri_{\tau }=0$ as initial condition for the simulation at $Ri_{\tau }=50$, which we run until convergence to a new statistically steady state. Similarly, we use one of the last flow fields of the simulation at $Ri_{\tau }=50$ as initial condition for simulation at $Ri_{\tau }=100$, and so on with the other cases. A comprehensive overview of the most important parameters of the simulations is provided in table 1. Note that the size of the computational domain and the spatial resolution, reported in table 1, have been chosen to fulfil the requirements imposed by the DNS. In particular, we explicitly compare the employed grid resolution with the minimum value of the Kolmogorov length scale (occurring at the wall) – computed as $\eta _k= ( \nu ^{3}/\epsilon )^{1/4}$, with $\epsilon$ the turbulent kinetic energy dissipation and $\nu =\mu /\rho$ the kinematic viscosity – with the grid spacing. Also listed in table 1 is the value of the key response parameters in stratified turbulence, the Nusselt number $Nu=2q_wh/(\lambda \Delta T)$, with $q_w$ the heat flux at the wall. A thorough discussion on the behaviour of $Nu$, and of other important macroscopic parameters, will be given in § 3.5.
Stably stratified channel turbulence at  $Re_{\tau }=1000$ and $Pr=0.71$: summary of the simulation parameters. For all simulations, the size of the computational domain is $4{\rm \pi} h \times 2{\rm \pi} h \times 2h$ along $x$,
$x$,  $y$ and $z$, respectively. The grid resolution, $\Delta x^{+}$, $\Delta y^{+}$ and $\Delta z^{+}$, is expressed in wall units. While the grid resolution is constant along $x$ and $y$, it does change in the wall-normal direction from a minimum value close to the wall ( $\Delta z_w^{+}$) to a maximum value at the channel centre ( $\Delta z_c^{+}$). The value of the Kolmogorov scale at the wall, $\eta ^{+}_{k,w}$, is also given.

The governing equations are discretized using a pseudo-spectral method based on transforming the field variables into wavenumber space, through Fourier representations for the periodic (homogeneous) directions  $x$ and $y$, and Chebyshev representation for the wall-normal (non-homogeneous) direction $z$. Periodicity along $x$ and $y$ is assumed for both velocity and temperature, while no-slip velocity and imposed-temperature conditions are assumed at the two walls. Time advancement is achieved using an implicit Crank–Nicolson scheme for the diffusive terms and an explicit Adams–Bashforth scheme for the convective/nonlinear terms. As customarily done in pseudo-spectral methods, convective/nonlinear terms are computed in physical space and then transformed to wavenumber space using a dealiasing procedure (2/3 rule). Further details on the numerical method can be found in Zonta, Marchioli & Soldati (Reference Zonta, Marchioli and Soldati2012a), Zonta et al. (Reference Zonta, Onorato and Soldati2012b) and Zonta & Soldati (Reference Zonta and Soldati2014).
3. Results
3.1. Qualitative behaviour of the flow structure
We look first at the qualitative structure of the flow, focusing in particular on the instantaneous temperature distribution  $\theta$ on a ( $y-z$) cross-section of the channel located at $x=L_x/2$. Results, which are shown in figure 2 for $Ri_{\tau }=0$ (panel a, neutrally buoyant case) and for $Ri_{\tau }=300$ (panel b, stably stratified case), will be conveniently discussed by keeping the neutrally buoyant case ( $Ri_{\tau }=0$, figure 2a) as reference. For $Ri_{\tau }=0$, temperature is a passive scalar and, as such, it is purely transported by velocity. Vortical structures rising from the boundaries are therefore free to travel over long distances, since they are only bounded by the physical constraint imposed by the walls. Under the action of these vortical structures, a fluid particle with a given temperature is brought to a region with a different temperature, where it thermalizes by diffusion (see figure 2a). This naturally gives a high degree of mixing. For $Ri_{\tau }=300$, the situation is different. While vortical structures are still dominating the near-wall region, their influence away from the boundary appears limited. The reason is that vortical structures are in this case subject to an additional vertical (i.e. in the wall-normal direction) constraint imposed by gravity, which reduces their range of influence to approximately half of the channel height (this is rather clear upon comparison of figure 2a,b). As a consequence, the channel results divided into a top, hot part, and a bottom, cold part (figure 2b). These two parts behave almost independently each other, and are separated by IGWs (streaky structure developing at the channel centre). The physics of IGWs is simple: because of the background density profile – with density decreasing with height – a fluid particle that is displaced in the wall-normal direction by velocity fluctuations is subject to a restoring buoyancy force that tends to bring it back to its initial position. The fluid particle trespasses its initial equilibrium position and overshoots inertially, giving rise to an oscillation that constitutes the essence of IGWs. We anticipate here, but it will become clear by looking at the fluid statistics in the next paragraphs, that IGWs appear inside a thermocline – i.e. a region where temperature changes much more than it does above and below it, hence representing a sort of thick interface that hinders the wall-normal transfer of momentum and heat. Due to their importance in the dynamics of stably stratified flows, IGWs have been analysed in detail in a number of previous studies (we refer the reader to Staquet & Sommeria (Reference Staquet and Sommeria2002), for a comprehensive review on the topic). IGWs will be further characterized from a more quantitative and qualitative viewpoint in § 3.4.
Contour maps of temperature,  $\theta$, on a $(y\unicode{x2013}z)$ cross-section located at $x=L_x/2$. (a) Refers to the neutrally buoyant case, $Ri_{\tau }=0$ and (b) refers to the stably stratified case at $Ri_{\tau }=300$.

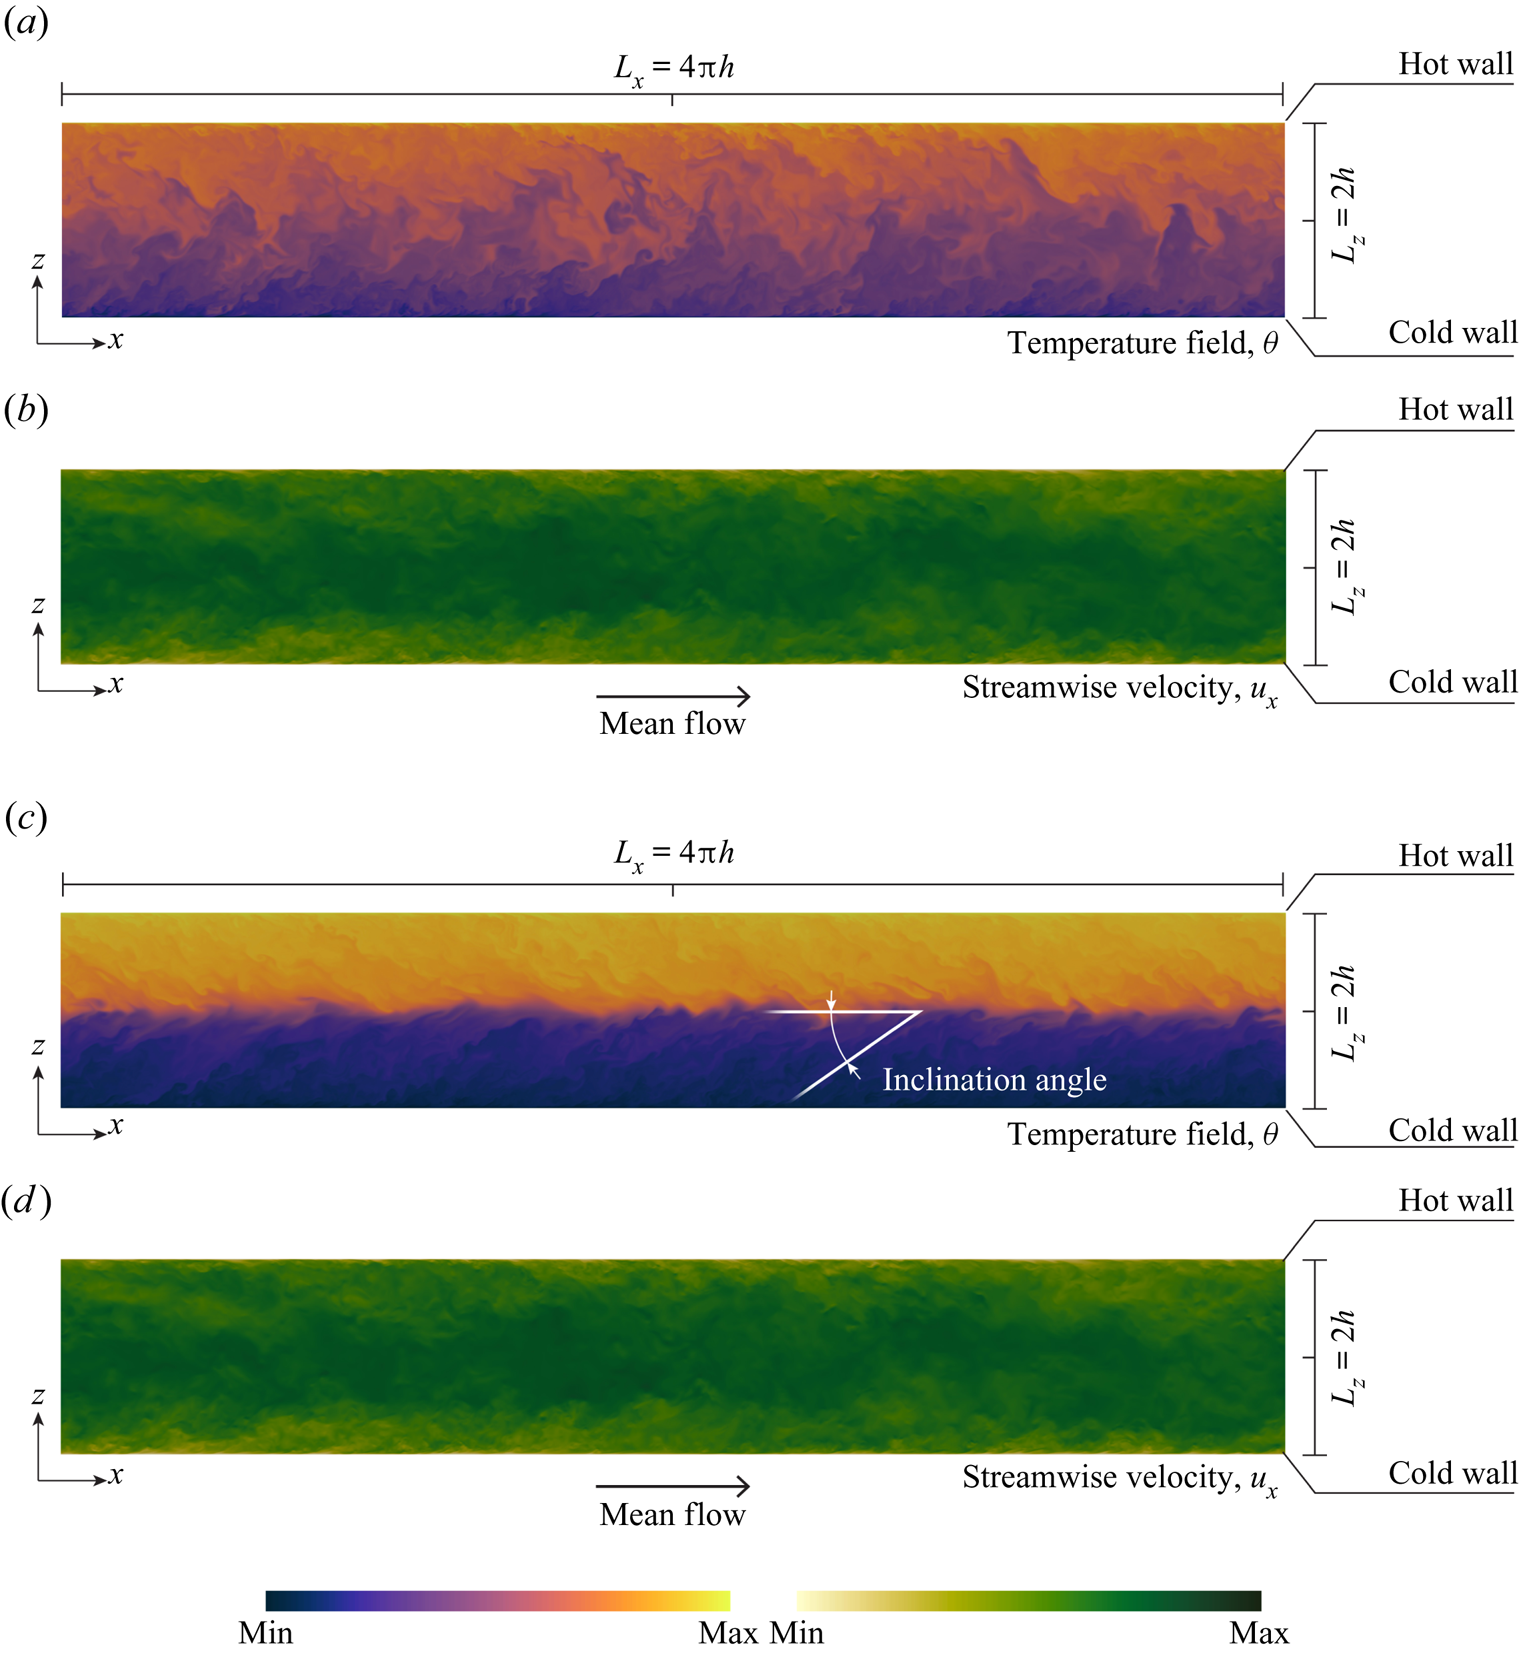
To appreciate the different flow structure induced by the stable stratification, we now turn our attention to the distribution of temperature  $\theta$ and axial velocity $u_x$ on a longitudinal $(x\unicode{x2013}z)$ plane located at $y=L_y/2$. Results are shown in figure 3: panel (a) and panel (b) refer to $Ri_{\tau }=0$ (temperature and axial velocity, respectively), while panel (c) and panel (d) refer to $Ri_{\tau }=300$ (temperature and axial velocity, respectively). The flow moves from left to right. As expected, for $Ri_{\tau }=0$, temperature (figure 3a) – which is a passive scalar – is efficiently mixed throughout the entire height of the channel by the dominant vortical structures. The flow (figure 3b) appears organized into taller vortices which are emitted from the wall and contain ensembles of smaller-scale vortices. The wall-normal extension of these taller vortices scales with the channel height ${\sim }2h$. For $Ri_{\tau }=300$, on the other hand, the situation is controlled by the presence of IGWs, which – as clearly visible in both the temperature and velocity maps – dominate the central region of the channel. The presence of these structures naturally modifies the entire dynamics of the flow, inducing an extra confinement to the wall-normal development of vortices, and reducing at the same time their capability of effectively mixing the flow. As a side observation, we note that the temperature field in the proximity of the channel centre appears stretched and tilted at an angle with respect to the horizontal direction. This is due to the presence of a strong vertical shear in that region.
Contour maps of temperature  $\theta$ (a,c) and streamwise velocity $u_x$ (b,d) on a $(x\unicode{x2013}z)$ longitudinal section located at $y=L_y/2$. (a,b) Refer to the neutrally buoyant case, $Ri_{\tau }=0$ and (c,d) refer to the stably stratified case at $Ri_{\tau }=300$. The temperature tilting induced by the vertical shear at the channel centre is also explicitly indicated (c).
3.2. Velocity and temperature statistics
We now characterize the flow from a statistical viewpoint. Unless differently stated, all results will be presented in wall units (denoted by superscript  $+$), obtained normalizing velocities by $u_{\tau }$, lengths by $l_{\tau }=\nu /u_{\tau }$, times by $t_{\tau }=\nu /u_{\tau }^{2}$ and temperatures by $\theta _{\tau }=q_w/u_{\tau }$. In figure 4 we show the behaviour of the mean streamwise velocity $\langle u_x^{+} \rangle$ as a function of the wall-normal coordinate, in linear (figure 4a) and semilog (figure 4b) scale. Brackets indicate time and space average over the homogeneous directions. Results are rendered according to the following colour code: blue (up-triangle) refers to the neutrally buoyant case ( $Ri_{\tau }=0$), yellow (down-triangle) refers to $Ri_{\tau }=50$, green (square) refers to $Ri_{\tau }=100$, purple (diamond) refers to $Ri_{\tau }=200$ and red (circle) refers to $Ri_{\tau }=300$. The law of the wall, $\langle u_x^{+} \rangle =z^{+}$, and $\langle u_x^{+} \rangle =(1/\kappa ) \log (z^{+})+5.5$, with $\kappa$ the von Kármán constant, is also shown in figure 4(b) by a solid line. As expected (see in particular figure 4b), in the neutrally buoyant case the mean velocity closely follows the law of the wall, since temperature is a passive scalar that does not influence the velocity field. In the stably stratified cases, we observe an increase of the mean axial velocity, which is particularly pronounced in the core part of the channel (see both figure 4a,b), as the shape of the velocity profile deviates significantly from the classical logarithmic behaviour and approaches a nearly laminar, parabolic shape (García-Villalba & del Álamo Reference García-Villalba and del Álamo2011). This tendency towards a laminarization in the core part of channel is due to the conversion of turbulent kinetic into potential energy, which occurs when a fluid particle moves in the wall-normal direction within the flow. Note also that, since the mean pressure gradient is kept constant among the different simulations, the mean wall stress remains constant, and so does the slope of the velocity at the wall, with all profiles collapsing onto that of the neutrally buoyant case ( $z^{+}/h^{+}<0.1$).
Mean fluid streamwise velocity  $\langle u^{+}_x \rangle$ as a function of the wall-normal direction, $z^{+}$, in linear (a) and semilog scale (b) for the different cases considered in the present study. Comparison between the reference case of unstratified turbulence ( $Ri_{\tau }=0$), and the stratified turbulence at $Ri_{\tau }=50$, $Ri_{\tau }=100$, $Ri_{\tau }=200$ and $Ri_{\tau }=300$ (filled symbols). The classical law of the wall $\langle u_x^{+} \rangle =z^{+}$ and $\langle u_x^{+} \rangle =(1/\kappa ) \log (z^{+})+5.5$, with $\kappa$ the von Kármán constant, is also shown for comparison in (b) (solid line).

As shown in figure 5, stratification modifies the behaviour of the mean temperature field  $\langle \theta \rangle$, which takes a layered structure formed by a near-wall layer ( $0< z^{+}/h^{+}<0.1$), a transition layer ( $0.1< z^{+}/h^{+}<0.8$) and a core layer ( $0.8< z^{+}/h^{+}<1$). Note that temperature in figure 5(a) is shown in outer units, i.e. not rescaled in wall units. Compared with the neutrally buoyant case, stratification reduces the mean temperature gradient in the near-wall layer (i.e. it reduces the Nusselt number), while at the same time increasing it in the core layer. This latter observation is of particular importance, since it indicates the tendency for turbulent stratified channel flows to develop a kind of thick interface – the thermocline – inside which the temperature changes more vigorously than it does immediately above and below. The thermocline, which forms right where the mean shear vanishes, constitutes a barrier for wall-normal momentum and heat transport. Reportedly (Ferziger, Koseff & Monismith Reference Ferziger, Koseff and Monismith2002; García-Villalba & del Álamo Reference García-Villalba and del Álamo2011; Zonta et al. Reference Zonta, Onorato and Soldati2012b; Zonta & Soldati Reference Zonta and Soldati2018), there is a strong connection between the presence of a thermocline and the presence of IGWs (which, as discussed in § 3.1, occur at the channel centre), in the sense that IGWs develop where a thermocline exists. Interestingly, the temperature gradient in the core region of the channel does not increase monotonically for increasing $Ri_\tau$: it first increases (going from $Ri_\tau =0$ to $Ri_\tau =100$), and then reduces (going from $Ri_\tau =100$ to $Ri_\tau =300$). We anticipate here, but we will come back to it later, that this non-monotonic trend of the temperature profile at the channel centre can be explained by looking at the intertwined behaviour of the turbulent (or buoyancy) and diffusive fluxes. In the transition layer, between the near-wall and the core layers, the temperature gradient remains small, as the flow is characterized by a higher degree of mixing. Not surprisingly, when rescaled in wall units, i.e. by keeping the friction temperature $\theta _\tau =q_w/(\rho c_p u_\tau )$ as reference, the mean temperature profile $\varTheta ^{+}=(\theta -\theta _w)/\theta _\tau$ recovers a monotonic behaviour (figure 5b). This is particularly visible in the inset of figure 5(b), where a close-up view of the mean temperature profile in the core region of the channel is given. Note also that, for the neutrally buoyant case, and similarly to what happens for the streamwise velocity $\langle u^{+}_x \rangle$, the behaviour of $\varTheta ^{+}$ can be parameterized by $\varTheta ^{+}=Pr \cdot z^{+}$, in the boundary layer, and by $\varTheta ^{+}=2.3 \log (z^{+})+3.11$, in the core region (see Alcántara-Ávila et al. Reference Alcántara-Ávila, Hoyas and Jezabel Pérez-Quiles2021).
Mean fluid temperature  $\langle \theta \rangle$ in linear (a) and log (b) scale as a function of the wall-normal distance expressed in wall units, $z^{+}$. Comparison between the reference case of unstratified turbulence ( $Ri_{\tau }=0$), and the stratified turbulence at $Ri_{\tau }=50$, $Ri_{\tau }=100$, $Ri_{\tau }=200$ and $Ri_{\tau }=300$ (filled symbols). The correlation $\langle \varTheta ^{+} \rangle =Pr \cdot z^{+}$ and $\langle \varTheta ^{+} \rangle =(1/\kappa ) \log (z^{+})+B_{\theta }$, with coefficients $\kappa _{\theta }=0.436$ and $B_{\theta }=3.11$ taken from Alcántara-Ávila, Hoyas & Jezabel Pérez-Quiles (Reference Alcántara-Ávila, Hoyas and Jezabel Pérez-Quiles2021), is also shown for comparison (solid line, b). A close-up view of the mean temperature in the core region of the channel is offered in (b) for clarity.

To evaluate the influence of stratification on turbulence, we now look at the root mean square of the streamwise  $\langle u'^{+}_{x,rms}\rangle$, spanwise $\langle u'^{+}_{y,rms}\rangle$ and wall-normal $\langle u'^{+}_{z,rms}\rangle$ velocity fluctuations, and at the root mean square of temperature fluctuations $\langle \varTheta '^{+}_{rms}\rangle$. Results, which are presented in figure 6, clearly show that all velocity and temperature fluctuations are essentially unaffected by stratification in the near-wall region ( $z^{+}/h^{+} < 0.1$), where they recover the behaviour of canonical near-wall turbulence. Farther from the wall, in the region $0.3< z^{+}/h^{+}< 0.8$, $\langle u'^{+}_{x,rms}\rangle$ decreases first and increases later compared with the neutrally buoyant case, while the opposite behaviour – increasing first and decreasing later – is observed for $\langle u'^{+}_{z,rms}\rangle$. Note that the cross-over between the profiles of stratified and neutrally buoyant turbulence occurs around $z^{+}/h^{+}\simeq 0.5$, and is somehow influenced by $Ri_{\tau }$. In contrast, $\langle u'^{+}_{y,rms}\rangle$ is characterized by a clear increase that – provided $Ri_{\tau }>0$ – seems independent of the value of $Ri_{\tau }$. This behaviour, and in particular the increase of $\langle u'^{+}_{x,rms}\rangle$ and $\langle u'^{+}_{y,rms}\rangle$, is associated with the increase of velocity gradient (see also figure 7(a) and the discussion therein) in that region, which enhances turbulence production, while the corresponding decrease of $\langle u'^{+}_{z,rms}\rangle$ is due to the conversion of turbulent kinetic energy (in the vertical direction) into potential energy. In the core region of the channel, $z^{+}/h^{+}>0.8$, $\langle u'^{+}_{x,rms}\rangle$ strongly decreases while $\langle u'^{+}_{z,rms}\rangle$ develops a peak that is not visible in neutrally buoyant turbulence and is due to the presence of IGWs. Correspondingly, a marked peak at the channel centre is also observed for the temperature fluctuations, figure 6(d). Note that, for $\langle \varTheta '^{+}_{rms}\rangle$, there is a clear cross-over between the different cases of stratified turbulence: for increasing $Ri_{\tau }$, temperature fluctuations tend to increase in the transition layer, $0.1< z^{+}/h^{+}<0.8$, and decrease in the core layer $0.8< z^{+}/h^{+}<1$ (although they remain much larger than the neutrally buoyant case). To summarize, previous observations indicate that the structure of turbulence is not influenced near the wall, since velocity fluctuations, and also the ratio between the wall-normal and the streamwise velocity fluctuations, $\langle u'^{+}_{z,rms}\rangle /\langle u'^{+}_{x,rms}\rangle$, remains almost constant among the different cases. At the same time, in the buffer region there is a decrease of $\langle u'^{+}_{z,rms}\rangle /\langle u'^{+}_{x,rms}\rangle$, which indicates that stratification hinders the energy transfer from the streamwise to the wall-normal component. Then, at the channel centre, velocity and temperature fluctuations are essentially induced by IGWs.
Wall-normal behaviour of the root mean square of the velocity fluctuations in the streamwise direction ( $\langle u'^{+}_{x,rms} \rangle$, panel a), in the spanwise direction ( $\langle u'^{+}_{y,rms} \rangle$, panel b) and in the wall-normal direction ( $\langle u'^{+}_{z,rms} \rangle$, panel c). The wall-normal behaviour of the temperature fluctuations is also shown ( $\langle \varTheta '^{+}_{rms} \rangle$, panel d). Comparison between the reference case of unstratified turbulence ( $Ri_{\tau }=0$), and the stratified turbulence at $Ri_{\tau }=50$, $Ri_{\tau }=100$, $Ri_{\tau }=200$ and $Ri_{\tau }=300$ (filled symbols).

(a) Wall-normal behaviour of the viscous shear stress,  $\tau ^{v}_{xy}=\partial \langle u^{+}_x\rangle / \partial z^{+}$ and turbulent shear stress, $\tau ^{t}_{xy}=\langle u'^{+}_x u'^{+}_z\rangle$. The linear behaviour of the total shear stress, $\tau _{tot}/(\rho u_{\tau }^{2})$ is also shown by the black solid line. Comparison between the reference case of unstratified turbulence ( $Ri_{\tau }=0$), and the cases of stratified turbulence at $Ri_{\tau }=50$, $Ri_{\tau }=100$, $Ri_{\tau }=200$ and $Ri_{\tau }=300$ (filled symbols). (b) Wall-normal behaviour of the diffusive heat flux, $q_{d}=Pr^{-1} \partial \langle \varTheta ^{+} \rangle / \partial z^{+}$ and turbulent heat flux (buoyancy flux), $q_t= \langle u'^{+}_z \varTheta '^{+} \rangle$. Comparison between the reference case of unstratified turbulence ( $Ri_{\tau }=0$), and the cases of stratified turbulence at $Ri_{\tau }=50$, $Ri_{\tau }=100$, $Ri_{\tau }=200$ and $Ri_{\tau }=300$ (filled symbols).

3.3. Momentum and heat fluxes
We focus here on the wall-normal behaviour of momentum and heat fluxes, two key quantities in turbulent transport phenomena. The momentum flux can be obtained from the Reynolds-averaged streamwise momentum equation as
 \begin{equation} \tau_{tot}=1-\dfrac{2z^{+}}{Re_{\tau}}=\underbrace{\dfrac{\partial \langle u^{+}_x \rangle}{\partial z^{+}}}_{\tau^{v}_{xz}}+\underbrace{\langle u'^{+}_x u'^{+}_z\rangle}_{\tau^{t}_{xz}}, \end{equation}
where the turbulent  $(\tau ^{t}_{xy})$ and viscous $(\tau ^{v}_{xy} )$ counterparts to the overall stress are explicitly indicated. The behaviour of $\tau ^{t}_{xy}$ and $\tau ^{v}_{xy}$ (symbols) is shown in figure 7(a), together with the behaviour of $\tau _{tot}$ (solid black line). Increasing $Ri_{\tau }$, we note a general reduction of $\tau ^{t}_{xy}$, in particular in the core region, where $\langle u'^{+}_x u'^{+}_z\rangle \simeq 0$ for $Ri_{\tau }\geqslant 200$. Accordingly, a corresponding increase of $\tau ^{v}_{xy}$ – and hence of the velocity gradient $\partial u_x/\partial z$ – is observed, so that the overall linear behaviour of the total shear stress is recovered (3.1). This is clearly visualized in the inset of figure 7(a), where a close-up view of the behaviour of $\tau ^{t}_{xy}$ and $\tau ^{v}_{xy}$ at the channel centre, $0.8< z^{+}/h^{+}<1$, is given. In view of the present results, it is clear that the velocity increase observed at the channel centre (see figure 4) is due to the reduction of turbulent momentum flux in the wall-normal direction (i.e. reduction of $u'_x u'_z$), and to the corresponding increase of the relative importance of $\tau ^{v}_{xy}$ therein (Armenio & Sarkar Reference Armenio and Sarkar2002; Yeo et al. Reference Yeo, Kim and Lee2009).
Linked to the previous analysis of the wall-normal momentum flux, we now consider the wall-normal heat flux, whose behaviour can be obtained from the Reynolds-averaged energy balance equation as
 \begin{equation} \langle u'_z \theta' \rangle - \alpha \frac{\partial \langle \theta \rangle}{\partial z}={-}\alpha \left[ \frac{\partial \langle \theta \rangle }{\partial z}\right]_w=q_w, \end{equation}
where  $\alpha =\nu /Pr$ is the thermal diffusivity. Normalizing (3.2) by $q_w=-\alpha [{\partial \theta }/{\partial z}]_w$, and recalling that $q_w=\theta _{\tau } u_{\tau }$, we finally obtain (Armenio & Sarkar Reference Armenio and Sarkar2002; García-Villalba & del Álamo Reference García-Villalba and del Álamo2011)
 \begin{equation} \frac{ \langle u'_z \theta' \rangle }{q_w} - \frac{\alpha \dfrac{\partial \theta}{\partial z}}{q_w}=\underbrace{ \langle u'^{+}_z \varTheta'^{+} \rangle }_{{q_t}}- \underbrace{ \frac{1}{Pr} \frac{\partial \langle \varTheta^{+}\rangle}{\partial z^{+}}}_{{q_d}}=1. \end{equation}
The two terms  $q_t$ and $q_d$, explicitly indicated in (3.3), represent the turbulent (usually referred to as buoyancy flux) and the diffusive counterparts to the total heat flux, and their behaviour is shown in figure 7(b). By looking at the profile of $q_t$, it is apparent that, while moving away from the wall – and no matter the value of $Ri_{\tau }$ – $q_t$ increases sharply until it reaches a maximum value of approximately $q_t\simeq 0.95$ around $z^{+}/h^{+}\simeq 0.1$. In neutrally buoyant conditions, this peak value is kept almost unaltered throughout the entire channel, clearly corresponding to the constant flux hypothesis customarily assumed in neutral boundary layers (Tennekes & Lumley Reference Tennekes and Lumley1972; Ortiz-Suslow et al. Reference Ortiz-Suslow, Kalogiros, Yamaguchi and Wang2021). At larger $Ri_{\tau }$, we observe a significant decrease of $q_t$ in the core region of the channel. This decrease is so important that, for $Ri_{\tau }>200$, $q_t\simeq 0$. Interestingly, and in agreement with previous observations (Ohya et al. Reference Ohya, Neff and Meroney1997; García-Villalba & del Álamo Reference García-Villalba and del Álamo2011), we cannot find evidence of the speculated mean counter-gradient flux (or, in other words, negative $q_t$) at the centre of the channel (Komori et al. Reference Komori, Ueda, Ogino and Mizushina1983; Armenio & Sarkar Reference Armenio and Sarkar2002).
We further observe that previous studies discussing the possibility of a mean counter-gradient flux considered low- $Re_{\tau }$ flows. Here, we focus on flows at much higher $Re_{\tau }$, for which the energy containing boundary layer structures cannot reach very far from the wall. Since we may assume that the mean counter-gradient flux is the outcome of a number of local counter-gradient events (uncorrelated thermal and flow structures) driven by the interaction between near-wall structures and IGW, it is unlikely that a mean counter-gradient flux can be observed at high $Re_{\tau }$. However, we cannot exclude the presence of a mean counter-gradient flux in strongly stratified conditions, when the flow becomes largely inhomogeneous and intermittent. Between the near-wall and the core regions of the channel there is a region in which $q_t$ remains almost constant and close to unity for all cases considered here, with only a slight decrease for increasing $Ri_{\tau }$. The diffusive heat flux $q_d$ has a mirror-like behaviour compared with $q_t$, since the total heat flux is constant across the channel (see (3.3)): $q_d$ decreases sharply while moving away from the wall and it subsequently increases – with the only exception of $Ri_{\tau }=0$, for which it remains uniform and very low – in the core region of the channel. This trend of $q_d$ is important to explain the non-monotonic behaviour of the temperature profile observed in figure 5 ( $q_d$ is, by definition, proportional to the mean temperature gradient). Note indeed that the mean temperature gradient along the wall-normal direction can be conveniently expressed as (Armenio & Sarkar Reference Armenio and Sarkar2002)
 \begin{equation} \frac{\partial \langle \theta \rangle}{\partial z}=\left[\frac{\partial \langle \theta \rangle}{\partial z}\right ]_w \left[ 1-\frac{\langle u'_z \theta' \rangle}{u_{\tau}\theta_{\tau}} \right], \end{equation}
where  $[\partial \langle \theta \rangle /\partial z ]_w$ is the dimensionless mean temperature gradient at the wall, i.e. the Nusselt number. Equation (3.4), together with the observation that the buoyancy flux $q_t=\langle u'_z \theta '\rangle /u_{\tau }\theta _{\tau }= \langle u_z'^{+} \varTheta '^{+} \rangle$ becomes almost zero for $Ri_\tau >200$ (see figure 7b), indicates that for large stratification the temperature gradient at the channel centre perfectly matches the temperature gradient at the wall. Since the temperature gradient at the wall (i.e. the Nusselt number) decreases for increasing $Ri_{\tau }$, the same does the temperature gradient at the channel centre (but only once $Ri_{\tau }$ is large enough for $q_t$ to be approximately zero). To summarize, the temperature gradient at the channel centre initially increases for increasing stratification, until the stratification becomes so strong to completely damp the turbulent heat transfer (buoyancy flux), i.e. $q_{t}=\langle u'^{+}_z \varTheta '^{+} \rangle \simeq 0$, at the channel centre. When it happens, the temperature gradient at the channel centre – which becomes equal to the temperature gradient at the wall (Nusselt number) – decreases for increasing $Ri_{\tau }$.
Despite the large fluctuations of temperature and wall-normal velocity observed around the channel centre for increasing  $Ri_{\tau }$ (figure 6c,d), the buoyancy flux $\langle u'^{+}_z \varTheta '^{+} \rangle$ reduces remarkably down to the point at which, for $Ri_{\tau }\geqslant 200$, it completely vanishes. To understand the reason behind this behaviour, we focus on the distribution of temperature, $\varTheta '^{+}$, and wall-normal velocity fluctuations, $u'^{+}_z$, on a wall-parallel plane $(x\unicode{x2013}y)$ located at the channel centre. This is shown in figure 8 for $Ri_{\tau }=0$ and $Ri_{\tau }=300$. While for $Ri_{\tau }=0$ (figure 8a,b), the picture displays the typical features of fully developed turbulence, with spots of positive and negative temperature and wall-normal velocity randomly distributed over the considered plane, for $Ri_{\tau }=300$ (figure 8c,d) the situation is different, and there seems to be a connection between $\varTheta '^{+}$ and $u'^{+}_z$, which are both organized into stripes extending along the spanwise direction $y$. However, stripes of $u'^{+}_z$ appear to lag behind those of $\varTheta '^{+}$. The phase lag between $u_z'^{+}$ and $\varTheta '^{+}$ distributions can be estimated by looking at the coherency spectrum
 \begin{equation} C_{u'^{+}_z,\varTheta'^{+}}(\kappa_w)=\int_{-\infty}^{\infty} {R_{u'^{+}_z,\varTheta'^{+}}(s) \exp \left({-}2{\rm \pi} j s \kappa_w \right) \mbox{d} s }, \end{equation}
with  $\kappa _w=kh$ the dimensionless wavenumber and $R_{u'^{+}_z,\varTheta '^{+}}$ the correlation coefficient between $u'^{+}_z$ and $\varTheta '^{+}$. In particular, it is intriguing to focus on the phase of $C_{u'^{+}_z,\varTheta '^{+}}(\kappa _w)$. As shown in figure 8( f), we clearly notice that, for $Ri_{\tau }=300$, $u'^{+}_z$ and $\varTheta '^{+}$ are shifted by ${\rm \pi} /2$ (see Iida et al. Reference Iida, Kasagi and Nagano2002). Such a phase delay is instead not observed at $Ri_{\tau }=0$ (see figure 8e). It is important to note that the presence of this phase shift explains why, although temperature and wall-normal fluctuations are both very large at the channel centre, their correlation – that is, the buoyancy flux $\langle u'^{+}_z \varTheta '^{+} \rangle$ – is almost zero: where $\varTheta '^{+}$ is maximum in magnitude, $u'^{+}_z \simeq 0$ and vice versa, consistently with the presence of a wavy motion (IGW).
Temperature and velocity fluctuations on a wall-parallel  $(x\unicode{x2013}y)$ plane located at the channel centre for $Ri_{\tau }=0$ (a,b) and for $Ri_{\tau }=300$ (c,d). Phase of the cross-spectrum, $\phi (C_{u'^{+}_z, \varTheta '^{+}} )$, as a function of the wavenumber $\kappa _w=kh$ for $Ri_{\tau }=0$ (e) and for $Ri_{\tau }=300$ ( f).

Not only the average value of the buoyancy flux  $q_t$ is important, but also its distribution in space and time. To understand it, we focus on the two limiting cases $Ri_{\tau }=0$ and $Ri_{\tau }=300$ and we look at the behaviour of $q_t$ on a wall-parallel plane $(x\unicode{x2013}y)$ located at the channel centre (figure 9a,b), and normalized by the corresponding maximum value $q_{t,max}$ observed on that plane. Then, we compute the probability density function $\varPi (q_t/q_{t,max})$ (figure 9c). For $Ri_{\tau }=0$ (blue line in figure 9c), $\varPi (q_t/q_{t,max})$ is highly asymmetric, with the most probable value occurring for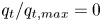 $q_t/q_{t,max}=0$ and with larger positive fluctuations compared with negative ones. This suggests that, although the mean temperature difference between the walls induces a net positive wall-normal energy flux (i.e. the mean value $\langle u'^{+}_z \varTheta '^{+} \rangle > 0$), $u'^{+}_z \varTheta '^{+}$ can often be negative, indicating the presence of regions characterized by local counter-gradient heat fluxes. The occurrence of localized counter-gradient heat fluxes is an extremely important phenomenon that has been observed also in other situations (Huisman et al. Reference Huisman, van Gils, Grossmann, Sun and Lohse2012; Zonta & Chibbaro Reference Zonta and Chibbaro2016; Hadi Sichani et al. Reference Hadi Sichani, Marchioli, Zonta and Soldati2020). From a physical point of view, small positive and negative values of $\varTheta '^{+} u'^{+}_z$ are due to turbulence, which is characterized by uncorrelated velocity and temperature fluctuations. These small positive and negative values of $\varTheta '^{+} u'^{+}_z$, which are equally likely events, balance each other and do not contribute to the net heat transport (Shang, Tong & Xia Reference Shang, Tong and Xia2005). Only large velocity and temperature fluctuations produced by larger coherent structures are correlated and contribute to the net heat flux. And clearly, large positive fluctuations are larger than negative ones, so to produce a positive net heat flux.
Contour map of the turbulent heat flux  $q_t=\langle \varTheta ^{+} u'^{+}_z\rangle$ on a wall-parallel $(x\unicode{x2013}y)$ plane located at the channel centre for $Ri_{\tau }=0$ (a), for $Ri_{\tau }=300$ (b) and corresponding probability density function $\varPi (q_t/q_{t, max})$ (c).

The asymmetry of  $\varPi (q_t/q_{t,max})$ is almost completely absent at $Ri_{\tau }=300$. In particular, while the probability of observing positive fluctuations is globally reduced (i.e. there is a reduction of large correlated velocity and temperature fluctuations), negative fluctuations are rather persistent, so that the average value of $q_t/q_{t,max}$ is close to zero. This is nicely rendered by the contour maps of $q_t/q_{t,max}$ shown in figure 9(b): while most of the plane is characterized by a correlation $q_t/q_{t,max}\approx 0$ (and corresponding to the most probable value of $\varPi (q_t/q_{t, max})$ in figure 9), small and rare patches of large positive $q_t/q_{t,max}$ coexist with small and rare patches of large negative $q_t/q_{t,max}$.
3.4. Internal gravity waves
In the previous chapter, we described IGWs on a qualitative basis (see in particular figures 2–3 and comments therein). To characterize such structures on a more quantitative basis, we introduce here the buoyancy frequency  $N$ (or Brunt–Väisälä frequency), which represents the frequency of oscillation – in a stratified medium – of a lump of fluid that is displaced by velocity fluctuations in the wall-normal direction. In dimensionless form, it is defined as
 \begin{equation} {\mathcal{N}} =N h / u_{\tau}= \sqrt{- g \beta \frac{\partial \langle \theta \rangle}{\partial z}}\frac{h}{u_{\tau}}, \end{equation}
and can naturally be used to evaluate the characteristic frequency of oscillation of IGWs. The behaviour of  ${\mathcal {N}}$ as a function of the wall-normal distance is shown in figure 10(a) for the different values of $Ri_{\tau }$. We observe that ${\mathcal {N}}$ is large at the centre of the channel – and peaks at the centreline – due to the sharpening of the mean temperature profile therein (figure 5), while it is rather small in the remaining part of the channel. Note that the behaviour of ${\mathcal {N}}$ in the proximity of the wall – shaded area in figure 10(b) – is not particularly important for the present discussion, since the temperature gradient in that region is mostly influenced by the presence of the boundary rather than by buoyancy. In the framework of the present discussion, it is interesting to look at the time-averaged premultiplied streamwise energy spectra of wall-normal velocity fluctuations, $k_x E_{u'^{2}_z} (k_x)$, at the channel centreline (Iida et al. Reference Iida, Kasagi and Nagano2002; Yeo et al. Reference Yeo, Kim and Lee2009; Zonta et al. Reference Zonta, Onorato and Soldati2012b). Results are presented in figure 10(b) for the different values of $Ri_{\tau }$. We consider in particular the case $Ri_{\tau }=300$, for which stratification is more important. We note that $k_x E_{u'^{2}_z} (k_x)$ develops a peak – which is not observed for $Ri_{\tau }=0$ – at the dimensionless wavenumber $\hat {k}_x=k_{x} h \approx 5$ (where $k_{x}$ is the wavenumber in dimensional form). We can hypothesize that this peak is due to the presence of IGWs, which induce vertical velocity fluctuations at the frequency ${\mathcal {N}}$ (Zonta et al. Reference Zonta, Onorato and Soldati2012b). To demonstrate this relationship, we assume that IGWs move in the streamwise direction with the mean centreline velocity, $u_{IGW}$. For $Ri_{\tau }=300$, $u^{+}_{IGW} \simeq 47$ (or, in dimensional form, $u_{IGW} = u_{\tau } u^{+}_{IGW} \simeq 1 \ {\rm m}\ {\rm s}^{-1}$). The corresponding frequency of such waves is $\omega _{IGW} = u_{IGW} \times k_{x} / 2 {\rm \pi}\simeq 1 \ {\rm s}^{-1}$. Considering now the value of the buoyancy frequency at the channel centreline, we get ${\mathcal {N}}\simeq 38$ or, in dimensional form, $N = {\mathcal {N}} u_{\tau } / h \simeq 1 \ {\rm s}^{-1}$, in close agreement with the previous estimate. Also shown in figure 10(a) is the range of frequency peaks, which correlates well with the range of wavenumber peaks shown in figure 10(b). The previous estimate is based on an oversimplified scenario, in which IGWs are monochromatic waves that travel at the advection velocity and are characterized by the frequency $N$. However, it is known (Staquet & Sommeria Reference Staquet and Sommeria2002) that the frequency of IGWs obeys the dispersion relation
 \begin{equation} \omega={\pm} N \cos \phi={\pm} N \frac{\sqrt{k_x^{2}+k_y^{2}}}{\sqrt{k_x^{2}+k_y^{2}+k_z^{2}}}, \end{equation}
in which the wave vector  $\boldsymbol {k}=(k_x,k_y,k_z)$ is not necessarily directed along $x$, and can have an angle $\phi$ to the horizontal plane. From (3.7), it clearly emerges that IGWs are characterized by frequencies in the range $0< \omega \leqslant N$. In addition, due to the advection velocity $u_{IGW}$ at the channel centre, the observed wave frequency is modified by the Doppler shift, which takes the form $\omega _{DS}=u_{IGW} \hat {k}_x$. Therefore, the frequency of IGWs can be expressed by the relation
 \begin{equation} \omega=\omega_{DS}\pm N \cos \phi = u_{IGW} \hat{k}_x \pm N \cos \phi. \end{equation}
From (3.8), and under the assumption of  $\cos \phi =1$, it emerges that the observed peak wavenumber $\hat {k}_x$ in figure 10(b) corresponds to the Doppler shift $u_{IGW} \hat {k}_x=N$. This result seems consistent with the recent analysis of Maffioli, Delache & Godeferd (Reference Maffioli, Delache and Godeferd2020), in which – employing spatio-temporal analysis of an unbounded stratified flow – it was shown that the dominant contributions to the wave energy in stratified turbulence come from frequencies close to $N$.
$N$.
(a) Wall-normal behaviour of the mean Brunt–Väisälä frequency  $N$ for the different cases of stratified turbulence ( $Ri_{\tau }=50$, $Ri_{\tau }=100$, $Ri_{\tau }=200$ and $Ri_{\tau }=300$). (b) Time-averaged premultiplied streamwise energy spectra of wall-normal velocity fluctuations $k_xE(u'_z u'_z)$ evaluated on a wall-parallel $(x\unicode{x2013}y)$ plane located at the channel centre.

Using the buoyancy frequency  $N$, we can calculate the gradient Richardson number as
 \begin{equation} Ri_g = \frac{N^{2}}{S^{2}} = \frac{- g \beta \dfrac{\partial \langle \theta \rangle}{\partial z}}{\left( \dfrac{\partial \langle u_{x} \rangle}{\partial z} \right)^{2}}, \end{equation}
where  $S$ is the mean shear rate. The gradient Richardson number is a measure of the relative importance of the buoyant consumption of turbulence, $N^{2}$, compared with the shear production of turbulence, $S^{2}$. In the literature (Miles Reference Miles1961; Rohr et al. Reference Rohr, Itsweire, Helland and Van Atta1988; Holt, Koseff & Ferziger Reference Holt, Koseff and Ferziger1992; Piccirillo & Van Atta Reference Piccirillo and Van Atta1997), $Ri_g \simeq 0.25$ has been identified as a critical threshold to evaluate the flow structure in unbounded stratified flows, where $Ri_g$ is uniform in space. For $Ri_g \simeq 0.25$, turbulence does not grow or decay. At larger $Ri_g$, turbulence decays, while at smaller $Ri_g$ turbulence grows. Naturally, in wall-bounded flows, $Ri_{g}$ varies in the wall-normal direction from small values close to the wall, to large values close to the centre of the channel. This is represented in figure 11, where we plot $Ri_{g}$ in logarithmic scale as a function of the dimensionless wall-normal distance, for different $Ri_{\tau }$. Current results are in good agreement with previous observations (Armenio & Sarkar Reference Armenio and Sarkar2002; Taylor, Sarkar & Armenio Reference Taylor, Sarkar and Armenio2005; García-Villalba & del Álamo Reference García-Villalba and del Álamo2011; Zonta et al. Reference Zonta, Onorato and Soldati2012b), showing in particular the sharp increase of $Ri_g$ around $Ri_g \simeq 0.2$. This sharp increase, which occurs at the channel centre (where $\partial \langle \theta \rangle / \partial z$ is large while $\partial \langle u_x \rangle / \partial z \rightarrow 0$) identifies the region of the channel in which buoyant consumption of turbulence dominates over shear production of turbulence, and sets the boundaries where IGWs are observed ( $z^{+}/h^{+}>0.8$). Based on the previous observations, it seems reasonable to set the value $Ri_g=0.2$ as the critical threshold above which turbulence is significantly damped by buoyancy in wall-bounded stratified turbulence.
Wall-normal behaviour of the gradient Richardson number  $Ri_g$ (a) and of the turbulent Prandtl number $Pr_t$ (b) for the different values of $Ri_{\tau }$. The threshold value $Ri_g=0.2$ is also explicitly shown in panel (a) (dashed line).

A further crucial aspect of stratified turbulence is the evaluation of irreversible mixing of momentum and energy (Fernando Reference Fernando1991; Ivey, Winters & Koseff Reference Ivey, Winters and Koseff2008). A common approach to evaluating mixing in stratified turbulence is to rely on the concept of turbulent eddy viscosity,  ${\mathcal {K}}_m$, and diffusivity, ${\mathcal {K}}_\theta$, which are defined as (Pope Reference Pope2000)
 \begin{equation} {\mathcal{K}}_m = \frac{\langle u^{\prime} w^{\prime} \rangle} {\dfrac{\partial \langle u \rangle}{\partial z}},\quad {\mathcal{K}}_{\theta} = \frac{\langle \theta^{\prime} w^{\prime} \rangle} {\dfrac{ \partial \langle \theta \rangle}{\partial z}}. \end{equation}
The ratio between  ${\mathcal {K}}_m$ and ${\mathcal {K}}_\theta$ is usually referred to as turbulent Prandtl number (Launder & Spalding Reference Launder and Spalding1972), and can be written in dimensionless form as
 \begin{equation} Pr_T = \frac{\langle u^{\prime} w^{\prime} \rangle \dfrac{\partial \langle \theta \rangle}{\partial z}}{\langle w^{\prime} \theta^{\prime} \rangle \dfrac{\partial \langle u \rangle}{\partial z}}. \end{equation}
The evaluation of  $Pr_T$ as a function of the distance from the wall and for different stratification levels (i.e. different $Ri_\tau$), is a major aspect in the field of turbulence modelling (Grachev et al. Reference Grachev, Andreas, Fairall, Guest and Persson2007; Venayagamoorthy & Stretch Reference Venayagamoorthy and Stretch2010). In figure 11(b) we plot $Pr_T$ as a function of $z^{+}/h^{+}$. Near the boundary, and regardless of $Ri_\tau$, we observe that $Pr_T \simeq 1$. Above $z^{+}/h^{+} \simeq 0.2$, there is slight dependence of $Pr_T$ on $Ri_\tau$, but $Pr_T$ remains bounded in the range $0.8< Pr_T<1.2$. At the channel centre, where stratification effects are stronger, the behaviour of $Pr_T$ does not have a clear trend for increasing $Ri_\tau$, although $Pr_T$ does not depart much from unity. We therefore conclude that the assumption $Pr_{T} \approx 1$, customarily taken in turbulence modelling (Laskowski et al. Reference Laskowski, Kearney, Evans and Greif2007; Zonta Reference Zonta2013), seems a reasonable choice for mild to moderate stratification levels.
3.5. Macroscopic characterization of the flow:  $Ri_b$, $C_f$, $Nu$


Although the shear Richardson number  $Ri_{\tau }$ is customarily used to characterize the flow in numerical simulations of wall-bounded stratified turbulence (Zonta & Soldati Reference Zonta and Soldati2018), its use in experiments/field measurements is much more limited. The reason is the difficult experimental evaluation of the shear velocity, which in turn requires the measurement of the shear stress at the wall. As a consequence, in many experiments the bulk Richardson number $Ri_b=\beta (\Delta T/2) g h/(2u^{2}_{b})$ is usually preferred, since the bulk velocity $u_b$ is an easily accessible quantity. To draw a link between simulations and experiments/field measurements, it is interesting to evaluate the behaviour of the bulk Richardson number $Ri_{b}$, as a function of the shear Richardson number $Ri_{\tau }$. This behaviour is shown in figure 12. Present results (filled symbols, $\bullet$, red), which are plotted together with literature results obtained at lower $Re_{\tau }$ (open symbols), confirm previous indications that $Ri_b\propto Ri_{\tau }^{2/3}$. In view of its independence on $Re_{\tau }$ – at least over approximately one decade, from $Re_{\tau }=180$ up to $Re_{\tau }=1000$ – the proposed $Ri_b$ scaling seems a general property of the flow that can be used as a robust parametrization tool, as will be shown below.
Bulk Richardson number,  $Ri_{b}$, as a function of the shear Richardson number, $Ri_{\tau }$, for the present simulations at $Re_{\tau }=1000$, and for previous simulations at $Re_{\tau }=180$ and $Re_{\tau }=550$ (García-Villalba & del Álamo Reference García-Villalba and del Álamo2011). The proposed scaling $Re_{b}\sim Ri_{\tau }^{2/3}$ is also explicitly indicated.

Perhaps the most important quantities to be monitored in wall-bounded stratified turbulence are the overall momentum and heat transfer rates, which are commonly quantified in terms of the friction factor  $C_f$ – shear stress to kinetic energy ratio – and by the Nusselt number $Nu$ – convective to conductive heat transfer ratio – as
 \begin{equation} \left.\begin{array}{l@{}} C_f=\dfrac{2 \tau_w}{\rho u_b^{2}},\\ Nu=\dfrac{2 q_w h}{\lambda \Delta T }. \end{array} \right\} \end{equation}
 Results obtained from the present simulations are shown by filled symbols ( $\bullet$, red) in figures 13–14, together with the results obtained in previous studies (Garg et al. Reference Garg, Ferziger, Monismith and Koseff2000; Armenio & Sarkar Reference Armenio and Sarkar2002; García-Villalba & del Álamo Reference García-Villalba and del Álamo2011; Zonta et al. Reference Zonta, Onorato and Soldati2012b; Zonta Reference Zonta2013). Focusing on $C_f$ (figure 13), it is clear that an increase of stratification (increase of $Ri_{\tau }$) reduces the wall-normal momentum transfer, via the reduction of wall-normal turbulent transport and via the corresponding increase of the volume flowrate (keeping the imposed pressure gradient constant). Interestingly, recalling that $Ri_b\propto Ri_{\tau }^{2}/3$ (see figure 12), and considering that $C_f/4=Ri_b/Ri_{\tau }$, we obtain $C_f \sim Ri_{\tau }^{-1/3}$ (García-Villalba & del Álamo Reference García-Villalba and del Álamo2011). This scaling law, which is shown in figure 13 together with the reported numerical results, predicts fairly well the behaviour of $C_f$ for a broad range of $Ri_{\tau }$, with some departure observed only at very large stratification levels (when local flow laminarization is likely to appear).
Friction factor  $C_f$ as a function of the shear Richardson number $Ri_{\tau }$. Results of present study (filled symbols) are shown together with results obtained in previous studies (Garg et al. Reference Garg, Ferziger, Monismith and Koseff2000; Armenio & Sarkar Reference Armenio and Sarkar2002; García-Villalba & del Álamo Reference García-Villalba and del Álamo2011; Zonta et al. Reference Zonta, Onorato and Soldati2012b; Zonta Reference Zonta2013). The proposed scaling $C_{f}\sim Ri_{\tau }^{-1/3}$ is also explicitly indicated.

Rescaled Nusselt number  $Nu \times Re_{\tau }^{-2/3}$ as a function of the shear Richardson number $Ri_{\tau }$. Results of present study (filled symbols) are shown together with results obtained in previous studies (Garg et al. Reference Garg, Ferziger, Monismith and Koseff2000; Armenio & Sarkar Reference Armenio and Sarkar2002; García-Villalba & del Álamo Reference García-Villalba and del Álamo2011; Zonta et al. Reference Zonta, Onorato and Soldati2012b; Zonta Reference Zonta2013). Note that the values of $Nu$ in Zonta et al. (Reference Zonta, Onorato and Soldati2012b) and Zonta (Reference Zonta2013), obtained at $Pr=3$, have been rescaled by $Pr^{1/3}$. The proposed scaling $Nu \times Re_{\tau }^{-2/3} \sim Ri_{\tau }^{-1/3}$ is also explicitly indicated.

The fair collapse observed for  $C_f$ is not recovered for the Nusselt Number $Nu$ (not shown in figure 14). Interestingly, when rescaled by $Re_{\tau }^{-2/3}$, the collected results collapse nicely (figure 14) and scale as $Nu \times Re_{\tau }^{-2/3} \sim Ri_{\tau }^{-1/3}$ (therefore giving $Nu \times Re_{\tau }^{-2/3} \sim C_f$). The proposed scaling differs from classical analogies widely used in the literature – such as the Chilton and Colburn one $C_f/2=Nu \times Re^{-1} \times Pr^{-1/3}$ (Bird, Stewart & Lightfoot Reference Bird, Stewart and Lightfoot2007) – to relate heat, mass and momentum transfer coefficients in forced convection phenomena. It is reasonable to expect that the interaction between buoyancy and momentum modifies the main transport processes in a non-trivial way that is hard to predict by simplified assumptions. An in-depth analysis and a corresponding accurate parametrization of the actual flow field are therefore required to shed some light on the proposed scaling, which, however, appears rather robust.
4. Conclusions
We analysed the flow physics of stratified wall-bounded turbulence at high Reynolds number by running a series of DNS of stably stratified channel flow at fixed Reynolds and Prandtl number ( $Re_{\tau }=1000$ and $Pr=0.71$, respectively) and at different values of the shear Richardson number, up to $Ri_{\tau }=300$. From a physical viewpoint, the simulation set-up can be assimilated to the flow of air inside a channel of height $2h\sim 1.5\ {\rm m}$ at a reference bulk Reynolds number (based on $h$)
$h$)  $Re_b=2 \times 10^{4}$ and subject to a wall-to-wall temperature difference up to ${\approx }10\ {\rm K}$.
For the considered range of  $Ri_{\tau }$, active turbulence is sustained close to the walls, where the strong mean shear generates small-scale vorticity that is not affected by the imposed stratification. Farther from the wall, where vortices and flow structures are larger, stratification has an important influence. Even for low-to-moderate levels of stratification, buoyancy effects dominate in this region, as the mean shear is small (the channel centre is a symmetry plane). Interestingly, although temperature and wall-normal velocity fluctuations are very large at the channel centre, their correlation – which represents the buoyancy flux – decreases so much that, for $Ri_{\tau }\geqslant 200$, it becomes nearly zero. We show that this behaviour is due to the presence of a ${\approx }{\rm \pi} /2$ phase shift between the temperature fluctuations and the wall-normal velocity fluctuations that causes no correlation between the two signals. These findings are consistent with the presence of IGWs at the channel centre. It is worth observing that, although hypothesized in previous works (Komori et al. Reference Komori, Ueda, Ogino and Mizushina1983; Armenio & Sarkar Reference Armenio and Sarkar2002), we did not find evidence of any mean counter-gradient heat flux, even at the largest stratification considered here. These results, however, can supply further motivation to examine this flow at even higher stratification levels. Finally, we focused on the behaviour of the overall momentum and heat transfer rates, represented by the friction factor, $C_f$, and the Nusselt number, $Nu$, respectively. We showed that the friction factor scales as $C_f \sim Ri_{\tau }^{-1/3}$, while the Nusselt number scales as $Nu \times Re_{\tau }^{-2/3} \sim Ri_{\tau }^{-1/3}$. We remark here that the current large-scale dataset of stably stratified channel turbulence at $Re_{\tau }=1000$ are expected to help LES and Reynolds-averaged Navier–Stokes similations to build efficient and reliable subgrid-scale and closure models for wall-bounded buoyancy-influenced turbulence (Lazeroms et al. Reference Lazeroms, Brethouwer, Wallin and Johansson2013).
Funding
Vienna Scientific Cluster (Vienna, Austria), CINECA (Bologna, Italy) and CEA-TGCC (Bruyéres-le-Châtel, France) supercomputing centres are gratefully acknowledged for generous allowance of computer resources under grants 71026, HP10BCFP82, HP10BAX0FY and PRACE (project No. 2019215180). P.H.S. acknowledges financial support from the existing ERASMUS $+$ project between TU Wien and University of Udine. The authors acknowledge the TU Wien University Library for financial support through its Open Access Funding Program.
Declaration of interests
The authors report no conflict of interest.


 Open access

