


Chronic diseases such as CVD, cancer and diabetes are leading causes of morbidity and mortality in Western populations(Reference Roth, Abate and Abate1). In Switzerland, CVD and cancer accounted for more than 60 % of deaths in the last few decades(2,Reference Chammartin, Probst-Hensch and Utzinger3) . Notably, significant geographic variation in chronic disease mortality exists across Switzerland(Reference Chammartin, Probst-Hensch and Utzinger3,Reference Faeh, Minder and Gutzwiller4) . In fact, compared with the other language regions, higher CVD mortality was observed in the German-speaking region, whereas higher cancer mortality was observed in the French-speaking region(Reference Chammartin, Probst-Hensch and Utzinger3,Reference Faeh, Minder and Gutzwiller4) . The reasons behind this are not fully understood, but regional variation in dietary patterns might contribute to explaining these geographic disparities.
Unhealthy diet is a key modifiable risk factor for many chronic diseases, and targeted changes towards a healthier diet could prevent a substantial proportion of chronic disease deaths(5,6) . The analyses of dietary patterns provide a more comprehensive understanding of the relationship between diet and disease than looking only at single nutrients or food groups, because they can take potential synergistic or antagonistic effects of individual dietary components into account. As such, they might better represent habitual food consumption(Reference Hu7–Reference Kant9).
Two widely used approaches to derive dietary patterns are hypothesis-driven and data-driven methods(Reference Hu7–Reference Kant9). Hypothesis-driven (or a priori) dietary patterns are scores based on the available scientific evidence and aim to reflect the overall diet quality or the adherence to a predefined diet(Reference Waijers, Feskens and Ocké10,Reference Heidemann, Schulze and Franco11) . In contrast, data-driven (or a posteriori) dietary patterns, derived using methods such as factor or cluster analysis, are based exclusively on the underlying dietary data(Reference Ocké8,Reference Heidemann, Schulze and Franco11) . While hypothesis-driven dietary patterns often rely on fixed cut-offs, allowing for comparisons between different countries and over time, data-driven dietary patterns represent the typical dietary habits of the population under study(Reference Ocké8,Reference Waijers, Feskens and Ocké10,Reference Heidemann, Schulze and Franco11) . Given the complementarity of these two approaches, their simultaneous use has often been suggested in the literature(Reference Ocké8,Reference Kant9,Reference Tapsell, Neale and Satija12) .
The association between dietary patterns and chronic disease mortality in various populations has been investigated in previous studies(Reference Schwingshackl, Bogensberger and Hoffmann13–Reference Medina-Remón, Kirwan and Lamuela-Raventós16). High diet quality, as assessed by hypothesis-driven dietary patterns, has consistently been associated with a significant reduction in the risk of all-cause and cause-specific mortality(Reference Schwingshackl, Bogensberger and Hoffmann13,Reference Liese, Krebs-Smith and Subar14) . With respect to data-driven dietary patterns, healthy or prudent patterns (characterised by high intake of fruits and vegetables, wholegrains, legumes, fish and poultry) have been associated with reduced chronic disease mortality(Reference Heidemann, Schulze and Franco11,Reference Li, Hou and Chen15,Reference Atkins, Whincup and Morris17) . In contrast, results for Western patterns (characterised by high intake of red meat, processed meat, refined grains, soft drinks and sweets) have been less consistent, showing either weak positive associations or no significant associations with chronic disease mortality(Reference Heidemann, Schulze and Franco11,Reference Li, Hou and Chen15,Reference Atkins, Whincup and Morris17) .
The promotion of a healthy diet is key in several global and national strategies for chronic diseases prevention, including the Swiss National Strategy on the Prevention of Non-Communicable Diseases 2017–2024(6,18) . The identification of typical dietary patterns and study of associations between diet and chronic diseases in Switzerland would therefore enable public health authorities to refine national strategies and develop targeted nutrition interventions. Until 2015, Switzerland lacked representative data on the dietary habits of the population(Reference Chatelan, Beer-Borst and Randriamiharisoa19). Therefore, previously conducted studies investigating the association between diet and chronic disease mortality had to rely on rather crude dietary assessments(Reference Faeh, Minder and Gutzwiller4,Reference Krieger, Cabaset and Pestoni20–Reference Besson, Paccaud and Marques-Vidal22) . For the first time, the recently conducted Swiss National Nutrition Survey menuCH made it possible to derive dietary patterns based on representative and detailed dietary data(Reference Pestoni, Krieger and Sych23,Reference Krieger, Pestoni and Cabaset24) . Additionally, to our knowledge, no studies have investigated the association between diet and chronic disease mortality in Switzerland considering the geographic context.
Therefore, by combining mortality data from the Swiss Federal Statistical Office and dietary data from the menuCH survey, and using an ecological study design, we aimed to: (1) investigate the associations of hypothesis- and data-driven dietary patterns with mortality from various chronic diseases and (2) explore their spatial dependence, that is, the tendency of near locations to present more similar values and distant locations to present more different values than randomly expected, which occurs frequently in ecological data(Reference Kissling and Carl25).
Methods
Design and study population of the menuCH survey
The analyses were performed using data from the Swiss National Nutrition Survey menuCH, a cross-sectional population-based survey conducted between 2014 and 2015 across the twelve most populous Swiss cantons, covering seventy-six out of 143 districts. Recruitment procedures and participation rates were presented in detail elsewhere(Reference Chatelan, Beer-Borst and Randriamiharisoa19,Reference Chatelan, Marques-Vidal and Bucher26) . Briefly, Swiss residents between 18 and 75 years of age were drawn from a stratified random sample representative for seven major regions of Switzerland (Lake Geneva Region, Espace Mittelland, Northwestern Switzerland, Zurich, Eastern Switzerland, Central Switzerland, Ticino; Eurostat NUTS-2) and different age groups (18–29, 30–39, 40–49, 50–64, 65–75 years)(Reference Chatelan, Beer-Borst and Randriamiharisoa19). Out of 13 606 sampled individuals, 5496 individuals could be contacted by mail or by phone, 2086 individuals agreed to participate in the survey (net response rate of 38 %) and 2057 individuals with complete dietary assessment were eventually included in the present analyses.
Ethical approval
This study was conducted according to the Declaration of Helsinki and all procedures involving human subjects were approved by the ethics committee in Lausanne (protocol 26/13), as well as by the ethics committees of the participating Swiss cantons. The survey is registered at the ISRCTN registry with the name menuCH – Swiss Nutrition Survey 2014–2015 and under the number 16778734 (https://doi.org/10.1186/ISRCTN16778734). Written informed consent was obtained from all menuCH participants.
Dietary assessment
Two non-consecutive 24-h dietary recalls (24HDR) were used to assess the food consumption of menuCH participants. The two interviews were conducted by trained dietitians using the automated and validated software GloboDiet® adapted to Switzerland (GloboDiet® trilingual databases dated 12·December·2016, formerly EPIC-Soft®; International Agency for Research on Cancer, Lyon, France; Food Safety and Veterinary Office)(Reference Crispim, de Vries and Geelen27,Reference Slimani, Casagrande and Nicolas28) and were evenly distributed across all weekdays and all seasons(Reference Chatelan, Marques-Vidal and Bucher26). Intake of dietary supplements was not assessed in the 24HDR. The compliance to different standard operating guidelines was assessed for quality control purposes. Additionally, inconsistencies in the 24HDR were identified and data were cleaned according to recommendations of the International Agency for Research on Cancer(Reference Chatelan, Beer-Borst and Randriamiharisoa19). To facilitate portion sizes estimation, a book including pictures of common portion sizes and household utensils was available to each participant. All food items recorded during the 24HDR were eventually matched with the most appropriate item in the Swiss Food Composition Database(29) using the FoodCASE software (Premotec GmbH).
Hypothesis- and data-driven dietary patterns
A detailed description of the methods applied to derive hypothesis- and data-driven dietary patterns using menuCH data was previously published(Reference Pestoni, Krieger and Sych23,Reference Krieger, Pestoni and Cabaset24) .
In short, the 2010 version of Alternate Healthy Eating Index (AHEI) was computed to assess the overall diet quality of each menuCH participant(Reference Pestoni, Krieger and Sych23). The AHEI was developed based on the Dietary Guidelines for Americans, discussions with nutrition experts and an extensive literature review of studies investigating the association between diet and diseases. The AHEI includes the following components: vegetables, fruits, whole grains, sugar-sweetened beverages, nuts and legumes, red and processed meat, trans-fat, long-chain n-3 fatty acids, PUFA, Na and alcohol(Reference Chiuve, Fung and Rimm30). Each component of the score can receive from 0 to 10 points, leading to a total score of 0–110 points, with 0 points meaning low and 110 meaning high diet quality(Reference Chiuve, Fung and Rimm30). For the present analyses, the total score was divided into study-specific quintiles.
Data-driven dietary patterns were derived using multiple factorial analysis and hierarchical clustering in a two-step procedure(Reference Krieger, Pestoni and Cabaset24). First, the menuCH food items were grouped into seventeen different food groups based on the food categories of the software GloboDiet®. Multiple factorial analysis was applied to the energy-standardised intake of these seventeen food groups and seven principal components were retained. Second, hierarchical clustering was applied to the data using these principal components as input, generating four mutually exclusive clusters: a Prudent pattern (n 486), characterised by high consumption of vegetables, fruits, white meat and fish; a Swiss traditional pattern (n 744), characterised by high consumption of chocolate, milk and dairy products; a Western-soft drinks pattern (n 383), characterised by high consumption of red meat, processed meat and soft drinks; and a Western-alcohol pattern (n 444), characterised by high consumption of red meat, processed meat, alcoholic beverages and starchy foods(Reference Krieger, Pestoni and Cabaset24).
The consumption of different food groups and macronutrients overall and by hypothesis- and data-driven dietary patterns is presented in the online Supplementary Table S1.
Assessment of covariates
The energy intake of menuCH participants was computed directly from the 24HDR data. Socio-demographic and lifestyle characteristics were assessed by a self-administered questionnaire(Reference Chatelan, Beer-Borst and Randriamiharisoa19). The following variables were considered in the present analyses: sex (male, female), age group (18–29, 30–44, 45–59, 60–75 years), education (primary or no degree, secondary, tertiary), physical activity level (low, medium, high) and smoking status (never, former, current). Finally, anthropometric factors were directly measured by trained personnel using standard protocols(Reference Chatelan, Beer-Borst and Randriamiharisoa19,31) . Measured body weight and height were used to calculate the BMI. Self-reported weight and/or height were used when measurements were not feasible (n 7), whereas self-reported weight before pregnancy and measured height were used for pregnant and lactating women (n 27). For the analyses, the WHO BMI categories were used (underweight: BMI < 18·5 kg/m2; normal weight: 18·5 kg/m2 ≤ BMI < 25·0 kg/m2; overweight: 25·0 kg/m2 ≤ BMI < 30·0 kg/m2; obese: BMI ≥ 30·0 kg/m2)(32).
Mortality data
Mortality data of the years 2011–2016 were provided by the Swiss Federal Statistical Office. This period was chosen because it allowed for the inclusion of a sufficient number of events for statistical analysis. To match the age range of menuCH participants, only deaths that occurred at 18–76 years of age were included in the present analyses. The data were centrally coded at the Swiss Federal Statistical Office using the 10th version of the International Classification of Diseases (ICD-10). The following chronic diseases were considered: CVD (ICD-10: I00-I99), ischaemic heart disease (IHD; ICD-10: I20-I25), stroke (ICD-10: I60-I69), all-cancer (ICD-10: C00-C97 and D00-D48), colorectal cancer (CRC; ICD-10: C18-C21) and diabetes (ICD-10: E10-E14.9). The main analysis of the present study was conducted using the definitive cause of death assigned by the Swiss Federal Statistical Office, that is, the cause of death usually considered for the official unicausal statistics. Additionally, to better capture diseases less often registered as primary cause of death, a sensitivity analysis was performed considering ICD-10 from all four categories reported in the death certificate (i.e. underlying cause of death, immediate cause of death and up to two concomitant causes of death). In this sensitivity analysis, the same individual could therefore contribute to more than one disease category.
Standardised mortality ratios (SMR) for each of the aforementioned chronic diseases were computed at the district level by dividing the observed number of deaths by the expected number of deaths in the overall Swiss population aged 18–76 years, based on the population census data of the years 2011–2016. The expected number of deaths in each district was calculated using indirect standardisation, based on age-, sex- and year-specific mortality rates of the whole Swiss population. District-level SMR information was subsequently matched with individual dietary data by the place of residence of menuCH participants.
Statistical analysis
The present study is a secondary analysis of the menuCH survey. The participants’ characteristics were described according to hypothesis- and data-driven dietary patterns. Additionally, descriptive maps were used to show the geographic distribution of AHEI, data-driven dietary patterns and chronic diseases’ district-level SMR. For this purpose, dietary data were aggregated at district level. For the AHEI, the mean of the participants’ scores for each district was calculated and further divided into quintiles. For the data-driven dietary patterns, the percentage of participants in each of the four dietary patterns and each district was mapped.
Quasipoisson regression models were fitted to investigate the associations of hypothesis- and data-driven dietary patterns with mortality from the chronic diseases of interest. Quasipoisson regression was chosen over Poisson regression because of the presence of overdispersion in the data (i.e. variance greater than the mean). In order to model district-level SMR, the observed number of deaths in the respective district was included in the regressions as outcome variable, the natural log of the expected number of deaths in the respective district as offset term and the hypothesis- or data-driven dietary patterns as exposure variable. Analyses of hypothesis-driven dietary patterns were further adjusted for age, sex, energy intake, education, BMI, physical activity level and smoking status. Moreover, trend tests were performed including the median value of each AHEI quintile as continuous variable in the regression models. Since data-driven dietary patterns were derived from energy-standardised food intake, the analyses of data-driven dietary patterns were adjusted for the variables mentioned above, but not for energy intake. Given the potential mediation role of body weight in the relationship between diet and chronic disease mortality, the regression models were also fitted without BMI. The resulting estimates were very similar, indicating no strong influence by this variable. In addition, given the presence of significant interactions between both hypothesis- and data-driven dietary patterns and sex, the Quasipoisson regression models were fitted stratified by sex in a sensitivity analysis.
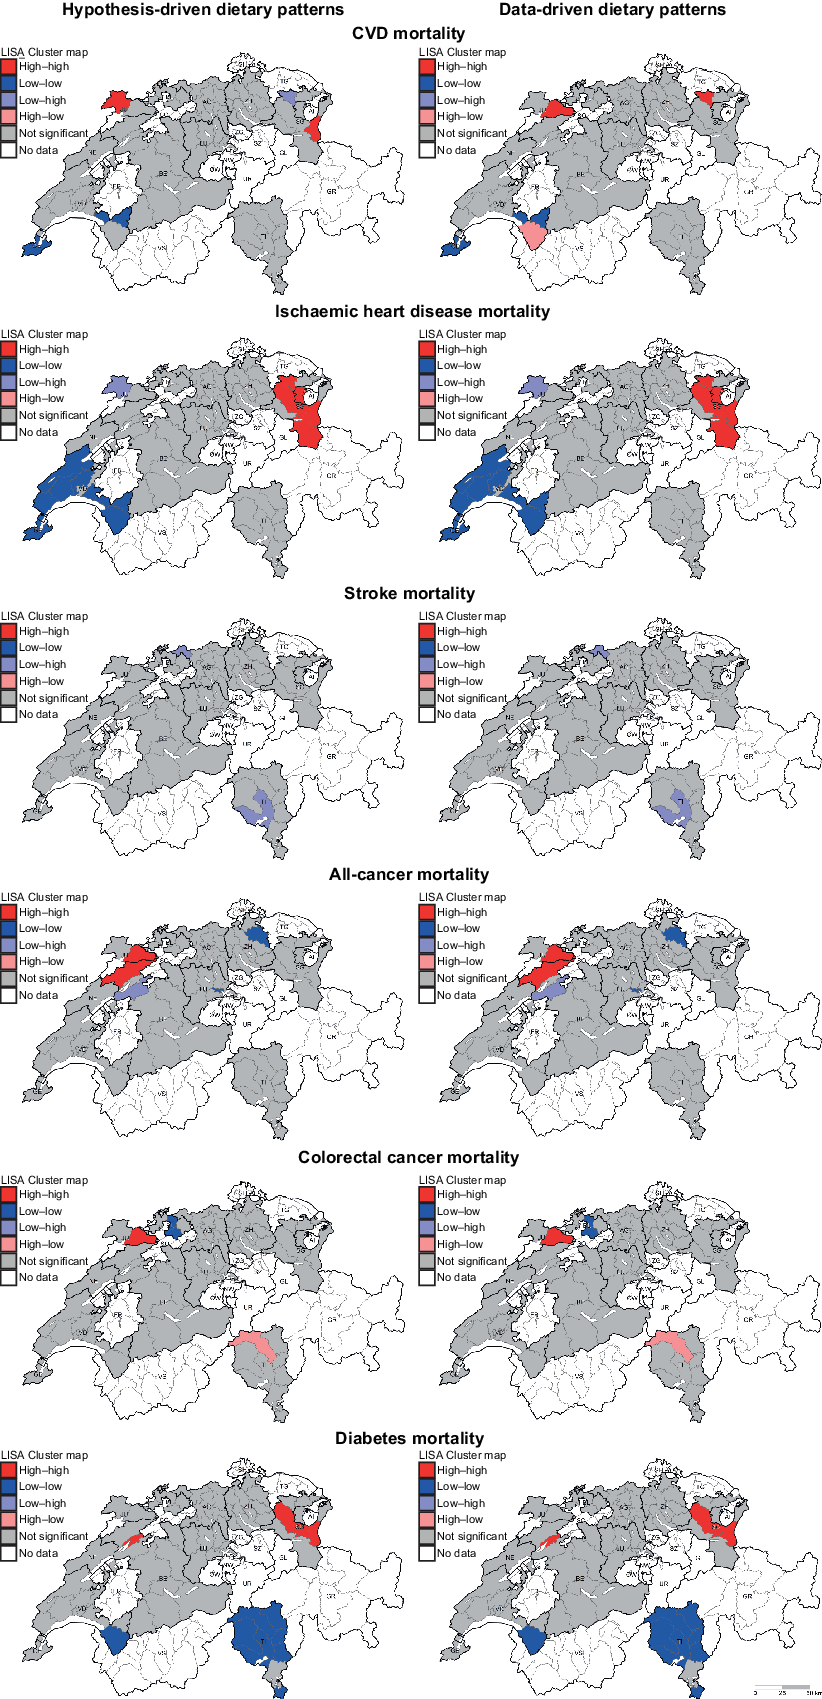
Finally, to investigate spatial dependence in chronic disease mortality, we ran a set of explorative spatial dependence analyses on Quasipoisson regression models’ residuals using global and local Moran’s I statistics. For this analysis, the regression residuals were aggregated at district level. The Moran’s I values typically range from −1 to 1, with positive values indicating positive spatial dependence (i.e. similar regression residuals clustering in neighbouring locations) and negative values indicating negative spatial dependence (i.e. dissimilar regression residuals clustering in neighbouring locations). Results of local Moran’s I statistics (Local Indicators of Spatial Association) are presented by mapping statistically significant local clusters. High–high represents regions exhibiting above average values surrounded by neighbouring regions also showing above average values, and low–low represents regions exhibiting below average values surrounded by neighbouring regions showing below average values. In contrast, low–high and high–low represent outliers, that is, regions showing below average values surrounded by neighbouring regions showing above average values or vice versa.
The menuCH weighting strategy, which considers the survey’s sampling design and the non-response, was applied to descriptive statistics and Quasipoisson regression models(Reference Pasquier, Chatelan and Bochud33). In contrast, the menuCH weighting strategy was not applied to descriptive maps, because dietary data were aggregated at district level. Additionally, to overcome the problem of missing information, multiple imputation by chained equations (with 25 imputed data sets) was applied to the data in all regression analyses presented in this study. Information about the missing values in the variables is reported in Tables 1 and 2. A complete case analysis was performed to investigate the influence of missing values on the results. Overall, this analysis yielded similar, but less frequently statistically significant results. However, because of the exclusion of participants with missing values, the menuCH weighting strategy could not be applied to the complete case analysis. Therefore, we only present results of regression analyses after multiple imputation.
Characteristics of the menuCH participants by AHEI quintiles (n 2057) (Numbers and percentages)*,†
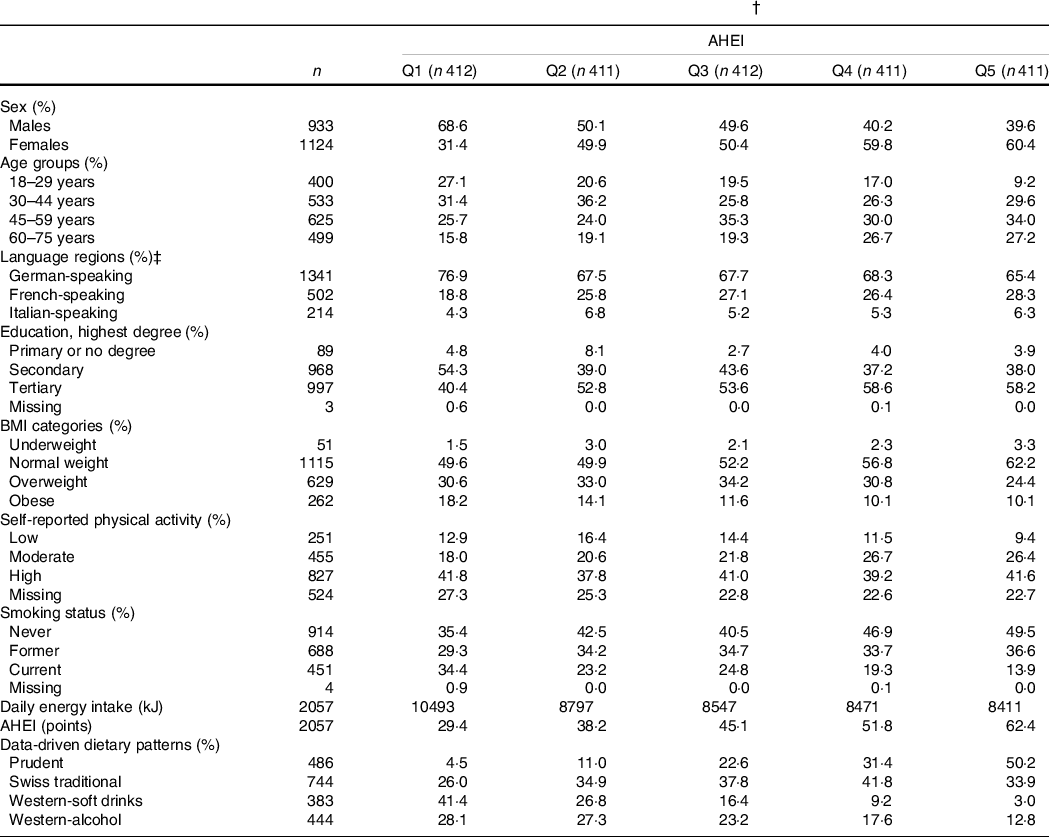
AHEI, Alternate Healthy Eating Index; Q, quintile.
* Continuous variables are expressed as median; categorical variables are expressed as %.
† Results are weighted for sex, age, marital status, major regions of Switzerland (NUTS-2), nationality, household size; results for daily energy intake, AHEI and data-driven dietary patterns are further weighted for season and weekday; weighting factors were applied according to the menuCH weighting strategy(Reference Pasquier, Chatelan and Bochud33); n are unweighted.
‡ German-speaking region: cantons Aargau, Basel-Land, Basel-Stadt, Bern, Lucerne, St. Gallen, Zurich; French-speaking region: cantons Geneva, Jura, Neuchatel, Vaud; Italian-speaking region: canton Ticino.
Characteristics of the menuCH participants by data-driven dietary patterns (n 2057) (Numbers and percentages)*,†
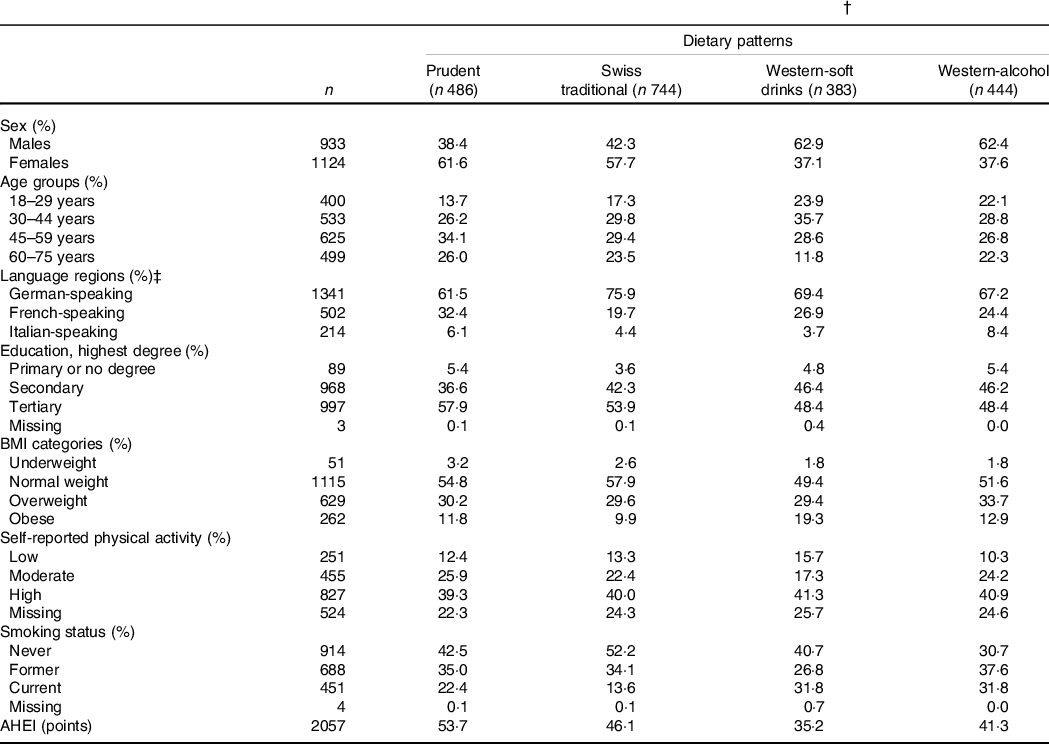
AHEI: Alternate Healthy Eating Index.
* Continuous variables are expressed as median; categorical variables are expressed as %.
† Results are weighted for sex, age, marital status, major regions of Switzerland (NUTS-2), nationality, household size; results for AHEI are further weighted for season and weekday; weighting factors were applied according to the menuCH weighting strategy(Reference Pasquier, Chatelan and Bochud33); n are unweighted.
‡ German-speaking region: cantons Aargau, Basel-Land, Basel-Stadt, Bern, Lucerne, St. Gallen, Zurich; French-speaking region: cantons Geneva, Jura, Neuchatel, Vaud; Italian-speaking region: canton Ticino.
Statistical analyses were performed using the R Software (version 3.6.3 for Windows, R Foundation for Statistical Computing). The package popEpi was used to compute district-level SMR(Reference Miettinen and Rantanen34), the package tmap was used to draw descriptive and Local Indicators of Spatial Association maps(Reference Tennekes35) and the package mice was used to conduct the multiple imputation(Reference van Buuren and Groothuis-Oudshoorn36). Additionally, spatial dependence analyses were performed using the software GeoDa (version 1·14). A P-value < 0·05 was considered as statistically significant for all analyses.
Results
The characteristics of menuCH participants according to hypothesis- and data-driven dietary patterns are presented in Tables 1 and 2, respectively. Participants with a higher AHEI were more likely to be female, over 45 years of age, well-educated, normal weight, moderately physically active and never smokers compared to participants with a lower AHEI. Energy intake tended to be lower among participants in the highest AHEI quintiles. Additionally, participants in the highest AHEI quintiles tended to follow the Prudent pattern and, to a lesser extent, the Swiss traditional pattern (Table 1). Participants in the Prudent pattern tended to be female, over 45 years of age and well-educated. The characteristics of participants following either the Western-soft drinks or the Western-alcohol patterns were rather similar, with participants being mainly males, young and current smokers. In addition, participants in the Swiss traditional pattern were more likely to be female, to live in the German-speaking part of Switzerland and to be never smokers. Finally, participants in the Prudent pattern had the highest diet quality as assessed by the AHEI, followed by participants in the Swiss traditional pattern, participants in the Western-alcohol pattern and participants in the Western-soft drinks pattern (Table 2).
During the period 2011–2016, the following number of events was documented as definitive causes of death in Switzerland: 25 377 CVD deaths, of which 10 763 IHD deaths and 3980 stroke deaths, 55 571 all-cancer deaths, of which 4990 CRC deaths, and 1969 diabetes deaths.
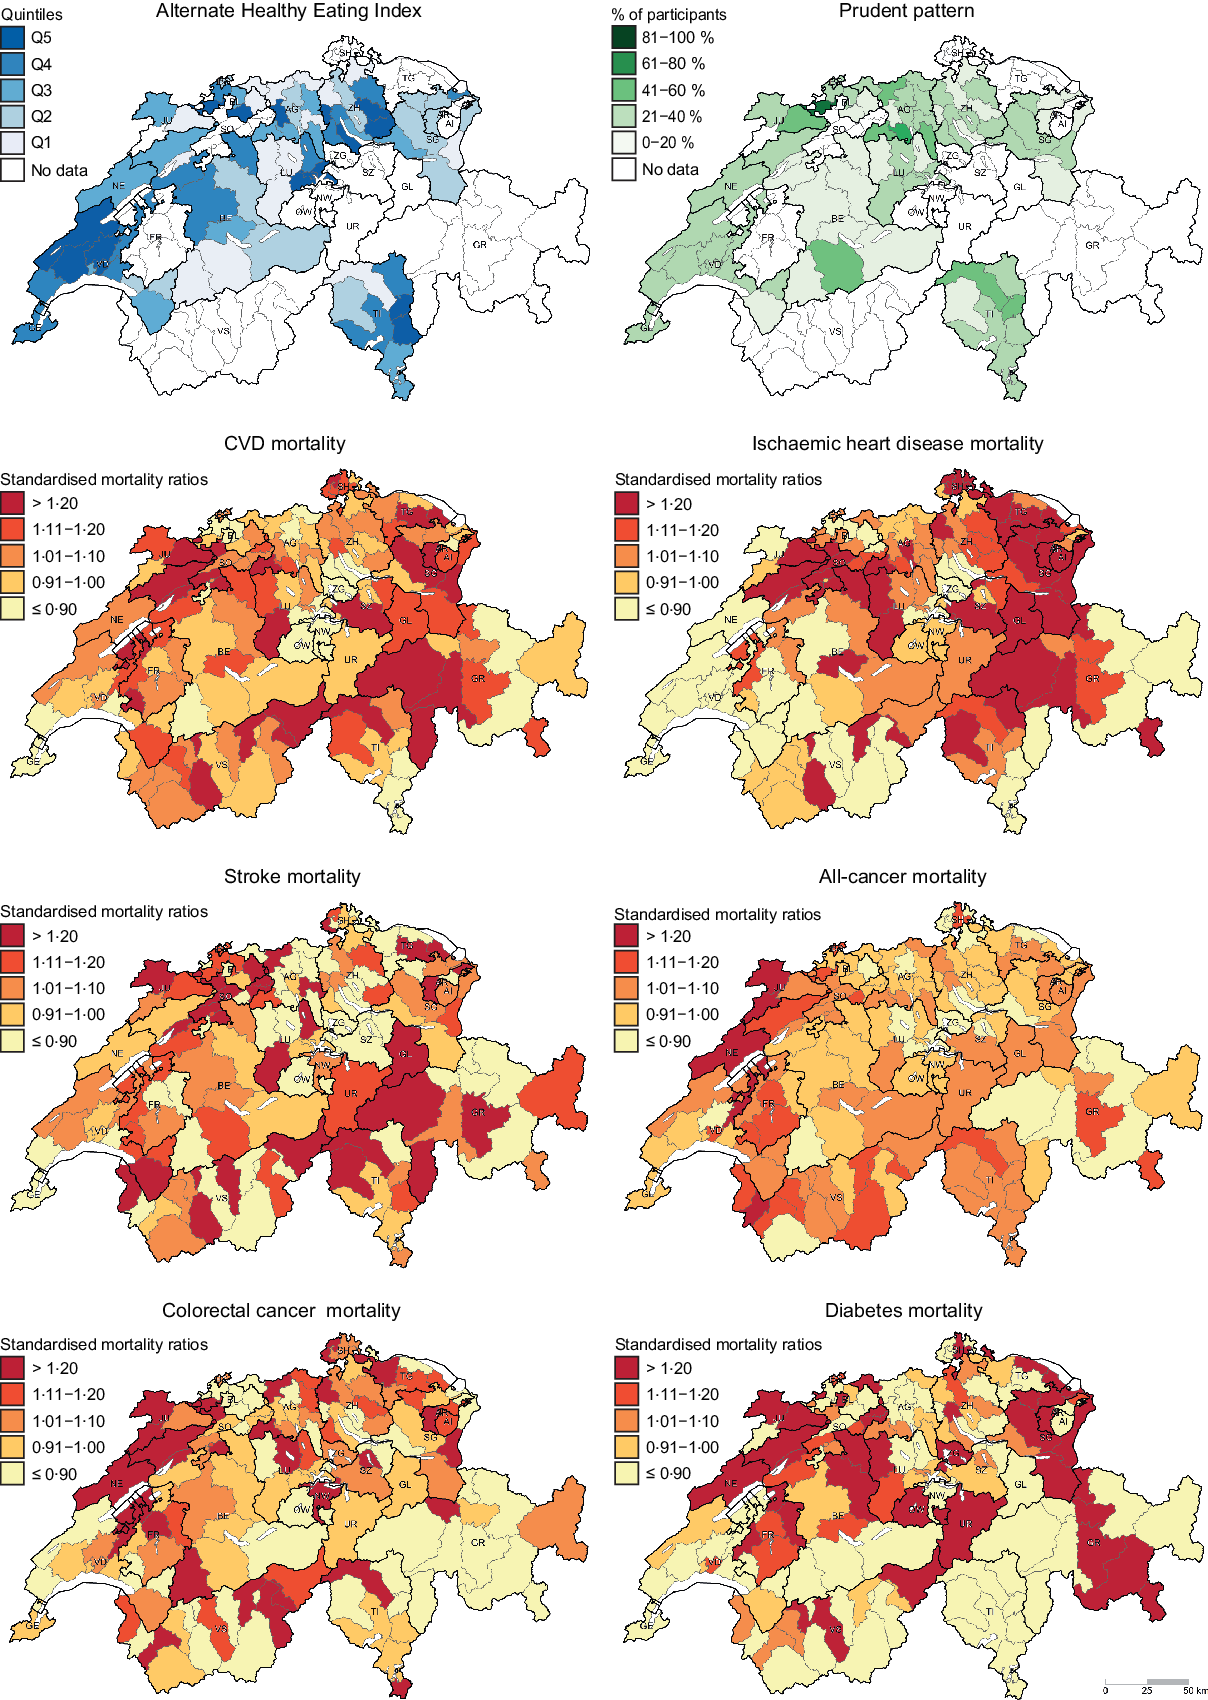
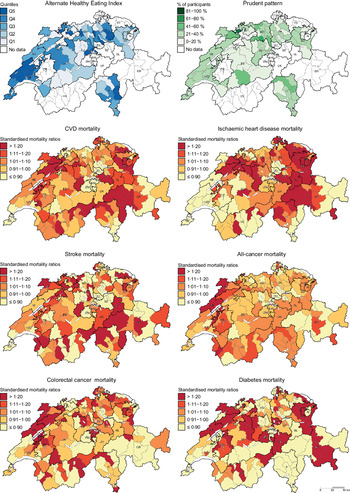
Descriptive maps representing the geographic distribution of the AHEI (i.e. hypothesis-driven dietary pattern) and the Prudent pattern (i.e. data-driven dietary pattern) as well as district-level SMR for the chronic diseases of interest are given in Fig. 1. Since the Prudent pattern is the healthiest pattern and was used as a reference in the regression models, only the percentage of participants following this pattern is shown in Fig. 1. The geographic distribution of the Swiss traditional, Western-soft drinks and Western-alcohol patterns is presented in the online Supplementary Figure S1.
Geographic distribution of Alternate Healthy Eating Index, Prudent pattern and chronic disease mortality. For maps representing the Alternate Healthy Eating Index (i.e. hypothesis-driven dietary pattern) and the Prudent pattern (i.e. data-driven dietary pattern), dietary data were aggregated at district level. Chronic disease mortality is expressed as standardised mortality ratios (SMR), calculated at district level using indirect standardisation based on age-, sex- and year-specific mortality rates. The menuCH weighting strategy was not applied to descriptive maps. Q, quintiles.
Results of the Quasipoisson regression models after multiple imputation are presented in Table 3. Generally, higher AHEI scores were associated with lower cause-specific mortality. Compared with the first, the fifth AHEI quintile was associated with district-level SMR of 0·95 (95 % CI 0·93, 0·97) for CVD, 0·91 (95 % CI 0·88, 0·95) for IHD, 0·97 (95 % CI 0·95, 0·99) for stroke, 0·99 (95 % CI 0·98, 1·00) for all-cancer, 0·98 (95 % CI 0·96, 0·99) for CRC and 0·93 (95 % CI 0·89, 0·96) for diabetes. Overall, the associations were weaker for stroke and CRC mortality, for which only the fifth AHEI quintile was significantly associated with a lower district-level SMR. No significant associations were observed for all-cancer mortality. In addition, for all chronic diseases, district-level SMR significantly decreased with increasing AHEI quintiles, with stronger trends observed for CVD, IHD and diabetes, than for stroke, CRC and all-cancer. In the analyses of data-driven dietary patterns, the Swiss traditional, the Western-soft drinks and the Western-alcohol patterns were associated with significantly higher district-level SMR for CVD, IHD, stroke and diabetes compared with the Prudent pattern, with SMR ranging from 1·02 to 1·08 (Table 3). Moreover, the Western-soft drinks pattern was associated with a significantly higher district-level SMR for CRC. Again, no significant associations were observed for all-cancer mortality.
Association of hypothesis- and data-driven dietary patterns with chronic disease mortality (n 2057) (SMR and 95 % confidence intervals)*,†
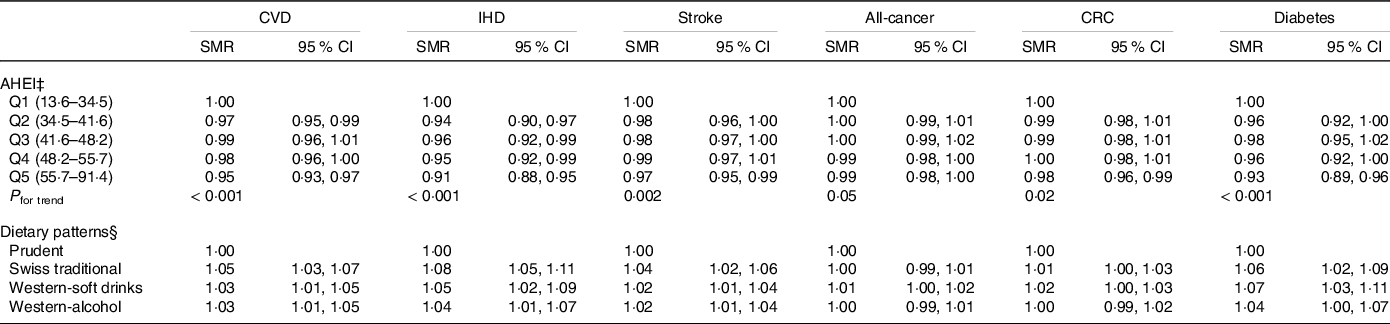
IHD, ischaemic heart disease; CRC, colorectal cancer; SMR, standardised mortality ratio; AHEI, Alternate Healthy Eating Index; Q, quintile.
* Results derived from Quasipoisson regression models and weighted for sex, age, marital status, major regions of Switzerland (NUTS-2), nationality, household size, season, weekday; weighting factors were applied according to the menuCH weighting strategy(Reference Pasquier, Chatelan and Bochud33).
† SMR were calculated at district level using indirect standardisation based on age-, sex- and year-specific mortality rates.
‡ Adjusted for sex, age, education, BMI, physical activity, smoking status and energy intake.
§ Adjusted for sex, age, education, BMI, physical activity and smoking status.
In sensitivity analyses, the same analyses were performed considering the causes of death from all four categories reported in the death certificate, to better capture diseases rarely leading to death as primary cause. Generally, very similar associations were observed. Complete results are given in the online Supplementary Table S2. Additionally, in a second sensitivity analysis, the Quasipoisson models were fitted stratified by sex (online Supplementary Table S3). Compared with the main analysis, results were generally less frequently significant. Interestingly, however, significant associations between hypothesis-driven dietary patterns and chronic disease mortality were mainly observed in men, whereas significant associations between data-driven dietary patterns and chronic disease mortality were mainly found in women.
Finally, significant global and local spatial dependence was found for the majority of the outcomes of interest. Notably, very similar results were observed when comparing hypothesis- and data-driven dietary patterns analyses. In the analyses of hypothesis-driven dietary patterns, the global Moran’s I (P-value) was 0·287 (0·001) for CVD, 0·581 (0·001) for IHD, −0·050 (0·35) for stroke, 0·148 (0·04) for all-cancer, −0·041 (0·39) for CRC and 0·484 (0·001) for diabetes. In the analyses of data-driven dietary patterns, the global Moran’s I (P-value) was 0·279 (0·001) for CVD, 0·572 (0·001) for IHD, −0·053 (0·33) for stroke, 0·147 (0·04) for all-cancer, −0·044 (0·38) for CRC and 0·485 (0·001) for diabetes. Moreover, significant local geographic clusters were observed for several regions in all outcomes of interest, with similar results across hypothesis- and data-driven dietary patterns. Local clusters were mainly observed in the north-eastern, south-western and southern parts of Switzerland. Results of local Moran’s I statistics are presented in Fig. 2.
Results of local spatial dependence analyses on regression residuals of hypothesis-driven (left) and data-driven (right) dietary patterns represented by LISA maps. High–high and low–low represent regions with positive spatial correlation: high–high indicates regions with high values surrounded by regions with high values, indicating more than expected mortality; low–low indicates regions with low values surrounded by regions with low values, indicating less than expected mortality. In contrast, low–high and high–low represent outliers, that is, low–high indicates regions with low values surrounded by regions with high values, and vice versa. Explorative spatial dependence analyses were run on residuals of Quasipoisson regression models aggregated at district level (n 76). LISA, Local Indicators of Spatial Association.
Discussion
In the present study, both hypothesis- and data-driven dietary patterns were significantly associated with chronic disease mortality. High AHEI was associated with lower district-level SMR for the chronic diseases of interest, whereas the Swiss traditional and Western-like patterns were associated with higher district-level SMR for CVD, IHD, stroke and diabetes. For both hypothesis- and data-driven dietary patterns, no significant associations were observed for all-cancer mortality. Additionally, Moran’s I statistics on regression residuals revealed significant global and local spatial dependence in the investigated associations.
To the best of our knowledge, this is the first study investigating the association between dietary patterns and chronic disease mortality in Switzerland, based on individual, detailed and representative dietary data. A previous Swiss study examined the ecological correlations between different food groups and chronic disease mortality using food balance sheets data produced by the FAO(Reference Besson, Paccaud and Marques-Vidal22). Another study investigated the association between hypothesis-driven dietary pattern and mortality and reported a significantly reduced all-cause, CVD and cancer mortality risk among individuals with high adherence to a modified Mediterranean diet score(Reference Vormund, Braun and Rohrmann21). However, dietary data originated from the Swiss Monitoring of trends and determinants in Cardiovascular disease (MONICA) study, which was conducted in the 1980s and included a rather crude dietary assessment, that is, yes or no questions about the consumption of broadly defined food groups on the previous day(Reference Vormund, Braun and Rohrmann21). Moreover, our group previously applied the data-driven approach to dietary data from the Swiss MONICA study and identified five different dietary patterns (i.e. ‘Sausage and Vegetables’, ‘Meat and Salad’, ‘Fish’, ‘Traditional’, ‘High-fibre foods’)(Reference Krieger, Cabaset and Pestoni20). The results revealed a reduced CVD mortality risk among men consuming the ‘Fish’ or ‘Traditional’ pattern as well as a reduced cancer mortality risk among women consuming the ‘High-fibre foods’ pattern and among participants consuming the ‘Fish’ pattern, compared with participants consuming the ‘Sausage and Vegetables’ pattern(Reference Krieger, Cabaset and Pestoni20).
The findings of the present study regarding hypothesis-driven dietary pattern analyses were in line with results of previous prospective studies. A large body of evidence exists on the association between diet quality as assessed by the AHEI and risk of CVD or cancer mortality(Reference George, Ballard-Barbash and Manson37–Reference Wang, Li and Afshin44). Several studies observed a significantly lower risk of CVD mortality among participants in the highest AHEI quantile compared with participants in the lowest AHEI quantile(Reference George, Ballard-Barbash and Manson37–Reference Hashemian, Farvid and Poustchi42). Generally, significant small gains were observed with increasing AHEI quantiles, suggesting that improvements in diet quality sufficient to reach the higher quantile are favourable(Reference George, Ballard-Barbash and Manson37–Reference Reedy, Krebs-Smith and Miller41). In addition, a significantly lower CVD mortality risk was found in participants improving their AHEI score over time(Reference Sotos-Prieto, Bhupathiraju and Mattei43). The results were less consistent for cancer mortality. Overall, weaker associations were observed, and a significant reduction of cancer mortality risk in individuals with a high diet quality was found only in some of the studies(Reference Harmon, Boushey and Shvetsov38,Reference Mursu, Steffen and Meyer39,Reference Reedy, Krebs-Smith and Miller41) . This could be explained by the fact that cancer is a rather heterogeneous endpoint and the effect of diet could be stronger in certain types of cancer than in others(Reference Chiuve, Fung and Rimm30,Reference Harmon, Boushey and Shvetsov38,Reference Neelakantan, Koh and Yuan40) . The evidence for the role of dietary factors in cancer development is particularly strong for CRC, specifically for high intakes of processed meat and alcoholic beverages(45). In agreement with this, the present study found significant associations between AHEI and CRC. In contrast, two previous studies did not observe statistically significant associations between diet quality and CRC mortality. However, both studies included participants who were older than participants in the present study and one of the studies only included female participants(Reference Sotos-Prieto, Bhupathiraju and Mattei43,Reference Vargas, Neuhouser and George46) .
Less evidence exists for the association between diet quality and mortality from other chronic diseases of interest in this study, that is, IHD, stroke and diabetes mortality. Using data of the Nurses’ Health and Health Professionals’ Follow-up studies, Sotos-Prieto and colleagues(Reference Sotos-Prieto, Bhupathiraju and Mattei43) investigated the effect of changes in AHEI over time on mortality from different chronic diseases. For every 20-percentile increase in the score, they observed a reduced IHD mortality risk in women, but not in men, and no significant associations for stroke mortality. Moreover, a large analysis using the Global Burden of Disease data investigated the percentage reductions in chronic disease deaths (population attributable fraction) that could be achieved by improvements in diet quality, as assessed by the AHEI, from the current diet to a reference healthy diet(Reference Wang, Li and Afshin44). The results revealed that, globally, improvements in the diet quality could potentially prevent 35·8 % of IHD deaths, 17·0 % of stroke deaths and 41·8 % of diabetes deaths, although results for stroke mortality were not significant. In contrast, a study conducted using data of the Multiethnic Cohort reported a weak but significantly increased stroke mortality risk among participants with low diet quality, suggesting a possible protective role of diet in stroke mortality(Reference Aigner, Becher and Jacobs47). Overall, these results are consistent with our findings.
In the analyses of data-driven dietary patterns conducted in the present study, the Swiss traditional, Western-soft drinks and Western-alcohol patterns were associated with significantly higher district-level SMR for CVD, IHD, stroke and diabetes, compared with the Prudent pattern. These results seem consistent only with some of the findings reported in previous literature. In fact, while Prudent, Mediterranean-like or fruit-rich patterns were frequently associated with a reduced risk of CVD and stroke mortality(Reference Heidemann, Schulze and Franco11,Reference Cai, Shu and Gao48–Reference Shimazu, Kuriyama and Hozawa54) , only few studies observed a significant increased risk of CVD mortality among individuals following a Western pattern(Reference Heidemann, Schulze and Franco11,Reference Odegaard, Koh and Yuan52,Reference Shimazu, Kuriyama and Hozawa54) , and none of the studies observed a significant increased risk of stroke mortality(Reference Cai, Shu and Gao48,Reference Maruyama, Iso and Date50,Reference Nanri, Mizoue and Shimazu51,Reference Osler, Heitmann and Gerdes53,Reference Shimazu, Kuriyama and Hozawa54) . Similar to hypothesis-driven dietary patterns, the associations of data-driven dietary patterns with cancer mortality as well as mortality from the other chronic diseases of interest were more heterogeneous(Reference Heidemann, Schulze and Franco11,Reference Cai, Shu and Gao48–Reference Akinyemiju, Moore and Pisu55) , with only few studies showing significant results(Reference Heidemann, Schulze and Franco11,Reference Cai, Shu and Gao48,Reference Harriss, English and Powles49,Reference Odegaard, Koh and Yuan52,Reference Akinyemiju, Moore and Pisu55) . Out of five studies focusing on cancer mortality, two found a significantly increased cancer mortality in participants following Western dietary patterns, whereas one study found a significantly reduced cancer mortality in participants following a vegetable-rich dietary pattern(Reference Heidemann, Schulze and Franco11,Reference Odegaard, Koh and Yuan52,Reference Akinyemiju, Moore and Pisu55) . Additionally, a Mediterranean-like dietary pattern was significantly associated with reduced IHD mortality in an Australian cohort(Reference Harriss, English and Powles49), and a fruit-rich dietary pattern was significantly associated with reduced diabetes mortality in a Chinese cohort(Reference Cai, Shu and Gao48). However, the results observed in the present study are likely influenced by the method used to derive dietary patterns. While the aforementioned studies computed quantiles of factor scores for a given pattern and compared participants with high adherence to participants with low adherence to that pattern, we applied hierarchical clustering after multiple factorial analysis to generate mutually exclusive clusters and compared the identified dietary patterns to one pattern chosen as reference. Since the Prudent pattern was chosen as reference group in the present analyses, the positive associations of the Swiss traditional and Western-like patterns with chronic disease mortality might therefore reflect a negative association of the Prudent pattern with chronic disease mortality.
We observed significant global spatial dependence in chronic disease mortality, with very similar results across hypothesis- and data-driven dietary patterns. In addition, significant local spatial clusters were observed, mainly involving districts located in north-eastern, south-western and southern parts of Switzerland (Fig. 2). These local geographic clusters differed depending on the chronic disease of interest, but were again highly similar across hypothesis- and data-driven dietary patterns. The local clusters exhibit variance in chronic disease mortality that goes beyond what can be explained by the independent variables investigated in the present study. These results suggest that the association between diet and chronic disease mortality is likely to be stronger in some Swiss regions than in others. The associations might be influenced by factors that are locally important in the cluster regions or by spatial interaction. For example, traditionally and locally specific meals or foods may spread into neighbouring regions that originally had a different food culture. Also, non-dietary factors not included in the regression models (e.g. socio-economic status) or residual confounding could play a role. Therefore, further analyses that include the spatial component in regression models (e.g. using geographically weighted regression analysis or spatial lag/error models) should be conducted. This would provide the opportunity to identify Swiss regions where the impact of diet on chronic disease mortality is more pronounced and to develop regionally targeted nutritional interventions.
Finally, in a sensitivity analysis, the associations between dietary patterns and chronic disease mortality were investigated stratified by sex. The generally weaker association observed in this analysis could be explained by the lower number of participants due to stratification. Interestingly, significant associations between hypothesis-driven dietary patterns and chronic disease mortality were mainly observed in men, whereas significant associations between data-driven dietary patterns and chronic disease mortality were mainly seen in women. However, the explorative spatial dependence analysis indicated a strong similarity across hypothesis- and data-driven dietary patterns and no relevant differences in the distribution of dietary patterns by sex were observed (data not shown). We therefore assume that other factors unevenly distributed across sexes and dietary patterns exist and drive these associations.
A strength of the present study was the use of detailed and nationally representative dietary data. In fact, the dietary assessment consisted of 24HDR conducted using the automated and validated software GloboDiet®. Additionally, the participants were drawn from a random stratified sample and results were weighted according to the menuCH weighting strategy in order to consider the sampling design and non-response. Also, we conducted a comprehensive study, which investigated both hypothesis- and data-driven dietary patterns in the same population, considered mortality from various chronic diseases, and explored the geographic context.
The present study has also important limitations. Although postal codes of the study participants were available, we had no information about name, date of birth or complete address of the study participants. This precluded the possibility of a direct linkage with external data sources, including Federal statistical office mortality data. Thus, the linkage between dietary and mortality data was conducted by place of residence. In this way, the menuCH participants residing in each district were assumed to be representative for the whole district and the potential misclassification of participants in the different dietary patterns might have affected our results. Since the weighting strategy was developed considering the major regions of Switzerland rather than the districts, the use of weights in the analyses was not sufficient to overcome this limitation. Another important weakness of the present study is its cross-sectional design and the fact that the time frame of the dietary survey overlaps with that of mortality data. For these reasons, causal relationships cannot be established and our results must be interpreted with caution. Dietary patterns usually appear to be rather stable over longer time periods(Reference Nagel, Zoller and Ruf56), and our results are generally consistent with the findings of previous large cohort studies. However, a study in the French-speaking part of Switzerland reported that scores for a ‘fish and vegetables’ pattern increased over a 20-year period, whereas the ‘meat and chips’ and ‘chocolate and sweets’ pattern scores decreased in both sexes and across all age groups, although the changes were smaller among the older participants(Reference Marques-Vidal, Gaspoz and Theler57). A further limitation of the present study is the use of a population including high numbers of young individuals. However, menuCH is the only Swiss study with detailed, individual and representative dietary data and small number did not allowed for sub-analyses by age. Hypothesis- and data-driven dietary patterns have also some constraints. While hypothesis-driven dietary patterns only include selected food components and every component has equal importance(Reference Schulze, Martínez-González and Fung58), data-driven dietary patterns rely on subjective decisions and often show limited reproducibility and stability(Reference Krieger, Pestoni and Cabaset24,Reference Fransen, May and Stricker59) . However, the simultaneous use of the two methods enabled us to take advantage of their complementarity and overcome some of the aforementioned limitations. Also, the similar results obtained from the analysis of hypothesis- and data-driven dietary patterns suggest robustness of our findings. In the present study, participation bias cannot be excluded. In fact, despite similar characteristics between participants and non-participants(Reference Chatelan, Beer-Borst and Randriamiharisoa19), study participants of dietary surveys are often more health conscious than non-participants. Moreover, recall bias might have occurred during the 24HDR, potentially contributing to over- or under-estimation of food consumption, and dietary supplements were not considered. Finally, although important covariates were included as adjusting factors in the analyses, residual confounding cannot be ruled out.
To conclude, our study sheds light on chronic disease mortality due to unhealthy diets and suggests that dietary patterns partly contribute to the explanation of geographic disparities in chronic disease mortality in Switzerland. Significantly lower district-level SMR for various chronic diseases were observed in the higher AHEI quintiles compared with the lower AHEI quintiles, and the Swiss traditional and Western-like patterns showed higher district-level SMR for CVD, IHD, stroke and diabetes, compared with the Prudent pattern. No significant associations were found for all-cancer mortality. In addition, we observed significant global and local spatial dependence, which varied across chronic diseases, but was highly similar between hypothesis- and data-driven dietary patterns. National nutrition surveys such as menuCH are crucial to investigate food consumption and dietary habits of a given population. However, for more in-depth information, a regular implementation as well as a wider regional coverage of the national surveys is necessary. Ideally, prospective studies with dietary and mortality information at the individual level should be conducted in Switzerland to support the associations observed in the present study. Finally, further analyses that include spatial components in regression models would allow for a better understanding of local factors influencing the associations between dietary patterns and chronic disease mortality, and for identifing regions where nutritional interventions are needed the most.
Acknowledgements
The authors would like to acknowledge the Swiss Federal Food Safety and Veterinary Office (FSVO) for providing the data.
The study was supported by the Federal Food Safety and Veterinary Office (‘What does the Swiss population eat? Characterisation of food consumption, dietary patterns and lifestyle in the Swiss language regions’, project number 5.17.02ERN). The funding source had no role in the design, analysis or writing of this article.
D. F., O. G., G. P. and S. R. formulated the research question and designed the study; J. B., N. K., J.-P. K. and G. P. analysed the data; J. B., O. G., G. P. and S. R. interpreted the findings; G. P. wrote the article; all authors critically revised the article, and read and approved the final version of the article.
There are no conflicts of interest.
Supplementary material
For supplementary materials referred to in this article, please visit https://doi.org/10.1017/S0007114521001525


 Open access