

In the original publication of this article (Benes et al.), the captions for Figures 2 and 3 were inadvertently switched. The figure captions should read as follows:
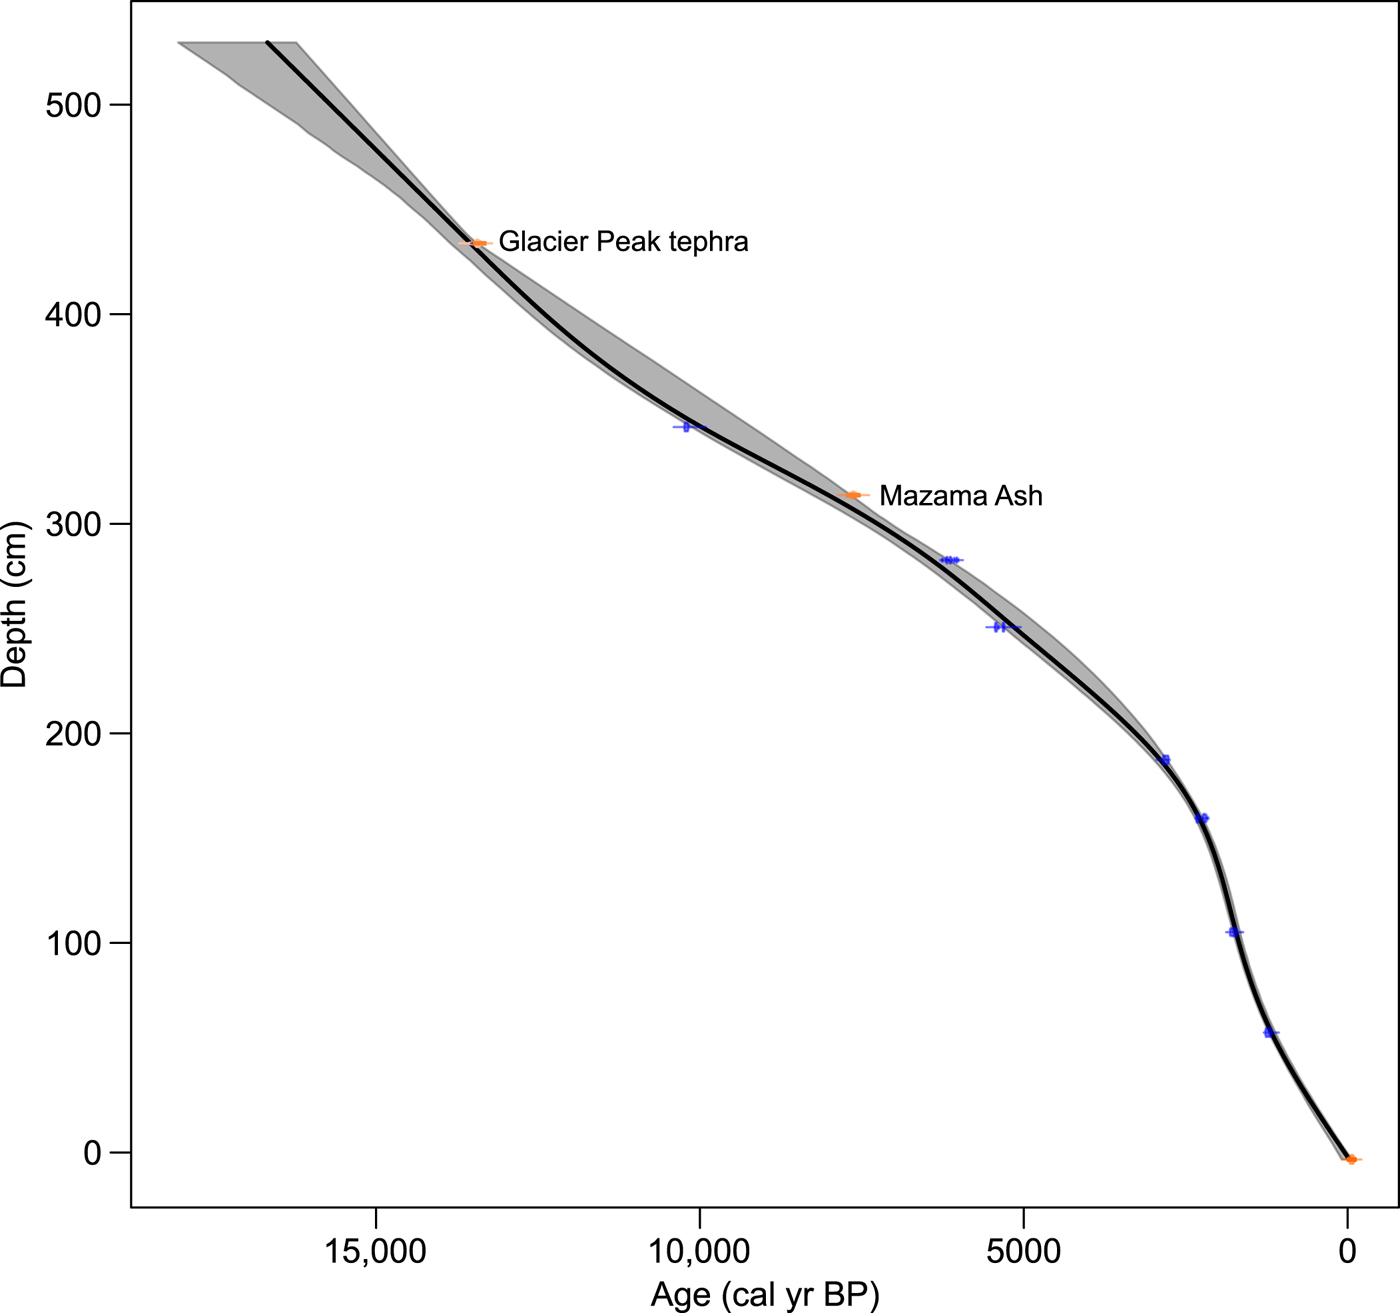
Age-depth model for Fairy Lake. 95% confidence intervals are shown in gray. The distributions of the calibrated ages employed in the development of the chronology are shown in purple and orange (samples submitted for 14C analysis and published ages of tephra deposition, respectively). (For interpretation of the references to color in this figure legend, the reader is referred to the web version of this article.)
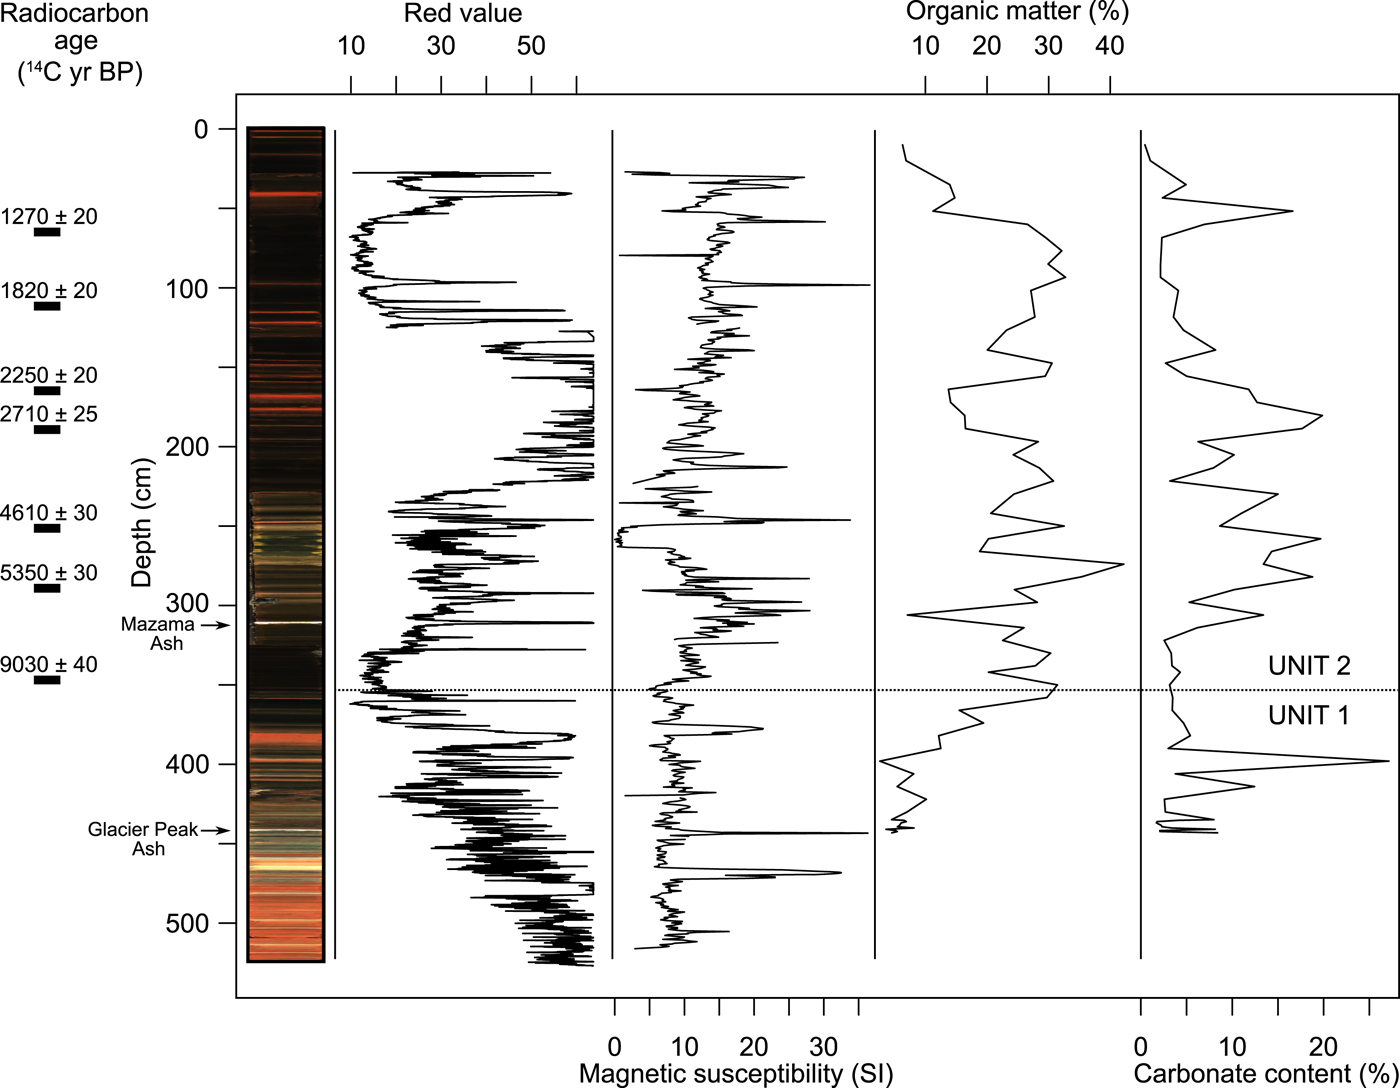
Lithology, red-value intensity, magnetic susceptibility (SI), carbonate content (%), and organic matter (%) from Fairy Lake. Lithological units 1 and 2 are shown. The black rectangles represent 14C dates. (For interpretation of the references to color in this figure legend, the reader is referred to the web version of this article.)
The authors apologize for this error.



