


CVD rank as the leading causes of death globally(1). In China, the disability-adjusted life years attributed to CVD were 7043·33 per 100 000 population in 2021, representing one of the highest burdens globally(1,Reference Liu, Li and Zeng2) . Accumulating evidence indicates that diet plays a critical role in both all-cause and CVD mortality. According to the Global Burden of Disease (GBD) study, unhealthy dietary patterns (DP) contributed to more CVD-related deaths than some major lifestyle risk factors, such as smoking and alcohol consumption, among the Chinese population(3).
Dietary intake can influence the risks of all-cause and CVD mortality in populations through its associations with food composition and nutrient profiles. DP refer to combinations of foods derived from overall dietary intake using statistical methods that characterise habitual eating behaviours within a population. Current methods for identifying DP typically rely on either hypothesis-oriented (a priori) or data-driven (a posteriori) approaches(Reference Ocké4,Reference Panagiotakos5) . However, these methods were primarily used to reduce the dimensionality of dietary data and to identify patterns based on the inherent structure of the data, without a predefined hypothesis, and the resulting DP may not fully reflect real-world dietary behaviours(Reference Hodge and Bassett6). Hybrid methods such as reduced rank regression (RRR) and partial least squares (PLS) have been proposed, which combine predefined knowledge with data reduction techniques to derive DP directly associated with disease risk(Reference Zhao, Li and Gao7). Nonetheless, the DP derived from hybrid methods may have limited reproducibility. To address this, our study also developed a simplified DP score by summing the unweighted standardised z-scores of highly correlated food groups, thereby representing the most informative foods within a DP(Reference Schulze, Hoffmann and Kroke8).
Our previous study showed that a Cantonese DP, characterised by higher intakes of riboflavin, vitamin C and K and lower intakes of Na, was associated with lower risks of all-cause and CVD mortality(Reference Sun, Zhang and Jiang9). These findings are consistent with reports from the WHO and the existing literature(10–Reference Li and Shi12). However, evidence suggests that one-third of Korean adults have insufficient riboflavin intake, a higher proportion compared with populations in the USA and Europe(Reference Choi, Kim and Cho13). Due to traditional cooking practices, vitamin C insufficiency appears to be highest in South Asians(Reference Carr and Rowe14). Additionally, Asian populations generally exhibit diets characterised by high Na intake and low K intake(15). Recognising that nutritional insufficiencies and imbalances are prevalent in Asian populations, including China, we selected riboflavin-density, K:Na ratio and vitamin C-density as key nutrients of interest(Reference Badimon, Chagas and Chiva-Blanch16,Reference Liu, Zhou and Zhang17) . Therefore, identifying DP that are closely related to specific nutrient insufficiencies could provide guidance for healthy dietary behaviours in Asian populations. Hence, we examined the association of DP, based on RRR and PLS, with risks of all-cause and CVD mortality in Chinese aged 50 years or older.
Methods and materials
Study design and sample
The Guangzhou Biobank Cohort Study (GBCS) is a population-based cohort study in South China with details of the methods reported previously(Reference Jiang, Thomas and Lam18). Briefly, GBCS is a three-way collaboration among the Guangzhou Twelfth People’s Hospital and the Universities of Hong Kong, China, and Birmingham, UK. All participants were recruited from the Guangzhou Health and Happiness Association for the Respectable Elders (GHHARE), in 2003–2008 (phase 1–3). GHHARE is a large unofficial organisation including about 7 % of Guangzhou residents aged 50 years or older, with branches in all districts of Guangzhou. Baseline information was collected using a computer-based standardised questionnaire and face-to-face interviews by trained nurses. Anthropometric measurements and blood pressure were obtained through standardised physical examinations at baseline. Fasting plasma glucose, lipids and inflammatory markers were assessed from fasting blood samples collected at baseline, following standard protocols. The reliability and validity of the questionnaire were tested 6 months into recruitment by recalling 200 randomly selected participants for re-interview, and the results were satisfactory(Reference Jiang, Thomas and Lam18). The study was conducted in accordance with the Declaration of Helsinki and was approved by the Guangzhou Medical Ethics Committee of the Chinese Medical Association, Guangzhou, China (IRB No. GWYL-2019-125). All participants provided written informed consent before participation.
Dietary intake assessment
The dietary data included daily intake of 300 commonly consumed food and beverage items (g/d) in Cantonese cuisine and twenty-four nutrients at baseline from a validated FFQ. The development and validation of the FFQ(Reference Woo, Leung and Ho19) and results based on it have been reported elsewhere(Reference Xu, Lam and Jiang20). Briefly, trained nurses asked participants to report for each food and beverage item, the size of each portion and the frequency of consumption in the past week by face-to-face interviews. Portion size was explained to participants using a catalogue of pictures of individual food portions. Information on the portion size and frequency of consumption for each food item was used to derive the weekly intake of each food and beverage item. We had shown the validity of the FFQ by comparing the results from the questionnaire with approximate estimations for total energy, Na and K intakes using other methods (including values of energy expenditure, 24-h urinary and K outputs) and examining the correlation between dietary cholesterol and fatty acid intakes with plasma lipid profiles(Reference Woo, Leung and Ho19). Daily nutrients and total energy intake were calculated by the methods of McCance and Widdowson(Reference Paul and Southgate21) and the Chinese Medical Sciences Institute(Reference Yang, Wang and Pan22). Specifically, the quantification of nutrients and total energy intake involved summing the intake of all food items in the FFQ, weighted by their nutrient content and total energy values, as per the food tables of McCance and Widdowson and the Chinese Medical Sciences Institute.
Outcome ascertainment
The primary outcomes were all-cause and CVD mortality. Information on causes of death up to 31 July 2022 was obtained through record linkage with the Death Registry of the Guangzhou Center for Disease Control and Prevention (GCDC), and details have been described elsewhere(Reference Lam, Xu and Jiang23). If death certificates were not issued by medical institutions, causes of death were verified by GCDC as part of its quality assurance programmed by cross-checking medical history. The secondary outcomes were cause-specific CVD mortality (including hypertensive heart disease, ischaemic heart disease (IHD), pulmonary heart disease and cerebrovascular disease). All causes of death were coded by trained nosologists in each hospital according to the International Classification of Diseases, Tenth Revision (ICD-10). In addition to mortality outcomes, CVD risk factors were assessed to examine the associations of DP with cardiometabolic health. These included markers of dyslipidaemia (TAG, total cholesterol, HDL-cholesterol and LDL-cholesterol), blood pressure (systolic blood pressure (SBP) and diastolic blood pressure (DBP)) and inflammatory markers (high-sensitivity C-reactive protein).
Covariate assessment
Potential confounders included baseline demographic characteristics (sex, age, education and family income), lifestyle factors (smoking status, alcohol use and physical activity), BMI(Reference Zhu, Yu and Guo24) and history of CVD (including self-reported or medication history of heart valve disease, CHD, IHD and extracardiac vascular disease), diabetes (including self-report or medication history of all types of diabetes) and total energy intake(Reference Schwingshackl, Schwedhelm and Hoffmann25). BMI was calculated as weight in kilograms divided by square of the height in meters (kg/m2). Physical activity was measured by a validated Chinese version of the International Physical Activity Questionnaire (IPAQ) (validated by us) and classified into low, moderate and high physical activity(Reference Deng, Macfarlane and Thomas26).
Identification of dietary patterns
RRR and PLS regression techniques were used to derive DP associated with the risks of all-cause and CVD mortality. PLS was used to identify DP by maximising the covariance between predictor combinations and response variables. In contrast, RRR aimed to capture the maximal variation in disease-specific intermediate responses, allowing the derivation of as many DP as there are response variables(Reference Hoffmann, Schulze and Schienkiewitz27).
In the present analyses, food groups were specified as predictor variables, and CVD-related nutrient densities were specified as response variables. The 300 food items were categorised into twenty-seven food groups based on their nutritional composition and taxonomy (online Supplementary Table 1). The twenty-seven food groups were measured in grams per d and were standardised and centred using the mean and standard deviation. Standardisation was performed to place all food groups on a comparable scale, facilitating interpretation of their relative contributions in the RRR and PLS models. Nutrient densities were calculated by dividing nutrient intake by total energy intake and multiplying the results by 1000. Using RRR and PLS, DP were identified based on the intake of riboflavin-density, vitamin C-density and K:Na ratio and daily intake of twenty-seven food groups. Based on previous studies, food items showing absolute factor loadings of ≥|0·17| were identified as significant contributors to the DP, with higher factor loadings indicating stronger associations between food groups and DP(Reference Jessri, Wolfinger and Lou28,Reference Lazarova and Jessri29) . To test the robustness of the derived DP, we randomly split the sample in half five times. The PLS and RRR analyses were repeated on each half of the sample, and the DP derived in each subsample were confirmed in the corresponding validation subsample. The patterns derived subsequently showed very similar predictor loadings across all subsamples, and the mean correlation coefficients between the five cross-validated DP were r = 0·98 for RRR and r = 0·99 for PLS.
Furthermore, to address concerns regarding the lack of reproducibility of data-driven DP (RRR and PLS) and their dependence on the specific population under study, we developed a simplified DP score using the methods proposed by Schulze et al. (Reference Schulze, Hoffmann and Kroke8). Briefly, these scores were derived based on the concept that excluding less informative food groups improves precision and generalisability and calculated by summing the unweighted standardised z-scores of food groups with significant factor loadings (≥ |0·17|) on the DP. Simplified RRR and PLS DP scores were created based on the DP derived from RRR and PLS, respectively.
Descriptive analysis and modelling
χ 2 tests were used to compare baseline categorical variables by quartiles of DP scores and ANOVA and Kruskal–Wallis rank-sum tests for continuous variables. Person-years of follow-up were calculated from the date of baseline enrolment to the date of death or the end of the follow-up on 31 July 2022, whichever came first. Multivariable Cox regression was used to calculate hazard ratios (HR) and 95 % CI for all-cause and CVD mortality. We used Schoenfeld residuals to test the proportional hazards assumption and found no violation. Model 1 was the crude model without adjustment. In multivariable analyses, model 2 was adjusted for sex and age, and model 3 was additionally adjusted for socio-economic position (education and family income), lifestyle factors (smoking, alcohol use, physical activity and BMI), co-morbidities (history of CVD and diabetes) and total energy intake. The P-values for trends were estimated by treating the quartiles of DP scores as continuous variables. To avoid overestimation of the association between DP and mortality, we calculated the absolute risk difference (ARD) defined as the differences in mortality risk at the maximum follow-up time of 19 years between the highest (Quartile 4) and lowest (Quartile 1) quartiles of the DP scores with adjustment for the potential confounders of model 3(Reference Rogawski, Westreich and Kang30). The bootstrap method was used to calculate the 95 % CI for ARD based on 500 bootstrap samples. ARD were expressed as events per 10 000 person-years. Correlations between the DP scores and their subcomponents and nutrients were examined by Spearman’s correlation analysis. In addition, we evaluated the associations between DP scores and baseline CVD risk factors using multivariable linear regression.
Subgroup and sensitivity analyses
To assess potential interactions and robustness of our findings, log likelihood ratio tests were used to calculate the model fit by comparing models with and without interaction terms between DP scores and selected potential modifiers. When significant interactions were identified, subgroup analyses were conducted accordingly. To account for potential bias due to reverse causality, we also conducted sensitivity analyses by excluding participants who died within the first 3 years of follow-up and making additional adjustment for the use of aspirin or other antiplatelet medications. Statistical analysis was done using Stata (STATA Corp LP, version 15) and the R language (version 4.3.0). Two-sided P-values < 0·05 were considered statistically significant.
Results
Of 30 430 participants, we first excluded 9970 in the phase 3 (2006–2008) without detailed dietary intake data and 128 participants with implausible energy intake (total energy < 800 or > 4200 kcal/d in men and < 600 or > 3500 kcal/d in women). For the CVD risk analysis, 20 263 participants were included [mean (sd) age = 62·7 (sd 6·7) years; 71·6 % women]. For the mortality analysis, an additional ninety-nine participants lost to follow-up with unknown vital status, fifty-six participants followed for less than 1 year and 609 participants with a self-reported history of cancer, stroke or myocardial infarction at baseline were excluded, resulting in 19 598 participants (62·7 (6·7) years; 71·6 % women). Over a median follow-up of 15·8 years (305 410 person-years), 4966 deaths occurred (1971 CVD-related, 2995 other causes; online Supplementary Figure 1).
Dietary pattern characteristics
We retained only the first DP derived from RRR and PLS, explaining 55·3 % and 60·8 % of variance in response variables (riboflavin-density, K:Na and vitamin C-density), respectively, with moderate-to-high correlations with these nutrients (RRR: r = 0·62, 0·15, 0·81; PLS: r = 0·54, 0·17, 0·63; online Supplementary Table 2).
Figure 1 shows the factor loadings for the ‘riboflavin-density, K/Na and vitamin C-density’ (RiboKNaC) DP derived from RRR and PLS. The RiboKNaC DP derived from RRR was characterised by higher factor loadings (≥ |0·17|) for green vegetables, yellow/orange fruits, milk and whole grains, with negative loadings for plant oils and refined grains (Figure 1(a)). The RiboKNaC DP derived from PLS had higher factor loadings for green vegetables, yellow/orange fruits, whole grains and fish, with negative loadings for plant oils and refined grains (Figure 1(b)). The detailed consumption of food groups and nutrients across the four quartiles of DP is shown in online Supplementary Table 3.
Factor loadings for riboflavin-density, K/Na and vitamin C-density DP derived through RRR and PLS in adult participants of GBCS. Factor loadings of ≥ |0·17| were identified as significant contributors to the DP, with higher factor loadings indicating a stronger association between food groups and DP. A: Factor loadings for riboflavin-density, K/Na and vitamin C-density dietary patterns derived through RRR. The derived dietary pattern was characteristic of high intakes of green vegetables, yellow/orange fruits, whole grains and milk, as well as low intakes of refined grains and plant oils; B: Factor loadings for riboflavin-density, K/Na and vitamin C-density dietary patterns derived through PLS. The derived dietary pattern was characteristic of high intakes of green vegetables, yellow/orange fruits, whole grains and fish, as well as low intakes of refined grains and plant oils. Note: There are some typical food items for each food group. plant oils: vegetable oil; refined grain: rice; processed meat: sausage; dairy products: milk shake; alcohol use: wine; sugar: candy; orange vegetable: carrot; red vegetables: tomato; starchy vegetables: potato; white vegetables: winter melon; green vegetables: cabbage; eggs: boiled egg; legume: soyabean; whole grain: oatmeal; tea: green tea; nuts: chestnut; Cantonese soup: chicken soup; water: plain water; poultry: chicken meat; orange fruits: orange; Guangzhou dimsum: red bean tong sui; seafood: squid; red meat: pork; red/purple fruits: grapefruit; milk: cows’ milk; juice: fresh fruit juice. For details, see online Supplementary Table 1. All twenty-seven food groups including 300 food items in a validated FFQ. DP, dietary patterns; RRR, reduced rank regression; PLS, partial least squares; GBCS, the Guangzhou Biobank Cohort Study.

Participant characteristics
Table 1 shows that at baseline participants in the highest quartile of RiboKNaC DP scores generally had healthier lifestyle profiles, including higher proportion of women, never smokers, higher education and income, more physical activity and higher BMI, along with higher HDL-cholesterol and lower high-sensitivity C-reactive protein (all P-value < 0·05). Similar results were found in those with higher RiboKNaC DP score derived from PLS, except for a positive association with current alcohol use and higher total energy intake (all P-value < 0·001) and no association with sex. Participants with higher scores from simplified RRR and PLS showed similar trends, except for younger age compared with Q1 (P-value < 0·01) and no association with BMI (P-value = 0·06) in the simplified RRR group. Detailed baseline characteristics by quartiles of DP scores are shown in online Supplementary Table 4.
Baseline characteristics by quartile one and four of dietary pattern score in 19 598 older Chinese recruited in 2003–2008 and followed up till 31 July 2022 in GBCS †

GBCS, the Guangzhou Biobank Cohort Study; RRR, reduced rank regression; PLS, partial least squares; SBP, systolic blood pressure; DBP, diastolic blood pressure; hs-CRP, high-sensitivity C-reactive protein.
One dollar almost equals to 7 RMB; P-values for the differences in baseline variables by Quartiles of dietary pattern score. Only results for Quartile 1 and 4 are shown; see online Supplemental Table 2 for results across all quartiles.
P < 0·05 **P < 0·01 ***P < 0·001.
† Data are presented as number (percentage) of participants unless otherwise indicated. χ 2 test was used to compare baseline categorical variables by quartiles of dietary pattern scores, and ANOVA and Kruskal–Wallis rank-sum test for continuous variables.
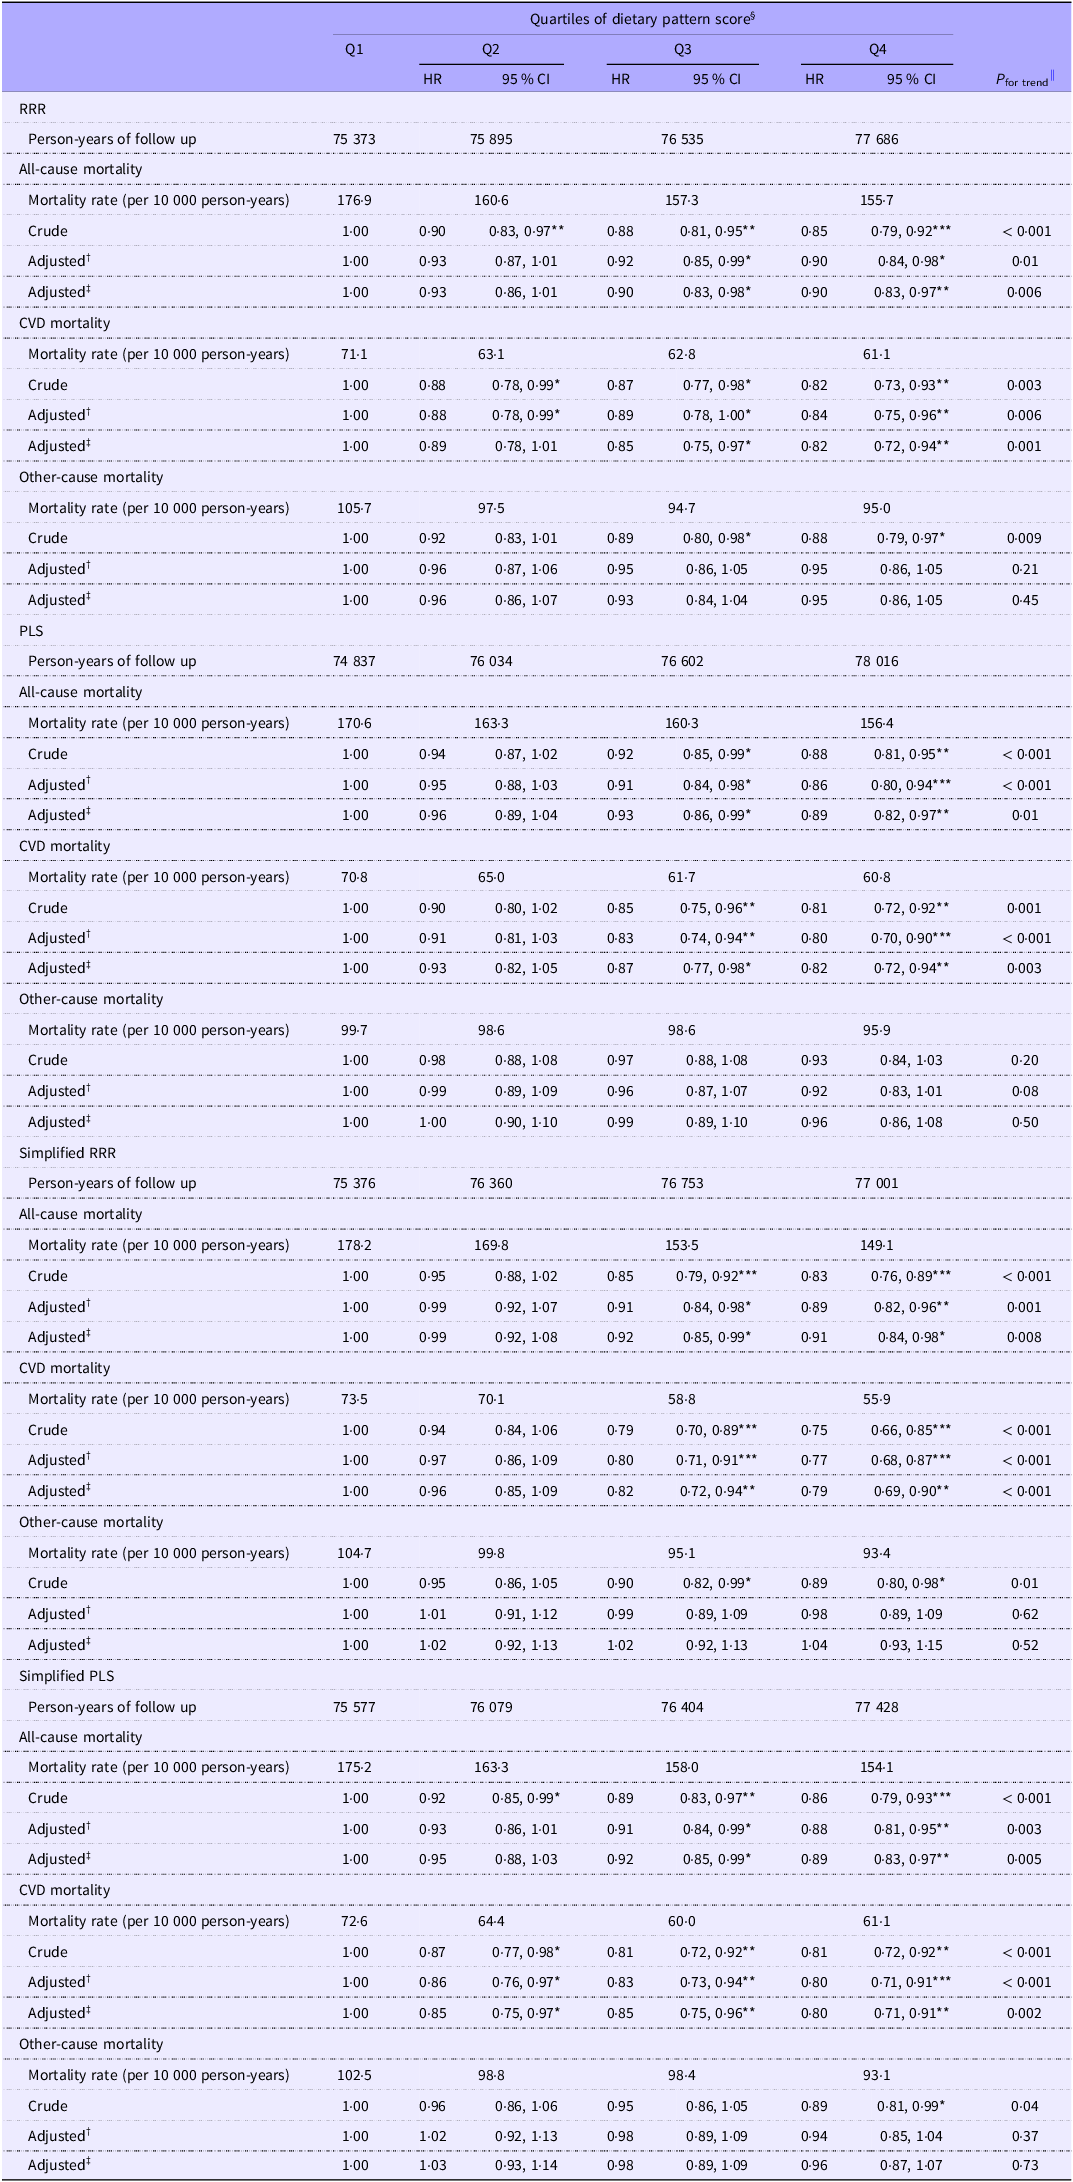
Associations of dietary pattern scores with mortality
Table 2 shows that, compared with the Q1 of RiboKNaC DP score derived from RRR, those with a higher DP score had lower risks of all-cause mortality (Q1: reference, Q2: HR 0·93, 95 % CI 0·86, 1·01, Q3: 0·90, 0·83, 0·98 and Q4: 0·90, 0·83, 0·97, P for trend = 0·006) and CVD mortality (Q1: reference, Q2: HR 0·89, 95 % CI 0·78, 1·01, Q3: 0·85, 0·75, 0·97 and Q4: 0·82, 0·72, 0·94, P for trend = 0·001) after adjustment for eleven confounders. The results for RiboKNaC DP scores derived from PLS and simplified RRR and PLS were similar (Table 2). Online Supplementary Table 5 shows no associations of RiboKNaC DP scores based on RRR and PLS with hypertensive heart disease and pulmonary heart disease mortality. However, the adjusted HRs (95 % CI) for IHD mortality for the Q4 v. the Q1 group of DP score was 0·82 (0·68, 0·99) for RRR. Similar inverse associations were observed for cerebrovascular disease mortality, with adjusted HR for Q4 v. Q1 of 0·80 (95 % CI 0·63, 0·98) for RRR and 0·72 (95 % CI 0·59, 0·90) for PLS. The simplified DP scores based on RRR and PLS showed generally consistent associations.
Association of dietary pattern score quartiles with all-cause, CVD and other-cause mortality in older Chinese of GBCS

GBCS, the Guangzhou Biobank Cohort Study; HR, hazard ratio; RRR, reduced rank regression; PLS, partial least squares.
*P < 0·05; **P < 0·01; ***P < 0·001.
† Adjusted for sex and age.
‡ Adjusted for model 1 plus education level, family income, smoking, alcohol use, physical activity, BMI, history of CVD (excluding stroke or myocardial infarction), diabetes and total energy intake.
§ Multivariable Cox regression was used to calculate HR and 95 % CI of mortality.
|| P-values for trends were estimated by treating the quartiles of dietary pattern scores as continuous variables.
Online Supplementary Figure 2 shows that ARD were consistent with HR. Compared with the Q1 of RiboKNaC DP score derived from RRR, the Q4 had a lower ARD (95 % CI) for all-cause, CVD, IHD and cerebrovascular disease mortality of −15·57 (–26·47, −4·67), −11·00 (–17·11, −3·67), −5·00 (–8·90, −0·28) and −4·50 (–8·33, −0·45) per 10 000 person-years, respectively, at maximum follow-up time. Similarly, the highest quartile of RiboKNaC DP score derived from PLS showed a lower ARD (95 % CI) for all-cause, CVD and cerebrovascular disease mortality of −17·20 (–28·10, −4·69), −10·94 (–28·10, −3·65) and −6·20 (–9·28, −2·20) per 10 000 person-years, respectively. The simplified RRR and simplified PLS scores show generally consistent inverse associations with all-cause, CVD and cerebrovascular disease mortality.
Association of dietary pattern scores with biomarkers
As shown in Table 3, participants in the highest quartile (Q4) of the RiboKNaC DP scores derived from RRR and PLS were associated with lower levels of high-sensitivity C-reactive protein (RRR: –0·16, 95 % CI –0·32, –0·01 mg/l; PLS: –0·18, –0·35, –0·02 mg/l), as well as higher levels of total cholesterol (RRR: 0·06, 0·02, 0·11; PLS: 0·13, 0·08, 0·17 mmol/l) and HDL-cholesterol (RRR: 0·06, 0·04, 0·08; PLS: 0·06, 0·04, 0·08 mmol/l). No significant associations were observed between RiboKNaC DP scores and LDL-cholesterol or DBP. However, compared with the lowest quartile, the highest quartile of the RiboKNaC DP score derived from PLS was associated with lower SBP (–0·95 mmHg, 95 % CI –1·81, –0·10). The simplified RRR and simplified PLS scores showed generally consistent associations. In particular, an inverse association with TAG levels was observed for the simplified RRR score (β –0·07, 95 % CI –0·12, –0·02 mmol/l).
Association of dietary pattern score quartiles with cardiometabolic-related factors in older Chinese of GBCS

GBCS, the Guangzhou Biobank Cohort Study; RRR, reduced rank regression; PLS, partial least squares; CRP, C-reactive protein.
Data are presented as β (95 % CI) unless otherwise indicated. All models adjusted for sex, age, smoking, alcohol use, physical activity, BMI, total energy intake history of CVD (excluding stroke or myocardial infarction) and diabetes.
*P < 0.05, **P < 0.01, ***P < 0.001.
† Multivariable Cox regression was used to calculate hazard ratios (HR) and 95 % CI of mortality.
‡ P-values for trends were estimated by treating the quartiles of dietary pattern scores as continuous variables.
Sensitivity and subgroup analysis
Sensitivity analyses showed similar results after excluding deaths that occurred within the first 3 years of follow-up (online Supplementary Tables 6–7) and further adjustment for the use of aspirin or other antiplatelet medications (online Supplementary Tables 8–9). Online Supplementary Figures 3–4 show no interaction, indicating similar associations across all subgroups.
Discussion
In this cohort study on 19 598 participants with 16 years of follow-up, we first identified the DP targeting key nutrients often inadequate in Asian diets, including riboflavin-density, K:Na ratio and vitamin C-density. These patterns are characterised by higher intakes of green vegetables, yellow/orange fruits and whole grains and low intakes of refined grains and plant oils, with high intake of milk additionally identified by RRR and fish by PLS. Adherence to these nutrient-focused DP was associated with a reduced risk of all-cause and CVD mortality in the Chinese aged 50 years or older. Additionally, the two simplified DP scores showed similar negative associations with all-cause and CVD mortality. Key strengths of this study include the large sample size, long duration of follow-up and the development of healthy DP using hybrid analytical methods in an older Chinese population. Our findings support the potential development of dietary guidelines and nutritional recommendations to reduce mortality, especially CVD-related mortality, in older Chinese.
We searched PubMed using keywords (‘dietary pattern’ or ‘dietary behavior’ and ‘reduced rank regression’ or ‘partial least squares’) with mortality and identified six studies reporting on DP scores and mortality(Reference Lazarova and Jessri29,Reference Gao, Jebb and Aveyard31–Reference Hoffmann, Boeing and Boffetta35) . However, no studies have focused on developing evidence-based healthy DP specifically targeting nutrient insufficiencies such as riboflavin, the K:Na ratio and vitamin C, despite these factors being consistently associated with all-cause and CVD mortality, particularly in Asian populations(Reference Sun, Zhang and Jiang9–Reference Li and Shi12). Moreover, most prior studies relied on a single technique to derive DP, which may fail to capture the complexity of real-world eating behaviours(Reference Hodge and Bassett6). This concern is particularly relevant in Asian populations, where dietary habits exhibit substantial heterogeneity across regions and cultural contexts. Reliance on a single DP derivation approach may incompletely characterise habitual dietary intake and limit the generalisability of findings for informing effective and widely applicable dietary guideline recommendations. Thus, our study pioneered the exploration of DP using a hybrid of two methods, focusing on the four aforementioned mortality-related nutrients, resulting in DP that may be particularly well suited for older Asians. In addition, higher adherence to the RiboKNaC DP was associated with absolute reductions ranging from approximately 4·50 to 17·20 deaths per 10 000 participants across all-cause, CVD, IHD and cerebrovascular disease mortality over the follow-up period, highlighting the potential population-level public health benefits of adopting these DP among older Chinese adults.
The Mediterranean diet, characterised by a higher intakes of vegetables, fruits, whole grains and legumes and low to moderate intake of fish and wine, is similar to our DP derived from RRR and PLS in our study, except for alcohol and legumes intake(Reference Sofi, Cesari and Abbate36,Reference Willett, Sacks and Trichopoulou37) . Meta-analyses and randomised clinical trials have shown that the Mediterranean diet exerted a protective association on the risk of CVD(Reference Rosato, Temple and La Vecchia38,Reference Rees, Takeda and Martin39) . In addition, this study also suggested a high intake of milk and a low intake of refined grains and plant oils. Although lactose intolerance is common in Asian populations, previous studies, including ours, showed that milk intake was negatively associated with all-cause and CVD mortality(Reference Na, Lan and Wang40,Reference Wang, Jiang and Zhang41) , whereas refined grains intake was positively associated with these outcomes(Reference Sun, Zhang and Jiang42,Reference Seal and Brownlee43). Although studies of randomised clinical trials showed that olive oil was associated with a lower risk of CVD mortality, the magnitude of benefit may vary across populations.(Reference Guasch-Ferré, Hu and Martínez-González44,Reference Delgado-Lista, Perez-Martinez and Garcia-Rios45) The Chinese cooking style commonly used heated plant oils, and heating oil could increase lipid oxidation products(Reference Ng, Leong and Masbah46). In line with this, the Chinese dietary guidelines recommend reducing oil intake to prevent chronic diseases(47). In addition, our study shows no significant association between the RiboKNaC DP and other-cause mortality. The DP identified in this study were more strongly associated with CVD mortality than with non-CVD mortality. This may reflect that CVD outcomes are more directly influenced by the dietary components captured in these patterns, whereas non-CVD mortality may be shaped by a wider range of factors, such as genetic predisposition, environmental exposures, infections or medical treatments, which may not be adequately represented by the dietary exposures examined here. Consistent with this interpretation, the GBD study reported that dietary factors accounted for 12·69 % of CVD mortality but only 1·58 % of cancer mortality(3). Therefore, the cardioprotective associations of the identified DP may be more readily detectable for CVD-related outcomes than for other causes of death.
Furthermore, the observed associations between the RiboKNaC DP and cardiometabolic risk factors provide insights into potential biological pathways underlying their cardioprotective associations. Our study found that RiboKNaC DP were positively associated with total cholesterol and HDL-cholesterol levels. Because total cholesterol is a composite measure of LDL-cholesterol, HDL-cholesterol and VLDL-cholesterol, the positive association between RiboKNaC DP scores and total cholesterol appears to be primarily driven by elevated HDL-cholesterol levels, which have been consistently associated with lower risks of all-cause and CVD mortality(Reference Zhong, Huang and Peng48). In addition, a recent review reported that higher intakes of whole grains and fish were associated with improved HDL functionality, including enhanced cholesterol efflux capacity, paraoxonase-1 activity and cholesteryl ester transfer protein activity, providing biological support for our findings(Reference Luna-Castillo, Lin and Muñoz-Valle49). TAG is a well-established risk factor for all-cause and CVD mortality, and the inverse association between TAG and the simplified RRR-based score further supports our results. LDL-cholesterol is strongly influenced by dietary saturated fat, trans fat and cholesterol intake, whereas the RiboKNaC DP were primarily characterised by higher intakes of plant-based foods and micronutrients, which may exert cardioprotective associations through pathways not directly reflected by LDL-cholesterol levels. RiboKNaC DP scores were associated with lower high-sensitivity C-reactive protein levels, likely reflecting intake of orange/yellow fruit and green vegetables rich in vitamin C(Reference Miles and Calder50,Reference Vitamin51) and whole grains rich in fibre(Reference Wallace, Bailey and Blumberg52), which may also lead to lower risks of all-cause and CVD mortality(Reference Ni, Yu and Zhang53,Reference Wannamethee, Lowe and Rumley54) . Additionally, due to high fish intake, we found that RiboKNaC DP score based on PLS was negatively associated with SBP, whereas there was no association of RiboKNaC DP score based on RRR with SBP. Previous reviews showed that moderate fish intake could lower SBP due to n-3 fatty acids intake(Reference Beilin55–Reference Geleijnse, Giltay and Grobbee57). In contrast, no association was observed with DBP, which is more tightly regulated and less responsive to dietary variation, particularly in older adults(Reference Wang, Liu and Shi58). Therefore, these findings suggest that the associations between the RiboKNaC DP and mortality may be partially mediated through non-LDL-dependent lipid pathways, improvements in vascular function and reductions in systemic inflammation.
In our study, riboflavin, K:Na ratio and vitamin C were included as response variables. Riboflavin, primarily found in milk, dairy products and fish, is a key cofactor for the folate-metabolising enzyme.(Reference Pinto and Zempleni59,Reference Jacques, Bostom and Wilson60) Previous studies showed that riboflavin supplementation intake was associated with lower serum homocysteine in individuals homozygous for the TT genotype of the methylenetetrahydrofolate reductase C677T polymorphism, thereby reducing the risk of atherosclerotic disease and cerebrovascular disease(Reference McNulty, Dowey and Strain61–Reference Stehouwer, Weijenberg and van den Berg63). Therefore, riboflavin intake was associated with a lower risk of CVD, which could be mediated by reductions in oxidative stress(Reference Thomas-Valdés, Tostes and Anunciação64).
Dietary K intake is mainly from fruits, vegetables, legumes and whole grains, and the main sources of Na in the diet were salt, soya sauce and fried rice. Most populations worldwide consumed less K than recommended(Reference McLean and Wang65). Due to the potential risk of hyperkalaemia from excessive consumption of K supplements, the WHO specifically recommends increasing dietary intake to reduce the CVD risks(66). In contrast, excessive Na intake was associated with an estimated 1·89 million deaths annually, predominantly due to CVD(67). In addition, to maintain the balance between Na and K, Na:K ratio was a more accurate predictor of CVD risks than dietary Na or K alone(Reference Perez and Chang68,Reference Mirmiran, Bahadoran and Nazeri69) . Therefore, K/Na was a key factor for CVD risks and included as a response variable in this study.
Vitamin C is a potent water-soluble antioxidant in humans and is widely found in fruits and vegetables. However, there is limited evidence showing its association with CVD incidence or mortality. A systematic review showed that vitamin C intake had a dose–response relationship with lower risks of all-cause mortality and CVD risks(Reference Xu, Peng and Zou70). Another review based on three randomised clinical trials showed that vitamin C supplementation showed no associations with CVD incidence or mortality(Reference An, Wan and Luo71). Despite this, previous studies showed that vitamin C can reduce the level of some CVD risk factors. For example, a systematic review based on seven cohort studies, six randomised clinical trials and four meta-analyses showed that vitamin C could inhibit oxidation of LDL-cholesterol and reduce the risk of atherosclerosis(Reference Moser and Chun72). One cross-sectional study also showed that the anti-inflammatory and antioxidant impact of dietary fatty acids on cardiovascular protection in older adults may be mediated by vitamin C intake(Reference Gawron-Skarbek, Guligowska and Prymont-Przymińska73). Therefore, our study also included vitamin C as one of the response variables and found a negative association with the risk of CVD incidence or mortality, probably due to the lowering of the inflammation.
Several limitations should be considered. First, DP were assessed using a single baseline FFQ. Although our previous paper showed that DP of our sample was relatively stable(Reference Xu, Lam and Jiang20), potential changes in DP during follow-up could not be captured and may have attenuated the observed associations towards the null. Third, our findings may not be generalised to younger populations. Fourth, due to different geography and diet culture, the DP may not be applicable to other populations; further studies in different settings are warranted. Fifth, as the biomarkers were measured only at baseline, causal relationships between DP scores and biomarkers could not be confirmed. Finally, although the prevalence of diabetes and hypertension within specific sex and age groups in the GBCS was comparable to those observed in nationally representative samples, GBCS participants were recruited from the GHHARE, representing a relatively healthy group of older people in Guangzhou(Reference Jiang, Thomas and Lam18).
Conclusion
Our study demonstrates that DP addressing key insufficient nutrients in Asian diets were associated with reduced risks of all-cause and CVD mortality among older Chinese. These findings provide evidence to inform the development of dietary guidelines and nutritional recommendations aimed at reducing mortality, especially CVD mortality, in older Chinese.
Supplementary material
For supplementary material/s referred to in this article, please visit https://doi.org/10.1017/S0007114526106849
Acknowledgements
We thank all the authors for their contribution to the study. This work was supported by the National Science Foundation of China (82373661) and the Natural Science Foundation of Guangdong (2022A1515011546).
C. S., L. X., T. H. L., J. W., W. S. Z., Y. L. J., J. W., S. L. A. Y. and K. K. C. have substantial contributions to conception and design, acquisition of funding, data and interpretation of data; C. S., W. S. Z. and L. X. analysed the data; C. S., W. S. Z., J. W. and L. X. drafted the article; and T. H. L., L. X., J. W., S. L. A. Y., K. K. C. and W. S. Z. revised it critically for important intellectual content. LX is the guarantor. All authors contributed to the final approval of the paper.
The authors declare that they have no competing interests.
The study was conducted in accordance with the Declaration of Helsinki and approved by the Guangzhou Medical Ethics Committee of the Chinese Medical Association, Guangzhou, China (IRB No. GWYL-2019-125). All participants provided written informed consent before participation.
Ethical approval in place allows us to share data on requests. Please directly send requests to the Guangzhou Biobank Cohort Study Data Access Committee (gbcsdata@hku.hk).


 Open access