

Changes in lifestyle (increase in the consumption of diets high in saturated fat and/or refined sugars), physical activities and genetic factors play an important role in the development of metabolic disorders including the so-called metabolic syndrome (MS)( Reference Pollex and Hegele 1 ). This syndrome increases the risk of type 2 diabetes and CVD( Reference Bruce and Hanson 2 ). The latter is considered the leading cause of death in Western countries and the world( Reference Gaziano, Bitton and Anand 3 ). As diet plays a key role in these metabolic alterations, there has been an increase in research focused on nutritional and dietary interventions to prevent or improve CVD.
Among other nutrients, soyabean has been widely studied because it contains vegetable proteins of high biological value, bio-active peptides, PUFA, dietary fibre and phytochemicals (e.g. isoflavones and phytate), which may contribute to the reduction of the risk factors of CVD, type 2 diabetes and atherosclerosis( Reference Xiao 4 , Reference Chang, Kim and Kim 5 ). The antioxidant action of isoflavones helps to reduce lipid peroxidation, and the increased HDL-cholesterol levels act as a protective factor against possible cardiovascular events( Reference Kalaiselvan, Kalaivani and Vijayakumar 6 ). Studies in different rodent models of obesity showed that soya protein reduces dyslipidaemia and lipotoxicity in the liver through mechanisms that include reduction of fatty acid (FA) synthesis and increased FA oxidation( Reference Tovar, Torre-Villalvazo and Ochoa 7 , Reference Torre-Villalvazo, Tovar and Ramos-Barragan 8 ), among others. On the other hand, myocardial lipotoxicity (increased TAG, diacylglycerol and ceramide contents) is known to be a contributing factor in the development of diabetic cardiomyopathy( Reference Wende and Abel 9 ). In this regard, Torre-Villalvazo et al.( Reference Torre-Villalvazo, Gonzalez and Aguilar-Salinas 10 ) demonstrated that dietary soya protein prevents lipotoxicity in the heart of rats with diet-induced obesity and in ob/ob mice. In male spontaneous hypertensive rats (SHR), the administration of isolate soya protein decreases systolic blood pressure( Reference Kimura, Chiang and Fujimoto 11 ). Besides, a long-term consumption of soya protein in rats fed a high-fat diet significantly decreased serum glucose and insulin/glucagon ratio and prevented insulin resistance( Reference Noriega-López, Tovar and Gonzalez-Granillo 12 ). Mizushige et al. ( Reference Mizushige, Mizushige and Miyatake 13 ) showed that genistein, one of the main soya isoflavones, suppressed the progression of myocardial fibrosis in Long-Evans Tokushima Otsuka (LETO) rats.
On the other hand, rats chronically fed a sucrose-rich diet (SRD) developed a stable model of dyslipidaemia, insulin resistance, hypertension and visceral adiposity, which mimicked several metabolic abnormalities of the MS in humans( Reference Chicco, Basabe and Karabatas 14 – Reference Bernal, Gutman and Lombardo 17 ). Moreover, the heart of these rats displayed deep alterations of myocardial substrate utilisation leading to increased FA uptake, impaired glucose metabolism and lipotoxicity( Reference Creus, Ferreira and Oliva 18 – Reference D’Alessandro, Chicco and Lombardo 21 ). Along this line, we recently demonstrated that the addition of dietary soya protein instead of casein normalised dyslipidaemia, glucose homoeostasis and adipose tissue dysfunction and improved whole-body insulin sensitivity in rats chronically fed a SRD( Reference Oliva, Chicco and Lombardo 22 – Reference Oliva, Selenscig, D’Alessandro and Chicco 24 ). However, to the best of our knowledge, the possible beneficial effects of dietary soya protein on the mechanisms involved in the altered lipid and glucose metabolism in the heart of these rats have not been investigated. Therefore, we considered that it was worthwhile to explore whether soya protein could improve or even revert the mechanisms underlying the impaired metabolic fate of glucose and lipid metabolism in the heart muscle of a dyslipidaemic, insulin-resistant rat model fed an SRD. In an attempt to answer this question, the present study was designed to evaluate the following aspects in the heart muscle: (a) metabolites and key enzymes activities involved in both the metabolic fate of glucose and the excessive bio-active lipid accretion; (b) the protein levels of fatty acid translocase (FAT/CD36) and GLUT4 at basal conditions and under insulin stimulation; and (c) the protein levels of PPARα, the mitochondrial uncoupling protein 2 (UCP2) involved in the control of heart muscle bioenergetics and total and phosphorylated AMP-activated protein kinase (AMPK) – a metabolic sensor of cellular energy status. Besides, the hydroxyproline content of the left ventricle was analysed as an estimation of collagen deposition. In addition, blood pressure and plasma lipid levels were measured. This study was conducted in rats fed an SRD for 8 months in which the metabolic abnormalities mentioned above were present before casein was replaced by soya as a dietary protein source for the last 4 months of the experimental period in half of the animals.
Methods
Animals
Male Wistar rats initially weighing 170–185 g purchased from the National Institute of Pharmacology were maintained with unrestricted access to water and food under controlled temperature (22±1°C), humidity and airflow condition, with a fixed 12 h light–12 h dark cycle (lights on from 07.00 to 19.00 hours). Adequate measures were taken to minimise the pain or discomfort of the rats and we used the smallest possible number of animals. The animal protocol was approved by the Human and Animal Research Committee of the School of Biochemistry, University of Litoral, Santa Fe, Argentina (FONCYT–PICT no. 945/2012).
Experimental design
The rats were initially fed a standard non-purified diet (Ralston). After 1 week of acclimatisation period, the rats (n 72) were randomly divided into two groups (control and experimental) and were housed individually. The experimental group received a purified SRD (n 48) containing by weight 62·5 (g/100 g) sucrose and the control group received the same purified diet but with sucrose replaced by maize starch (control diet (CD)) (n 24). Details on the composition of the diets are given in Table 1. Both groups received each diet for 4 months. At that time, rats in the SRD group were randomly subdivided into two subgroups. The first subgroup (n 24) continued on the SRD up to 8 months of feeding and the second subgroup (n 24, SRD-S) received the SRD in which the source of protein casein was replaced by soya protein isolate (MP Biomedicals) for the next 4 months. The control group was fed the CD throughout the experimental period. All diets provided approximately 16·30 kJ/g of food and were available ad libitum. Diets were prepared every week. The preparation and handling of diets have been reported elsewhere( Reference Oliva, Chicco and Lombardo 23 , Reference Oliva, Selenscig, D’Alessandro and Chicco 24 ). The weight of each animal and the energy intake were recorded twice per week throughout the experimental period in all groups and subgroups of rats. At the end of the experimental period, food was removed at 07.00 hours (end of the dark period), and unless otherwise indicated experiments were performed under feed conditions.
Composition of the experimental diets (based on the modified American Institute of Nutrition (AIN)-93 diet)

CD, control diet, SRD, sucrose-rich diet; SRD-S, SRD with soya protein.
* Soya protein isolated (MP Biomedicals). Soya protein isolate composition (g/100 g): protein, 92·0; water, 6·0; ash, 4·1; fat, 0·8; fibre, 0·25; carbohydrate, 2·85; Ca, 0·15; P, 0·8; K, 0·05; Na, 1·3; isoflavone, 0·0175; total trypsin inhibitor protein, 4·0–7·3 mg/g.
† AIN-93 VX.
‡ AIN-93M MX.
Analytical methods
Blood pressure was measured in the three dietary groups in conscious animals during the experimental period using CODA TM Monitor of tail-cuff non-invasive blood pressure system (Kent Scientific Corporation), as previously described( Reference Creus, Ferreira and Oliva 18 ). Rats from the three dietary groups were anaesthetised with intraperitoneal sodium pentobarbital (60 mg/kg body weight). Blood samples were obtained from the jugular vein. Plasma TAG, NEFA, total and HDL-cholesterol, glucose and immunoreactive insulin levels were determined as previously described( Reference Hein, Bernasconi and Montanaro 15 ). The heart muscle was totally removed; then, it was weighed and at least in six animals at random in each dietary group the left ventricle was separated and weighed. The heart tissue was stored at the temperature of liquid N2. In the homogenate of frozen heart muscle, the levels of TAG, long-chain acyl CoA (LC ACoA), diacylglycerol (DAG), glycogen and glucose-6-phosphate content were determined as described by D’Alessandro et al. ( Reference D’Alessandro, Chicco and Lombardo 21 ). Hexokinase (HK), pyruvate dehydrogenase complex (PDHc) and muscle-type carnitine palmitoyl transferase 1 (M-CPT1) and CPT2 activities were analysed as recently described by Creus et al. ( Reference Creus, Ferreira and Oliva 18 ).
Determination of hydroxyproline content in the left ventricle
Hydroxyproline content was analysed according to the procedure reported by Neuman & Logan( Reference Neuman and Logan 25 ) with slight modifications. In brief, the myocardial tissue from the left ventricle was hydrolysed with 6 M-HCl at 120°C for 24 h. Hydroxyproline content in the resultant hydrolysate was determined by oxidation with 6 % (v/v) H2O2, followed by a colorimetric reaction with 5 % (w/v) p-dimethylaminobenzaldehyde. The intensity of red product was measured at 540 nm. The amount of hydroxyproline in the unknown sample was calculated using a standard curve of hydroxyproline.
Determination of fatty acid translocase and GLUT4 protein levels during euglycaemic–hyperinsulinaemic clamp studies and protein levels of muscle-type carnitine palmitoyl transferase 1, PPARα, uncoupling protein 2, total and phosphorylated (Thr 172) AMP-activated protein kinase at basal conditions
After 5 h of food deprivation, the heart muscle of six rats from the CD, SRD and SRD-S groups were rapidly removed (time 0 of clamp study) and stored at −80°C for the determination of FAT/CD36( Reference Creus, Ferreira and Oliva 18 ) and GLUT4( Reference Oliva, Chicco and Lombardo 22 ) protein levels. Immediately, in the other six rats from each dietary group, an infusion of highly purified porcine neutral insulin (Actrapid; Novo Nordisk) was administered at 0·8 units/(kg×h) for 120 min. Glycaemia was maintained at a euglycaemic level by infusing glucose at a variable rate. The glucose infusion rate (GIR) during the second hour of the clamp study was taken as the net steady state of the whole-body glucose as previously described( Reference Bernal, Gutman and Lombardo 17 ). At the end of the clamp period, the heart muscle of each dietary group was rapidly removed for the determination of the FAT/CD36 and GLUT4 protein levels. Plasma membrane fractions from heart muscle were prepared as previously described( Reference Creus, Ferreira and Oliva 18 ). Frozen heart powder homogenate from another six rats of each dietary group was used for the basal determination of M-CPT1, PPARα, AMPK and phosphorylated AMP-activated protein kinase (pAMPK) (Thr172) protein levels, whereas in the mitochondrial fraction UCP2 protein level was assessed as previously described by Creus et al. ( Reference Creus, Ferreira and Oliva 18 , Reference Creus, Benmelej, Villafañe and Lombardo 20 ). Protein concentrations were quantified by the Bradford assay (Bio-Rad reagent), separated by SDS-PAGE and transferred to PVDF membranes. Each gel contained an equal number of samples from rats fed a CD, SRD and SRD-S at the beginning (0 min) and at the end (120 min) of the euglycaemic–hyperinsulinaemic clamp for the determinations of FAT/CD36 and GLUT4 and at basal conditions for M-CPT1, PPARα, AMPK, pAMPK (Thr172) and UCP2. The membranes were probed with specific antibodies: rabbit polyclonal anti-FAT/CD36, anti-M-CPT1, anti-PPARα and anti-AMPK or anti-pAMPK (Thr172), goat polyclonal anti-GLUT4 and anti-UCP2, all of them from Santa Cruz Biotechnology, Inc. The blots were incubated with horseradish-peroxidase-linked secondary antibody (Santa Cruz Biotechnology) followed by chemiluminescence detection according to the manufacturer’s instructions (Pierce Biotechnology). β-Actin was used as a loading control. The intensity of the bands was quantified using the National Institute of Health imaging software. After the densitometry of immunoblots, the GLUT4 and the FAT/CD36 of the CD groups at the beginning of the clamp were normalised to 100 %, and both the SRD and SRD-S groups at the beginning and the three dietary groups at the end of the study were expressed relative to this, whereas the densitometry of immunoblots, from M-CPT1, PPARα, UCP2, AMPK and pAMPK, from each CD group was normalised to 100 %, and the SRD and SRD-S groups were expressed relative to this.
Preliminary studies showed linearity of Western blot assays from both GLUT4 and FAT/CD36 from 25 to 100 μg of proteins; from 50 to 150 μg of proteins for M-CPT1 and PPARα; and 25–100 μg of proteins for UCP2, AMPK and pAMPK. The correlation coefficient between the amount of protein and the enhanced chemiluminescence image intensity was 0·97 for FAT/CD36, M-CPT1, UCP2 and AMPK fractions and 0·98 for GLUT4, PPARα and pAMPK fractions. All of them had P<0·01. The relationship between the amount of the sample subjected to immunoblotting and the signal intensity observed was linear under the conditions described above.
Statistical analysis
Sample sizes were calculated on the basis of measurements previously made with rats fed either a CD or an SRD( Reference Creus, Ferreira and Oliva 18 , Reference D’Alessandro, Chicco and Lombardo 21 , Reference Oliva, Chicco and Lombardo 23 ) considering an 80 % power( Reference Glantz 26 ). Results were expressed as mean values with their standard errors. Statistical comparisons were made transversely between different dietary groups. The normal distribution of data was tested using Shapiro–Wilk’s test. The homogeneity of variances was tested using Levene’s test. The statistical significance between groups was determined by one-way ANOVA, with one factor (diet) followed by the Newman–Keuls multiple comparison post hoc test( Reference Snedecor and Cochran 27 ). When appropriate, the statistical significance between the two groups (CD and SRD) was determined by Student’s t test. Differences having P values lower than 0·05 were considered to be statistically significant (SPSS 15.0 for Windows; SPSS Inc.). All reported P values are two-sided.
Results
Body weight, energy intake, total and relative heart and left ventricle weight, plasma metabolite and insulin levels and glucose infusion rate
As previously demonstrated( Reference Oliva, Chicco and Lombardo 22 , Reference Oliva, Selenscig, D’Alessandro and Chicco 24 ) and confirmed in the present work, the increased body weight gain and energy intake recorded in rats fed an SRD were normalised by the administration of soya protein. Both total heart and left ventricle weight significantly increased in SRD-fed rats at the end of the experimental period. However, both parameters expressed relative to 100 g of body weight were similar to those observed in the CD group. The present study shows that total heart and left ventricle weight were similar to those recorded in the CD group after the administration of soya protein. Dietary soya normalised plasma metabolites without changes in insulin levels (Table 2). Besides, the altered GIR value previously observed in the rats fed an SRD was improved in the SRD-S-fed rats. Mean values were as follows: (six animals per group); CD 11·5 (sem 0·8) mg/(kg×min), SRD 4·4 (sem 0·6) mg/(kg×min), SRD-S 8·6 (sem 0·7) mg/(kg×min) (P<0·001 SRD v. CD and SRD-S; P<0·05 CD v. SRD-S).
Body weight, energy intake, total and relative heart and left ventricle weights, plasma metabolite and insulin levels in rats fed a control diet (CD), a sucrose-rich diet (SRD) or an SRD with soya protein (SRD-S)Footnote † (Mean values with their standard errors; n 6)
Mean values were significantly different from those of the CD and SRD-S: * P<0·05, ** P<0·01, ***P<0·001.
† For details of procedures and diets, see the ‘Methods’ section and Table 1.
Blood pressure, heart rate and heart muscle hydroxyproline levels
Fig. 1 shows the time course of systolic and diastolic blood pressure, as well as heart rate, throughout the experimental period in the three dietary groups. From month 1 until the end, the animals fed the SRD showed a significant increase in systolic and diastolic blood pressure compared with the CD-fed group. Similarly, the heart rate of SRD-fed rats significantly increased from month 3 until the end. Soya protein administration in the SRD group (SRD-S) was able to decrease the systolic and diastolic blood pressure after 2 months of ingestion, reaching values similar to those of the control group. A significant decrease of heart rate was just recorded after 1 month of soya protein administration and continued until the end of the experimental period.
Time course of systolic and diastolic blood pressure and heart rate throughout the experimental period in rats fed a control diet (CD, ![]() ), a sucrose-rich diet (SRD,
), a sucrose-rich diet (SRD, ![]() ) or an SRD with soya protein (SRD-S,
) or an SRD with soya protein (SRD-S, ![]() ). Values are means (six animals per group), with their standard errors represented by vertical bars. Systolic and diastolic blood pressure: mean values were significantly different – *CD v. SRD rats; † SRD v. SRD-S rats (P<0·05) at each time point. Heart rate: mean values were significantly different – * CD v. SRD (P<0·05) and ** CD v. SRD rats (P<0·01); † SRD v. SRD-S (P<0·05) and †† SRD v. SRD-S rats (P<0·01) at each time point.
). Values are means (six animals per group), with their standard errors represented by vertical bars. Systolic and diastolic blood pressure: mean values were significantly different – *CD v. SRD rats; † SRD v. SRD-S rats (P<0·05) at each time point. Heart rate: mean values were significantly different – * CD v. SRD (P<0·05) and ** CD v. SRD rats (P<0·01); † SRD v. SRD-S (P<0·05) and †† SRD v. SRD-S rats (P<0·01) at each time point.
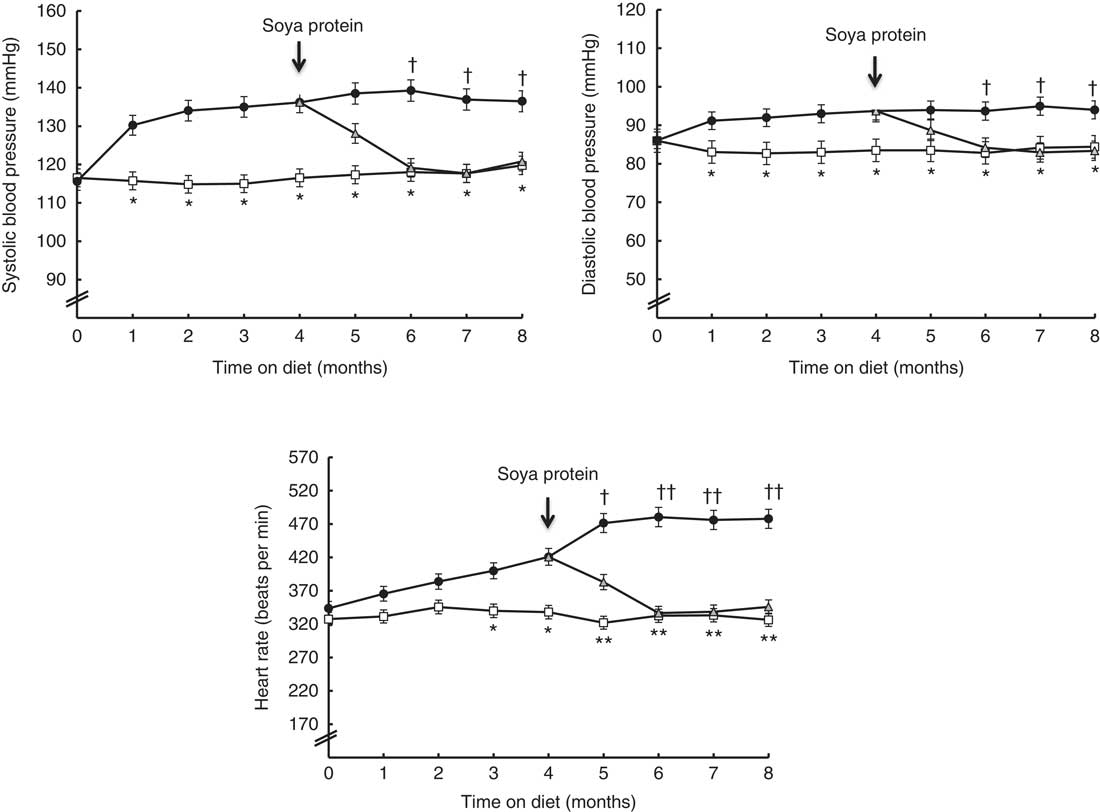
Besides, a significant increase of hydroxyproline contents – as a proportional estimation of myocardial collagen content( Reference Xu, Ding and Pang 28 ) – was recorded in the heart of the SRD-fed group after 4 months on the diet. Mean values were as follows: (six animals per group); CD 459·2 (sem 23·0) µg/g wet tissue, SRD 595·7 (sem 27·0) µg/g wet tissue (P<0·01 SRD v. CD). At the end of the experimental period, the hydroxyproline content was normalised when soya protein replaced casein in the SRD group, reaching values similar to those observed in the control group. Mean values were as follows: (six animals per group); CD 469·8 (sem 20·0) µg/g wet tissue, SRD 605·7 (sem 28·5) µg/g wet tissue and SRD-S 520·6 (sem 25·5) µg/g wet tissue (P<0·01 SRD v. CD; P<0·05 SRD v. SRD-S).
Heart muscle metabolite concentration and enzyme activities
Table 3 shows in the heart muscle of SRD-fed rats a significant decrease of glucose-6-phosphate and glycogen content with a significant increase of lipid storage (TAG, LC ACoA and DAG), in agreement with a previous study( Reference D’Alessandro, Chicco and Lombardo 21 ). This was accompanied by a reduction of HK and PDHa – the active form of the PDHc – activities. The present data show that dietary soya protein was able to normalise these parameters, reaching values similar to those recorded in the CD-fed group. Moreover, the activity of M-CPT1 significantly decreased (P<0·001), reaching values similar to those observed in the control group when soya protein replaced casein in the SRD group, whereas CPT2 activity remained similar in all dietary groups (data not shown).
Metabolite and enzyme activities in heart muscle in rats fed a control diet (CD), a sucrose-rich diet (SRD) or an SRD with soya protein (SRD-S) at the end of experimental periodFootnote † (Mean values with their standard errors; n 6)

DAG, diacylglycerol; LC ACoA, long-chain acyl CoA; HK, hexokinase; PDHc, pyruvate dehydrogenase complex; M-CPT1, muscle-type carnitine palmitoyltransferase 1.
Mean values were significantly different from those of the CD and SRD-S groups: * P<0·05, ** P<0·01, *** P<0·001.
† For details of procedures and diets, see the ‘Methods’ section and Table 1.
Muscle-type carnitine palmitoyl transferase 1, PPARα and uncoupling protein 2 protein levels
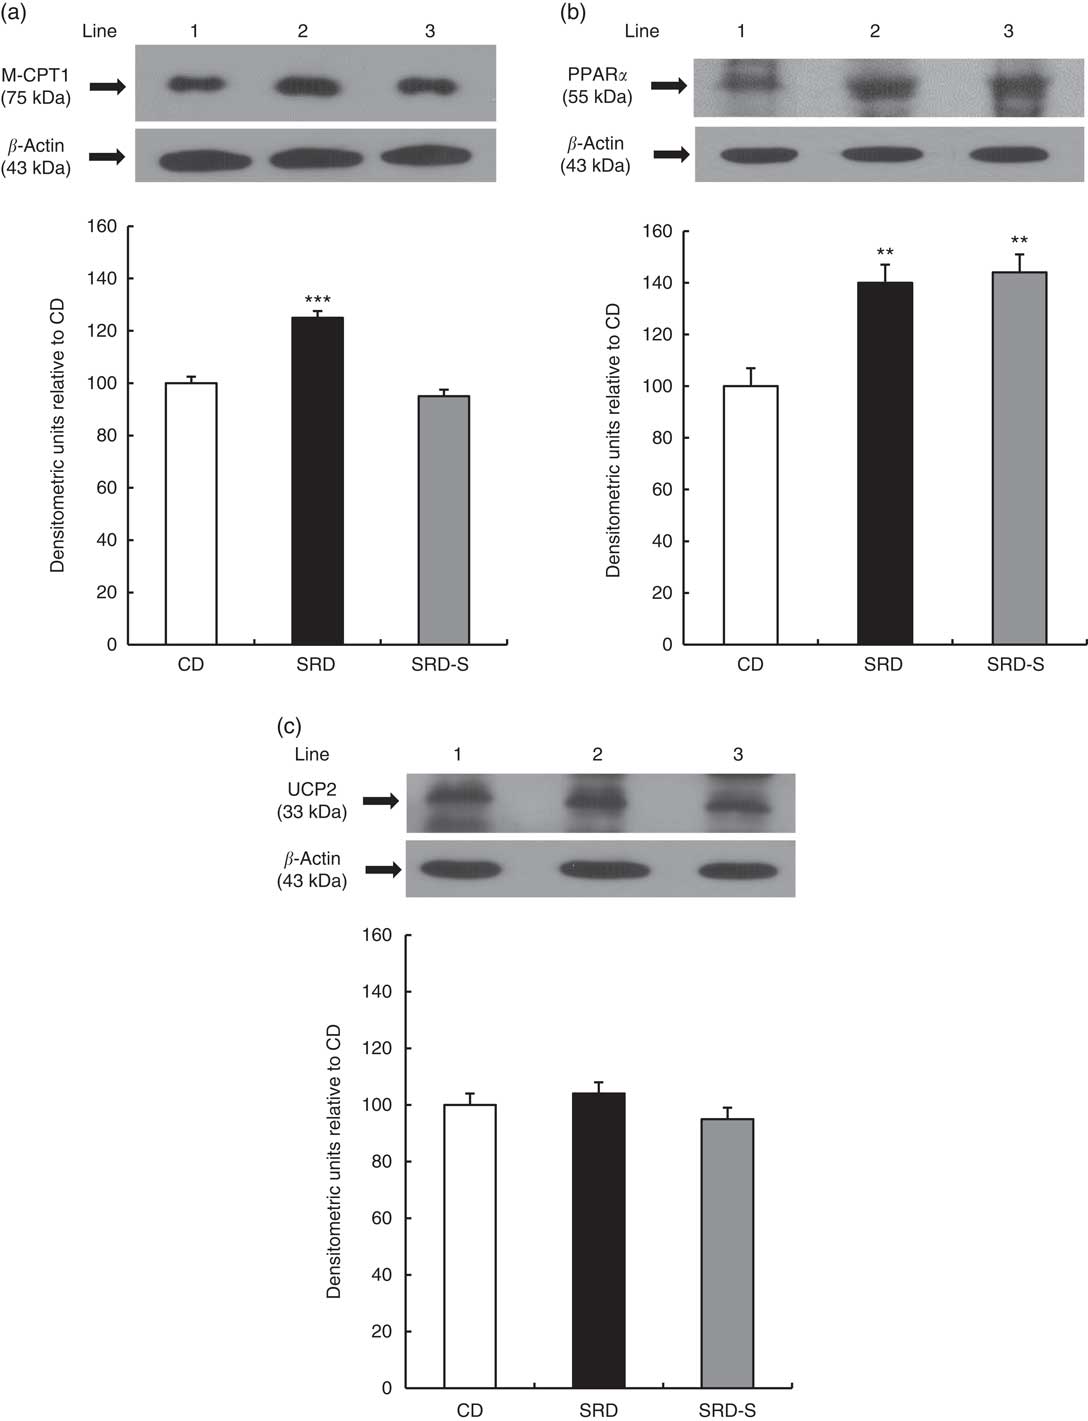
The immunoblotting of the heart muscle revealed a single 75-kDa band consistent with M-CPT1; a 55-kDa band consistent with PPARα; and a 33-kDa band consistent with UCP2 (Fig. 2(a)–(c), top panel). The relative abundance of M-CPT1 protein level that was significantly increased (P<0·001) in the heart of SRD-fed rats decreased in the SRD-S group, reaching values similar to the CD group (Fig. 2(a), bottom panel). Besides, the relative abundance of PPARα that was significantly increased (P<0·01) in the heart of SRD-fed rats was still higher after soya protein administration (Fig. 2(b), bottom panel). Further, no changes in the protein levels of UCP2 in the three dietary groups were observed (Fig. 2(c), bottom panel).
Heart protein levels of muscle-type carnitine palmitoyl transferase 1 (M-CPT1), PPARα and uncoupling protein 2 (UCP2) in rats fed a control diet (CD), a sucrose-rich diet (SRD) or an SRD with soya protein (SRD-S). (a): Top panel: a representative immunoblot of M-CPT1 of heart muscle from CD, SRD or SRD-S. Molecular marker is shown on the right. Lane 1, CD; lane 2, SRD; lane 3, SRD-S. Bottom panel: densitometric immunoblot analysis of M-CPT1 of heart muscle from CD, SRD or SRD-S. (b) Top panel: a representative immunoblot of PPARα of heart muscle from CD, SRD or SRD-S. Molecular marker is shown on the right. Lane 1, CD; lane 2, SRD; lane 3, SRD-S. Bottom panel: densitometric immunoblot analysis of PPARα of heart muscle from CD, SRD or SRD-S. (c) Top panel: a representative immunoblot of UCP2 of heart muscle from CD, SRD or SRD-S. Molecular marker is shown on the right. Lane 1, CD; lane 2, SRD; lane 3, SRD-S. Bottom panel: densitometric immunoblot analysis of UCP2 of heart muscle from CD, SRD or SRD-S. Values are means (six animals per group), with their standard errors represented by vertical bars and expressed as percentage relative to the CD. (a) *** (P<0·001) SRD v. CD and SRD-S; (b) ** (P<0·01) SRD and SRD-S v. CD.
GLUT4 protein level at the beginning and at the end of the euglycaemic–hyperinsulinaemic clamp studies
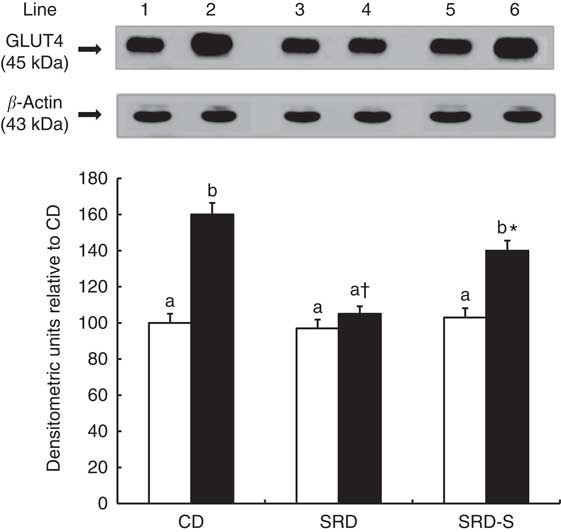
The immunoblotting of lysate heart tissue revealed a single 45-kDa band consistent with GLUT4 (Fig. 3, top panel). At the beginning of the clamp, no differences were observed in the relative abundance of the total plasma membrane of GLUT4 protein between all groups. Under insulin stimulation, the translocation of GLUT4 to the plasma membrane significantly increased in the CD-fed rats, whereas the increase was very low in the SRD-fed group. When soya replaced casein in the SRD-fed rats, the GLUT4 protein level significantly increased (45 %), although values were still lower than those recorded in the control group (Fig. 3, bottom panel).
Heart muscle protein levels of GLUT4 at the beginning (0 min) and under the insulin stimulation at the end (120 min) of the clamp studies in rats fed a control diet (CD), a sucrose-rich diet (SRD) or an SRD with soya protein (SRD-S). Top panel: a representative immunoblot of GLUT4 heart muscle from CD, SRD or SRD-S. Molecular marker is shown on the right. Lane 1, CD 0 min; lane 2, CD 120 min; lane 3, SRD 0 min; lane 4, SRD 120 min; lane 5, SRD-S 0 min; lane 6, SRD-S 120 min. Bottom panel: densitometric immunoblot analysis of GLUT4 heart muscle from CD, SRD or SRD-S at the beginning (0 min, □) and at the end (120 min, ■) of clamp studies. Values are means (six animals per group), with their standard errors represented by vertical bars and expressed as percentage relative to the CD at 0 min of the clamp. a,b Mean values unlike letters were significantly different compared at the beginning and the end of the clamp in each experimental group (P<0·01). * Statistically significant difference (P<0·05) SRD-S v. CD rats at 120 min of the clamp and † (P<0·01) SRD v. CD and SRD-S rats at 120 min of the clamp.
Fatty acid translocase protein level in heart muscle at the beginning and at the end of the euglycaemic–hyperinsulinaemic clamp studies
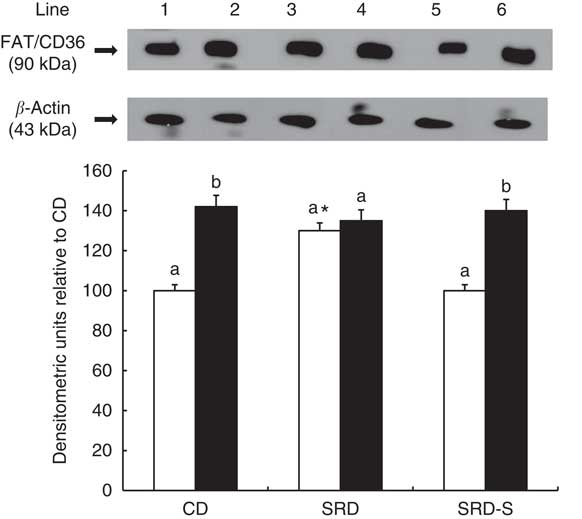
The immunoblotting of the heart muscle revealed a single 90-kDa band consistent with FAT/CD36 (Fig. 4, top panel). Similar to our previous report( Reference Creus, Ferreira and Oliva 18 ), at the beginning of the clamp, a significant increase of the relative abundance of FAT/CD36 in the SRD-fed rats was reached compared with both the CD and SRD-S groups. After insulin stimulation, a significant increase of FAT/CD36 to the sarcolemma was observed in both the CD and SRD-S groups. However, insulin was unable to further recruit FAT/CD36 to the sarcolemma in the SRD-fed rats under the same experimental conditions (Fig. 4, bottom panel).
Heart muscle protein levels of fatty acid translocase (FAT/CD36) at the beginning (0 min) and under the insulin stimulation at the end (120 min) of the clamp studies in rats fed a control diet (CD), a sucrose-rich diet (SRD) or an SRD with soya protein (SRD-S). Top panel: a representative immunoblot of heart FAT/CD36 of rats fed CD, SRD and SRD-S. Molecular marker is shown on the right. Lane 1, CD 0 min; lane 2, CD 120 min; lane 3, SRD 0 min; lane 4, SRD 120 min; lane 5, SRD-S 0 min; lane 6, SRD-S 120 min. Bottom panel: densitometric immunoblot analysis of FAT/CD36 heart muscle from CD, SRD or SRD-S at the beginning (0 min, □) and at the end (120 min, ■) of clamp studies. Values are means (six animals per group), with their standard errors represented by vertical bars and expressed as percentage relative to the CD at 0 min of the clamp. a,b Mean values unlike letters were significantly different compared at the beginning and the end of the clamp in each experimental group (P<0·01). * Statistically significant difference (P<0·01) SRD v. CD and SRD-S rats at 0 min of the clamp.
Total and phosphorylated (Thr 172) AMP-activated protein kinase protein level
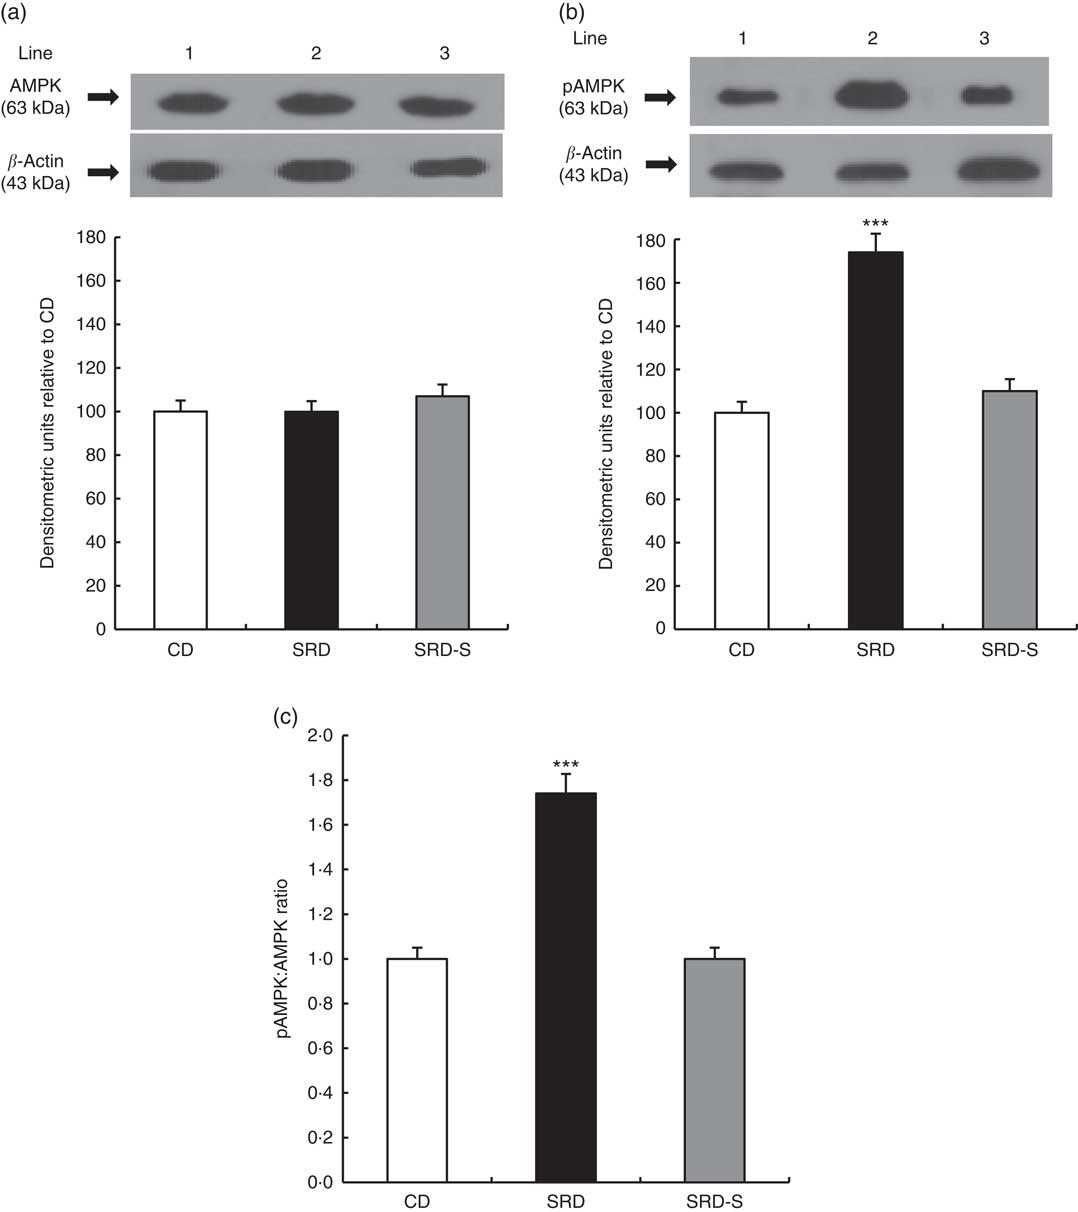
The immunoblotting of lysate heart tissue revealed a single 63-kDa band consistent with the AMPK and pAMPK (Fig. 5(a) and (b), top panel). The relative abundance of AMPK protein level was similar in the three dietary groups, whereas pAMPK significantly increased (P<0·001) in the heart of the SRD-fed group. When casein was replaced by soya protein as a dietary protein (SRD-S), a significant reduction of pAMPK protein level was observed. In this group, values returned to those recorded in the CD-fed rats (Fig. 5(a) and (b), bottom panel). Besides, the significant increase of the pAMPK/AMPK protein level ratio observed in the SRD-fed rats was completely normalised in the SRD-S group (Fig. 5c).
(a) Heart protein levels of AMP-activated protein kinase (AMPK) and phosphorylated AMP-activated protein kinase (pAMPK) (Thr172) in rats fed a control diet (CD), a sucrose-rich diet (SRD) or an SRD with soya protein (SRD-S). (a): Top panel: a representative immunoblot of AMPK of heart muscle from CD, SRD or SRD-S. Molecular marker is shown on the right. Lane 1, CD; lane 2, SRD; lane 3, SRD-S. Bottom panel: densitometric immunoblot analysis of AMPK of heart muscle from CD, SRD or SRD-S. (b): Top panel: a representative immunoblot of pAMPK (Thr172). Molecular marker is shown on the right. Lane 1, CD; lane 2, SRD; lane 3, SRD-S. Bottom panel: densitometric immunoblot analysis of pAMPK of heart muscle from CD, SRD or SRD-S. Values are means (six animals per group), with their standard errors represented by vertical bars and expressed as percentage relative to the control diet. *** (P<0·001). (c) pAMPK:AMPK ratio in rats fed a CD, SRD or SRD-S. Values are means (six animals per group), with their standard errors represented by vertical bars. *** (P<0·001) SRD v. CD and SRD-S.
Discussion
The present study aimed to provide new information on the beneficial effects of dietary soya protein on improving/reversing the underlying mechanisms involved in the impaired glucose metabolism and lipotoxicity induced in the heart of dyslipidaemic, insulin-resistant rats by chronically feeding them a SRD.
Long-chain FA and glucose are the major substrates with which the heart sustains its mechanical performance. It has been established that glucose uptake is the rate-limiting step in glucose utilisation by muscle cells. Similarly, FA uptake is governed by the FA gradient across the sarcolemma, whereas the amount of sarcolemmal FAT/CD36 is a major determinant of their uptake( Reference Luiken, Coort and Koonen 29 ). Confirming a recent study( Reference Creus, Ferreira and Oliva 18 ), our data show a deep alteration of myocardial substrate utilisation and lipotoxicity in the heart of SRD-fed rats. An increase of protein level of FAT/CD36 and impaired insulin-stimulated FAT/CD36 translocation to the plasma membrane were also observed. The increase of plasma FA present in the SRD-fed group contributed to enhance their uptake and oxidation due to Randle glucose-FA cycle. Besides, transcriptional changes caused by the FA induced the nuclear receptor PPARα activation( Reference Gilde, van der Lee and Willemsen 30 ). In this vein, an increase in both the enzymatic activity and protein level of M-CPT1 – a key site of control for the transport and oxidation of FA into the mitochondria – was associated with an increase of the protein level of PPARα. The present new data show that when dietary soya protein replaced casein in the SRD group, the protein level of plasma membrane FAT/CD36 at basal state and the altered translocation under the stimulus of insulin reached values similar to those recorded in the heart of rats fed a CD. This suggests a reduced influx of FA into the heart of the SRD-S-fed group. Besides, the administration of soya protein was able to reverse both the increased protein level and activity of M-CPT1, suggesting an amelioration of FA oxidation. This was accompanied by a decrease in the availability of plasma FA, owing to a significant decrease of the elevated basal lipolysis of adipose tissue( Reference Lombardo and Chicco 16 ) and normalisation of dyslipidaemia in the SRD-fed rats. This in turn led to a reduction of the intramyocellular TAG contents and bio-active lipid deposition in the cardiac muscle, improving their lipotoxicity. Further, the nuclear receptor PPARα protein level was still higher in the SRD-S group. This is an interesting finding considering that, as mentioned above, the activity of M-CPT1, its target enzyme, reached values similar to those of the CD-fed rats. Similarly, Torres-Villalvazo et al. ( Reference Torre-Villalvazo, Gonzalez and Aguilar-Salinas 10 ) showed in rats fed a high-fat diet and in ob/ob mice that dietary soya protein reduced cardiac TAG and cholesterol concentrations, as well as ceramide accumulation associated with both a significant increase of mRNA PPARα and a decrease of mRNA sterol regulatory element binding protein 1c expression. In line with our results, soya protein significantly decreased plasma NEFA, TAG and cholesterol levels.
On the other hand, FA are also thought to play a role in the activity of UCP. Li et al. ( Reference Li, Wang and Gao 31 ) demonstrated that increased FA induced UCP2 expression through PPARα activation in the adult rat cardiomyocytes. An increase of myocardial UCP2 and UCP3 protein expression levels and a decrease of mitochondrial bio-energetic function were also recorded in the heart of C57BL/6 J mice with acute starvation( Reference Wang, Almsherqi and McLachlan 32 ). The heart of lean Zucker rats showed a significant increase of UCP2 and UCP3 gene expression during lipid infusion under an euglycaemic–hyperinsulinaemic clamp( Reference Vettor, Fabris and Serra 33 ). Further, Buchanan et al. ( Reference Buchanan, Mazumder and Hu 34 ) demonstrated an increase of UCP2 and PPARα expression in the heart of ob/ob mice. However, under the present experimental conditions, our results showed no differences in the protein level of UCP2, whereas values were similar in the three dietary groups. At present, we are unaware of other studies that evaluated the effect of a long-term administration of dietary soya protein on the underlying mechanisms involved in the altered lipid uptake and metabolism in the cardiac muscle of a dyslipidaemic insulin-resistant rat model fed a high-sucrose diet. Thus, the new finding collectively suggests that at least one of the possible mechanisms that could contribute to normalise the lipid fuel availability, the uptake and the accretion of intramyocellular fat contents in the heart muscle of SRD-fed rats, may involve the lipid-lowering effect of soya protein.
Insulin plays a key role in the regulation of substrate transport and utilisation in the heart by stimulating both cardiac glucose and FA uptake via GLUT4 and FAT/CD36 translocation, respectively( Reference van Oort, van Doorn and Bonen 35 ). On the other hand, heart muscle intramyocellular FA accretion has been associated with insulin resistance as they could interfere with the activation of insulin signalling pathways involved in the recruitment of GLUT4 to the plasma membrane. Impaired insulin-stimulated glucose uptake in the heart has been described in animal models of diabetes, obesity and hypertension( Reference Deng, Huang and Lu 36 ). In this regard, and confirming previous and recent studies( Reference Creus, Benmelej, Villafañe and Lombardo 20 , Reference D’Alessandro, Chicco and Lombardo 21 ), the hearts of SRD-fed rats display a decline of insulin-stimulated cell surface recruitment of GLUT4 protein level and altered the non-oxidative and oxidative pathways of glucose metabolism. The present new findings show that by shifting dietary casein to soya protein in the SRD-fed group, the GLUT4 protein level significantly increased under the stimulus of insulin. Besides, as mentioned above, a normalisation of the altered transport of FAT/CD36 protein level, as well as lipotoxicity in the heart of the SRD-S group, could favour the significant improvement of GLUT4 trafficking to the plasma membrane. In this vein, Bonen et al.( Reference Bonen, Holloway and Tandon 37 ) demonstrated an inverse relationship between GLUT4 protein level expression and FA transport FAT/CD36 and lipid accumulation in the heart muscle of lean ZDF rats.
The metabolic shift of lipid fate induced by dietary soya protein also ameliorated the altered pathways of glucose metabolism present in the heart of SRD-fed rats. Soya protein was able to normalise glucose phosphorylation (the HK activity reached values similar to those of the CD-fed rats), as well as glucose-6-phosphate and glycogen concentration, within the heart. Furthermore, the increase of PDHc activity recorded in the SRD-S-fed rats suggests that the reduction of FA uptake and oxidation could contribute to the normalisation of glucose oxidation and the impaired balance of heart fuel utilisation. Moreover, glucose homoeostasis and whole-body peripheral insulin sensitivity were significantly improved after soya protein administration. Interestingly, in the skeletal muscle of the same experimental model, we recently demonstrated( Reference Oliva, Chicco and Lombardo 22 ) that dietary soya protein increased insulin-stimulated GLUT4 transporter, reduced the accretion of intracellular lipids and normalised glucose phosphorylation and oxidation, improving insulin sensitivity and plasma glucose levels. In normal rats fed soya protein, Lavigne et al. ( Reference Lavigne, Marette and Jacques 38 ) observed an improvement of fasting glucose tolerance and peripheral insulin sensitivity when compared with rats fed casein.
On the other hand, AMPK – a metabolic monitor of cellular status in the heart – plays a key role in muscle fuel preference and flexibility. In the rat heart, insulin-induced stimulation of PI3-kinase associated with IRS-1 is reduced by AMPK activation( Reference Longnus, Ségalen and Giudicelli 39 ). In agreement with our previous study( Reference Creus, Benmelej, Villafañe and Lombardo 20 ), an increase of the pAMPK protein level and the pAMPK/AMPK ratio was observed in the heart of SRD-fed rats. The present data show that dietary soya protein was able to completely normalise both parameters, which reached levels similar to those observed in the CD-fed rats. Along this line, Konhilas et al.( Reference Konhilas, Chen and Luczak 40 ) recently observed in the heart of sedentary male C57BL/6J mice fed a casein-based diet an increase in the basal expression of AMPKα2 – the most predominant isoform in the heart – compared with mice fed a soya-protein-based diet. On the other hand, Cederroth et al.( Reference Cederroth, Vinciguerra and Gjinovci 41 ) showed that soya diet containing high phyto-oestrogen (genistein and daidzein the most predominant ones) activated AMPK in white adipose tissue, skeletal muscle and liver of male CD-1 mice. It was shown that genistein and daidzein enhanced AMPK phosphorylation in the gastrocnemius muscle of mice fed a high-fat-fructose diet and in db/db mice, respectively( Reference Arunkumar and Anuradha 42 , Reference Cheong, Furuhashi and Ito 43 ). From the above studies, our results might suggest that the low amount of phyto-oestrogens present in the soya protein administered might contribute to a lack of increase of AMPK phosphorylation in the heart of SRD-S-fed rats. However, Samovski et al. ( Reference Samovski, Sun and Pietka 44 ) recently observed in myocytes and other cell types that FAT/CD36 maintained basal AMPK quiescence at low levels of FA. Moreover, an increase of FA induced FAT/CD36 signalling activate AMPK, which disinhibited β-oxidation recruiting more FAT/CD36 to the sarcolemma. The hypolipidaemic effect of soya protein that decreased plasma FA concentration and normalised both heart FAT/CD36 protein level and FA oxidation may be another mechanism involved in the behaviour of AMPK. Further studies are needed to evaluate this issue.
A number of studies have suggested that the consumption of soya protein has favourable effects on obesity as it increases the thermogenesis capacity of UCP1, decreases food intake and increases satiety, reducing body fat and weight gain, among others. In this regard, Oliva et al. ( Reference Oliva, Selenscig, D’Alessandro and Chicco 24 ) demonstrated that when soya replaces casein in the SRD-fed rats during the last 4 months of the feeding period, the amount of food intake, the body weight gain and visceral adiposity are significantly lower than those recorded in rats fed an SRD-casein. Under the same experimental conditions, the present data confirmed these results showing that food intake and body weight gain are lower in SRD-S than those recorded in the age-matched rats fed an SRD-casein. The present study does not analyse the mechanism(s) underlying the effects of soya protein that leads to a reduction of food intake in the SRD-fed rats. However, Nishi et al. ( Reference Nishi, Hara and Tomita 45 ) showed in rats that soyabean β-conglycinin – the main soyabean protein – reduces food intake and gastric emptying by increasing cholecystokinin levels. Furthermore, they also demonstrated that specific fragments of soya peptides rich in arginine residues have strong food intake suppressor activity. Besides, Banz et al. ( Reference Banz, Davis and Peterson 46 ) reported that soya protein rich in isoflavones reduces fat pad mass in Zucker diabetic fatty rats. Thus, it is possible that the mechanisms mentioned above could be involved in the decrease of food intake and body weight gain when soya replaces casein in rats chronically fed an SRD. This in turn might contribute to ameliorate whole-body insulin resistance and dyslipidaemia.
In addition, in agreement with previous results, there was an increase of blood pressure in the SRD-fed rats( Reference Creus, Ferreira and Oliva 18 ). This was accompanied by a significant increase of left ventricle hydroxyproline concentration. The present data demonstrate that the replacement of casein by soya protein normalised blood pressure, decreasing heart rate and the levels of hydroxyproline in the left ventricle of the SRD-S-fed group. A consistent body of evidence from several human and experimental studies has shown an inverse association between soya protein intake and blood pressure. In this vein, Mahn et al.( Reference Mahn, Borrás and Knock 47 ) suggested that consumption of soya protein throughout life substantially reduced blood pressure and improved endothelial function and antioxidant gene expression in 12- to 16-month-old male rats. Yang et al. ( Reference Yang, Yang and Chen 48 ) showed that a long-term administration of soyabean protein hydrolysate might retard the development of hypertension in SHR by its inhibitory effect on angiotensin-converting enzyme in vivo. Furthermore, in these animals, a soya-based diet compared with casein attenuates the development of hypertension( Reference Nevala, Vaskonen and Vehniäinen 49 ). Moreover, soya protein has high arginine and isoflavone contents, which could contribute to their antihypertensive effects( Reference Vasdev and Stuckless 50 ).
On the other hand, Mizushige et al. ( Reference Mizushige, Mizushige and Miyatake 13 ) observed that the administration of genistein was able to decrease hydroxyproline concentration in the heart muscle of LETO rats and significantly suppressed the progression of myocardial fibrosis, although small changes were recorded in OLETF rats. At present, we are not aware of other studies analysing the mechanism/s by which dietary soya protein normalises the blood pressure and the hydroxyproline deposition in the cardiac muscle of SRD-fed rats; thus, we cannot discard the possibility that the different components of the soya protein isolate (e.g. antioxidant effects of isoflavones, phyto-oestrogens, fibre) could be involved in these findings.
In brief, this study provides for the first time new information on the beneficial effects of dietary soya protein to improve some underlying key mechanisms collectively involved in the altered pathways of glucose and lipid metabolism in the heart muscle of a dyslipidaemic insulin-resistant rat model. This nutritional manipulation was also effective in reducing left ventricle hydroxyproline deposition and reversing hypertension. In this context, the normalisation of dyslipidaemia and insulin resistance could protect the cardiac muscle to intra-myocardial lipid deposition. However, whether these effects are due exclusively to soya protein or also associated with isoflavones or other micronutrients present in the protein deserves further studies. Finally, although care must be taken in extrapolating results from rats to humans, soya protein consumption might be considered as a dietary therapeutic approach for these metabolic diseases.
Acknowledgements
The authors thank S. Rodriguez and W Da Ru for their skillful technical assistance.
This investigation was carried out with the financial support of Agencia Nacional de Promoción Científica y Tecnológica (ANPCYT) (grants PICT 945 BID OC/AR 2011) and CONICET PIP no. 105, 2012.
M. E. O. was involved in the design of the experimental protocol and performed the experiments. A. C. was involved in the analysis of protein levels and contributed to the analysis of the results. M. R. F. was involved in the analysis of plasma and tissue metabolites and contributed to the analysis of the results. A. C. was involved in the design of the experimental protocol and discussion of the results. Y. B. L. wrote the manuscript and discussed it with the whole group of authors. There are no conflicts of interest among members of the group.


