


Introduction
The Nebraska Sand Hills (here referred to as Sand Hills) cover an area of more than 50,000 km2, making it the largest dune field in North America (Bleed and Flowerday, Reference Bleed and Flowerday1998). More than two decades of geochronological studies in the region have revealed that the bulk of the sand, especially in the biggest dunes, is Pleistocene in age (Goble et al., Reference Goble, Mason, Loope and Swinehart2004; Miao et al., Reference Miao, Mason, Swinehart, Loope, Hanson, Goble and Liu2007; Mason et al., Reference Mason, Swinehart, Hanson, Loope, Goble, Miao and Schmeisser2011). Large-scale dune movement ceased near the Pleistocene–Holocene transition, when effective moisture increased in the northern and central Great Plains, but the dunes were remobilized multiple times during the Holocene when vegetation cover was disturbed due to prolonged droughts (Goble et al., Reference Goble, Mason, Loope and Swinehart2004; Miao et al., Reference Miao, Mason, Swinehart, Loope, Hanson, Goble and Liu2007; Mason et al., Reference Mason, Swinehart, Hanson, Loope, Goble, Miao and Schmeisser2011). Continual dune movement occurred between about 9600 and 6500 years ago, and large areas were continually active during this time (Miao et al., Reference Miao, Mason, Swinehart, Loope, Hanson, Goble and Liu2007). Later in the Holocene, relatively brief reactivation of the dunes occurred at least three times, with the most recent widespread reactivation dating to around 1000 to 700 years ago (Stokes and Swinehart, Reference Stokes and Swinehart1997; Goble et al., Reference Goble, Mason, Loope and Swinehart2004; Miao et al., Reference Miao, Mason, Swinehart, Loope, Hanson, Goble and Liu2007).
As migrating sand dunes move across the landscape, they can affect surface and subsurface drainage, primarily by dune damming, which has been identified in numerous studies (e.g., Teller et al., Reference Teller, Rutter and Lancaster1990; Svendsen et al., Reference Svendsen, Stolllhofen, Krapf and Stainstreet2003; Roskin et al., Reference Roskin, Bookman, Friesem and Vardi2017; Sweeney et al., Reference Sweeney, McDonald, Chabela and Hanson2020). Blockages of river and stream channels have also been documented in the Sand Hills and in several instances resulted in the formation of lakes behind dune dams (Loope et al., Reference Loope, Swinehart and Mason1995; Mason et al., Reference Mason, Swinehart and Loope1997; Muhs et al., Reference Muhs, Swinehart, Loope, Been, Mahan and Bush2000; Jacobs et al., Reference Jacobs, Fritz and Swinehart2007). For example, in the western Sand Hills, the prolonged emplacement of a series of dune dams on two paleodrainages during the Holocene created a landscape of hundreds of shallow lakes in interdunal valleys that resulted from groundwater discharge behind dune dams (Loope et al., Reference Loope, Swinehart and Mason1995; Loope and Swinehart, Reference Loope and Swinehart2000). This gradual rise in the local water table, as well as subsequent fluctuations in lake depth, are recorded by sequences of peat, gyttja, and sand recovered in lake cores (Mason et al., Reference Mason, Swinehart and Loope1997; Schmieder et al., Reference Schmieder, Fritz, Swinehart, Shinneman, Wolfe, Miller, Daniels, Jacobs and Grimm2011, Reference Schmieder, Fritz, Grimm, Jacobs, Brown, Swinehart and Porter2013).
Lakes are relatively sparse in the central and eastern Sand Hills, where the major drainages, most notably the Dismal and Loup rivers, flow in deeply incised valleys, and the water table lies well below the elevation of most interdunal areas (Loope et al., Reference Loope, Swinehart and Mason1995). Whereas a single upper Pleistocene lacustrine sequence has been found in the Niobrara River valley (Jacobs et al., Reference Jacobs, Fritz and Swinehart2007), no evidence of past river blockages during the Holocene has been reported previously from the central and eastern Sand Hills. However, recently identified buried lake deposits in the incised valley of the South Fork Dismal River (Mandel, Reference Mandel, Bozell, Ziska and Geib2021) suggest that drainage blockage by migrating dunes also occurred in the central Sand Hills.
Lake deposits have long been known to be excellent archives that can be used for reconstructing past climate change (Fritz, Reference Fritz2008; Wolin and Stone, Reference Wolin, Stone, Smol and Stoermer2010), and in many settings, inferred lake-level fluctuations can be interpreted as indicators of shifts between intervals of dry and wet climate. However, in the Sand Hills where groundwater supply is abundant, this relationship is more complex because of the diverse potential interactions of climate, geomorphology, and hydrology. Thus, in some instances, increased lake level may not be an indicator of increased effective moisture, but, instead, may be related to dry conditions that initiated sand movement and its accumulation in drainage channels, resulting in dune damming. At the same time, the porous sands in the Sand Hills region generally favor the infiltration of precipitation into the sandy soils, resulting in recharge to the aquifer (Chen et al., Reference Chen, Chen, Rowe, Hu and Anderson2003). This, in turn, would produce lake-level rise in systems connected to regional groundwater sources. Similarly, a decrease in lake level in dune-dammed lakes may result from a breach or seepage through the dune dam caused by increased stream discharge as a result of higher rainfall, as well as from dry conditions and increased evaporation rates.
Deciphering these intricate relationships between surface water and sand movement, as well as generating regional paleoclimate comparisons and reconstructions, requires documenting the chronology of dune migration and dune-damming events. Although organic-rich sediments in soils and lake sediments are well suited for radiocarbon dating techniques, organic matter is often scarce in alluvial and aeolian deposits in the Sand Hills. However, the quartz-rich sands in the Sand Hills are suitable for optically stimulated luminescence (OSL) dating, which is a method that estimates the last time mineral grains were exposed to sunlight (see Rhodes, Reference Rhodes2011). Thus, if quartz-rich sediments bracket lacustrine sequences, OSL dating can be used in tandem with radiocarbon dating of lake sediments for better chronological control and to improve our understanding of landscape evolution and regional environmental and climatic changes.
This study investigates two stratigraphic sections (Munn 4 and Munn 5) exposed in the South Fork Dismal River valley (Fig. 1). The Dismal River originates in the central Sand Hills, where the North and South Forks discharge through springs that flow directly from sand dunes. Deeply entrenched into interdunal valleys, the river intersects the High Plains Aquifer, which contributes more than 90% of the stream flow (Guhman and Pederson, Reference Guhman and Pederson1992; Chen et al., Reference Chen, Chen, Rowe, Hu and Anderson2003). The river flows at a remarkably steady rate, with little seasonal fluctuation, as the large groundwater reservoir provides a buffering capacity, making it less vulnerable to climatic variability (Chen et al., Reference Chen, Chen, Rowe, Hu and Anderson2003; Winter, Reference Winter2007). Further downstream the river cuts into the Miocene Ogallala Group sediments, but the upstream sections flow through younger Pliocene alluvial deposits and Holocene-aged sands (Guhman and Pederson, Reference Guhman and Pederson1992).
Location of Munn sections along the South Fork Dismal River within the Nebraska Sand Hills. Contour interval is 50 feet. Location of the study area is shown on the inset map, which shows dune-dominated regions in Nebraska in gray. The Nebraska Sand Hills is the large contiguous region of dunes.

The Munn sections contain sandy aeolian and alluvial sediments but also include diatomaceous and organic-rich deposits that accumulated in a former lake (Mandel, Reference Mandel, Bozell, Ziska and Geib2021), possibly formed because of a sand dune blocking the river. In this study we reconstruct the paleoenvironment in the central Sand Hills and evaluate when the lake formed and how long it persisted by coupling analysis of diatoms preserved in the lacustrine sequence with 14C and OSL dating to provide chronological control.
Methods
Munn sections 4 and 5 are exposed in road cuts in the South Fork Dismal River valley, about 7 km upstream from its confluence with the Dismal River. The two stratigraphic sections are located about 275 m apart and consist of sequences of aeolian, alluvial, and lacustrine deposits. Mandel (Reference Mandel, Bozell, Ziska and Geib2021) described the exposures and developed a 14C-based chronology for the deposits.
Samples for diatom analysis were collected at 1 cm intervals from the diatomaceous ooze, including six samples from Munn 4 and 32 samples from Munn 5. Additional samples came from bulk sediment collected from the lacustrine mud, including three samples in each section. Laboratory preparation included dissolving carbonate in 10% hydrochloric acid and organic matter in 30% hydrogen peroxide, after which the cleaned and rinsed samples were mounted on microscope slides using Naphrax mounting medium. At least 300 diatom valves were counted on each slide using a 100× oil immersion objective on a Leica DMRX microscope, except where less than 300 valves were present on the whole slide. Diatoms were identified using standard taxonomic references (Patrick and Reimer, Reference Patrick and Reimer1966, Reference Patrick and Reimer1975; Krammer and Lange-Bertalot, Reference Krammer, Lange-Bertalot, Ettl, Gerloff, Heynig and Mollenhauer1986, Reference Krammer, Lange-Bertalot, Ettl, Gerloff, Heynig and Mollenhauer1988, Reference Krammer, Lange-Bertalot, Ettl, Gerloff, Heynig and Mollenhauer1991a, Reference Krammer, Lange-Bertalot, Ettl, Gärtner, Gerloff, Heynig and Mollenhauer1991b; Hoffman et al., Reference Hofmann, Werum and Lange-Bertalot2011) and other published literature. Diatom species relative abundance was plotted using the C2 data analysis program, version 1.7.7 (Juggins, Reference Juggins2007). Diatom zones were identified based on stratigraphically constrained cluster analysis performed using the PAST software, version 3.26 (Hammer et al., Reference Hammer, Harper and Ryan2001).
Six OSL samples were collected from the sections by inserting light-proof tubes horizontally into the sandy sediments bracketing lacustrine sequences. Before the samples were collected, the sections were cleaned off with a hand shovel to remove any materials that were recently exposed to sunlight. The samples were subsequently processed at the luminescence laboratory at the University of Nebraska-Lincoln following standard protocols. Samples were sieved to separate 150–250 μm sand grains. After sieving, the sediment was treated in hydrochloric acid to remove carbonates, floated in 2.7 g/cm3 sodium polytungstate to remove heavy minerals, and treated in 48% hydrofluoric acid to remove feldspars and etch quartz grains. After another treatment in hydrochloric acid to remove any fluorides, the samples were re-sieved to remove any grains smaller than 150 μm. Quartz grains were mounted on the inner 2 mm of aluminum disks (aliquots). OSL measurements were conducted on a Risø DA-20 luminescence reader using a 240°C preheat temperature, chosen from preheat plateau and dose recovery tests (Wintle and Murray, Reference Wintle and Murray2006). Equivalent dose (De) values were calculated using the single aliquot regenerative (SAR) method (Murray and Wintle, Reference Murray and Wintle2000) on a minimum of 30 accepted aliquots. Individual aliquots were rejected if their recycling ratios were >±10%, if they had measurable signals when exposed to infrared diodes (indicating the presence of feldspars), or if their De values were greater than 3σ from the mean De value. The Central Age Model (CAM) (Galbraith et al., Reference Galbraith, Roberts, Laslett, Yoshida and Olley1999) was used to calculate De values for the determination of the final age estimates. Concentrations of K, U, and Th were calculated using a high-resolution gamma spectrometer to determine environmental dose rate. Equations from Prescott and Hutton (Reference Prescott and Hutton1994) were used to estimate the cosmogenic dose rate contribution, and the final dose rates were calculated following equations from Aitken (Reference Aitken1998), using conversion factors from Guerin et al. (Reference Guérin, Mercier and Adamiec2011).
Particle size analysis was conducted on sediment splits that remained from the OSL samples. These sediments were treated with a 5% solution of sodium hexametaphosphate to disperse clays, and samples were placed on a horizontal shaker for a minimum of 12 hours prior to their analysis. Particle size measurements were completed on a Mastersizer 3000 (Malvern Instruments, Malvern, UK) with the stirrer speed set at 3500 rpm following 60 s sonication.
Eight radiocarbon samples (five charcoal samples and three bulk samples of organic-rich sediment) were collected from lacustrine mud, peat, and fine-grained beds that were found within the sandy sediments. They were analyzed by DirectAMS, Inc. and subsequently calibrated to calendar years (cal yr BP) with CALIB 8.1 using the calibration data set IntCal20 (Reimer et al., Reference Reimer, Austin, Bard, Bayliss, Blackwell, Bronk Ramsey and Butzin2020). An age–depth model, incorporating both 14C and OSL ages, was constructed for each section using the ”Bchron” package in R (Haslett and Parnell, Reference Haslett and Parnell2008). All ages (uncalibrated 14C and OSL after subtracting 70 years from the age estimate to make them comparable with the 1950 BP radiocarbon ages) were uploaded into R. An age–depth model was constructed using the Bchronology function using 2σ error ranges for the ages, sample depths, as well as approximate sample thicknesses. IntCal20 (Reimer et al., Reference Reimer, Austin, Bard, Bayliss, Blackwell, Bronk Ramsey and Butzin2020) was used to calibrate 14C ages, and a normal distribution curve was used for OSL ages.
Results
Stratigraphy
The Munn 4 and 5 sections (Figs. 2–4) expose a number of distinct sedimentary units that likely accumulated in different depositional settings. Munn 4 is about 5 m thick (Fig. 2). The lower 2.5 m of section 4 consists of stratified sandy alluvium characterized by multiple upward-fining sequences, with each sequence capped by a bed of dark grayish brown sandy clay loam that often contains charcoal. Immediately above this sandy sequence is a thin (6–15 cm) layer of banded silty diatomaceous ooze overlain by a 20–40-cm-thick unit of light gray well-sorted fine sand with dark gray fine-grained lacustrine inclusions. The sandy component of this unit is very similar in grain-size composition to the sand below the diatomaceous ooze, with very limited contribution of finer grains and a 94% sand content consisting mostly of fine sand (Table 1). The layer above it is a 30-cm-thick unit of dark gray fine-grained, organic-rich lacustrine mud, capped by a weakly developed soil. The lacustrine mud is mantled by moderately sorted loamy sand that has a larger proportion of finer grains than the sandy units below (6% clay and 18% silt) and a sand component (76%) consisting of very fine, fine, and medium sand. Two buried soils above this unit indicate that at least two subsequent episodes of sand deposition occurred.
Munn Section 4, showing stratigraphy and radiocarbon (circle) and optically stimulated luminescence (OSL) (square) ages. Tape measure is 2 m long. View is to the east.

Munn Section 5, showing stratigraphy and radiocarbon (circle) and optically stimulated luminescence (OSL) (square) ages. Tape measure is 1.7 m long. View is to the east.

Detailed stratigraphic columns with 14C and optically stimulated luminescence (OSL) ages from Munn 4 and Munn 5. 14C ages are calibrated years before present (cal yr BP); OSL ages are calendar years ago (before 2022). Depth is in meters below ground surface. Contour interval on the map is 20 feet; the river flows to the north. Both sections are exposed on the east side of the South Fork Dismal River.

Particle size distribution data in the sandy units of Munn 4 and 5 that were dated with optically stimulated luminescence (OSL).

a Sand fractionation: vfs, very fine sand; fs, fine sand; ms, medium sand; cs, coarse sand; vcs, very coarse sand.
Munn 5 is located upstream from section 4 and is about 2 m thick (Fig. 3). The lower 30 cm is a unit of light gray very well-sorted fine sand (96% sand content, most of which is fine sand). It is mantled by a 30-cm-thick bed of degraded brown peat, which contains plant impressions and casts, as well as small fragments of carbonized plant remains in a silty matrix. The peat layer is mantled by a 40-cm-thick unit of light gray sandy loam composed of 64–68% fine and very fine sand and 24% silt. The clay content in this unit increases from 8 to 12% moving upwards. The deposit of sandy loam is mantled by a lacustrine sequence consisting of a 30-cm-thick layer of diatomaceous ooze, and a 30-cm-thick deposit of dark gray, organic-rich mud like the organic-rich layer in Munn 4. Sandy slopewash derived from an adjacent dune mantles the lacustrine sequence.
Geochronology
Eight previously reported radiocarbon ages (Mandel, Reference Mandel, Bozell, Ziska and Geib2021) and six new OSL ages were used to constrain the chronology of the lacustrine sequence (Figs. 2–4, Tables 2 and 3). In Munn 4, all radiocarbon ages were determined on charcoal. Three charcoal samples came from three different beds of sandy clay loam below the lacustrine sequence at depths between 4.1 and 2.6 m. The three ages ranged between 11,162 and 11,927 calibrated years before present (cal yr BP). Also, charcoal recovered from the middle part of the lacustrine muds in Munn 4 yielded an age of 9964–10,255 cal yr BP. In Munn 5, charcoal from the peat layer below the lake deposit produced an age of 10,813–11,224 cal yr BP. The other three ages were determined on total organic matter (TOM) from bulk sediment samples, each spanning 10 cm within the lacustrine mud. The TOM ages ranged between 8064 and 10,219 cal yr BP.
14C ages from Munn 4 and 5. All ages were determined by accelerator mass spectrometry (AMS). Calibration to calendar years (2σ) was performed with CALIB 8.1 using IntCal20 curve (Reimer et al. Reference Reimer, Austin, Bard, Bayliss, Blackwell, Bronk Ramsey and Butzin2020).

a TOM, total organic matter.
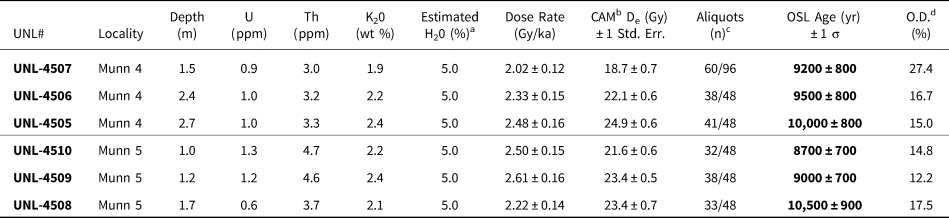
Equivalent dose, environmental dose rate data, and optically stimulated luminescence (OSL) ages from Munn 4 and 5.

aAssumes 50% long-term variability in estimated moisture content bCentral Age Model (Galbraith et al., 1999) cAccepted disks/all disks dOverdispersion
OSL dating targeted the sands that bracket the organic-rich lake deposits. In Munn 4, the fine sand immediately below the diatomaceous ooze was dated to 10,000 ± 800 calendar years ago, a sample from the sandy unit with lacustrine inclusions below the organic-rich muds produced an age of 9500 ± 800 years ago, and the loamy sand 30 cm above the lake sediments was dated to 9200 ± 800 years ago. In Munn 5, OSL samples were only available from sediments below the lacustrine sequence. One came from below the layer of peat and was dated to 10,500 ± 900 years ago. Finally, two OSL ages, 9000 ± 700 and 8700 ± 700 years ago, were determined on samples from the base and top of the sandy loam unit above the peat, respectively, and the uppermost of these two samples was directly below the thick layer of diatomaceous ooze. OSL data indicate well-behaved quartz with very good luminescence characteristics (for example, see Fig. 5), typical of other samples from the Sand Hills. Overdispersion values for five of the six samples ranged between 12.2 and 17.5%. However, one sample (UNL-4507), from the sands overlying the lake sediments at Munn 4, had a higher overdispersion value of 27.4%.
Diagrams showing optically stimulated luminescence (OSL) data for sample UNL-4505 from Munn 4: (a) radial plot of equivalent dose (De) values; (b) OSL shinedown curve; (c) SAR dose response curve.

The age–depth models, which incorporated both 14C and OSL ages, are graphed with a shaded line indicating the depth of lacustrine sediments in each section (Fig. 6). For the Munn 4 profile, the model places the existence of the Dismal River paleolake in the age range of 10,800–9600 cal yr BP. For the Munn 5 locality, it indicates the paleolake existed between about 10,400 and 7400 cal yr BP.
Age–depth models created with the Bchron package in R for Munn 4 and Munn 5. Black line is the best fit line, with blue shading delimiting 25th and 95th quantiles. Shaded band marks the depth of lacustrine sediments in each section.

Diatoms
Munn 5
The diatom assemblage in Munn 5 contains a total of 176 different species, typical of shallow-water environments with abundant vegetation. Several species are often associated with circumneutral to slightly acidic wetland habitats. The assemblage is dominated by small tychoplankton, has a rich benthic component, and a steady presence of planktic species. Dominant benthic taxa include Fragilariforma nitzschioides and members of the genera Cocconeis, Eunotia, Gomphonema, Hantzschia, Meridion, Nitzschia, Pinnularia, Planothidium, and Rhoicosphenia. Tychoplankton include several taxa, of which Pseudostaurosira brevistriata and Staurosira venter are the most abundant, along with moderate percentages of Staurosira binodis and Staurosirella pinnata. Plankton is represented by relatively low (generally <6%) abundances of Ulnaria ulna, Ulnaria delicatissima, and Fragilaria tenera, plus moderate percentages of the Aulacoseira italica/crenulata complex, which increases significantly in abundance upwards through the diatomaceous deposit. Shifts among benthic taxa, fluctuations in planktic Aulacoseira, and the appearance of aerophilic diatoms up-section define five significant stratigraphic diatom zones, numbered 1 to 5 from the bottom to the top of the profile (Fig. 7).
Diatom stratigraphy in Munn 5, showing species with more than 3% relative abundance (x-axis). Diatom zones were defined based on stratigraphically constrained cluster analysis performed using PAST 3.26 (Hammer et al., Reference Hammer, Harper and Ryan2001).

Zone 1
This zone is dominated by tychoplankton, with P. brevistriata/elliptica and S. venter as the most abundant species. Staurosira binodis is also present, and it increases in abundance in the upper half of the zone. These are cosmopolitan taxa, often opportunistic or pioneering species with high reproductive rates, which can quickly adapt to changing conditions (Helmens, Reference Helmens2009). Tychoplanktic species can grow attached to different substrates but can also form chains that can be carried into the plankton by turbulence. A S. venter decrease in the upper half of the zone coincides with an increase in S. binodis, as well as an increase in planktic diatoms. Plankton is represented by small amounts of U. ulna, U. delicatissima, and A. italica/crenulata, whose abundance increases to almost 10% in the upper portion of the zone. Benthic taxa are dominated by F. nitzschioides, a species tolerant of lower pH and often found in streams in marshy areas and bogs (Krammer and Lange-Bertalot, Reference Krammer, Lange-Bertalot, Ettl, Gerloff, Heynig and Mollenhauer1991a; Hofmann et al., Reference Hofmann, Werum and Lange-Bertalot2011). Other benthic species include members of the epiphytic genus Gomphonema, as well as Planothidium lanceolatum, a species that favors streams with sandy substrates (Round and Bukhtiyarova, Reference Round and Bukhtiyarova1996) and Meridion constrictum and Meridion circulare, both indicative of flowing water (Patrick and Reimer, Reference Patrick and Reimer1966).
Zone 2
This zone is characterized by a slight decrease in planktic species. Small tychoplankton still make up at least 30% of the diatom assemblage but decrease slightly in relative abundance in comparison to the previous zone, with the exception of a gradual increase in St. pinnata. Fragilariforma nitzschioides continues to dominate the benthic assemblage, reaching the highest relative abundance of almost 30%, but other benthic taxa also increase in this zone. They include the epiphytic Gomphonema spp., P. lanceolatum, but also taxa of the epipelic genus Nitzschia, as well as M. constrictum and Meridion lineare, suggesting an increase in aquatic vegetation and warm, slowly flowing water over a sandy bottom (Nazarova et al., Reference Nazarova, Grebennikova, Razjigaeva, Ganzey, Belyanina, Arslanov and Kaistrenko2017).
Zone 3
This zone is characterized by the biggest shift in the benthic assemblage. The prior dominant, F. nitzschioides, is replaced by other benthic species. These still include Gomphonema and Nitzschia spp., as well as P. lanceolatum, but with a larger contribution of two epiphytic species, Cocconeis placentula and Rhoicosphenia abbreviata, which appear in this zone in their highest abundance. Both are known to live attached to plants or hard substrates (Krammer and Lange-Bertalot, Reference Krammer, Lange-Bertalot, Ettl, Gerloff, Heynig and Mollenhauer1986, Reference Krammer, Lange-Bertalot, Ettl, Gerloff, Heynig and Mollenhauer1988, Reference Krammer, Lange-Bertalot, Ettl, Gerloff, Heynig and Mollenhauer1991a, Reference Krammer, Lange-Bertalot, Ettl, Gärtner, Gerloff, Heynig and Mollenhauer1991b; Levkov et al., Reference Levkov, Caput Mihalić and Ector2010; Hofmann et al., Reference Hofmann, Werum and Lange-Bertalot2011). Tychoplankton remain prevalent, with a slight increase in S. venter and St. pinnata, both of which indicate the presence of aquatic vegetation in a shallow-water environment with a sandy bottom. Plankton is at its lowest relative abundance in this zone.
Zone 4
This zone represents a big shift in both planktic and benthic assemblages. Whereas small tychoplankton disappear in this zone, A. italica and A. crenulata dominate the plankton and reach their highest relative abundance (>40%). The Aulacoseira genus is typically associated with deeper water levels than the benthic and tychoplanktic taxa, but these heavily silicified diatoms also require higher turbulence to remain in the photic zone and prevent sinking, which implies relatively shallow water prone to wind-induced mixing. Aulacoseira italica is commonly associated with benthic species, in contrast to the associations of other open-water members of Aulacoseira (Crawford et al., Reference Crawford, Likhoshway and Jahn2003). Fragilariforma nitzschioides returns to its previous prevalence in the benthos, but it is accompanied by a significant shift in other benthic species. Rhoicosphenia abbreviata is no longer present, and C. placentula and P. lanceolatum gradually decrease in this zone. They are replaced by a significant increase in Nitzschia amphibia and a larger presence of several species of the genera Eunotia and Pinnularia, both indicative of circumneutral to slightly acidic conditions and often common in marsh/bog environments (Hofmann et al., Reference Hofmann, Werum and Lange-Bertalot2011; Lange-Bertalot et al., Reference Lange-Bertalot, Bak, Witkowski, Tagliaventi and Lange-Bertalot2011).
Zone 5
Zone 5 represents the biggest shift in species composition. All plankton gradually disappear, as do many previously prevalent benthic species, such as F. nitzschioides, P. lanceolatum, as well as members of the genera Eunotia and Gomphonema. Instead, the assemblage is characterized by a significant increase in the abundance of small species from the genus Nitzschia (still dominated by N. amphibia), which make up more than 40% of all diatom species, as well as an abundance of taxa that were absent in the lower zones: members of the genus Epithemia, characteristic of higher alkalinity, and Hantzschia amphioxys, commonly found in terrestrial habitats (Round et al., Reference Round, Crawford and Mann1990; Hoffman et al., Reference Hofmann, Werum and Lange-Bertalot2011).
Munn 4
The diatom assemblage in Munn 4 contains 146 different diatom species (Fig. 8). Only two zones have been identified in this section. Zone 1 encompasses the thin layer of banded silty diatomaceous ooze and resembles Zone 4 in Munn 5 in species composition. It is dominated by A. italica/crenulata and F. nitzschioides, which together account for 30–50% of the diatom assemblage. The rest of the benthos include members of the genera Epithemia, Eunotia, Nitzschia, Gomphonema, and Pinnularia. The species composition of Zone 2 is similar to Munn 5's Zone 5, with indications of shallowing and at least periodic subaerial exposure. It is dominated by the aerophilic H. amphioxys, as well as the alkaliphilic Denticula elegans. Another characteristic of this zone is a sharp decline in diatom abundance, with diatom counts well below 300 valves per slide (only 227, 38, and 81 valves observed on the whole slide in the three samples from bulk lake mud). The valves that are present do not show any signs of partial dissolution or excessive breakage, which suggests that this decline in abundance is not an artifact of poor preservation, but rather a reflection of Munn 4's proximity to the edge of the lake.
Diatom stratigraphy in Munn 4, showing species with more than 3% relative abundance (x-axis). Relative abundance in Zone 2 is based on 227 (*), 38 (**), and 81 (***) valves present. Diatom zones were defined based on visual examination of patterns in the species data.

Discussion
Depositional environments and site stratigraphy
Based on field observations and particle size analysis, we identified four sedimentary facies at the two Munn localities: (1) aeolian fine sand and reworked aeolian fine sand; (2) alluvial silty sand; (3) lacustrine organic mud and diatomaceous ooze; and (4) peat (see Table 4). These facies suggest changing depositional environments likely caused by a rise in the local water table upstream from the emplacement of a dune dam on the South Fork Dismal River. The differences in the sequence and thickness of deposits between the two Munn profiles are attributed to Munn 5 being closer to the river.
Sedimentary facies description and interpretation.

The basal portion of Munn 4 contains several beds of very-well-sorted fine sand, consisting almost entirely of fine and very fine sand with a very limited clay/silt contribution, usually characteristic of aeolian sand in this setting. However, these units fine upwards and lack typical aeolian structures, suggesting they may be reworked dune sediments deposited in flows that were water-dominated, as either slopewash or in alluvial fans. The beds are similar in thickness (20–30 cm), with sharp and irregular contacts between each successive depositional event. They are separated by thin, organic-rich deposits, which may represent a former vegetated surface and resemble the Holocene-age dune-sourced alluvial fan deposits described from the Sand Hills by Sweeney and Loope (Reference Sweeney and Loope2001). Analogous deposits have been reported elsewhere (e.g., Hugenholtz et al., Reference Hugenholtz, Wolfe and Moorman2007; Pomar et al., Reference Pomar, del Valle, Fornós and Gómez-Pujol2018) and have been interpreted as water-dominated flows, when intense rainfall causes dune erosion and sand is transported down eroded gullies. While this interpretation is a possibility, it cannot be fully evaluated without tracing the deposits to an alluvial fan. Alternatively, the fine-grained deposits also resemble flood drapes, especially considering their sharp lower boundaries and the fact that they cap upward-fining sequences, and may be genetically related to the river.
A sand deposit with very similar characteristics and grain-size distribution is present higher up in Munn 4, above the thin accumulation of banded diatomaceous ooze. This unit additionally contains lacustrine inclusions, suggesting at least sporadic deposition in a lake basin, and it likely represents continued episodes of dune erosion and deposition of reworked aeolian sand at the edge of the newly developing lake.
The lowermost unit in the Munn 5 profile, like the basal unit in the Munn 4 profile, also consists of very-well-sorted sand. The sand content is 96% and is dominated by fine sand (71%). This sandy unit lacks any discernible bedding and could have been deposited in a similar fashion to the beds in the lower portion of the Munn 4 profile, i.e., as hyperconcentrated flow sourced from aeolian sand dunes. However, it may have also been deposited in an aeolian environment within a dune or sand sheet, in which case the lack of bedding may be attributed to bioturbation, especially considering it is overlain by a layer of peat, which implies subsequent extensive vegetation cover. On the other hand, OSL data from this unit show relatively low overdispersion values, suggesting that grain inmixing typical of bioturbated sediments is not a significant issue here. If this sand unit had in fact been deposited by wind, it may be correlated with a broader aeolian mobilization in the region at the time (Miao et al., Reference Miao, Mason, Swinehart, Loope, Hanson, Goble and Liu2007), which eventually resulted in sand dunes blocking the river somewhere downstream from both Munn sections.
Immediately above this sand unit is a thick bed of silty peat, which indicates the development of a floodplain marsh, likely due to the water table rising behind the dune blockage on the river. Peat deposits have been identified from multiple locations in the Sand Hills (Loope et al., Reference Loope, Swinehart and Mason1995; Mason et al., Reference Mason, Swinehart and Loope1997; Loope and Swinehart, Reference Loope and Swinehart2000; Nicholson and Swinehart, Reference Nicholson and Swinehart2005; Schmieder et al., Reference Schmieder, Fritz, Swinehart, Shinneman, Wolfe, Miller, Daniels, Jacobs and Grimm2011, Reference Schmieder, Fritz, Grimm, Jacobs, Brown, Swinehart and Porter2013), as well as from other drainages in central Nebraska (May and Holen, Reference May and Holen2014) and are generally interpreted as indicative of either local or regional high water tables. In this case, the local water table likely started to rise upstream from a sand blockage on the river. This silty peat facies is not present in Munn 4, because the initial extent of the inundated area most likely did not reach that locality. The peat is not very well developed, suggesting the marsh did not persist for a long period of time.
Alluvial silty sand is represented by two deposits, one in each section. In Munn 5 it occurs above the layer of peat and below lake sediments. In Munn 4 it is above the lacustrine sequence. This sand is moderately sorted and has a much larger contribution of finer grains than those units that are sourced directly from aeolian sand, showing a slightly bimodal grain-size distribution (see Fig. 9 for the comparison of alluvial and aeolian particle size distributions). It has no discernible bedding, but the two samples available for particle size analysis from Munn 5 show increasing clay content upwards in the unit. We interpret these silty sands as overbank floodplain deposits that accumulated as the river meandered through the wetland. Although the particle size data indicate the sediments are perhaps alluvial, the OSL data for both samples from Munn 5 show surprisingly low overdispersion values, not usually expected of water-lain deposits. However, multiple factors may have contributed to this result. It is possible that grains were well bleached in this presumably very shallow slow-moving stream with low turbidity levels (Rittenour, Reference Rittenour2008; Summa-Nelson and Rittenour, Reference Summa-Nelson and Rittenour2012). In addition, the majority of the grains are sourced from an aeolian environment, and most would likely have carried a uniformly low initial signal from their previous deposition in recently active dunes.
Grain-size distribution of sand sourced from aeolian sand dunes and alluvial sand. The latter show a wider distribution and a distinct fine grain mode.

In contrast, the loamy sand in Munn 4 has the highest value of overdispersion, suggesting the quartz grains were not fully bleached at deposition. This likely indicates faster and more turbulent flow, which is further corroborated by the particle size analysis data for this unit (less clay and more sand, with a higher proportion of medium sand). The deposition of this unit may be associated with increased discharge at the time, which eventually led to the breaching of the dune dam.
Finally, both sections contain deposits representative of a shallow lake environment. They include two distinct units: diatomaceous ooze (unconsolidated diatom-rich sediment as defined in Zahajská et al., Reference Zahajská, Opfergelt, Fritz, Stadmark and Conley2020) and fine-grained organic-rich lacustrine mud. Diatomaceous deposits form in lakes where the diatom accumulation rate outweighs any other sedimentation (Harwood, Reference Harwood, Smol and Stoermer2010). Typically, those are lakes characterized by chemical and physical conditions that favor diatom growth, as well as by limited clastic input from the surrounding environment. Such conditions may be generated by numerous factors, some of which include climatic conditions (for instance very arid conditions with little precipitation and runoff or well-vegetated stabilized landscape which inhibits runoff) and physical properties of the lake, as a larger lake size may preclude coarser clastic sediments from reaching the main lake basin (Jacobs et al., Reference Jacobs, Fritz and Swinehart2007; Wallace, Reference Wallace2003).
The thick diatomaceous unit in Munn 5 likely represents an environment closer to the middle of the lake and farther away from any clastic input. Diatom composition of this unit indicates initial deepening of the lake followed by gradual infilling and shallowing. In Munn 4, the diatomaceous deposit is only 6 cm thick and interbedded with silt, indicating a shoreline environment with more clastic input. Diatoms present in the banded diatomaceous ooze correlate to the uppermost portion of the diatomaceous deposit in Munn 5, when the lake was the deepest and extended all the way to this location.
The rest of the lacustrine sequence consists of dark gray organic-rich mud, which represents a period of higher amounts of clastic input into the lake, when diatom accumulation was no longer exceeding clastic sedimentation. This deposit represents gradual shallowing and infilling of the lake. In Munn 5, that unit is 30 cm thick and sits directly above the diatomaceous ooze. The Munn 4 profile is most likely closer to the edge of the lake, and presumably the initial accumulation of organic mud was disrupted by the input of reworked aeolian sand from the adjacent dunes by sheetwash and gully flows. With continued groundwater rise, the lake deepened and expanded across the river valley, and eventually extended beyond the immediate vicinity of the Munn 4 profile, which also started accumulating muddy lake sediments. Diatom composition at Munn 4 indicates a shallow-water environment with periods of aerial exposure, suggesting close proximity to the edge of the lake.
Chronology
A suite of ages obtained through radiocarbon and OSL dating constrains the timing of the Dismal River paleolake to approximately 10,000–8200 years ago (Figs. 2 and 3, Tables 2 and 3), and our dating indicates that the sediments in both stratigraphic sections are likely deposits from the same lake. For the most part, the ages are stratigraphically correct and some of the inconsistences most likely derive from problems inherent in each dating method and because some of the dated samples came from different facies. To understand these underlying issues, we must consider the processes that formed the deposits and the material that each method dates.
Radiocarbon dating is typically well suited for organic-rich sediments in soils and lakes. However, the necessary assumption is that the death of the dated organism(s) occurred at the same time as the deposition of the sedimentary unit in which they are found. Yet it is not uncommon for organic material to be redeposited in a much younger sedimentary context (Schiffer, Reference Schiffer1986; Wright, Reference Wright2017). Terrestrial plant macrofossils are usually the preferred sample material for radiocarbon analysis in lakes or wetlands, as their age presumably most accurately reflects the time of deposition of the surrounding sediment. However, in their absence, bulk sediment can produce accurate 14C ages, but they are vulnerable to either reservoir effects (i.e., older carbon produces anomalously old ages) or contamination from “younger” carbon introduced by roots and/or mixing processes, which results in ages that are too young (Grimm et al., Reference Grimm, Maher and Nelson2009; Wright, Reference Wright2017; Strunk et al., Reference Strunk, Olsen, Sanei, Rudra and Larsen2020).
OSL dating, on the other hand, targets the actual time of sediment deposition, as it provides an age estimate for the last time quartz grains were exposed to sunlight. This makes it a suitable method for dating quartz-rich aeolian and alluvial units that bracket lacustrine sequences, and it is a useful tool where organic matter is scarce. However, OSL also has inherent problems. Some of these problems are related to estimating the long-term dose rate and stem from challenges in accurately determining the amounts of K, U, and Th, as well as water content in the sediment surrounding a given OSL sample. Furthermore, the technique relies on uniform and complete bleaching at the time of deposition and that no post-depositional mixing of sediment has occurred (Clarke et al., Reference Clarke, Rendell and Wintle1999; Murray and Olley, Reference Murray and Olley2002; Bateman et al., Reference Bateman, Frederick, Jaiswal and Singhvi2003; Bateman et al., Reference Bateman, Boulter, Carr, Frederick, Peter and Wilder2007a, Reference Bateman, Boulter, Carr, Frederick, Peter and Wilder2007b; Hanson et al., Reference Hanson, Mason, Jacobs and Young2015). Therefore, OSL data need to be carefully evaluated for evidence of either younger grain contamination from bioturbation and other mixing processes or the presence of residual older signals from grains that have not been fully bleached. Thus, whenever possible, combining geochronological data obtained from different dating techniques helps ensure the most accurate age determination for a given sedimentary unit.
One of the challenges in quantifiable comparisons of OSL- and 14C-derived ages is that they have different error ranges for the age estimates. Uncalibrated radiocarbon ages typically have very small error ranges (Bronk Ramsey et al., Reference Bronk Ramsey, van der Plicht and Weninger2001; Wright, Reference Wright2017; Manning et al., Reference Manning, Birch, Conger and Sanft2020), whereas those of OSL ages are typically much larger. These larger errors derive both from uncertainties in equivalent dose calculations and issues related to estimating the long-term environmental dose rate. The latter involves estimating the sediment's water content throughout the time of burial, often considered one of the largest sources of error in the final OSL age estimates (Aitken, Reference Aitken1985, Reference Aitken1998; Nelson and Rittenour, Reference Nelson and Rittenour2015). This value is important, because water absorbs some of the radiation that would have otherwise reached the grains and is a challenge in some settings, especially alluvial deposits, where moisture contents may have fluctuated through time.
The Bchron age–depth model facilitated the comparison of the two independent suites of ages used in this study, where the goal was to investigate the stratigraphic and chronological relationships between the sedimentary units and to aid in the overall interpretation of the chronology of the Dismal River paleolake. Bchron utilizes Bayesian statistics and is based on modeling piecewise linear accumulations (Haslett and Parnell, Reference Haslett and Parnell2008; Trachsel and Telford, Reference Trachsel and Telford2017). In Bchron, the consecutive segments of the modeled sequence are treated as independent and unrelated, making it applicable in contexts with abrupt changes in sedimentation rates (Trachsel and Telford, Reference Trachsel and Telford2017). This makes it well suited for use not only with ages obtained through different dating methods, but also ones that come from very different depositional contexts, without continuous sediment accumulation between each sampled unit.
The Bchron models (Fig. 6) provide slightly different age ranges for the Dismal River paleolake at the two Munn localities. The models have very large error ranges for sediments in the lower and upper portions of these sections, but this is likely due to a lack of dated samples from those units. The chronology of the lake in Munn 4 was more tightly constrained because, unlike in Munn 5, it was constructed on ages obtained on sedimentary units below, within, and above the lake sequence. However, this model may be underestimating the length of time the lake persisted because of the potential for an overestimation of the uppermost OSL age. On the other hand, in Munn 5, no ages were available from the sediments above the lacustrine unit, which introduces an unnecessarily large error in the upper part of the section. Furthermore, the large error in the lower part of the lacustrine sequence might result from underestimation of the OSL ages of the underlying alluvial sediments. All of these concerns will be discussed below. Although imperfect because of the aforementioned challenges, the age–depth models do yield decent chronological constraints on the paleolake chronology and a visual aid in identifying potential outliers.
Several ages from both sections warrant further discussion. In Munn 4, all three of the lowermost radiocarbon ages were obtained on charcoal samples extracted from multiple organic-rich deposits that aggraded between successive deposition of reworked aeolian sand units predating the formation of the lake. Two of the charcoal samples produced similar, nearly overlapping ages, but one of them (D-AMS 020836, dated to 11,282–11,738 cal yr BP) lies well outside of the range of the other ages and is apparently older than the underlying sand package, which suggests that this may be reworked charcoal, perhaps incorporated into these sediments from an older fire event (cf. Meyer et al., Reference Meyer, Wells and Jull1995). In this situation, OSL may be better suited, as it provides an age estimate for the actual time of deposition of the sand. Using OSL, we dated the uppermost sand unit, which immediately underlies the lake sediments (banded diatomaceous ooze), to 10,000 ± 800 years ago (UNL-4505), providing a chronological constraint for the initial formation of the lake. That age is younger than the radiocarbon age determined on charcoal a few centimeters above the OSL sample (Fig. 4).
Only one radiocarbon age is available from the lacustrine mud in Munn 4, and it indicates a date for the lower part of this stratigraphic unit of 9964–10,255 cal yr BP. If correct, this age suggests a rapid sedimentation rate at the onset of lake formation, based on error ranges that overlap with the OSL ages below it. The OSL sample from the overlying loamy sand (UNL-4507) should theoretically provide an upper chronological constraint. However, there is reason to believe this age may be somewhat overestimated. Although stratigraphically correct (dated to 9200 ± 800 years ago), UNL-4507 has the highest degree of overdispersion (27.4%), which typically indicates that the sample contains a mix of both younger and older grains. While there are a few grains with relatively low De values, the sample clearly contains a large number of higher values, resulting in a higher overdispersion. This suggests the grains in this sample were not fully bleached at the time of deposition, a result that is not entirely surprising in an alluvial depositional setting (cf. Wallinga, Reference Wallinga2002; Rodnight et al., Reference Rodnight, Duller, Wintle and Tooth2006; Rittenour, Reference Rittenour2008; Rhodes, Reference Rhodes2011). In cases where overdispersion values exceed 25%, the Minimum Age Model (MAM; Galbraith et al., Reference Galbraith, Roberts, Laslett, Yoshida and Olley1999; Galbraith and Roberts, Reference Galbraith and Roberts2012) is commonly used to generate the OSL age. However, this approach only works if the younger De values actually represent the time of deposition, rather than, for example, an inmixing of younger grains due to post-depositional processes. Because sample UNL-4507 was collected in relative proximity (~50 cm) to a soil horizon above it, some of the younger values may have come from quartz grains introduced into the sediment through bioturbation, resulting in an age estimate from the MAM that is deceptively too young (Fig. 10a). In reality, this sand unit is probably not as young as the age calculated using the MAM would suggest. Therefore, we use the age estimate based on the CAM for this sample, even if it provides a slight overestimation. The sample has one very young aliquot, and even though it has passed our rejection criteria, it is very close to the rejection threshold of 3σ from the mean De value. If we were to remove it from our De calculations, the MAM age of this sample falls around 6,000 ± 500 years old (Fig. 10b), corresponding to a period of increased effective moisture in the region, which could be correlated to increased discharge and aggradation of this alluvial unit.
Radial plot of De values for UNL-4507 showing Central Age Model (CAM) and Minimum Age Model (MAM) estimates (a) on 60 accepted aliquots, and (b) on 59 aliquots after rejecting the erroneous very young aliquot.

The lake's persistence beyond 9200 ± 800 years ago is further supported by radiocarbon ages from Munn 5. Three of those ages come from 10-cm-thick bulk radiocarbon samples from the lacustrine sediments. The lowermost sample (D-AMS 020827) is dated to 9906–10,219 cal yr BP and is correlative with a corresponding age from the lacustrine unit in Munn 4. The remaining two ages higher up in this unit are progressively younger and date the upper sediments of the lake to approximately 8200 cal yr BP. It appears that after rapid accumulation of the diatomaceous ooze, the sedimentation rate slowed significantly for the remainder of the duration of the lake. Unfortunately, the top of the lacustrine unit in Munn 5 is mantled by a thin deposit of slopewash, which precluded more detailed observation of the top of the lake sequence and prevented the collection of additional OSL samples from the overlying sediments.
The remaining ages from Munn 5, all from sediments predating the formation of the paleolake, also warrant further discussion. The lowermost radiocarbon age (D-AMS 020832), obtained on charcoal, dates the layer of degraded peat to 10,813–11,224 cal yr BP and is in stratigraphic agreement with the underlying OSL age of 10,500 ± 900 years ago (UNL-4508). These deposits suggest a wetland, which accumulated enough organic matter for subsequent development of peat. That organic matter is covered by a layer of alluvial sand, which produced OSL ages of 9000 ± 700 and 8700 ± 700 years ago. Though stratigraphically correct, these ages appear too young to be below the lake sequence, which is also evident in the large error ranges in the Bchron age–depth model. Both have relatively low values of overdispersion (12.2 and 14.8%, respectively) and do not appear to reflect problems related to the inmixing of younger grains. Instead, the age underestimation likely stems from inaccurately estimating the sediment water content for this sample. In fact, the presence of a peat layer immediately below the alluvial sand may have inhibited water flow through this unit, effectively resulting in this sample having an elevated water content, either sporadically or throughout the last 8000 years. If we use a 15% water content estimation for these two samples, the resultant age estimates of 10,000 ± 900 and 9800 ± 900, respectively, place them in the correct chronological range.
In summary, our evaluation of the chronology suggests that ground water started rising in a dammed channel following the sand blockage of the river, leading to the development of a wetland in the Munn 5 locality sometime around 10,500 years ago. By about 10,000 years ago, continued rise of the water table resulted in a lake spanning both Munn localities, and it persisted until at least 8200 years ago.
Limnological environments
Most diatoms identified in Munn 4 and Munn 5 are freshwater species, typical of shallow lakes with abundant vegetation, and the flora includes a few taxa often associated with circumneutral or slightly acidic wetland habitats. The lower part of the lacustrine sequence contains diatomaceous ooze indicating very high diatom productivity, likely because the lake was fed by silica-rich ground water and had limited clastic input from the watershed during its initial formation. Diatom stratigraphy shows transitions that suggest changes in aquatic vegetation and water depth through time. After the establishment of a shallow marsh, water level gradually increased throughout the diatomaceous sequence, which is consistent with the scenario of a gradual rise of the water table behind a dune dam. The rest of the lacustrine unit shows a gradual decline in water level and periods of desiccation.
The lower two diatom zones, dominated by small tychoplankton, indicate moderately shallow water, but deep enough for the steady presence of plankton, which represents the initial increase in water level as the basin formed following dune damming of the river. The gradual increase in the abundance of plankton through Zone 2 reflects a continued water table rise behind the dune dam. Benthos is dominated by species tolerant of lower pH conditions, often found in streams in marshy areas or bogs, and ones that favor slowly flowing water with a sandy substrate. An increasing abundance of epiphytic diatoms throughout Zone 2 reflects developing wetland vegetation.
Zone 3 represents a period of established marsh and expansion of aquatic vegetation. Although plankton is at its lowest relative abundance and benthos dominates in this zone, it does not necessarily indicate a decreased lake level, especially given that tychoplankton remain prevalent. It simply reflects expansion of epiphytic species as their habitat increases when the lake becomes overgrown with vegetation.
Epiphytic diatoms disappear in Zone 4, which is dominated by the planktic A. italica/crenulata complex and represents the deepest phase of the lake. This supports the interpretation of a continual gradual rise of the water table, as the river remained dammed. Fragilariforma nitzschioides is prevalent in the benthos again, with a large contribution of species from the genus Eunotia, both good indicators of low pH and low nutrient waters (Patrick and Reimer, Reference Patrick and Reimer1966; Round et al., Reference Round, Crawford and Mann1990; Krammer and Lange-Bertalot, Reference Krammer, Lange-Bertalot, Ettl, Gerloff, Heynig and Mollenhauer1991a; Lange-Bertalot et al., Reference Lange-Bertalot, Bak, Witkowski, Tagliaventi and Lange-Bertalot2011) and often found in lakes surrounded by bogs or wetlands (Liu et al., Reference Liu, Wang and Fu2011; Carballeira and Pontevedra-Pombal, Reference Carballeira and Pontevedra-Pombal2020). This is also the time when the lake area expands to span both Munn localities. The species composition of this zone correlates to the lowest zone in Munn 4, although this location represents a habitat closer to the edge of the lake, which allowed for more allochthonous clastic input resulting in the accumulation of thinner diatomaceous ooze that is interbedded with silt.
The upper part of the lacustrine sequence encompasses most of the muddy organic sediments and represents a gradual decline in lake level. It is defined by a complete shift in diatom species composition. All previously dominant taxa disappear, and the assemblage is dominated by N. amphibia, a few species in the genus Epithemia, and H. amphioxys, indicating higher alkalinity and very shallow-water environments with periodic aerial exposure (cf. Gaiser and Rühland, Reference Gaiser, Rühland, Smol and Stoermer2010). The upper diatom zone at the Munn 4 locality has a similar species composition to the uppermost zone in Munn 5, but it is characterized by a very limited presence of diatoms. It is dominated by alkaliphilic D. elegans and aerophilic H. amphioxys, indicating a higher evaporation rate and prolonged aerial exposure at the edge of the lake.
Lake formation
The Dismal River paleolake most likely originated because of sand dunes damming the ancient South Fork Dismal River valley. Although alluvial fans sourced from sand dunes cannot be ruled out as a source of the blockage, the small scale of those deposits and their episodic nature likely preclude sufficient sand accumulation to effectively block a river channel in the way that sustained aeolian activity could (Loope et al., Reference Loope, Swinehart and Mason1995; Sweeney and Loope, Reference Sweeney and Loope2001). Other mechanisms for lake formation, such as the formation of an oxbow lake, are not likely to have occurred in this instance, as the valley is very narrow and has been since the large dunes in the surrounding area were stabilized in the late Pleistocene (Mason et al., Reference Mason, Swinehart, Hanson, Loope, Goble, Miao and Schmeisser2011).
The hypothesis of a gradual rise of the water table behind a sand dune dam on the river is supported by diatom analysis, which reveals a steady lake-level increase at the initial stage of lake formation, followed by a gradual decrease, as muddy lake sediments filled the basin. The chronology suggests a final breach of the dune dam sometime after 8200 years ago, but before 6000 years ago, based on the minimum age of the alluvial sands above the lake deposits. A warmer moist climate documented in the region after about 6500 years ago (Goble et al., Reference Goble, Mason, Loope and Swinehart2004; Nicholson and Swinehart, Reference Nicholson and Swinehart2005; Miao et al., Reference Miao, Mason, Swinehart, Loope, Hanson, Goble and Liu2007; Schmieder et al., Reference Schmieder, Fritz, Grimm, Jacobs, Brown, Swinehart and Porter2013) may have contributed to increased river discharge capable of breaching the dam, eventually resulting in a decline in the local groundwater table and ultimately producing the deeply incised drainages documented in the central Great Plains (Mandel, Reference Mandel2008; May and Holen, Reference May and Holen2014).
Differences in the sedimentary sequences of the two Munn sections also suggest that lake formation was a result of a local water table rise. Although Munn 5 is further upstream from the presumed location of the dune dam, it is first to show its effects (formation of a wetland) because of its closer proximity to the river channel at the time. When the lake formed and gradually deepened, Munn 5 was in an open-water environment, as evidenced by a thick unit of diatomaceous ooze, whereas Munn 4, located further away from the blocked river, was in the littoral zone, which is indicated by a thin banded diatomaceous unit. The presence of lacustrine mud in both profiles suggests the water table continued to rise at both Munn localities (Fig. 11).
Series of schematic diagrams showing interpretive reconstruction of the history of the Dismal River paleolake. Approximate elevation in meters above sea level (m asl); horizontal distance not to scale. River channel position is approximate and schematic, only to show its position in relationship to each of the Munn sections and to illustrate the successive depositional events. (a) Reworked aeolian sand is deposited at both exposures either as alluvial fans sourced from sand dunes or through intermittent fluvial activity. (b) After a sand dune dams the river channel downstream from Munn 4, ground water begins to rise, and a wetland forms in the floodplain encompassing the Munn 5 locality; Munn 4 is just beyond the extent of the wetland, and episodic accumulation of dune-sourced alluvial fan deposits continues in that location. (c) Alluvial overbank floodplain deposits from a meandering channel flowing through the wetland accumulate at Munn 5; occasional alluvial fan deposition continues at Munn 4. (d) As ground water continues rising, a lake forms and diatomaceous ooze begins accumulating, first in Munn 5, and as the lake gradually deepens and expands, it eventually reaches the Munn 4 locality; much of the time, Munn 4 remains at the edge of the lake, as banded diatomaceous ooze accumulates, and dune-sourced alluvial fans terminate at the edge lake mantling muddy lake deposits. (e) At its deepest phase the lake extends across both locations, and lacustrine mud accumulates. (f) Sometime after 8200 years ago (or as recent as about 6000 years ago) alluvial sand is deposited, probably shortly after the dune dam is breeched.

In the western Sand Hills, a river blockage by dune dams in the Early Holocene caused the water table to rise more than 25 m, creating thousands of shallow lakes and marshes in interdunal valleys (Loope et al., Reference Loope, Swinehart and Mason1995; Mason et al., Reference Mason, Swinehart and Loope1997), many of which still exist today. In contrast, the dam on the South Fork Dismal River clearly was not as effective and long-lived, likely because of higher rainfall and higher groundwater discharge in the central Sand Hills region. It is unclear whether the higher water table in our study area in the Early Holocene ever reached adjacent interdunal valleys to create a similar landscape of shallow lakes in this part of the Sand Hills. Surveys along a number of drainages in central Nebraska have documented peat and organic-rich deposits positioned high above current stream elevations (Ahlbrandt et al. Reference Ahlbrandt, Swinehart, Maroney, Brookfield and Ahlbrandt1983; Mandel, Reference Mandel2008, Reference Mandel, Bozell, Ziska and Geib2021; May and Holen, Reference May and Holen2014; Layzell and Mandel, Reference Layzell and Mandel2020), but more research of interdunal locations is needed to determine whether a record of such lakes exists, even if the high water table did not persist in this region for as long as it has in the western Sand Hills.
Climate
Multiple lines of evidence from the Sand Hills have revealed climatic shifts and changes in effective moisture during the Holocene, with periods of drought typically marked by sustained aeolian activity. Our numerical dating at the Munn sections indicates that the blockage of the river occurred about 10,500 years ago, which is correlative with examples of dune-dam emplacement in other locations in the Sand Hills (cf. Loope et al., Reference Loope, Swinehart and Mason1995; Mason et al., Reference Mason, Swinehart and Loope1997; Muhs et al., Reference Muhs, Swinehart, Loope, Been, Mahan and Bush2000), although somewhat earlier than region-wide sand dune activation that dates to 9600–6500 years ago (cf. Miao et al., Reference Miao, Mason, Swinehart, Loope, Hanson, Goble and Liu2007). Just prior to and during the early stages of lake formation in our study area, sandy sediment may have washed off alluvial fans sourced from sand dunes adjacent to the river valley and deposited on the valley floor. Although these sand-flow events do not typically happen in fully active sand dunes (Sweeney and Loope, Reference Sweeney and Loope2001), sparse vegetation is a key factor. A gradual transition to drier climatic conditions during the Early Holocene may have reduced vegetative cover in the area sufficient to mobilize sand and to begin accumulating and blocking the drainage, while the sparsely vegetated dune slopes adjacent to the river valley were exposed to occasional storms strong enough to cause gully erosion and alluvial fan deposition.
Changes in lake level also provide evidence of generally dry climatic conditions during the initial part of the sequence recorded here. The first few phases of lake history record a steady lake-level rise, which in this instance is a product of a lake created by the water table rising behind a dune dam during an interval of dry climate, rather than a period of increased precipitation. As sustained sand accumulation worked to reinforce the dam on the river, continued groundwater rise was reflected in corresponding lake-level rise. Dry conditions persisted as the lake gradually became shallower later in its history (10,000–8200 years ago). The presence of diatoms indicative of slightly saline and alkaline waters in the upper portion of the lake sequence suggests that low precipitation and high evaporation rates contributed to the falling lake level, rather than solely physical processes, such as potential seepage through the porous sands of the dam.
The exact timing of the breach of the dam that drained the lake is not certain, as we do not have definitive age control on the sediments above the lake deposits. However, the minimum age for the alluvial sands above the lake sequence in Munn 4 correlate with a region-wide increase in effective moisture that started around 6500 years ago (Miao et al., Reference Miao, Mason, Swinehart, Loope, Hanson, Goble and Liu2007; Schmieder et al., Reference Schmieder, Fritz, Grimm, Jacobs, Brown, Swinehart and Porter2013). Higher rainfall and greater groundwater discharge likely resulted in the breaching and removal of the dune dam at this time. The increase in groundwater discharge may have been associated with the ongoing headward extension of the Dismal River and many other streams and rivers in the Sand Hills throughout the Holocene (Mason et al., Reference Mason, Swinehart, Loope, Lancaster and Hesp2020). In the modern-day Dismal River valley, sapping associated with boiling sand springs can create pathways for surface runoff from upland interdunal valleys to reach the river (Guhman and Pederson, Reference Guhman and Pederson1992). If these processes have analogs in the past, they would have facilitated headward extension of the river and contributed to increased discharge into the stream from a progressively larger area, making dune-dam breaching increasingly likely.
Conclusion
A sequence of deposits exposed in the incised valley of the South Fork Dismal River revealed the existence of a lake in this location during the Early Holocene. We used diatoms to reconstruct the lacustrine environment, and OSL and 14C dating to determine when the lake formed and how long it persisted. Following a sand dune blockage of the river channel around 11,000 years ago, the rise of the local water table upstream from the dune dam initially caused development of a wetland and, subsequently, the formation of a lake that spanned the river valley and persisted for at least 2000 years. After a period of drought, which ended in the region around 6500 years ago, increased groundwater discharge likely caused the breaching of the dune dam and, consequently, a decline of the water table, causing deep incision of stream channels in the river valleys in the region. Further research is needed to determine whether the formation of lakes in the Sand Hills during the Early Holocene was restricted to river valleys that experienced dune damming, or if the water table was high enough to fill adjacent interdunal areas, thereby creating many lakes in this region at that time.
As we carefully consider multiple lines of evidence to examine the intricate relationships between ground water, surface water, and sand movement, this study demonstrates that dune field environments provide a unique opportunity to investigate environmental change and the complex nature of the hydrologic system's response to climate change. Our analysis also illustrates the benefits of using multiple dating techniques to constrain the chronology of these dynamic processes to ensure the usage of the best-suited methods to date sediments from varying depositional settings.
Acknowledgments
Nebraska State Historical Society and the Nebraska Geological Society provided funding for this project. We thank Rob Bozell for his help with planning and conducting fieldwork and the Munn Ranch for granting access to their property. The manuscript was improved following helpful comments from Joe Mason and an anonymous reviewer.
Competing interests
All authors declare that they have no conflicts of interest.


 Open access