

Introduction
Hubbard Glacier, the largest calving glacier on the North American continent, has been advancing since it was first mapped by the International Boundary Commission in 1895 (Reference DavidsonDavidson,1903). The advance has been slow but persistent, amounting to 2.5 km since 1895, and has occurred during a period when most other glaciers in Alaska and northwestern Canada have thinned and retreated (e.g. Reference Arendt, Echelmeyer, Harrison, Lingle and ValentineArendt and others, 2002). This atypical behavior is the theoretically predicted consequence of being in the advance phase of the calving glacier cycle. The calving glacier cycle was described by Reference PostPost (1975,Reference Post1980a,Reference Postb, Reference Postc, Reference Postd) as an explanation for the alternating slow advances and rapid retreats that have persisted throughout the middle and late Holocene of nearly all of Alaska’s calving glaciers. Here we discuss recent investigations of this calving glacier that document its anomalous advance and indifference to the global changes that are causing most glaciers to lose mass rapidly and retreat.
Background
Hubbard Glacier is currently about 123 km long, with a calving face that is 11.4 km in width and, seasonally, as high as 100 m a.s.l. Ice radar thickness measurements in August 1986 (Reference MayoMayo, 1989; Reference Trabant, Krimmel and PostTrabant and others, 1991) showed that the glacier bed reaches as deep as 414 m below sea level about 1.5km upstream from the terminus.
Hubbard Glacier has a long documented history. It filled all of Yakutat Bay (Fig. 1) in about AD1130 (Reference Plafker and MillerPlafker and Miller, 1958). Reference RussellRussell (1891) and Reference GilbertGilbert (1904), interpreting records of the visits by A. Malaspina in 1792 and G. Vancouver in 1794, place the terminus of Hubbard Glacier south of Haenke Island (Fig. 1); this implies a 660 year retreat that averaged about 80ma−1. Reference Tarr and MartinTarr and Martin (1914) report that Russian maps dating from the early 1800s show the terminus just north of Haenke Island and a lake in the Russell Fjord basin. The oral history of the Tlingit Indians of Yakutat includes a description of the emptying of the lake in Russell Fjord about 1860 (Reference de Lagunade Laguna, 1972). Reference RussellRussell’s (1891) map shows the terminus about 2 km north of Osier Island. The retreat between 1794 and 1891 also averaged about 80 ma−1. During his second visit, Reference Russell and PowellRussell (1893) recognized that the fjord, which was later named for him, had been a glacier-dammed lake. The first surveyed position of the terminus of Hubbard Glacier was produced by the International Boundary Commission in 1895 (Reference DavidsonDavidson,1903). Most of the 20th-century literature is cited in Reference MayoMayo (1988) and Reference Trabant, Krimmel and PostTrabant and others (1991).
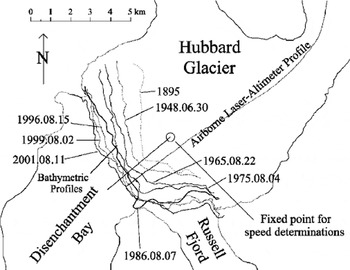
Hubbard Glacier study area. The lines on Hubbard Glacier are the airborne laser profiles flown on 2 May 2000 and 6 June 2001.

The Calving Glacier Cycle
Reference PostPost (1975) described the processes that control the advance and retreat cycles of calving temperate glaciers. The original description has been augmented by Reference Trabant, Krimmel and PostTrabant and others (1991), Reference Motyka, Post and EngstromMotyka and Post (1995) and Reference Post and MotykaPost and Motyka (1995). The tenets of the hypothesis are that: (1) the primary factor that influences the advance and retreat of temperate calving glaciers is the water depth at the calving face; (2) the cycling is not directly related to climate, except perhaps for the initiation of retreat; and (3) the advance and retreat cycling will continue as long as the glacier continues to calve.
Calving glaciers advance by moving their terminal moraines down the fjords in which they calve. In all known cases, advancing calving glaciers end on terminal moraine shoals that nearly fill the fjord at the calving front (Reference Brown, Meier and PostBrown and others, 1982). The rate of advance is rarely more than a few tens of meters per year. In general, calving glaciers advance until the losses due to melting approach the mass flux out of the accumulation area and calving losses cannot be replaced. In terms of the accumulation–area ratio (AAR), calving glaciers reach mass flux equilibrium when the AAR approaches an empirical value of about 0.7 (Reference Post and MotykaPost and Motyka, 1995). The AAR of Columbia Glacier was 0.66 when it began its irreversible retreat (Reference Trabant, Krimmel and PostTrabant and others, 1991).
Calving glaciers retreat when, for any reason, the calving face retreats into the deeper water behind its terminal moraine shoal. Because calving speed increases rapidly with water depth, the increasing calving flux soon exceeds the mass flux out of the accumulation area, and an irreversible retreat begins. The rate of retreat often approaches 100ma−1. Hubbard Glacier retreated at an average rate of 80ma−1 between 1130 and 1891.
Recent Behavior of Hubbard Glacier
Hubbard Glacier, with an AAR of approximately 0.95, is in the strong, early part of the advancing phase of the calving glacier cycle. Soon, Hubbard Glacier will advance entirely across the seaward entrance to Russell Fjord (Fig. 1), probably turning it into a glacier-dammed lake. Russell Lake will fill with fresh water from the many streams in the hydrologic basin until the lake overflows the low divide (about 40m a.s.l.) at the southeastern end of the basin. Russell Lake will then be a feature in Alaska’s geography until it is released during the next retreat cycle of Hubbard Glacier.
A harbinger dam was formed during 1986 (Fig. 2). Abundant sediments and shoaling near the entrance to Russell Fjord almost eliminated calving along a small part of the calving face, and increased ice speeds from a pulse in the flow of Hubbard Glacier combined to allow a small part of the terminus to advance rapidly and form a temporary ice and push-moraine dam. (Two episodes of flow instability in Hubbard Glacier (1986 and 1989) have been documented by Reference Trabant, Krimmel and PostTrabant and others (1991).) After the entrance was blocked, runoff from the hydrologic basin raised the water level in Russell Lake to 25.5 m a.s.l. (Reference Seitz, Thomas and TomlinsonSeitz and others, 1986) before the dam failed in October 1986 (Reference MayoMayo,1989).
Terminus locations of Hubbard Glacier since 1895. The flow-parallel line is the ground-track of the airborne laser profile. The circle is the “fixed location” used for interpolating glacier surface speed, and the ray attached to the circle was used to define the “near-terminus” ice speeds in Figure 5.
DuringJune 2002, Hubbard Glacier again pushed glacial– marine sediments into the entrance to Russell Fjord until they rose above sea level and blocked the entrance. A squeeze–push moraine, which emerged between the advancing glacier ice and bedrock, effectively blocked the entrance during late June. Thewaterlevel in the cut-off fjord rose at an average rate of 0.2 md−1 and was controlled by the rising moraine dam. Water continued to overflow the moraine until near the end of July 2002. A maximum level of 18.6ma.s.l. was attained during 14 August. This followed a 30 hour,140 mm rainstorm which caused an unusually rapid rise of lake level and increased the volume of water overflowing and eroding the moraine. An outburst flood commenced which reached a maximum discharge of about54000m3 s−1 at about midnight of 14 August. By the afternoon of 15 August the moraine dam had been completely removed, the lake emptied, and tidal exchange had resumed in Russell Fjord.
Ice-Thickness Changes
The positive glacier-wide mass balance of Hubbard Glacier is directly measurable as changes in the overall surface altitude (thickness). These changes were measured using an airborne laser altimeter system that has been described by Reference EchelmeyerEchelmeyer and others (1996). The resulting surface profiles have data points every 1.5 m along the flight path, and a vertical accuracy of about 0.3 m. Several profiles were flown on 2 May 2000, and the main profile was remeasured on 6 June 2001 (Fig. 1). The year 2000 profiles extended from the terminus to near the head of the glacier at an altitude of about 2600 m. These data were compared to topographic maps compiled from 1959 aerial photography in the U.S.A. and 1976 photography in Canada (Fig. 3). (Note: the 1959 U.S. Geological Survey (USGS) maps are unpublished, but they were found to be more accurate than the published maps that were compiled from 1961 photography.) The U.S.–Canadian border is at about 1300 m altitude on Hubbard Glacier (Fig. 1). It is believed that most of the errors in the derived thickness changes are related to vertical errors on the maps. Above 2560m altitude, thickness changes were extrapolated by assuming a constant value of –12.3 m (the average measured altitude change at 2560m altitude) up to an altitude of 2990 m. Above 2990 m, the altitude change was linearly extrapolated to zero at 3500 m and then held constant at zero to the top of the basin at 4600 m. Extrapolation from the profile data to a glacier volume change followed methods described by Reference EchelmeyerEchelmeyer and others (1996) and Reference Arendt, Echelmeyer, Harrison, Lingle and ValentineArendt and others (2002). The glacier volume change between 1959 and 2000 (with the necessary extrapolation of the 1976–2000 altitude changes from the Canadian map comparisons) was positive, with a total volume increase of 14.1km3 at an average rate of 0.3 km3 a−1. This corresponds to a glacier-wide average rate of thickening of about 0.1m a−1 during the 41year period. The measured distribution of thickness change above sea level was somewhat irregular, ranging from a thickening of 120 m (2.9 ma−1) near the terminus to a thinning of 27 m (0.7 m a−1) at about 2560 m altitude (Fig. 3). Most of the positive volume change occurred in the lower accumulation area between 1200 and 1800m altitude. The second largest area of growth was below 300m altitude in the terminal lobe. About one-seventh of the total volume increase is the growing ice volume stored below sea level as the terminus slowly advances. The subaqueous volume change has no net effect on sea level. An area of volume loss occurred between 2200 and 2600 m altitude. This pattern of thickness change is different from that measured on other glaciers in the region, where the norm is strong thinning at low altitudes and zero to slightly positive changes at higher altitudes (Reference Arendt, Echelmeyer, Harrison, Lingle and ValentineArendt and others, 2002).
Change in surface altitude, 1959–2000, vs 1959 glacier surface altitude. The changes were determined along the airborne laser-altimetry profiles shown in Figure 1. Data were extrapolated above 2560 m as described in the text.

Comparing the 2000 and 2001 laser profiles for Hubbard Glacier reveals that thickening of the glacier is continuing at a rate of 0.8 ma−1, about eight times faster than the average rate for the 41 year period. The areas of thickening and thinning were similar to those determined for the 41 year period, except that the area in which the largest volume increase occurred, in the lower part of the accumulation area, extended higher on the glacier, to about 1900 m altitude. This increased thickening corresponds to a generally less negative balance year observed in this region in 2000/ 01 (K. A. Echelmeyer, unpublished data).
A more complete sequence of glacier surface altitudes along the terminal lobe below about 250 m a.s.l. was determined from five sets of aerial photographs spanning the years 1948–99 (Fig. 4). The altitudes were determined photogrammetrically along the same track as the lower part of the airborne laser altimetry, and limited data from the contours on the unpublished 1959 map are included. The data (Fig. 4) show that the average thickening rates on the lower 6 km of the terminal lobe have decreased somewhat with time: from values of +2.7ma−1 between 1948 and 1959 to +2.1ma−1 between 1948 and 1978, +1.4ma−1 between 1959 and 1978, +1.7ma−1 between 1978 and 1988, and +1.4ma−1 between 1988 and 1999. The errors in the photogrammetric altitude profile determinations are about ±5 m. The profiles (Fig. 4) show that thickening increases toward the terminus, and that a substantial part of the volume increase in the ablation area is due to advance of the terminus.
Longitudinal profiles of the terminal lobe of Hubbard Glacier. The 2000 profile is from the airborne laser profiling system. The 1959 profile is taken from the published USGS Mount Saint Elias 1:250 000-scale quadrangle. The others were photogrammetrically determined from aerial photography along the 2000 profile line. Some data are not shown for clarity. The errors in the data prior to 2000 are about ±5 m.

Ice Speed
Ice speeds on the lower 12 km of Hubbard Glacier were photogrammetrically measured on 20 pairs of aerial photographs and 2 pairs of satellite images using analytical methods described by Reference KrimmelKrimmel (2001). The technique relies on repeated identification of seracs and crevasse patterns.
Because serac and crevasse patterns are targets of opportunity, there are rarely repeated measurements at any specific location on the glacier. For comparison purposes, 16 glacier surface speeds were interpolated to a fixed horizontal location (Fig. 2) about 3 km above the 1997 terminus near the center of the glacier. A second set of 11 speeds was interpolated as close to the calving face as possible along a flowline down-glacier from the fixed location (Fig. 2). This latter set of velocities corresponds to a moving location that follows the advancing terminus instead of a fixed location in space (the former set), where the ice is becoming thicker with time. Usually the maximum surface speeds on the terminal lobe occur close to the calving face near this flow-line. Errors in speed determinations arise from the photogrammetric modelling process as well as from the repeated identification of targets that change with time. Vector endpoints are assumed to have relative absolute errors no larger than ±20 m. For periods that averaged 39 days, the error in speed determinations is estimated to be ±0.6 m d−1.
Ice-surface speeds of the terminal lobe vary seasonally by as much as 2 md−1. Seasonal speed variations were evaluated by calculating the average speed over a 365 day period by superposing all the measured speeds. The annual speed maximum is about 8.1md−1 and occurs in May and June; the minimum is about 6.7 md−1 and occurs between September and November. Seasonal variability was removed from the speed data at the fixed location by selecting the speeds derived from the same season (winters) with periods of 9 months or longer (Fig. 5). The reduced dataset is limited, but appears to suggest a linear deceleration between 1978 and 1997 from 7.7 md−1 to 6.0 md−1. Part of this deceleration is due to decreasing surface strain at the fixed location, as the glacier increases in thickness at this location and the distance from the calving face increases with time. No correction for the influence of strain is possible because surface strain rates cannot be analyzed from the dataset.
Ice-surface speeds on Hubbard Glacier. The “fixed location” is about 3 km up-glacier from the 1997 terminus near the center of the glacier (Fig. 2). The linear rate of deceleration at the fixed location is about 0.08 m d−1 a−1, and is affected by the changing strain as the distance to the calving face increases. The 11 “near-terminus” speeds were interpolated as close to the calving face as possible, along a flowline down-glacier from the fixed location (Fig. 2). The rate of deceleration of the near-terminus speeds is about 0.05 m d−1 a−1.
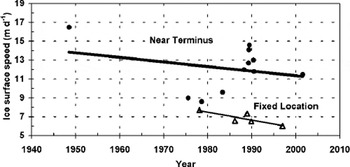
The 11 surface ice speeds near the calving face also show a deceleration (about 0.05m d−1a−1; Fig. 5). These are free from systematic changes of the surface strain rate, but no attempt was made to remove the influence of seasonal speed changes from the data, hence the larger scatter. The most recently measured speed near the terminus was 11.5 m d− 1 during July and August 2001.
Both sets of speed data show somewhat similar rates of deceleration, with the larger rate determined at the fixed location, where surface strain rates decrease as the distance from the calving front increases. The aerial-photographand satellite-image pairs analyzed for the two datasets are mutually exclusive and therefore independent.
Terminus Advance
The slow, persistent advance of Hubbard Glacier (Figs 6 and 7) has been documented since 1895 by optical surveys, aerial photography and satellite images. The complex shape of the terminus was reduced to a pair of glacier-length values (Figs 6 and 7) by averaging across the widths of the calving faces in Disenchantment Bay and Russell Fjord using the method described inReference Trabant, Krimmel and PostTrabant and others (1991).
Width-averaged advance of the termini of Hubbard Glacier since 1895 with linear trends for the period since 1948. The advance rate prior to 1948 was about 16 m a–1The linear trends of terminus advance in Disenchantment Bay and Russell Fjord between 1948 and 2001 are about 32 and 31m a−1, respectively.

Advance of Hubbard Glacier since the 1986 dam failed. The linear trend of advance for the 15 year period has decelerated to 28 m a−1 in Disenchantment Bay, but changed little for the terminus in Russell Fjord (34 m a−1). The advance will close the entrance to Russell Fjord when the glacier length 123 km in the fjord closure reach. The linear trend of advance across the entrance to Russell Fjord since 1986 about 6 m a−1.

A strong seasonal cycle of advance and retreat, and occasional flow instabilities, scatter the spatially averaged lengths (Figs 6 and 7). The seasonal advance (winter to spring) and retreat (summer to fall) can be as large as 100m (Reference Trabant, Krimmel and PostTrabant and others, 1991). The effects of the 1986 and 1989 pulses of Hubbard Glacier are not evident in this dataset.
The advance of Hubbard Glacier is most accurately represented by the linear trends for long periods because short-period averages are adversely influenced by seasonal and pulse-related changes. The 106 year trends for the termini in Disenchantment Bay and Russell Fjord are similar, at about 24 and 23 m a−1, respectively. Arbitrarily breaking the set at 1948 reveals acceleration (Fig. 6), from about 16 m a−1 for both termini prior to 1948, to about 32 and 31m a−1, respectively, after 1948. The 1895–1948 advance was slower because an advance into an increasingly deep fjord requires a large increase in the volume of the terminal moraine to maintain shallow water at the calving face. Since the failure of the temporary dam in 1986, the trend of the advance in Disenchantment Bay has decelerated to a rate of about 28 m a−1 (Fig. 7), while the terminus in Russell Fjord continues to advance at a rate of about 34 m a−1. The trend for the advance across the narrow gap at the entrance to Russell Fjord is about 6 m a−1. Since the failure of the 1986 dam, the terminus in Disenchantment Bay has advanced 560 m, the terminus in Russell Fjord has advanced 400 m, and the entrance to Russell Fjord has decreased in width by 130m. On11 August 2001, the length of Hubbard Glacier at the entrance to Russell Fjord was 122.65 km; the entrance to the fjord will be closed when this length is 123 km.
Bathymetry
Bathymetric data from 1978and 1999 U.S. National Oceanic and Atmospheric Administration surveys (NOAA, 1978, 1999) were used to evaluate the advance of the submarine terminal moraine in Disenchantment Bay (Fig. 8). Moraine motion was determined by averaging the displacement of a 2.1 kmwidth of the seaward face of moraine between 120 and 170 m depths. The average rate of advance was 32 ma−1.This rate is equal to the 1948–2001 linear trend determined for the calving face.
Bathymetric profiles, 1978 and 1999, on the seaward side of the terminal moraine of Hubbard Glacier. The location of the profiles is shown in Figure 2.

In Russell Fjord, the calving terminus has been advancing up the stoss slope ofa submerged terminal moraine that was identified by Reference Reeburgh, Muench and CooneyReeburgh and others (1976). It reached the crest of the moraine during 2001. Therefore, bathymetric analysis of the motion of the moving terminal moraine was not possible. However, the bathymetric data suggest that shoaling near the calving face may have included “bulldozing” of unconsolidated material by the advancing ice. The crest of the old moraine is everywhere <35 m below sea level; the shallowest part is 10 m below sea level.
From 1978 to 2000, the terminus in Disenchantment Bay advanced into areas that had water depths of 150–195 m in 1988. Near the seaward entrance to Russell Fjord, it advanced from a water depth of 30 m into an area that had been 23 m deep in 1988. The terminus in Russell Fjord advanced from 60–80m water depths onto the crest of a submerged moraine that is 535 m below sea level.
Climate Sensitivity
Hubbard Glacier is not currently sensitive to moderate climate change. Loss of most of its ablation area during 1000 years of retreat prior to the beginning of the current advance left the glacier with an AAR of 0.95. With 95% of its surface area in the accumulation zone, the glacier is far from equilibrium with climate, on the positive mass-balance side. Reference Trabant, Krimmel and PostTrabant and others (1991) showed that raising the equilibrium-line altitude (ELA) by 200 m above the current 1000 m ELA changesthe AAR to 0.91. The ELA would have to be raised 1000 m in altitude before Hubbard Glacier’s AAR is reduced to 0.7, where it might begin to be sensitive to climate. It is thus unlikely that global change will have an appreciable influence on the glacier for some time. Furthermore, because Hubbard Glacier is not presently sensitive to climate, the ongoing advance is not representative of how most glaciers are responding to current trends in climate.
Discussion
The thickening, lateral expansion, and advance of Hubbard Glacier is driven by a positive mass balance and controlled by the rate at which the terminal moraine is moved forward. An estimated 1% of the mass flux out of the accumulation area goes into storage as the terminal lobe grows, about 4% is melted, and 95% is lost by calving (Reference Trabant, Krimmel and PostTrabant and others, 1991). The growth of Hubbard Glacier is in sharp contrast with the other glaciers in the area, which have extensive ablation areas, where the ongoing thinning is climate-driven (Reference Arendt, Echelmeyer, Harrison, Lingle and ValentineArendt and others, 2002).
The recent advance rate of the terminus into Disenchantment Bay is slower than that into Russell Fjord because Disenchantment Bay is as much as seven times as deep as Russell Fjord (200 m vs 30 m). The decelerating advance into Disenchantment Bay during the last 15 years is related to both increasing water depth in the fjord and a gradual reduction in the calving flux. The calving flux gradually decreases as the glacier advances and more ice goes into storage and melts.
The advance in the narrow gap at the entrance to Russell Fjord is the slowest measured along the calving face, in spite of the relatively shallow water. This is probably because extreme tidal currents increase the rate of melt and erosion of ice along the narrow passage. The continuing advances in Disenchantment Bay and Russell Fjord effectively increase the length of the tidal channel connecting Russell Fjord with Disenchantment Bay (Fig. 2), which gradually reduces the energy gradient of the flow through the passage. This may decrease the effects of melting and erosion along the increasing length of the ice face, effectively reducing the current-induced calving. At some time, the increasing channel length may sufficiently reduce these erosional mechanisms, and a closure of Russell Fjord will occur. The closure in 2002 was similar to the 1986 closure in that glacial-marine sediments were pushed and squeezed until they rose above sea level, forming a dam between the ice and bedrock. A consequence of rising water levels in Russell Lake is the possibility of increased calving and retreat of the terminus in Russell Lake.
Hubbard Glacier is representative of a small number of calving glaciers in Alaska that are in the advancing phase of the calving glacier cycle. Like Hubbard, these glaciers are not sensitive to the ongoing climate changes. In a similar manner, calving glaciers that are in the retreat phase of the calving glacier cycle are not very sensitive to climate. Calving glaciers become sensitive to climate only when the losses due to melting approach an equilibrium with the mass flux out of the accumulation area. That is, sensitivity to climate and loss of an ability to replace calving losses usher in the beginning of the retreat phase.


